Structural variation targets neurodevelopmental genes and identifies SHANK2 as a tumor suppressor in neuroblastoma - bioRxiv
←
→
Page content transcription
If your browser does not render page correctly, please read the page content below

bioRxiv preprint first posted online Mar. 9, 2019; doi: http://dx.doi.org/10.1101/572248. The copyright holder for this preprint (which
       was not peer-reviewed) is the author/funder, who has granted bioRxiv a license to display the preprint in perpetuity.
                                      All rights reserved. No reuse allowed without permission.

Structural Variation in Neuroblastoma                                                                                  Lopez, Conkrite, et al.

       Structural variation targets neurodevelopmental genes and identifies SHANK2 as a tumor

                                                    suppressor in neuroblastoma

 Gonzalo Lopez1,2+, Karina L. Conkrite1,2+, Miriam Doepner1,2, Komal S. Rathi3, Apexa Modi1,2,10, Zalman

    Vaksman1-3, Lance M. Farra1,2, Eric Hyson1,2, Moataz Noureddine1,2, Jun S. Wei4, Malcolm A. Smith9,
                                                                                    4
    Shahab Asgharzadeh5,6, Robert C. Seeger5,6, Javed Khan , Jaime Guidry Auvil8, Daniela S. Gerhard8,

                                           John M. Maris1-2,10,11, Sharon J. Diskin1-3,10,11*

1
    Division of Oncology, Children’s Hospital of Philadelphia, Philadelphia, PA, USA.
2
    Center for Childhood Cancer Research, Children’s Hospital of Philadelphia, Philadelphia, PA, USA.
3
    Department of Biomedical and Health Informatics, Children’s Hospital of Philadelphia, Philadelphia, PA,
      USA.
4
 Oncogenomics Section, Genetics Branch, Center for Cancer Research, National Cancer Institute,
Bethesda, MD, USA
5
    Division of Hematology, Oncology and Blood and Marrow Transplantation, Keck School of Medicine of
       the University of Southern California, Los Angeles, CA, USA.
6
    The Saban Research Institute, Children’s Hospital of Los Angeles, Los Angeles, CA, USA.
7
    Department of Pediatrics, Perelman School of Medicine, University of Pennsylvania, Philadelphia, PA,
      USA.
8
    Office of Cancer Genomics, National Cancer Institute, Bethesda, MD, USA.
9
    Cancer Therapy Evaluation Program, National Cancer Institute, Bethesda, MD, USA.
10
     Genomics and Computational Biology, Biomedical Graduate Studies, Perelman School of
      Medicine, University of Pennsylvania, Philadelphia, PA, USA.
11
     Abramson Family Cancer Research Institute, Perelman School of Medicine at the University of
      Pennsylvania, Philadelphia, PA, USA.
+
  Equal contribution.
* Corresponding Author: Sharon J. Diskin, Ph.D. (diskin@email.chop.edu)

                                                                   Page 1 of 39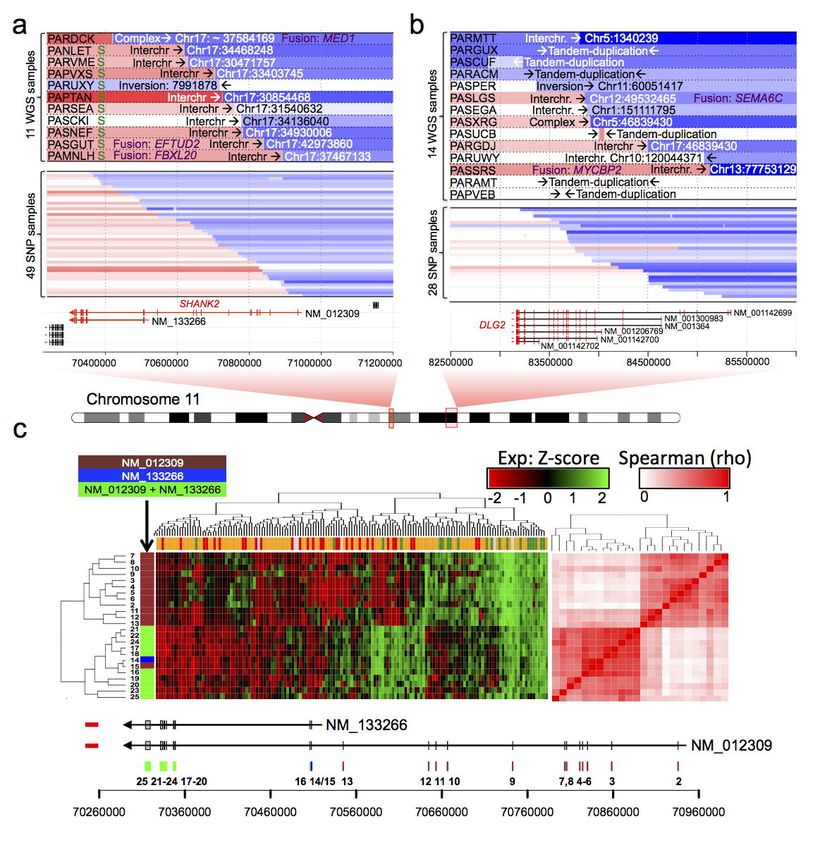
bioRxiv preprint first posted online Mar. 9, 2019; doi: http://dx.doi.org/10.1101/572248. The copyright holder for this preprint (which
       was not peer-reviewed) is the author/funder, who has granted bioRxiv a license to display the preprint in perpetuity.
                                      All rights reserved. No reuse allowed without permission.

Structural Variation in Neuroblastoma                                                                                  Lopez, Conkrite, et al.

Abstract

Neuroblastoma, like many childhood cancers, exhibits a relative paucity of somatic single nucleotide

variants (SNVs). Here, we assess the contribution of structural variation (SV) in neuroblastoma using a

combination of whole genome sequencing (WGS; n=135) and single nucleotide polymorphism (SNP)

genotyping (n=914) of matched tumor-normal pairs. Our study design provided means for orthogonal

validation of SVs as well as validation across genomic platforms. SV frequency, type, and localization

varied significantly among high-risk tumors, with MYCN non-amplified tumors harboring an increased

SV burden overall (P=1.12x10⁻⁵). Genes disrupted by SV breakpoints were enriched in neuronal

lineages and autism spectrum disorder. The postsynaptic adapter protein-coding gene SHANK2,

located on chromosome 11q13, was disrupted by SVs in 14% and 10% of MYCN non-amplified high-

risk tumors based on WGS and SNP array cohorts, respectively. Forced expression of SHANK2 in

neuroblastoma cell models resulted in significant growth inhibition (P=2.62x10⁻² to 3.4x10⁻⁵) and

accelerated neuronal differentiation following treatment with all-trans retinoic acid (P=3.08x10⁻¹³ to

2.38x10⁻³⁰). These data further define the complex landscape of structural variation in neuroblastoma

and suggest that events leading to deregulation of neurodevelopmental processes, such as inactivation

of SHANK2, are key mediators of tumorigenesis.

                                                                   Page 2 of 39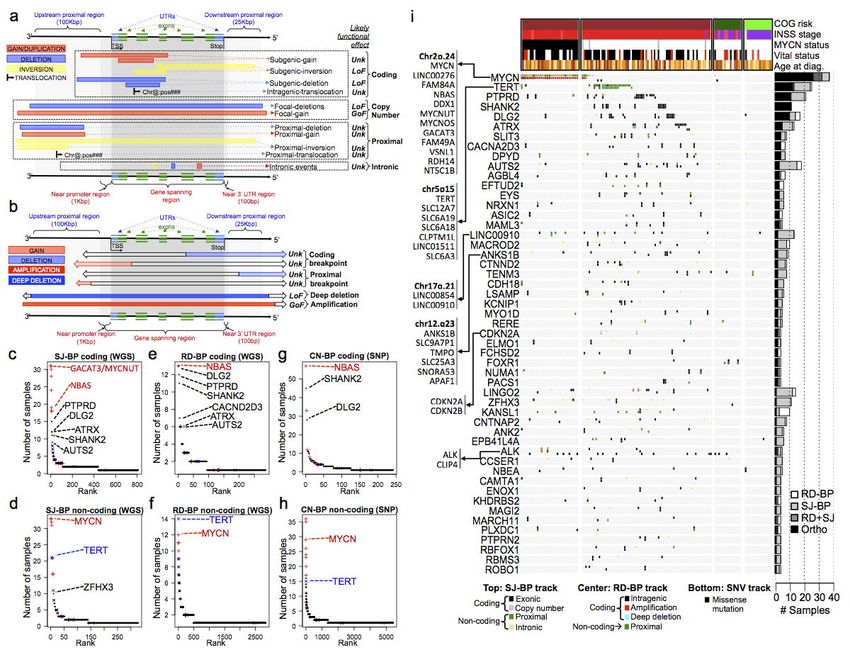
bioRxiv preprint first posted online Mar. 9, 2019; doi: http://dx.doi.org/10.1101/572248. The copyright holder for this preprint (which
       was not peer-reviewed) is the author/funder, who has granted bioRxiv a license to display the preprint in perpetuity.
                                      All rights reserved. No reuse allowed without permission.

Structural Variation in Neuroblastoma                                                                                  Lopez, Conkrite, et al.

Neuroblastoma is a cancer of the developing sympathetic nervous system that most commonly affects

children under 5 years of age, with a median age at diagnosis of 17 months1. Approximately 50% of

cases present with disseminated disease at the time of diagnosis, and despite intense multi-modal

therapy, the survival rate for this high-risk subset remains less than 50%1. Recent whole genome and

exome sequencing studies of neuroblastoma have revealed relatively few recurrent protein-coding

somatic mutations including single nucleotide variations (SNVs) and small (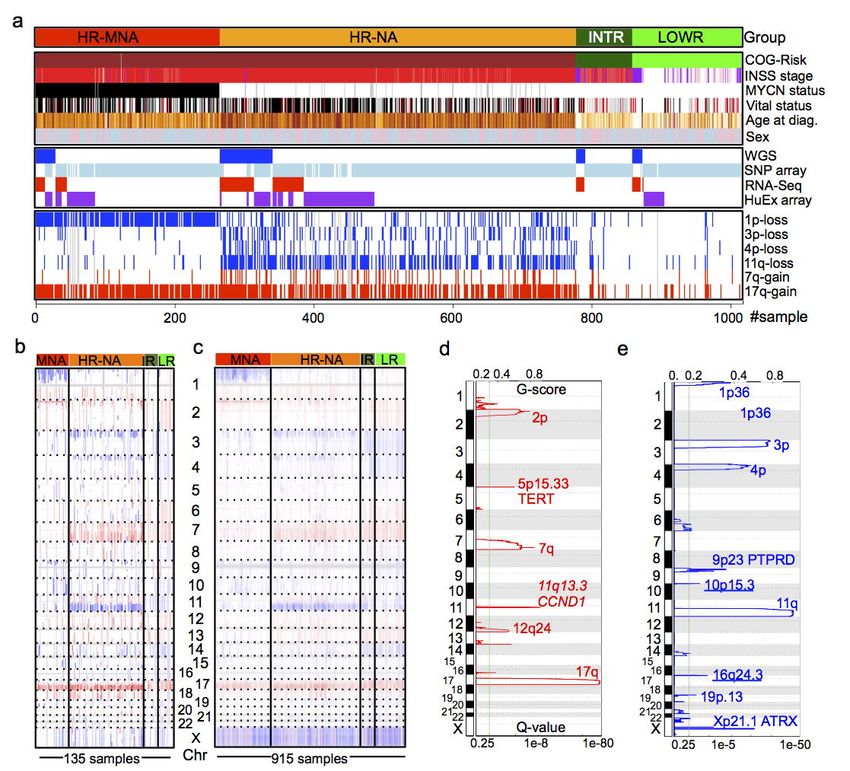
bioRxiv preprint first posted online Mar. 9, 2019; doi: http://dx.doi.org/10.1101/572248. The copyright holder for this preprint (which
       was not peer-reviewed) is the author/funder, who has granted bioRxiv a license to display the preprint in perpetuity.
                                      All rights reserved. No reuse allowed without permission.

Structural Variation in Neuroblastoma                                                                                  Lopez, Conkrite, et al.

           Second, NGS technologies have profoundly expanded our understanding of the impact of SVs

in cancer7. DNA sequencing methods focus on discordantly aligned reads and read-pairs to the

reference genome. As such, alignment based approaches do not rely on dosage quantification and

cannot quantify numerical changes of deletions and tandem-duplications; however, they provide

information about inversions, translocations and transposable elements, which are elusive for CNV

callers. In addition, alignment based approaches offer single base pair resolution and genome-wide

coverage in the case of WGS. Recent studies using alignment based detection of SVs from WGS

profiles from primary neuroblastomas revealed structural rearrangements as key oncogenic drivers

mediating focal enhancer amplification or enhancer hijacking, influencing telomere maintenance

through activation of telomerase reverse transcriptase gene (TERT)24,27,28 or by deregulating the MYC

oncogene29. Despite the demonstrated importance of somatic CNVs and other SVs in neuroblastoma,

studies systematically integrating CNV analysis and alignment based approaches are lacking; hence

the global landscape and mechanisms of pathogenicity of many of these events remain poorly

understood.

           Here, we studied the role of somatic SVs in the largest available dataset to date, including 997

distinct primary neuroblastoma tumors and integrating whole genome sequencing (WGS) from 135

tumor-normal pairs and 914 single nucleotide polymorphism (SNP) arrays obtained at diagnosis. We

considered alternative approaches for SV detection from both datasets, which overlap in a subset of 52

cases. As such, our study provides orthogonal as well as cross-platform validation of SV breakpoints.

Furthermore, we explored the functional impact of SVs by integrating overlapping transcriptomic

profiles and gene fusions from 153 RNA-sequencing samples and expression data from 247

HumanExon arrays in a combined subset of 361 tumor samples. Finally, in vitro studies demonstrated

the functional relevance SHANK2, a newly identified tumor suppressor gene disrupted by SVs.

Altogether, our dissection of multi-omic datasets together with patient clinical profiles and biological

experimentation, expands the genomic landscape of neuroblastoma.

                                                                   Page 4 of 39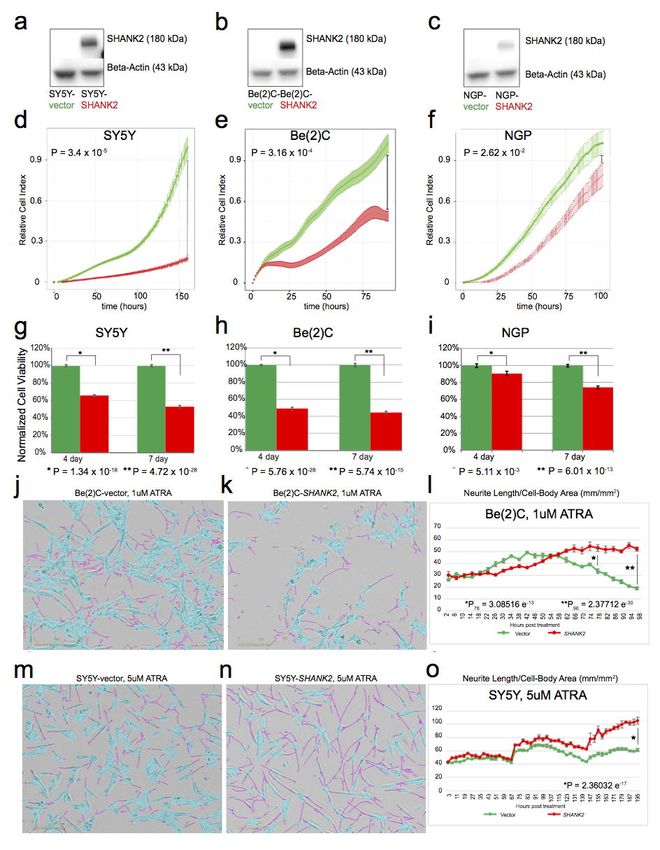
bioRxiv preprint first posted online Mar. 9, 2019; doi: http://dx.doi.org/10.1101/572248. The copyright holder for this preprint (which
       was not peer-reviewed) is the author/funder, who has granted bioRxiv a license to display the preprint in perpetuity.
                                      All rights reserved. No reuse allowed without permission.

Structural Variation in Neuroblastoma                                                                                  Lopez, Conkrite, et al.

Results

Patient characteristics and multi-omic datasets for the study of structural variations. To establish

the landscape of SVs in neuroblastoma, we first sequenced the genomes of 135 primary diagnostic

tumors and matched normal (blood leukocyte) DNA pairs through the Therapeutically Applicable

Research                 to           Generate                Effective             Treatments                 (TARGET)                   initiative

(https://ocg.cancer.gov/programs/target). Samples were obtained through the Children’s Oncology

Group (COG) and included 106 patients with high-risk tumors (29 MYCN-amplified and 77 non-MYCN-

amplified), 14 with intermediate-risk tumors and 15 with low-risk tumors (Fig. 1a, Supplementary

Tables 1 and 2). Whole genome sequencing (WGS) was performed by Complete Genomics30 to a

median average depth of 76x (Supplementary Fig. 1a) and primary data was processed via the

Complete Genomics pipeline version 2.0. This pipeline reports small somatic variants (SNVs, small

indels, and substitutions)31, larger SVs, and read-depth coverage across the genome used to infer copy

number segmentation profiles (Online methods).

           To augment the WGS data, and to provide independent replication, we genotyped and analyzed

914 patient tumor samples using Illumina SNP platforms (Fig. 1a, Supplementary Tables 1 and 2).

This cohort comprised 696 high-risk (239 MYCN-amplified and 457 non-MYCN-amplified), 70

intermediate-risk and 145 low-risk tumors (Fig. 1a, Supplementary Tables 1 and 2); 488 of these

samples were previously released32 and reanalyzed here. Copy number segmentation was obtained

using the SNPrank algorithm implemented by the NEXUS® software platform (Online Methods).

           To further assess the functional impact of SVs, we integrated additional data types generated

through the TARGET initiative, we obtained transcriptional profiles from RNA sequencing (N=153) and

Affymetrix HumanExon arrays (HuEx, N=247). In addition, the RNA-seq dataset was studied with three

available gene fusion pipelines (STAR-fusion33, fusionCATCHER34 and DeFUSE35).

           Patient clinical covariates were organized by the Children’s Oncology Group (COG) (Fig. 1a,

Supplementary Table 1 and 2; https://ocg.cancer.gov/programs/target/data-matrix; phs000218.v4.p1).

                                                                   Page 5 of 39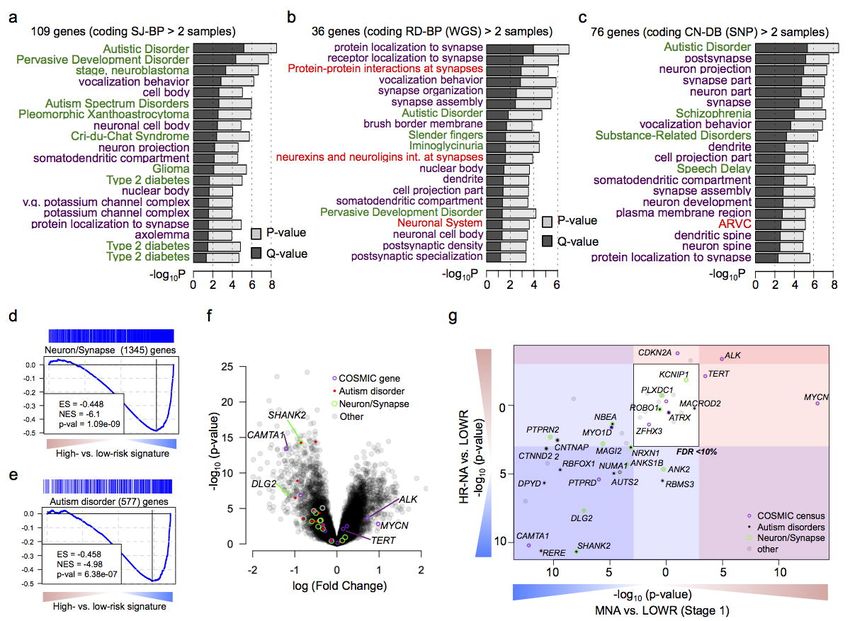
bioRxiv preprint first posted online Mar. 9, 2019; doi: http://dx.doi.org/10.1101/572248. The copyright holder for this preprint (which
       was not peer-reviewed) is the author/funder, who has granted bioRxiv a license to display the preprint in perpetuity.
                                      All rights reserved. No reuse allowed without permission.

Structural Variation in Neuroblastoma                                                                                  Lopez, Conkrite, et al.

Along this study, we examined disease risk groups as defined by the COG and the International

Neuroblastoma Risk Group (INRG)36. Specifically, the following subtypes were considered: LOWR: low-

risk neuroblastomas; INTR: including those with intermediate-risk disease; MNA: high-risk

neuroblastomas with amplification of the MYCN oncogene, and HR-NA: high-risk neuroblastomas

without MYCN amplification.

Identification of novel regions of recurrent DNA copy number gain and loss. WGS-derived copy

number profiles were compared with those obtained from the larger SNP array dataset. SCNAs were

visualized with Integrative Genome Viewer (IGV) and confirmed well-established patterns of large

SCNAs in neuroblastoma that differed between the tumor clinical subtypes (Fig. 1b, c)11,37. We further

analyzed CNV segmentation profiles within neuroblastoma subtypes using GISTIC2.038. As expected,

LOWR and INTR tumors harbored few focal or large SCNAs, although aneuploidy was observed (Fig.

1b, Supplementary Fig. 2a, b). Consistent with clinical records and previous reports, the MNA and

HR-NA subsets shared highly frequent 17q gains and PTPRD deletions (9p23) and differ in 2p24

(MYCN locus) and prevalence in deletions of 1p, 3p, 4p and 11q (Fig. 1d, e, Supplementary Fig. 2c-

e). We also observed less frequently reported variants in HR-NA group, including deletions at 16q24.339

and segmental gains of the q-arm of chromosome 7, a region recently suggested to exhibit oncogenic

potential in neuroblastoma40 (Fig. 1d, Supplementary Fig. 2e).

           CNV profiles derived from WGS are deemed to have higher resolution and returned peaks not

found in SNP arrays. These SCNAs involved, focal gains at chromosome 5p15.33 (Q-value=1.42 x 10-
3
    ) harboring the telomerase reverse transcriptase (TERT) gene) (Fig. 1d), intragenic deletions of the

ATRX chromatin remodeler gene at Xq21.1, (Q-value=3.76 x 10⁻³). Moreover, we observed a novel

region of recurrent deletions at 10p15.3 (Q-value=6.16 x 10⁻², Fig. 1e).

Orthogonal detection to SV identification: sequence junction, read-depth and copy number

breakpoint analyses. To strengthen our findings, we considered three approaches to SV identification

                                                                   Page 6 of 39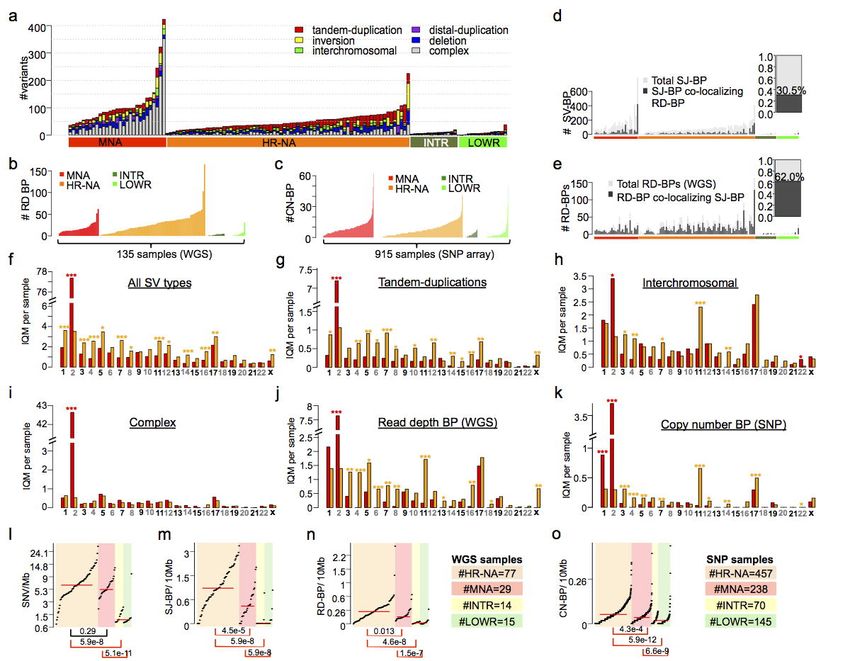
bioRxiv preprint first posted online Mar. 9, 2019; doi: http://dx.doi.org/10.1101/572248. The copyright holder for this preprint (which
       was not peer-reviewed) is the author/funder, who has granted bioRxiv a license to display the preprint in perpetuity.
                                      All rights reserved. No reuse allowed without permission.

Structural Variation in Neuroblastoma                                                                                  Lopez, Conkrite, et al.

(Table 1). We integrated alignment-based SV calls and read-depth CNVs from WGS as well as

intensity-based CNV calls from genotyping arrays (Table 1, Online Methods), and subsequently

assessed to extent to which SV breakpoints overlapped between alternative methods and across WGS

and SNP datasets. First, we obtained alignment-based SVs reported by CGI somatic pipeline, which

provides information about SV boundaries, size and the type of variant in every sample; including

deletions (>500b), tandem-duplications (>40b), inversions (>30b), translocations, inversions and

complex events (Supplementary Fig. 1c-e). We applied additional filters by removing likely artifacts

including duplicate junctions across samples and common germline variants found in the database of

genomic variants (Online Methods)41. This resulted in a total of 7,366 (Supplementary Table 3); SV

calls distributed heterogeneously across neuroblastoma subtypes (Fig. 2a). These SVs were defined

by sequence junctions delimited by two breakpoints in the genome, which will be referred to as

sequence junction breakpoints (SJ-BP). We next mapped copy number dosage breakpoints derived

from WGS read-depth segmentation profiles, hereafter referred as read-depth breakpoint (RD-BP,

Online Methods). A total of 2836 RD-BPs were identified (µ=21) unevenly distributed across samples

(Fig. 2b). Finally, analogous to the RD-BPs, we mapped copy number breakpoints from segmentation

profiles derived from the larger SNP cohort, referred to as copy number breakpoints (CN-BP, Online

Methods); a total of 6,241 CN-BPs were identified across 914 samples (µ=6.8); As expected from

previous reports11,42, we observed increased number of events in high-risk compared to intermediate

and low-risk tumors when studied as SJ-BPs (Fig. 2a), RD-BPs (Fig. 2b) and CN-BP (Fig. 2c).

           We further studied the co-localization of breakpoints derived from alternative measurements.

First, we compared SJ-BPs and RD-BPs in each of the 135 WGS samples; overall, 30.5% of SJ-BPs

co-localize with a RD-BPs (Fig. 2d) whereas 62% RD-BPs matched with SJ-BPs (Fig. 2e). The lower

overlap in SJ-BPs is expected since not all SVs necessarily involve a change in copy number dosage

(i.e. inversions and translocations). We next evaluated the co-localization of breakpoints across WGS

and SNP platforms within the subset of 52 overlapping samples. 50.2% of CN-BPs from SNP arrays co-

localized with SJ-BPs from the WGS dataset (Supplementary Fig.3a) whereas only 8.2% of SJ-BPs

                                                                   Page 7 of 39
bioRxiv preprint first posted online Mar. 9, 2019; doi: http://dx.doi.org/10.1101/572248. The copyright holder for this preprint (which
was not peer-reviewed) is the author/funder, who has granted bioRxiv a license to display the preprint in perpetuity.
All rights reserved. No reuse allowed without permission.
Structural Variation in Neuroblastoma Lopez, Conkrite, et al.
co-localize with CN-BPs (Supplementary Fig. 3b). Furthermore, when comparing dosage based
breakpoints across platforms (RD-BP and CN-BP), 23.6% RD-BPs where found co-localizing CN-BP
(Supplementary Fig. 3c) whereas 66.6% CN-BP co-localized with RD-BPs (Supplementary Fig. 3d).
Overall, SNP arrays display reduced the number of breakpoints compared read-depth based profiles;
we attribute these differences to a narrower dynamic range and lower probe density of the platform.
Finally, we performed a randomized test by sample shuffling (Ni=1000) in order to evaluate
whether each of the co-localization percentages listed above could arise by chance or due to
recurrence of structural variants across samples. All randomized percentage distributions range
between 0.7% and 2.3%; in all cases the null hypothesis was discarded (p-value < 0.001,
Supplementary Fig. 3e-j). Taken together, alternative breakpoint detection methods returned
consistent results even when derived from different platforms providing means for both orthogonal and
cross-platform validation of SVs. However, certain types of SVs can only be detected using alignment-
based methods.
Patterns of SV and SNV mutational burden differ across neuroblastoma subtypes. High-risk
tumors (MNA and HR-NA) presented considerably higher SV mutational burden than low- and
intermediate-risk cases (INTR and LOWR), across SJ-BP, RD-BP and CN-BP measures (Fig. 2a-
c)11,37. Comparison of MNA vs. HR-NA tumors revealed these high-risk subsets differed in SV type and
genomic location (Fig. 2f-i, Supplementary Fig. 4a-d). MNA tumors harbored more SVs on
chromosome 2 (Wilcox P=1.6 x 10⁻¹⁴; Fig. 2f), largely confined to complex junctions at the MYCN
amplicon at chromosome 2p24 (Supplementary Fig. 4a). However, nearly all chromosomes displayed
a higher frequency of SVs in HR-NA than MNA (Fig. 2f). Specifically, HR-NA tumors harbored more
tandem-duplications in all chromosomes except chromosome 2 (Fig. 2g). Inter-chromosomal events
were also more frequent in HR-NA tumors and overlapped with regions of known SCNAs other than
chr2, including chromosome 3p (P=1.8 x 10⁻³), chromosome 4p (P=9.1 x 10⁻⁶) and chromosome 11q
(P=1.9 x 10⁻⁸), but not chromosome 1p and 17q (Fig. 2h). In contrast, complex events showed no
Page 8 of 39bioRxiv preprint first posted online Mar. 9, 2019; doi: http://dx.doi.org/10.1101/572248. The copyright holder for this preprint (which
was not peer-reviewed) is the author/funder, who has granted bioRxiv a license to display the preprint in perpetuity.
All rights reserved. No reuse allowed without permission.
Structural Variation in Neuroblastoma Lopez, Conkrite, et al.
overall differences between high-risk groups with the exception of the aforementioned chr2 (Fig. 2i).
Finally, RD-BP and CN-BP frequencies followed a similar pattern across chromosomes as that of SJ-
BPs; MNA tumors harbored increased number of breakpoints in chromosomes 2 (PRD-BP=2.4 x 10⁻⁹, Fig.
2j; PCN-BP=4.2 x 10-83, Fig. 2k) while HR-NA harbored increased frequencies in most other
chromosomes and in particular, chromosome 11 (PRD-BP=2.0 x 10⁻⁸, Fig. 2j; PCN-BP=4.0 x 10⁻²⁵, Fig. 2k).
We next studied overall differences in mutational burden and chromosomal instability across
subtypes; we posit that the densities of breakpoints (SJ-BP, RD-BP and CN-BP) throughout the
genome represent a bonafide measure of chromosomal instability. We also obtained measures of
somatic SNV density. In order to avoid skewing of results due to the MYCN amplicon in MNA and
43
regions exhibiting chromothripsis , we implemented an SNV and SJ-BP tumor burden measure robust
against outliers. To this end, the genome was divided into 41 sequence mapped chromosome arms
and the density of SVs per Mb was measured; then, for each sample, the interquartile mean (IQM) was
derived from the 41 arm measurements (Supplementary Fig. 4e,f). Similarly, we obtained IQM density
measurements from RD-BP and CN-BP chromosomal burdens (Fig. 2n,o). As expected, LOWR and
INTR tumors carried very low mutational burden (Fig. 2l-o)11,37. We observed increased CIN (SJ-BP,
RD-BP and CN-BP) in HR-NA compared to MNA (Wilcoxon rank test: PSJ-BP=4.5 x 10⁻⁵, Fig. 2m; PRD-
44
BP=1.3 x 10⁻², Fig. 2n; PCN-BP=4.6 x 10⁻⁸, Fig. 2o), similar to previous reports . In contrast, MNA and
HR-NA did not differ in their average SNV burden (Wilcoxon rank test: P=0.29, Fig. 2h). These results
confirm that HR-NA has increased chromosomal instability37,44 and supports the observation that small
SNVs and larger SVs arise from different mutational processes.
Chromothripsis associates with major neuroblastoma oncogenic mechanisms. Previous studies
43
have reported chromothripsis to occur in up to 18% of high-risk neuroblastomas and identified
associations between chromothripsis and key neuroblastoma oncogenes MYCN and TERT27,28. We
therefore sought to leverage our large dataset to further explore the oncogenic associations of
Page 9 of 39bioRxiv preprint first posted online Mar. 9, 2019; doi: http://dx.doi.org/10.1101/572248. The copyright holder for this preprint (which
was not peer-reviewed) is the author/funder, who has granted bioRxiv a license to display the preprint in perpetuity.
All rights reserved. No reuse allowed without permission.
Structural Variation in Neuroblastoma Lopez, Conkrite, et al.
chromothripsis in neuroblastoma. We first identified alterations of major neuroblastoma oncogenes
(MYCN, TERT and ALK) in our WGS and SNP cohorts. Rearrangements near TERT locus were
confirmed in 23 HR-NA samples and 2 MNA from the WGS dataset as well as 15 cases (14 HR-NA and
1 MNA) from the SNP dataset, one sample (PAPUTN) was present in both datasets (Fig 3a); 11 cases
from the WGS set with available DNA were validated using Sanger sequencing (Supplementary Fig.
5). We confirmed that TERT expression was increased in those samples as well as in MNA tumors in
27,28
accordance with previous reports (Supplementary Fig. 6) . In addition, CN-BPs were found near
TERT in 15 HR-NA samples from the SNP array dataset (Fig. 3a); highlighting the capability of SNP
arrays for detecting this type of event using the breakpoint analysis approach introduced in this study.
MYCN amplification was determined diagnostically by FISH experiments in 29 samples from the WGS
dataset (Supplementary Table 2). IGV visualization of segmentation data of 7Mb region surrounding
MYCN confirms the clinical records (Supplementary Fig. 7a). We also explored events affecting the
ALK gene, which can co-occur with amplification of MYCN. Two out of four rearrangements found near
ALK involved also MYCN, (Supplementary Fig. 7b); these events were validated via Sanger
sequencing (Supplementary Fig. 7c).
Next, chromothripsis was characterized by clustered somatic rearrangements and alternating
45
copy number states in defined chromosome regions . We identified candidate chromothripsis events
at chromosome arms with unusual high breakpoint densities (> 2σ of each sample’s breakpoint burden
distribution) and a minimum of 6 breakpoints (both SJ-BPs and RD-BPs) in 27 regions (Online
Methods, Supplementary Table. 4) involving 20 distinct high-risk tumors (19%). Chromothripsis was
observed in chromosome 2 in a total of 8 samples (Fig. 3b,d,e; Supplementary Fig. 8); those samples
showed enrichment in samples harboring MYCN amplification (MNA) (7/8 samples, Binomial test P
=7.4 x 10⁻⁴) (Fig. 3). Among them, two samples (PARETE and PATESI) involved co-amplification of
ALK with MYCN (Supplementary Fig. 7b,c). In addition, 9 tumors harbored shattered chromosome 5p
with strong enrichment in samples with rearrangements near TERT (8/9, Binomial test P = 7.3 x 10⁻⁵)
(Fig. 3c,d; Supplementary Fig. 9). Two samples (PAPSRJ and PAPUTN, Fig. 3d) included inter-
Page 10 of 39bioRxiv preprint first posted online Mar. 9, 2019; doi: http://dx.doi.org/10.1101/572248. The copyright holder for this preprint (which
was not peer-reviewed) is the author/funder, who has granted bioRxiv a license to display the preprint in perpetuity.
All rights reserved. No reuse allowed without permission.
Structural Variation in Neuroblastoma Lopez, Conkrite, et al.
chromosomal events associating the MYCN and TERT gene loci and co-amplification of both
oncogenes. Other chromosomes involved included chromosome 1, 10, 11 and X in a female sample
(Supplementary Fig. 10). Chromothripsis in most cases (15/20) was localized to a single chromosome
involving either the whole chromosome (i.e. PATBMM, Fig. 3b) or local regions (i.e. PATESI, Fig. 3c).
Multiple chromosomes were involved in 5/20 (25%) of cases with chromothripsis. One sample
(PARIRD) harbored an event involving chromosomes 2, 17 and 22, while PANRVJ involved large
regions of chromosomes 1 and 2 (Supplementary Fig. 8).
We next sought further confirmation of our results in the larger SNP array dataset. In the
absence of sequence junction information, we focused on unusual high density (>2σ) of CN-BPs (Fig.
3f). We observed high-breakpoint density on chromosome 2 enriched in MNA samples (46/46, P ~ 0).
We also observed enrichment of high breakpoint density on chromosome 5 involving cases in tumors
harboring rearrangements or CN-BPs near TERT (7/11, P = 3.01 x 10⁻⁸). In addition, chromosome X
high breakpoint density was enriched in female patients (6/7, P = 4.7 x 10⁻²), although no specific
oncogenic associations were determined. Overall, SNP array analysis of high CN-BP density supports
and replicates observations based on the WGS dataset.
Identification of genes recurrently altered by SVs in high-risk neuroblastomas. In order to identify
genes affected by recurrent somatic SVs in neuroblastoma we generalized the approach described
previously for TERT, MYCN and ALK genes (Fig 3a, Supplementary Fig. 7); SVs were assigned to
different categories according to the inferred impact on the exonic sequence of known RefSeq genes
(Fig. 4a,b). Sequence junctions (SJ-BPs) provide more detailed information including the type of SV
and the two genomic breakpoint locations involved; with this knowledge we classified SVs into: a)
“Coding”; SVs that modify the exonic sequence of known genes including whole gene copy number
alterations (duplications and deletions, size up to 2Mb) and b) “Non-coding”: SV that do not modify the
exonic sequences but might have an impact on regulatory regions proximal to known genes (100Kb
upstream and 25Kb downstream) as well as intronic regions (Fig. 4a). In contrast to SJ-BP junctions
Page 11 of 39bioRxiv preprint first posted online Mar. 9, 2019; doi: http://dx.doi.org/10.1101/572248. The copyright holder for this preprint (which
was not peer-reviewed) is the author/funder, who has granted bioRxiv a license to display the preprint in perpetuity.
All rights reserved. No reuse allowed without permission.
Structural Variation in Neuroblastoma Lopez, Conkrite, et al.
obtained from discordantly aligned mate read pairs; dosage-based breakpoints (RD-BP and CN-BP)
cannot identify their counterpart location in the genome. Therefore, events such as translocations and
inversions cannot be defined. Conversely, read-depth and array intensity based copy number inform
about multiple dosage gains and losses. With this in mind, we assumed the impact as a) “Coding”:
breakpoints within the transcription “start” and “end” positions of known genes and b) “Non-coding”,
breakpoints located on proximal upstream and downstream regions (Fig. 4b). In addition, we localized
copy number variants involving amplification (CNWGS > 8; CNSNP>4.5, Online Methods) and deep
deletions (CNWGS < 0.5; CNSNP < 0.9, Online Methods) (Fig. 4b).
Based on the aforementioned definitions, we ranked recurrently altered genes according to the
number of samples harboring “coding” and “non-coding” SVs for each of the 3 alternative breakpoint
analyses (SJ-BPs, RD-BPs and CN-BPs; Fig. 4c-h and Supplementary Table 5). Overall, recurrently
altered genes by ‘coding’ events return highly concordant results across the three approaches; MYCN
neighbor genes occupying top ranks followed by known neuroblastoma altered genes, PTPRD and
ATRX and novel genes including SHANK2 and DLG2 located at chr11.q13 and chr11.q14 respectively,
and others such as AUTS2 at chr7.q11 and CACNA2D3 at chr3.p14 (Fig. 4c,e,g). On the other hand,
non-coding recurrent alterations consistently reflect as top ranking genes, MYCN and TERT and their
respective neighbor genes at chr2.p24 and chr5.p15 (Fig. 4d,f,h).
In order to provide an integrated overview of the landscape of altered genes, we combined
WGS based methods (SJ-BP and RD-BP) into a ranking of recurrently altered genes with co-localizing
breakpoints, hence orthogonally validated. A total of 77 genes have at least 1 co-localizing SJ-BP and
RD-BP breakpoint (Fig. 4i, Supplementary Table 6); in addition, we overlaid likely pathogenic SNV
calls (Supplementary Table 7). Many altered genes cluster in specific regions associated with known
oncogenes such as chr2.p24 near MYCN (11 genes) and chr5.p15 near TERT (7 genes). The ranking
is led by MYCN with 37 samples harboring variants, which orthogonal validation was obtained in 26
cases by co-localizing SJ-BP and RD-BP; those include 29 MNA and 8 HR-NA tumors. Interestingly, 11
HR-NA samples harbor alterations of MYCN (8 SVs and 3 SNVs) supporting the pathogenic role of
Page 12 of 39bioRxiv preprint first posted online Mar. 9, 2019; doi: http://dx.doi.org/10.1101/572248. The copyright holder for this preprint (which
was not peer-reviewed) is the author/funder, who has granted bioRxiv a license to display the preprint in perpetuity.
All rights reserved. No reuse allowed without permission.
Structural Variation in Neuroblastoma Lopez, Conkrite, et al.
MYCN in non-amplified tumors. TERT rearrangements were identified in 25 samples; orthogonal
validation of breakpoints was observed in 12 cases (Fig. 3a). PTPRD was found altered in 20 samples,
25,49
11 of which were orthogonally validated (Supplementary Fig. 11a) . We found ATRX (North=5;
Ntot=12) intragenic deletions and one tandem-duplication in HR-NA tumors (Supplementary Fig.
11b)50. The SHANK2 gene was found disrupted in 11 HR-NA tumors; 3 samples involved gene fusions
that didn’t appear in frame. DLG2, a newly described tumor suppressor in osteosarcoma46,47, was found
disrupted in 10 samples based on SJ-BP and RD-BP analyses from a total of 14 samples, two of which
involved gene fusion events. Both SHANK2 and DLG2 are located on chromosome 11q and play a role
in the formation of postsynaptic density (PSD)48. Other novel candidate altered genes include AUTS2
with frequent intragenic deletions at chr7q (North=3; Ntot=18, Supplementary Fig. 12a) and the calcium
channel CACNA2D3 (North=4; Ntot=11), which represent a frequent breakpoint associated with 3p
deletion at chr3.p14.3 (Supplementary Fig. 12b). A region proximal to LINC00910 lncRNA in
chromosome 17 suffered rearrangements in 13 tumors (Supplementary Fig. 13a). Finally, the list
includes additional genes with known roles in neuroblastoma and cancer: ALK, which somatic SNVs
were found in 18 samples, also harbors rearrangements (North=1; Ntot=5; Supplementary Fig. 7b)23,51 in
a combined set of 23 samples (17% of all neuroblastomas). Also, CDKN2A and CDKN2B deletions
were found in 3 tumors (Supplementary Fig. 13b).
Systematic validation of SVs in high-risk neuroblastoma patient samples. Along this study, we
produced extensive validation via Sanger sequencing of variant junctions, provided the samples had
available DNA supply in our tumor bank; The validations focused on key genes and included 12
proximal TERT SVs (Supplementary Fig. 5), 4 ATRX deletions (Supplementary Fig. 14), 4 proximal
ALK variants (Supplementary Fig. 7c), 11 SHANK2 translocation events, 9 of which involved
chromosome 17q (Supplementary Fig. 15) and 12 DLG2 variants (Supplementary Fig. 16). In a total
we validated 45 SVs (Supplementary Table 8). The original CGI cancer pipeline classifies SVs into
high and low confidence variants depending on the number of read pairs supporting the evidence
Page 13 of 39bioRxiv preprint first posted online Mar. 9, 2019; doi: http://dx.doi.org/10.1101/572248. The copyright holder for this preprint (which
was not peer-reviewed) is the author/funder, who has granted bioRxiv a license to display the preprint in perpetuity.
All rights reserved. No reuse allowed without permission.
Structural Variation in Neuroblastoma Lopez, Conkrite, et al.
(Nreads threshold = 10); our pipelines rescue many cases below that threshold; specifically 6 out of 45
SVs (13.3%, 3 ATRX and 3 DLG2) returned positive Sanger validation.
SVs have a regional transcriptional effect. To gain further understanding of the functional relevance
of SVs, we performed an expression quantitative trait loci (eQTL) analysis for each of the recurrent SV
associated genes (Supplementary Fig. 13). The analysis, which was replicated in the two available
transcriptional datasets (RNA-seq and HuEx array), reported consistent up-regulation of MYCN and
TERT including their neighbor genes. We also observed up-regulation of the lncRNA LINC00910 (PRNA
= 7.0 x 10⁻³) at chr17.q21, a region with frequent inter-chromosomal translocations (Supplementary
Fig. 17a). On the other side, CDKN2A was down-regulated (PHuEx= 4.7 x 10⁻²; Pboth = 2.5 x 10⁻²) by focal
deletions. Finally, PLXDC1 at chr17.q12 was also down-regulated (PHuEx= 4.7 x 10⁻²; Pboth = 2.5 x 10⁻²)
in association with 17q gain breakpoints.
In addition to changes in overall gene expression by eQTL, translocations may lead to the
expression of gene fusion transcripts; we explored RNA-seq samples with three available gene fusion
methods (STAR-fusion33, fusionCATCHER34 and DeFUSE35, Supplementary Fig. 17b). We then
refined the list of fusion transcripts to those confirmed by the presence of translocations in the WGS SV
calls (Supplementary Table 9), which dramatically increases the overall agreement across the three
gene-fusion detection methods (Supplementary Fig. 17c). The most frequent gene fusion event with
both RNA and DNA evidence involved SHANK2; the three SHANK2 fusion events involved 17q genes:
EFTUD2, MED1 and FBXL20 (Fig 6a). DLG2 exhibited gene fusion events in two samples involving
SEMA6C and MYCBP2 at chromosomes 12 and 13 respectively (Fig 6b). However, none of the
SHANK2 and DLG2 fusion transcripts appeared to be in-frame, suggesting the fusion transcripts may
not be biologically relevant and that these are more likely loss of function events. Conversely, we found
an in-frame fusion transcript and translocation involving FOXR1:DDX6 (Supplementary Table 9), which
oncogenic fusion events have previously been described in neutoblastoma52.
Page 14 of 39bioRxiv preprint first posted online Mar. 9, 2019; doi: http://dx.doi.org/10.1101/572248. The copyright holder for this preprint (which
was not peer-reviewed) is the author/funder, who has granted bioRxiv a license to display the preprint in perpetuity.
All rights reserved. No reuse allowed without permission.
Structural Variation in Neuroblastoma Lopez, Conkrite, et al.
Neurodevelopmental genes are recurrently disrupted by structural variations in neuroblastoma.
In order to identify pathways targeted by SVs we considered recurrently altered genes from each the
coding (N>2) and non-coding (N>3) altered gene lists (#genes: SJ-BPcoding=109, SJ-BPnon-coding=36, RD-
BPcoding=76, RD-BPnon-coding=27, CN-BPcoding=77 And CN-BPnon-coding=88, Fig. 4c-h, Supplementary Fig.
18, Supplementary Table 10). We tested each gene list for enrichment across Gene Ontology,
53
pathway and disease gene classes using ToppGene (Supplementary Table 10). Genes with coding
sequences altered showed consistent results across the three breakpoint mappings, revealing strong
enrichment in genes involved in autism spectrum disorder susceptibility (PSJ-BP = 2.8 x 10⁻⁹; PRD-BP = 2.9
x 10-5; PCN-BP= 2.7 x 10⁻⁹) and other neurodevelopmental disorders (NDD) as well as protein localization
to synapse (PSJ-BP = 1.2 x 10⁻⁵; PRD-BP = 1.1 x 10⁻⁷; PCN-BP= 2.4 x 10⁻⁶) and other neuronal related classes
(Fig. 5a-c; Supplementary Table 10). The gene sets with ‘non coding’ alterations were more variable
across the alternative breakpoint analyses, but were dominated by events involving MYCN and TERT
in association with the disease class “stage, neuroblastoma” (PSJ-BP = 1.9 x 10⁻⁶; PRD-BP = 2.5 x 10⁻⁵; PCN-
BP = 9.2 x 10⁻⁵, Supplementary Fig. 18 and Supplementary Table 10).
Recurrently disrupted neurodevelopmental genes are down-regulated in high-risk
neuroblastoma. To further characterize the clinical relevance of recurrently altered genes in
neuroblastoma, we studied their differential expression between high-risk subtypes and low-risk (Stage
1 and 4s) groups (Fig. 5d,e, Supplementary Fig. 19). We first used gene set enrichment analysis
(GSEA)54 to confirm the directionality of the regulation of gene classes enriched in recurrently altered
genes; we observed down-regulation of both neuronal and synaptic genes (PHuEx= 1.09 x 10⁻⁹) and
autism disorder susceptibility genes (PHuEx= 6.38 x 10⁻⁷) in high-risk tumors when compared to stage 1
low-risk tumors (Fig. 5d-f). We then focused on differential expression of genes with recurrent SVs in
high-risk subtypes (Fig. 5g). As expected, known oncogenes including TERT and ALK are up-regulated
in both MNA and HR-NA while MYCN is up-regulated only in MNA tumors. Known neuroblastoma
Page 15 of 39bioRxiv preprint first posted online Mar. 9, 2019; doi: http://dx.doi.org/10.1101/572248. The copyright holder for this preprint (which
was not peer-reviewed) is the author/funder, who has granted bioRxiv a license to display the preprint in perpetuity.
All rights reserved. No reuse allowed without permission.
Structural Variation in Neuroblastoma Lopez, Conkrite, et al.
tumor suppressor genes including CAMTA1 and RERE from the 1p chromosome region and PTPRD
are down-regulated in both subtypes. Most genes with a role in autism disorder predisposition and
those involved in neuron parts and synapse formation, are down-regulated in both high-risk subtypes;
in particular expression was significantly reduced for SHANK2 (PMNA = 2.15 x 10⁻¹¹;PHR-NA= 1.05 x 10⁻⁸)
and DLG2 (PMNA = 2.1 x 10⁻⁸;PHR-NA= 4.86 x 10⁻⁸) in high-risk compared with stage 1 low-risk tumors
(Fig. 6c) and compared to stage 4S low-risk tumors (PMNA = 1.41 x 10⁻³;PHR-NA= 1.82 x 10⁻⁵ and PMNA =
1.09 x 10⁻⁴; PHR-NA= 2.72 x 10⁻⁴ respectively).
Neurodevelopmental genes SHANK2 and DLG2 are frequently disrupted by chromosome 11
translocation events. High-risk neuroblastomas without MYCN amplification frequently exhibit deletion
16,44
of chromosome 11q and this event is associated with a poor outcome . The most frequent
breakpoints observed in this study were located at chromosome 11q.13 and 11q.14 disrupting the
SHANK2 and DLG2 gene loci respectively (Supplementary Fig. 19). SHANK2 translocation partners
involved chromosome 17q in 10/11 WGS cases, in addition we identified 49 samples from the SNP
dataset (10.7%) with breakpoints in SHANK2 (Fig 6a). In contrast, DLG2 translocation partners include
multiple chromosomes; breakpoints were also identified in DLG2 locus in 28 samples from SNP dataset
(Fig 6b).
SHANK2 is a scaffold protein in the postsynaptic density (PSD) with two known coding isoforms
(long: NM_012309; short: NM_133266). We therefore studied the expression pattern of SHANK2 at the
exon level using both HumanExon arrays (Fig. 6c) and RNA-seq (Supplementary Fig. 20) data.
Clustering analysis of SHANK2 exon expression revealed two distinct clusters corresponding to the two
known coding isoforms. Expression of both isoforms was decreased in high-risk tumors compared to
INTR and LOWR as observed from RNA-seq (Fig. 6d) and HuEx expression analysis (Supplementary
55
Fig. 21a, b). Finally, in a large independent cohort , reduced expression of the long isoform
(NM_012309) was associated with increased tumor stage (P=1.62 x 10⁻²², Supplementary Fig. 21c)
Page 16 of 39bioRxiv preprint first posted online Mar. 9, 2019; doi: http://dx.doi.org/10.1101/572248. The copyright holder for this preprint (which
was not peer-reviewed) is the author/funder, who has granted bioRxiv a license to display the preprint in perpetuity.
All rights reserved. No reuse allowed without permission.
Structural Variation in Neuroblastoma Lopez, Conkrite, et al.
and poor survival (P=7.21 x 10⁻¹³, Supplementary Fig. 21d). Consistent with the SHANK2 expression
pattern, we observed decreased activation of PSD genes based on GSEA in high-risk compared to low-
risk neuroblastomas in multiple prognostic signatures (Supplementary Fig. 22). We decided to further
study the long isoform of SHANK2 (NM_012309) given that nearly all SVs uniquely disrupt this splice
variant, leaving the short isoform (NM_133266) intact.
SHANK2 expression inhibits cell growth and viability of neuroblastoma cells. To further elucidate
the role of SHANK2 in neuroblastoma, three neuroblastoma cell lines with low or no endogenous
SHANK2 expression (Supplementary Fig. 23), including SY5Y (MYCN Non-amplified), Be(2)C
(MYCN-amplified), and NGP (MYCN amplified), were stably transduced to constitutively overexpress
SHANK2 long isoform or an empty vector control. SHANK2 expression was confirmed by Western blot
(Fig. 7a-c). When maintained in selection media and grown alongside empty vector controls, the
SHANK2-expressing cells consistently exhibited decreased cell growth and viability as measured by
RT-CES cell index (Fig. 7d-f) as well as CellTiter Glo assay (Fig. 7g-i). For SY5Y, when control
reached confluence, the comparable cell indexes of the SHANK2 overexpressing lines were reduced by
75% (P=3.4 x 10⁻⁵; Fig. 7d), Be(2)C cell index reduced by 62% (P=3.16 x 10⁻⁴; Fig. 7e), and NGP
showed a 14% reduction (P=2.62 x 10⁻²; Fig. 7f). We also observed decreased cell viability in
SHANK2-expressing cells at both 4- and 7-day endpoints using an ATP-dependent CellTiter Glo assay.
Specifically, viability of SY5Y SHANK2-expressing cells was reduced to 65.51% (P=1.34 x 10⁻¹⁸) and
52.64% (P=4.72 x 10⁻²⁶) of controls (Fig. 7g). This was reinforced in the similar results for Be(2)C
SHANK2-expressing cells (49.21% and 44.26%, P=5.76 x 10⁻²⁸ and 5.74 x 10⁻¹⁵; Fig. 7h) and NGP
(90.63% and 74.01%, P=5.11 x 10⁻³ and 6.01 x 10⁻¹³) (Fig. 7i).
SHANK2 expression accelerates differentiation of neuroblastoma cells exposed to all-trans
retinoic acid (ATRA). We next investigated the role of SHANK2 in neuronal differentiation in Be(2)C
and SY5Y cells exposed to ATRA. In the presence of ATRA, overexpression of SHANK2 accelerated
Page 17 of 39bioRxiv preprint first posted online Mar. 9, 2019; doi: http://dx.doi.org/10.1101/572248. The copyright holder for this preprint (which
was not peer-reviewed) is the author/funder, who has granted bioRxiv a license to display the preprint in perpetuity.
All rights reserved. No reuse allowed without permission.
Structural Variation in Neuroblastoma Lopez, Conkrite, et al.
differentiation as measured by presence and length of neurites compared to cell body (Fig 7j-o;
Supplementary Fig. 24a-d). While decreases in growth can be measured even without drug
application, once ATRA is applied, cells overexpressing SHANK2 develop neurites more quickly, and
those neurites extend further than empty vector controls (Supplementary Fig. 24c,d). In Be(2)C cells,
significant differences in neurite outgrowth normalized to cell-body area was seen at 72 hours post
treatment with 1 uM ATRA (Fig. 7j-l) with SHANK2 cells exhibiting a 1.6-fold increase over controls
(P=3.09 x 10⁻¹³), and the difference increased at 96 hours to 2.76-fold (P=2.37 x 10⁻³⁰). Even with
vehicle alone, SHANK2 cells had more neurite outgrowth per cell body compared to their empty vector
counterparts at both 72 and 96 hours post treatment (P=1.02 x 10⁻⁵, P=1.25 x 10⁻¹³, respectively). In
SY5Y, though differentiation takes longer and both SHANK2 cells and controls eventually reach 100%
confluence with vehicle alone, SHANK2 overexpression still led to a decreased confluence in samples
(P=1.69 x 10⁻⁶, Supplementary Fig. 24b). In analyzing total neurite outgrowth without normalization for
cell body area, SY5Y ATRA-treated SHANK2 cells outpaced controls starting at hour 144 post-
treatment and continued to lead until the experiment end, with a total neurite measurement 1.55-fold
increased over controls (P=1.62 x 10⁻³⁵; Supplementary Fig. 24d). Once normalized, SHANK2 cells
have higher measured outgrowth starting at 75 hours post treatment, hour 96, and maintain from there.
At 195 hours past treatment, SHANK2 cells treated with 5uM ATRA displayed neurites at 1.71-fold
increase over their empty vector controls (P=2.36 x 10⁻¹⁷; Fig. 7m-o). Taken together, these data
suggest SHANK2 is a newly identified haplo-insufficient tumor suppressor in high-risk neuroblastoma
that is disrupted by recurrent somatic structural variation in the MYCN non-amplified subset of cases.
DISCUSSION
Sequencing studies of neuroblastoma tumors have revealed a relatively low SNV burden and
limited mutational landscape, leaving aneuploidy and large segmental chromosomal alterations as the
main candidate driver mutations in many tumors23. Structural variants (including insertions, deletions
Page 18 of 39bioRxiv preprint first posted online Mar. 9, 2019; doi: http://dx.doi.org/10.1101/572248. The copyright holder for this preprint (which
was not peer-reviewed) is the author/funder, who has granted bioRxiv a license to display the preprint in perpetuity.
All rights reserved. No reuse allowed without permission.
Structural Variation in Neuroblastoma Lopez, Conkrite, et al.
duplications and translocations) may also function as potent cancer drivers, as demonstrated with the
discovery of rearrangements near TERT driving aberrant TERT expression in many high-risk
neuroblastomas27,28. In this study, we have substantially expanded the landscape of structural variation
in neuroblastoma and revealed their functional impact in the disease through integrative genomic
analysis of a large cohort of patient samples profiled by whole genome sequencing and SNP arrays
together with additional transcriptional data. To the best of our knowledge, we presented here the
largest fully integrated genome wide survey of structural variation in neuroblastoma, combining
alignments based (SJ-BP) and copy number based (RD-BP and CN-BP) breakpoint analyses. Despite
the rich landscape of structural variations described in this study, we didn’t identify any oncogenic gene
fusion events, with the exception of the previously reported case of FOXR152, which appears to occur
preferentially in intermediate risk tumors within our cohort.
Overall, we showed that structural variation considerably increases the genetic complexity of
high-risk neuroblastomas. This complexity is most evident in high-risk tumors without amplification of
MYCN (HR-NA), which show increased chromosomal instability44, as confirmed by structural variation
and breakpoint burden analyses. Moreover, this subset harbors more SVs in known cancer genes as
well as novel genes. Interestingly, the SNV burden is very similar between MNA and HR-NA groups. As
shown in pan-cancer studies, the underlying mechanisms potentiating chromosomal instability (CIN)
and somatic SNV burden may differ56. Nonetheless, loss of TP53 function by deleterious mutations,
associated with increased CIN in pan-cancer studies, is largely absent in primary neuroblastomas and
drivers of the observed increased chromosomal instability in neuroblastoma remain unknown. Despite
lesser burden, MNA tumors also present widespread structural variation but often associated to the
MYCN locus. Indeed, translocations involving MYCN complex events may have a broader effect
throughout the genome as observed in cases where MYCN appears co-amplified with ALK and TERT.
Chromothripsis is a well-documented genetic alteration in neuroblastomas, reported in as many
57
as 18% high-stage tumors . Similarly, in the current study, 19% of high-risk tumors from the TARGET
cohort exhibited chromothripsis (N=20/105) involving a total of 27 chromosomal regions. These events
Page 19 of 39bioRxiv preprint first posted online Mar. 9, 2019; doi: http://dx.doi.org/10.1101/572248. The copyright holder for this preprint (which
was not peer-reviewed) is the author/funder, who has granted bioRxiv a license to display the preprint in perpetuity.
All rights reserved. No reuse allowed without permission.
Structural Variation in Neuroblastoma Lopez, Conkrite, et al.
largely overlap with amplification of MYCN (as well as some ALK cases) on chromosome 2p and TERT
on chromosome 5p, suggesting an important role of chromothripsis followed by purifying selection as
an underlying cause of those alterations. We also observed high-breakpoint density in the X
chromosome of females based on the SNP data, which could be explained by higher tolerance to
chromothripsis of diploid regions. Altogether, the prevalence and oncogenic role of chromothripsis in
neuroblastomas is confirmed; future studies need to address whether it represents a therapeutic
intervention opportunity.
Along this study, we report a common genetic repertoire of altered genes between
neuroblastomas and neurodevelopmental disorders (NDD) such as autism. Linkage between cancer
and autism has been previously established in PTEN-associated germline syndromes58. Furthermore,
multiple autism susceptibility genes also have a known role in cancer59. Certain germline deletions with
NDD associations such as 10p1560 and 16p24.361 are reported here to occur somatically in
neuroblastoma. We hypothesize that structural variants in SHANK2 and DLG2 genes coding proteins of
the postsynaptic density (PSD) comprise novel neuroblastoma candidate tumor suppressors involved in
neuronal differentiation; additional candidate altered genes with a role in neurotransmission and
synapsis and involvement in autism include AUTS2, CNTNAP2, NRXN1, CTNND262. These alterations
are more prevalent in high-risk tumors without amplification of MYCN, which is itself a potent driver of
dedifferentiation63. Transcriptomic analyses have shown that neural lineage pathways are commonly
down-regulated in high-risk neuroblastomas compared to low-risk signatures64. Synaptogenesis is a
key process in neuronal differentiation, and mutations in genes involved in the formation of synapses
have frequently been implicated in NDD (also termed shankopathies)65. Furthermore, DLG2 has been
recently described as a tumor suppressor in osteosarcoma46,47. We propose that the dysregulation of
SHANK2 and DLG2 synaptic genes is involved in maintaining the undifferentiated state of the
neuroblastic cancer cell. In particular, here we show that SHANK2 expression reduces cell growth and
increases neurite outgrowth in human derived neuroblastoma cell lines in the presence of ATRA. The
sensitizing effect of SHANK2 expression to ATRA treatment reveals the importance of understanding
Page 20 of 39bioRxiv preprint first posted online Mar. 9, 2019; doi: http://dx.doi.org/10.1101/572248. The copyright holder for this preprint (which
was not peer-reviewed) is the author/funder, who has granted bioRxiv a license to display the preprint in perpetuity.
All rights reserved. No reuse allowed without permission.
Structural Variation in Neuroblastoma Lopez, Conkrite, et al.
the mechanisms of differentiation disrupted in neuroblastoma. Retinoids are currently utilized as
maintenance therapy in high-risk neuroblastoma standard of care66,67; subsequent studies with larger
cohorts should evaluate the contribution of alterations in neurodevelopmental genes to retinoic acid
treatment response as a maintenance therapy.
Despite the background genetic heterogeneity of neuroblastoma subtypes, SVs systematically
target telomere maintenance mechanisms and neurodevelopmental pathways influencing
differentiation. While MYCN-amplified tumors are largely sustained by the oncogene’s strong effect,
other high-risk tumors suffer recurrent hits in both key pathways. Altogether, we depict a new
landscape of structural variation in neuroblastoma and provide mechanistic insight into the neuronal
development abrogation hallmark of the high-risk form of this pediatric disease.
Supplementary Data
Supplementary data include 10 tables and 24 figures.
Acknowledgements
This work was supported in part by NIH grant R01-CA124709 (SJD) and the Roberts Collaborative
Forefront Award (GL). This project was also funded in part by a supplement to the Children’s Oncology
Group Chair’s grant CA098543 and with federal funds from the National Cancer Institute, National
Institutes of Health, under Contract No. HHSN261200800001E to S.J.D and Complete Genomics.
Author Contributions
S.J.D designed the experiment. G.L., K.L.C and S.J.D. drafted the manuscript. G.L. and S.J.D.
performed analyses of SVs from WGS. G.L. performed RNA data analysis. G.L. and K.L.H. performed
telomere analyses and allele-specific expression studies. G.L. and A.M. performed de novo transcript
analyses. G.L. and K.S.R. performed fusion transcript analyses. K.L.C. and M.D. performed Sanger
Page 21 of 39bioRxiv preprint first posted online Mar. 9, 2019; doi: http://dx.doi.org/10.1101/572248. The copyright holder for this preprint (which
was not peer-reviewed) is the author/funder, who has granted bioRxiv a license to display the preprint in perpetuity.
All rights reserved. No reuse allowed without permission.
Structural Variation in Neuroblastoma Lopez, Conkrite, et al.
sequencing. K.L.C., M.D., L.M.F., and E.H. performed SHANK2 experiments. Z.V. assisted with
sequence data analysis. J.S.W. and J.K. generated RNA sequencing data. S.A. and R.C.S. generated
array-based expression data. H.S. and P.W.L generated methylation array data. All authors
commented on or contributed to the current manuscript.
Page 22 of 39bioRxiv preprint first posted online Mar. 9, 2019; doi: http://dx.doi.org/10.1101/572248. The copyright holder for this preprint (which
was not peer-reviewed) is the author/funder, who has granted bioRxiv a license to display the preprint in perpetuity.
All rights reserved. No reuse allowed without permission.
Structural Variation in Neuroblastoma Lopez, Conkrite, et al.
Analytical Platform Number of Resolution Specific event types
pipeline genomic
breakpoints
Sequence 1 bp SV type:
Junction WGS 2 x SJ-BP (variable coverage) translocation, inversion,
(SJ) deletion, tandem-duplication
Read-Depth 2 Kbp
WGS 1 x RD-BP
(RD) (variable coverage) Dosage information:
Copy ~5 Kbp gain/amplification and
Number SNP array 1 x CN-BP (variable probe density) loss/deep deletion
(CN)
Table 1. Alternative breakpoint analyses for the identification of structural variants
Page 23 of 39bioRxiv preprint first posted online Mar. 9, 2019; doi: http://dx.doi.org/10.1101/572248. The copyright holder for this preprint (which
was not peer-reviewed) is the author/funder, who has granted bioRxiv a license to display the preprint in perpetuity.
All rights reserved. No reuse allowed without permission.
Structural Variation in Neuroblastoma Lopez, Conkrite, et al.
FIGURE LEGENDS
Figure 1: Novel somatic DNA copy number alterations (SCNAs) revealed by whole genome
sequencing (WGS) of neuroblastoma tumors. (a) Survey of available samples, clinical information
and data types used throughout this study (See also Supplementary Tables 1 & 2). (b-c) Integrated
Genome Viewer (IGV) visualization of DNA copy number gains (red) and losses (blue) across
neuroblastoma subtypes in the WGS (b) and SNP (c) datasets. (d-e) GISTIC q-value plots showing
significant regions of gain (d) and deletion (e) in HR-NA samples in 77 samples derived from WGS
dataset.
Figure 2: Somatic mutation burden differs between neuroblastoma subtypes by quantity, type
and genomic location. (a) Stacked bar chart of discordant mate pair derived structural variants by
type and neuroblastoma subtype in WGS dataset. (b) Bar plot representing the number of read-depth
breakpoint (RD-BP) per sample across subtypes in the WGS dataset. (c) Bar plot representing the
number of copy number breakpoint (CN-BP) per sample across subtypes in the SNP dataset. (d) Co-
localization of RD-BPs into SJ-BP across WGS dataset samples and overall co-localization percentage
(right bar). (e) Co-localization of SJ-BPs into RD-BP across WGS dataset samples and overall co-
localization percentage (right bar). (f-k) By chromosome comparison between MNA and HR-NA of the
inter-quantile average number of SVs including all SJ-BP variant types (f), duplications (g),
interchromosomal (h), complex (i) as well as RD-BP and CN-BP. A Wilcoxon test is obtained for every
chromosome and the p-value is represented by asterisk (*** = p < 0.001, ** = P < 0.01, * = P < 0.05;
asterisk color indicates what group has the highest IQM, red=MNA and orange=HR-NA). Mutation
burden analysis plot across neuroblastoma subtypes representing the burden of SNVs (l), SJ-BPs (m),
RD-BPs(n) and CN-BP (o).
Figure 3: Incidence of chromothripsis and oncogenic associations in high-risk neuroblastoma.
(a) Identification of rearrangements near TERT in 25 WGS samples based on RD-BPs combined with
Page 24 of 39You can also read