Hemodynamic Abnormalities in the Aorta of Turner Syndrome Girls
←
→
Page content transcription
If your browser does not render page correctly, please read the page content below
ORIGINAL RESEARCH
                                                                                                                                                 published: 01 June 2021
                                                                                                                                         doi: 10.3389/fcvm.2021.670841

                                              Hemodynamic Abnormalities in the
                                              Aorta of Turner Syndrome Girls
                                              Lauren Johnston 1 , Ruth Allen 2 , Pauline Hall Barrientos 2 , Avril Mason 3 and
                                              Asimina Kazakidi 1*
                                              1
                                               Department of Biomedical Engineering, University of Strathclyde, Glasgow, United Kingdom, 2 Department of Radiology,
                                              Royal Hospital for Children, Glasgow, United Kingdom, 3 Department of Paediatric Endocrinology, Royal Hospital for Children,
                                              Queen Elizabeth University Hospital, Glasgow, United Kingdom

                                              Congenital abnormalities in girls and women with Turner syndrome (TS), alongside
                                              an underlying predisposition to obesity and hypertension, contribute to an increased
                                              risk of cardiovascular disease and ultimately reduced life expectancy. We observe that
                                              children with TS present a greater variance in aortic arch morphology than their healthy
                                              counterparts, and hypothesize that their hemodynamics is also different. In this study,
                                              computational fluid dynamic (CFD) simulations were performed for four TS girls, and three
                                              age-matched healthy girls, using patient-specific inlet boundary conditions, obtained
                                              from phase-contrast MRI data. The visualization of multidirectional blood flow revealed
                                              an increase in vortical flow in the arch, supra-aortic vessels, and descending aorta, and a
                                              correlation between the presence of aortic abnormalities and disturbed flow. Compared
                                              to the relatively homogeneous pattern of time-averaged wall shear stress (TAWSS) on
                             Edited by:       the healthy aortae, a highly heterogeneous distribution with elevated TAWSS values was
                  Umberto Morbiducci,
              Politecnico di Torino, Italy    observed in the TS geometries. Visualization of further shear stress parameters, such as
                          Reviewed by:        oscillatory shear index (OSI), normalized relative residence time (RRTn), and transverse
                           Michele Conti,     WSS (transWSS), revealed dissimilar heterogeneity in the oscillatory and multidirectional
                 University of Pavia, Italy
                  Bogdan Ene-Iordache,
                                              nature of the aortic flow. Taking into account the young age of our TS cohort (average age
   Istituto di Ricerche Farmacologiche        13 ± 2 years) and their obesity level (75% were obese or overweight), which is believed
               Mario Negri (IRCCS), Italy     to accelerate the initiation and progression of endothelial dysfunction, these findings may
                  *Correspondence:            be an indication of atherosclerotic disease manifesting earlier in life in TS patients. Age,
                     Asimina Kazakidi
         asimina.kazakidi@strath.ac.uk        obesity and aortic morphology may, therefore, play a key role in assessing cardiovascular
                                              risk in TS children.
                    Specialty section:
                                              Keywords: Turner syndrome, computational fluid dynamics, hemodynamics, cardiovascular disease, pediatric
          This article was submitted to
                                              medicine, patient-specific, disturbed flow, atherosclerosis
                   Pediatric Cardiology,
                a section of the journal
  Frontiers in Cardiovascular Medicine
                                              INTRODUCTION
         Received: 22 February 2021
            Accepted: 06 May 2021
                                              Turner syndrome (TS) is a rare genetic disorder where the second sex chromosome in females
           Published: 01 June 2021
                                              is partially or completely absent and can affect all or only a percentage of cells (mosaicism).
                             Citation:        Although rare, TS is the most common chromosomal abnormality among females, affecting 1 in
Johnston L, Allen R, Hall Barrientos P,
                                              2,500 live births based on epidemiological data from Europe, East Asia, and North America (1–3).
     Mason A and Kazakidi A (2021)
  Hemodynamic Abnormalities in the
                                              The clinical characteristics of TS are highly variable, however, with congenital heart abnormalities
     Aorta of Turner Syndrome Girls.          estimated to occur in as many as half of individuals (4). These defects predominantly affect the
  Front. Cardiovasc. Med. 8:670841.           left side of the heart, with the most commonly reported being an elongated transverse aortic
    doi: 10.3389/fcvm.2021.670841             arch (ETA) (5, 6). Defined as an increased distance between the second (LCCA) and third (LSA)

Frontiers in Cardiovascular Medicine | www.frontiersin.org                           1                                             June 2021 | Volume 8 | Article 670841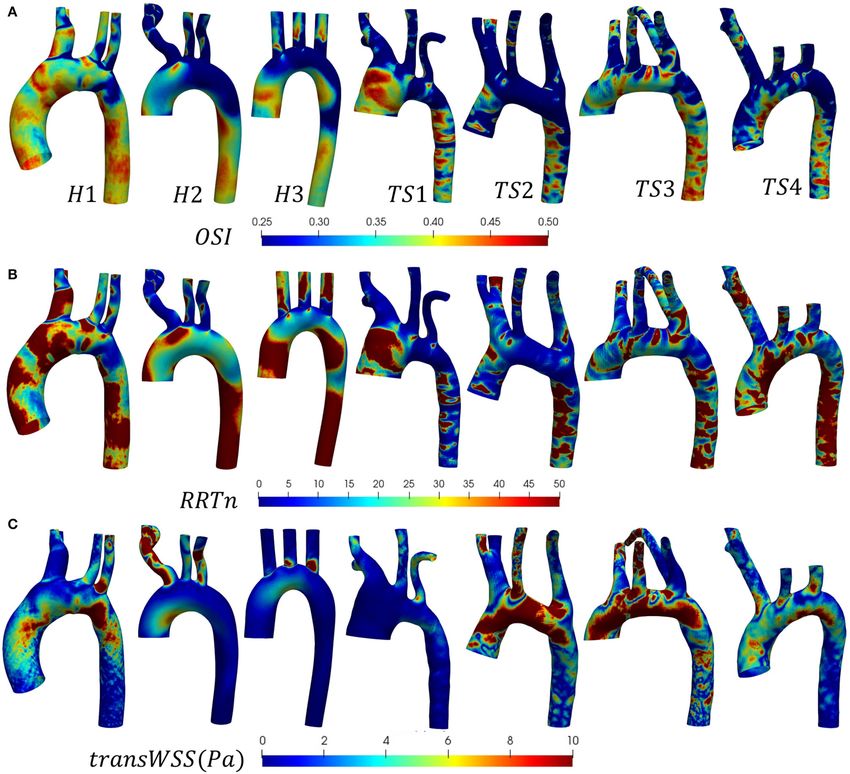
Johnston et al.                                                                                                          Hemodynamic Abnormalities in TS Aortae

supra-aortic branch origins, ETA is reported in 49% of TS adults                         shear stress patterns have proven to be comparable between
(5, 6). Bicuspid aortic valve (BAV) is the second most common                            Newtonian and non-Newtonian simulations (32). Multiple
abnormality in TS, affecting ∼30%, closely followed by aortic                            studies ignore the pulsatile nature of blood flow, assuming
dilatation with a prevalence of 27% (5, 7, 8). Coarctation of                            instead a steady-state condition (25, 26). This assumption is
the aorta (CoA) is reported in around 16% of TS females,                                 computationally-efficient when only considering the mean WSS
most commonly at the site between the third supra-aortic                                 result, but pulsatility is crucial for capturing time-dependent
branch and the descending aorta (5, 7, 8). Aberrant right                                parameters such as instantaneous velocities and WSS, time-
subclavian artery (RSA) is an anatomical variation of the RSA                            averaged wall shear stress (TAWSS), transverse WSS (transWSS),
which atypically originates from the arch as a separate fourth                           oscillatory shear index (OSI), and relative residence time (RRT)
branch and has a prevalence of 8% in TS (6). These congenital                            (33). In addition to the above assumptions, the computational
abnormalities, alongside an underlying predisposition to obesity                         result is highly sensitive to the assigned boundary conditions
and hypertension, contribute to a greater risk of cardiovascular                         (BCs) (32–36). Madhavan and Kemmerling (32) compared five
disease and ultimately reduced life expectancy in TS (9).                                different inlet velocity profiles on human aortae and found
    Hemodynamic factors have been linked to the initiation                               only small differences in the flow solution approximately two
and development of cardiovascular disease for over a century                             diameters downstream from the aortic inlet. In a similar study on
(10). However, the exact nature of pro-atherogenic flow is                               mice, Van Doormaal et al. (37) used realistic MRI-derived aortic
uncertain with researchers proposing contradicting theories (11,                         root velocity profiles and suggested that idealized inflow profiles
12). Fry suggested that high wall shear stress (WSS) preceded                            should be avoided. Pirola et al. (28) recommended the use of a 3D
endothelial dysfunction, one of the early biological markers for                         inlet velocity profile for hemodynamic analysis of the ascending
atherosclerotic lesions that underlie most cardiovascular diseases                       aorta and arch, but a 1D inlet velocity profile was acceptable for
(11). Soon after, Caro et al. suggested that high WSS regions                            evaluating flow in the descending aorta. Outlet BCs impact a
are in fact spared from disease, with low WSS areas prone                                greater percentage of the solution domain, but often in-vivo data
to develop atherosclerosis (12, 13). The oscillatory shear index                         is not available, which is a hurdle in patient-specific simulations
(OSI) was then put forward by Ku et al. (14) to characterize                             (32). In the absence of in-vivo data, most studies apply either
regions of reversing flow, and today the combined low and/or                             an outflow boundary condition, in which a percentage of the
oscillatory WSS theory is generally accepted as the biological                           total flow is specified at each outlet, or a simple downstream
mechanism for atherosclerosis. However, atherosclerotic lesions                          resistance or the Windkessel model, in which the resistance
appear to depend on and vary with age (15): studies in                                   and capacitance of the downstream vasculature are modeled
human fetuses, newborns, and children have demonstrated the                              (38). However, implementation of the Windkessel model is
development of sudanophilic lesions downstream of branch ostia                           particularly challenging for children, due to the lack of values
in the thoracic aorta (16); in young adults, lesions are observed                        for the Windkessel parameters in the literature, especially for
laterally of such branch origins, while in middle age, upstream                          children with TS. In the absence of patient information, Murray’s
(17, 18); last, in older people, atherosclerotic lesions develop                         Law or the splitting method, both established from the power
around the origins of intercostal arteries (19). Some aspects of                         law relationship between branch diameter and flow rate, could
such distinct lesion distributions have been described before                            be used (39, 40). Several authors have favored Murray’s law
hemodynamically and were correlated with strikingly varied WSS                           over the zero-pressure boundary condition, for capturing more
patterns calculated numerically around aortic branches (20–                              physiologically relevant flow features (33, 39).
22).                                                                                         In Turner syndrome, deviations from an anatomically
    In recent decades, computational fluid dynamic (CFD)                                 healthy aorta are common, and therefore changes in
modeling has gradually replaced traditional experimental                                 blood flow may exacerbate the risk of cardiovascular
methods in the study of cardiovascular diseases, largely due to its                      disease. Understanding the pathogenesis of the increased
ability to quantify variables not measurable in-vivo, particularly                       cardiovascular morbidity and mortality in Turner syndrome,
at a temporal and spatial resolution exceeding all other                                 and determining the contributions of atherosclerotic disease,
methodologies (23). Increasingly complex models of arterial                              hypertension, and obesity was made a key cardiovascular
vessels have improved our understanding of the relationship                              research priority by the American Heart Association (4).
between anatomical and hemodynamic factors (24–31).                                      To this end, our research primarily aims at providing new
However, the accuracy of these models is dependent on several                            evidence for the aortic arch hemodynamics in the TS children
assumptions. The assumption of blood as an incompressible,                               population, with categorically abnormal aortic morphologies.
Newtonian fluid is common in the case of larger arteries. While                          Comparison with three age- and gender-matched, anatomically
this assumption is not physiologically correct, qualitative wall                         healthy cases is also made to highlight the differences with
                                                                                         normal anatomies. The hemodynamic environment of each
                                                                                         patient was studied, and the relationship between aortic
Abbreviations: TS, Turner syndrome; ETA, Elongated transverse arch; BAV,                 morphology and flow was analyzed. Moreover, this study
Bicuspid aortic valve; CoA, Coarctation of the aorta; BCA, Brachiocephalic artery;       provides further evidence on understanding the aortic flow
RSA, Right subclavian artery; RCCA, Right common carotid artery; LCCA, Left
common carotid artery; LSA, Left subclavian artery; WSS, Wall shear stress;
                                                                                         development generally in children and attempts to find
TAWSS, Time-averaged wall shear stress; transWSS, transverse wall shear stress;          correlations between hemodynamics and clinical significance
OSI, Oscillatory shear index; RRT, Relative residence time.                              in TS patients.

Frontiers in Cardiovascular Medicine | www.frontiersin.org                           2                                      June 2021 | Volume 8 | Article 670841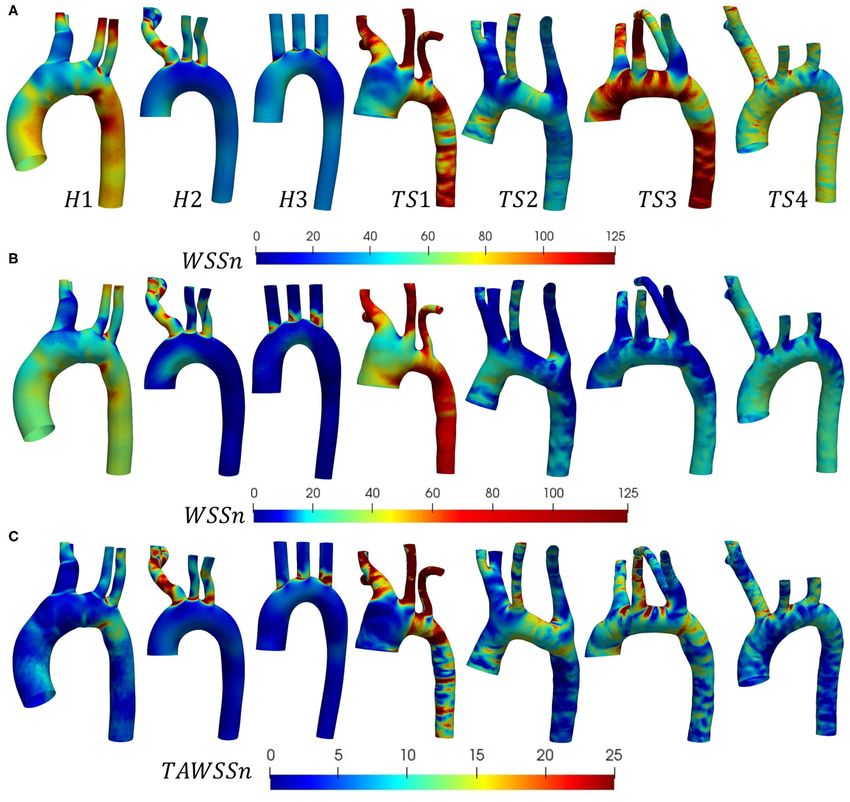
Johnston et al.                                                                                                            Hemodynamic Abnormalities in TS Aortae

TABLE 1 | Biometric and anatomical data for the Turner syndrome (TS) girls                of the healthy group were 3.77 ± 1 l/min (mean ± SD), and 81.33
(n = 4).                                                                                  ± 22.59 bpm (mean ± SD), respectively. Even though detailed
                               TS 1           TS 2           TS 3            TS 4
                                                                                          BMI information was not included as part of the purchased data,
                                                                                          it is expected that all healthy cases were within the normal BMI
Age, y                           14            10             14              13          range, in accordance with the standard of the repository.
Height, cm                    136.60         134.70          143.70        138.30
Weight, kg                     47.85         44.15           60.20          33.00
BSA, m2                         1.3           1.27            1.53           1.2
                                                                                          Anatomical Reconstruction and Mesh
BMI                             25.6          24.3            29.2           17.3         Generation
BMI percentile                 92nd           97th            99th           27th         The three-dimensional geometries of the TS group were
BMI category                over-weight      obese           obese         healthy        segmented and reconstructed from the MRI data, from above
BPsyst /BPdiast , mmHg        116/75         102/61          104/43        111/69         the location of the aortic valve to the end of the thoracic
CO, l/min                       4.58          5.40            4.97           3.34         aorta, including the brachiocephalic, left common carotid, and
HR, bpm                          88           105             84              83          subclavian arteries, using the medical-imaging software ITK-
Anatomical abnormality       dilatation       ETA        aberrant RSA        none         SNAP (www.itksnap.org). In Figure 1 the anterior view of the
                                                                                          reconstructed aortic models of the healthy (H1–H3) and Turner
Age, height, weight, and blood pressure (BP) obtained from the patient electronic         syndrome girls (TS1–TS4) is shown, with the geometries being
clinical records, as well as body surface area (BSA) and body mass index (BMI). The
cardiac output (CO) and heart rate (HR) was obtained from within Medviso Segment
                                                                                          in scale for direct comparison. The healthy controls had aortic
software (http://medviso.com/segment).                                                    diameters (D) of 17.53-22.48 mm at the sinotubular junction
                                                                                          (Table 2), similar to the mean diameter of 17.5 mm (range =
                                                                                          11.1–26.4 mm) found in healthy children of a related age (n = 53,
                                                                                          range = 2–20 years) (42). Ascending aorta diameters in women
MATERIALS AND METHODS                                                                     with TS are generally about 10% greater than in healthy women
                                                                                          (43). In our cohort, the TS girls had aortic diameters of 18.99–
Magnetic Resonance Imaging (MRI) and                                                      33.77 mm (Table 2). The excessively large aortic diameter in TS1
Patient Cohort                                                                            was expected due to the dilated ascending aorta. Among the
In this study, retrospective MRI scans were obtained from four (n                         Turner syndrome models were aortic abnormalities commonly
= 4) girls (average age 13 ± 2 years) with karyotypically proven                          reported in the literature, such as ascending aorta dilatation
Turner syndrome (Table 1), attending the pediatric TS clinic                              (TS1), elongated transverse arch (TS2 and TS3), and an aberrant
at the Royal Hospital for Children, Queen Elizabeth University                            right subclavian artery (TS3), as stated in the patient clinical
Hospital (RHC, QEUH). TS3 underwent anomalous pulmonary                                   records. Arch morphology in TS4 was suggestive of a triangular-
venous drainage repair ∼6 years prior to MRI imaging, and TS4                             shaped “gothic” arch, although this was not recorded in the
underwent left congenital diaphragmatic hernia repair at birth                            clinical records. Both TS1 and TS3 had a bicuspid aortic valve,
(13 years before the MRI scan). Both surgical corrections were                            while TS2 and TS4 had a normal functioning tricuspid aortic
unrelated to the region of interest, being the proximal aorta.                            valve. TS girls 1, 2, and 4 exhibited the conventional anatomy
   All cardiac imaging was performed between 2014 and 2018 on                             of three supra-aortic vessels arising from the arch. In TS3, the
a 1.5 Tesla diagnostic MRI scanner (MAGNATOM Aera/Avanto,                                 right subclavian artery arose from the posterior arch, distal to the
Siemens Healthcare, GmbH). The scans were acquired with both                              left common carotid artery (Figure 1, inset). There were no aortic
ECG and respiratory gating. Additional 2D time-resolved phase-                            abnormalities in the healthy cases (H1–H3).
contrast MRI (PC-MRI) data was acquired at the aortic root of                                 After segmentation, the surface models were smoothed
each individual over a cardiac cycle, oriented axially and centered                       in Autodesk Meshmixer (www.meshmixer.org) to reduce
on the anatomical position of the pulmonary artery. Flow in the                           post-segmentation artifacts, and flow extensions were added
through-plane direction was measured with PC-MRI imaging                                  normal to all boundary faces in VMTK (www.vmtk.org).
using a velocity encoding (VENC) of 150–400 cm/s and TE =                                 An extension of half aortic diameter in length was
2.66–3.33 ms, TR = 9.94 ms (slice thickness of 3.5–5 mm; FOV =                            added at each patient-specific inlet, which was fitted to
300 × 300 mm), for all data, resulting in a 256 x 256 pixel matrix                        a circular inlet of the same area. The domain was then
and resolution of 1.17 × 1.17 × 3.5–5 mm.                                                 discretized in STAR-CCM+ software (Siemens PLM,
   Biometric data (height, weight and blood pressure, BP) was                             USA, www.plm.automation.siemens.com/global/en/products/
obtained within 1 month of the cardiac imaging data and                                   simcenter/STAR-CCM.html) using polyhedral elements for
body mass index (BMI) and BMI percentile were computed                                    the internal mesh, and prismatic elements for the boundary
according to the 1990 British childhood standards (Table 1)                               layer (Figure 2). While tetrahedral meshing is a more common
(41). The cardiac output (CO) and heart rate (HR) were                                    approach, often a larger number of elements are required to
obtained from the PC-MRI data. Patient-specific volumetric                                limit element skewness and achieve acceptable mesh quality.
image and geometrical data from three gender-matched (average                             Polyhedral meshing, introduced in STAR-CCM+, has two
age 13 ± 6.8 years) patients (n = 3), with no known                                       major benefits resulting in better numerical stability: one,
aortic abnormalities, were purchased from the Vascular Model                              each individual element has multiple neighbors, and two, the
Repository (www.vascularmodel.com). The average CO and HR                                 elements are less sensitive to stretching (44, 45). As a result,

Frontiers in Cardiovascular Medicine | www.frontiersin.org                            3                                       June 2021 | Volume 8 | Article 670841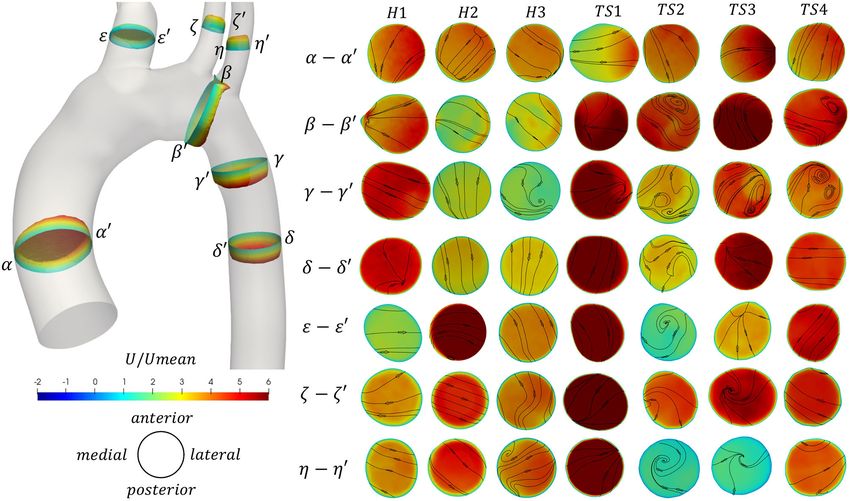
Johnston et al.                                                                                                                       Hemodynamic Abnormalities in TS Aortae

  FIGURE 1 | Anterior view of the reconstructed aortic models from the (H1-H3) healthy and (TS1-TS4) Turner syndrome (TS) girls. RSA, Right subclavian artery; RCCA,
  right common carotid artery; LCCA, left common carotid artery; LSA, left subclavian artery. Inset: Superior view of TS3 to highlight the origin of the aberrant RSA.
  Geometries are in scale.

TABLE 2 | Hemodynamic information for healthy (H1–H3) and Turner syndrome (TS1–TS4) patients.

                                H1                      H2                     H3                     TS 1                    TS 2                   TS 3                    TS 4

D, mm                          17.53                  22.48                   19.68                   33.77                  19.30                   22.56                  18.99
T, s                           0.57                    1.00                    0.76                   0.68                    0.57                   0.71                    0.72
           ml
Qmean        s                   48                     82                      56                     77                      90                     83                      56
           ml
Qpeak       s                   197                    302                     223                     254                    294                     320                    207
Remean                         1,046                  1,394                   1,106                    871                   1,782                   1,406                  1,127
Repeak                         4,292                  5,145                   4,336                   2,873                  5,820                   5,418                  4,164
Wo                               16                     15                      16                     28                      18                     18                      15
1y1 , mm                       0.19                    0.21                    0.21                   0.40                    0.16                   0.21                    0.20
1yn=5 ,     mm                 1.43                    1.59                    1.56                   3.01                    1.21                   1.59                    1.49

T, cardiac cycle period; Qmean , Qpeak : mean and peak flow rates, respectively, and Remean , Repeak the corresponding Reynolds numbers; Wo, Womersley number; ∆y1 , first boundary
layer height; ∆yn = 5 , total boundary layer height (Equations 1–4).

an accurate solution can be achieved with a much lower cell                                 the near-wall mesh with an appropriate y+ value is crucial for
count of polyhedral elements than tetrahedral. Quantitative grid                            resolving flow in the viscous sublayer of the boundary layer. The
convergence was investigated on three meshes of increasing                                  values of the first boundary layer height (1y1 ) and total boundary
density (each grid was further refined by a factor of 2) and                                layer height (1yn=5 ) are shown in Table 2.
assessed using the Grid Convergence Index (GCI = Fs (e/(rp −1))
where Fs is a safety factor, taken as 1.25, e the relative error,                                                                      µy+
                                                                                                                             1y1 =                                             (1)
r the mesh refinement ratio, and p the order of convergence)                                                                           ρ UT
(46). The results confirmed that wall shear stress accuracy was
suitably achieved with 1.5 million polyhedral elements (GCI ∼  =                            where 1y1 is the height of the first layer, y+ is equal to 1, µ and
11%). Mesh generation with polyhedral elements is a promising                               ρ are the fluid viscosity and density, taken as 3.5e-3 Pa s and 1050
discretization approach to reduce the computational time of                                 kg/m3 , respectively (25), and UT is the friction velocity computed
simulations while retaining accuracy.                                                       from Equation (2):
   To accurately resolve the flow adjacent to the wall, the
boundary layer mesh was generated using a total of 5 layers,
                                                                                                                                       r
                                                                                                                                           τw
                                                                                                                              UT =                                             (2)
with the height of the first layer (1y1 ) satisfying a y+ value                                                                            ρ
of 1 (47), according to Equation (1). The y+ value describes
a non-dimensional distance from the wall to the first element                               where τw is the wall shear stress, calculated according to Equation
node and therefore characterizes near-wall mesh quality. Refining                           (3), Umean is the mean velocity value corresponding to Qmean

Frontiers in Cardiovascular Medicine | www.frontiersin.org                              4                                                  June 2021 | Volume 8 | Article 670841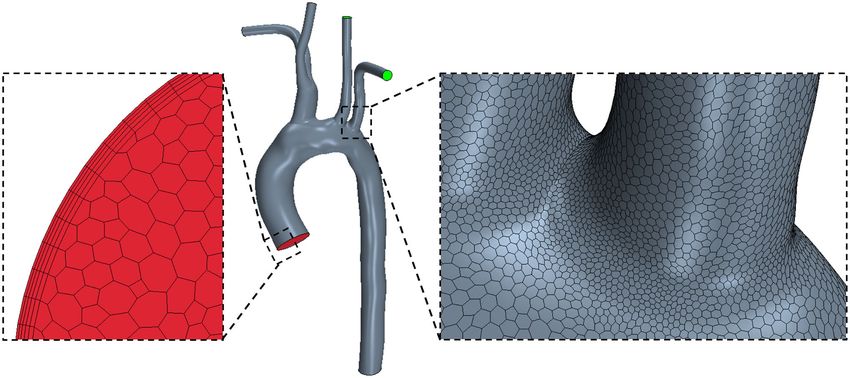
Johnston et al. Hemodynamic Abnormalities in TS Aortae
FIGURE 2 | STAR-CCM+ polyhedral mesh shown on a healthy (H1) model with zoomed views of the inlet mesh with a prism boundary layer (left) and the arch surface
mesh (right).
(Table 2), and Cf is the skin friction coefficient calculated per the aortic valve from the PC-MRI data, while the Reynolds and
Equation (4) (48). Womersley numbers were calculated post-segmentation using
the patient-specific inlet diameter (D) and the cardiac cycle
1 period (Table 2). The mean and peak Reynolds number (Re =
τw = Cf ρUmean 2 (3)
2 4Qρ/(πDµ) in TS patients varied, although the mean value for
the TS group (Remean =1296) was greater than the healthy group
12
0.9 !!16 (Remean = 1,182). Available Repeak data in the literature for TS
8 Re children reported a range of 3,980–6,560 in the ascending aorta,
Cf = 2 ∗ + 2.457 ln +
Re 7 meaning that the average value for our cohort (Remean = 4,568)
1/12 was at the lower end of this range (49). The Womersley number
16 !−1.5 is a non-dimensional expression of the pulsatile nature of blood
37530
(4) flow, and was calculated based on Equation (5):
Re
The adequacy of the y+ value was further confirmed from
s
D 2π f ρ
Equations (1, 2), based on the directly calculated maximum WSS Wo = (5)
values, which led to a y+ value much smaller than 1. 2 µ
Boundary Conditions
The flow exiting the aortic valve was segmented from the two- where f is the frequency of the cardiac cycle (s−1 ). The expected
dimensional time-resolved PC-MRI data with the use of Medviso Womersley number in the abdominal aorta of a young healthy
Segment software (http://medviso.com/segment), resulting in adult is 13 (50). At large Womersley numbers (above 10), the
a series of time-dependent flow waveforms (Figure 3). The shape of the velocity profile is relatively flat or plug-like, with the
highest peak flow rate was found for TS2 and TS3, and the maximum velocity no longer at the center (51). The computed
lowest peak flow rate for H1 (Figure 3A). To account for Womersley number (Table 2) for the healthy aortae (Wo = 15–
diameter and cardiac cycle variability, the normalized flow rates 16) is within the range of TS2-TS4 (Wo = 15–18). For TS1, with
were calculated (Figure 3B), where two of the healthy girls the largest aortic diameter, the Womersley number is the highest
demonstrated higher peak flow rates than the TS girls. The with a value of 28.
subject-specific volumetric flow waveforms (Figure 3A) were The percentage of the total flow rate distributed to each outlet
applied at the inlet boundary, which was defined at the location was calculated using Murray’s law due to the shortage of patient-
of the sinotubular junction. specific or literature values for children. In arterial bifurcations,
The cardiac cycle period (T) and mean and peak flow rates Murray’s law states that the flow is proportional to the diameter
(Qmean , Qpeak , respectively) were extracted from the location of of that vessel raised to a power, n (39). For the right subclavian
Frontiers in Cardiovascular Medicine | www.frontiersin.org 5 June 2021 | Volume 8 | Article 670841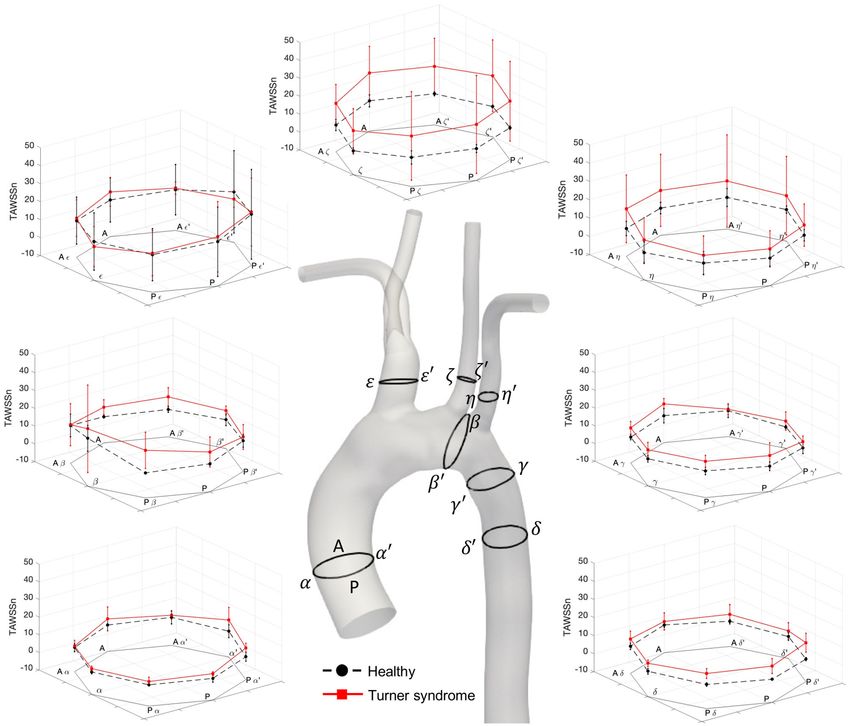
Johnston et al.                                                                                                              Hemodynamic Abnormalities in TS Aortae

 FIGURE 3 | PC-MRI derived (A) volumetric flow rate and (B) normalized waveforms at the aortic root during one cardiac cycle for healthy (H) and Turner syndrome
 (TS) girls. Insets: average data calculated from H1-H3 (black line) and TS1-TS4 (red line). Flow rate and time normalized by the mean flow rate and cardiac cycle
 period (see Table 2 for values).

branch, it can be expressed as:                                                       the combined pressure-implicit split-operator and semi-implicit
                                                                                      method for pressure-linked equations (PIMPLE) solver for
                       QRSA                                                           incompressible, transient flow. The flow was computed using
                                               =
        QRSA + QRCCA + QLCCA + QLSA + QDescAO                                         the wall-adapted local eddy-viscosity (WALE) large eddy
                        DRSA n                                                        simulation (LES) model, with temporal and spatial discretization
                                                                            (6)
           n        n
       DRSA + DRCCA + DLCCA n + DLSA n + DDescAO n                                    performed using second order accurate schemes (backward Euler
                                                                                      and central differencing, respectively). As the peak Reynolds
where QRSA , QRCCA , QLCCA , QLSA , QDescAo are the flow rates,                       numbers (Table 2) are in the transitional to turbulent range,
and DRSA , DRCCA , DLCCA , DLSA , DDescAo the diameters at the                        an investigation was made with a pulsatile laminar model, a k-
corresponding vessels. This relationship has been used in several                     omega SST model, and the LES (WALE) model for the same mesh
human CFD studies, and is well-known with an exponential                              (TS2). The wall shear stress results were qualitatively similar for
power of 3, hence the name “Murray’s cube law.” However,                              all three models, and marginally different quantitatively (0.14%
several authors have shown that a power of 2 is more valid                            difference in the integral of the WSS between the LES and laminar
in the case of larger vessels such as the aorta (52–54). Using a                      models, and 6% difference between the LES and k-omega SST
power of 2, the calculated combined flow percentage to the aortic                     models). However, the LES model more accurately captured the
branches was 34–59% for the healthy aortae and 32–55% for the                         flow features, especially during systole and early diastole. The
TS aortae, with the remaining flow distributed to the descending                      motivation for the use of the LES turbulence model was further
aorta (Table 3).                                                                      reinforced by other published studies on blood flow (55, 56).
   In line with other CFD studies in the aortic arch, the arterial                    Blood flow was simulated until time-periodicity was reached at
wall was presumed non-deformable and the no-slip BC was                               approximately five cardiac cycles with a time step (t) of 1 × 10⁻³
assigned (24, 25, 27, 28, 30, 31).                                                    s (satisfying mean Courant number < 1). Residual control for the
                                                                                      convergence criteria was set to 1 × 10⁻⁵ (57) for both pressure
Numerical Method                                                                      and velocity.
Throughout this study, the fluid was considered incompressible
and Newtonian, with a constant density and viscosity. The fluid
was governed by the time-dependent Navier-Stokes equations:
                                                                                      Shear Stress Parameters
                                ∇ ·−
                                   →
                                   u = 0                                    (7)       The characterization of shear stress during pulsatile flow is
                    ∂u                                                                commonly described with hemodynamic parameters such as
                  ρ    + ρ(−
                           →     u = −∇p + µ∇ 2 −
                           u · ∇)−
                                 →              →
                                                u                           (8)
                    ∂t                                                                the instantaneous wall shear stress (WSS) at various time
                                                                                      points in the cardiac cycle, the time-averaged WSS (TAWSS),
where −
      →u is the velocity vector and p the pressure.                                   the oscillatory shear index (OSI), the relative residence time
   Flow simulations were performed in the open-source                                 (RRT) and the transverse WSS (transWSS) (Equations 9–12,
software, OpenFOAM© (www.openfoam.org, version 6), using                              respectively). Such shear stress parameters can be used to identify

Frontiers in Cardiovascular Medicine | www.frontiersin.org                        6                                             June 2021 | Volume 8 | Article 670841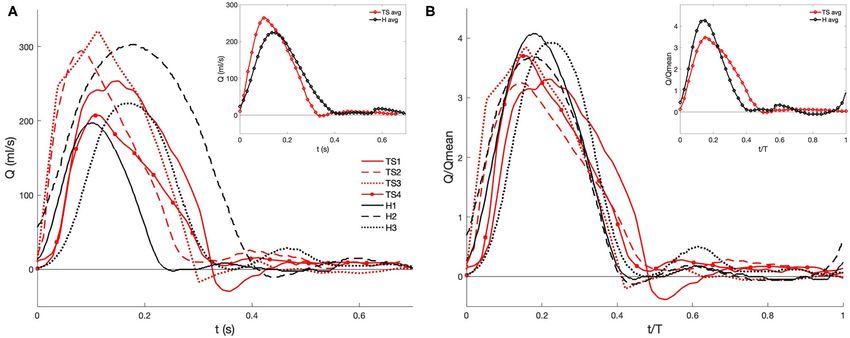
Johnston et al. Hemodynamic Abnormalities in TS Aortae
TABLE 3 | Outlet flow percentages for each individual case calculated using Murray’s Law [exponential power of 2, Equation (6)].
H1 H2 H3 TS 1 TS 2 TS 3 TS 4
QRSA 9% 14% 20% 6% 8% 10%
19%
QRCCA 9% 14% 14% 9% 12% 17%
QLCCA 7% 9% 19% 13% 9% 12% 10%
QLSA 9% 12% 21% 8% 8% 5% 15%
QDescAo 66% 51% 41% 45% 68% 63% 48%
areas where flow departs from a laminar, unidirectional pattern. at peak systole were, for the most part, laminar throughout the
aorta, except at the entrance to the LSA in both geometries, and
1 T the aberrant RSA in TS3, where small zones of recirculation were
Z
TAWSS = −
→
τw dt (9)
T formed. In the ascending aorta of all cases, the velocity magnitude
0
1
RT −
→
was greater at the inner wall. The majority of flow within the
1 T 0 τw dt arch of H1–H2, and to some extent in H3 and TS2, was of lower
OSI = 1− (10) magnitude than in the ascending aorta. In all TS aortae, the
1 T −
R →
2 τw dt
T 0 velocity magnitude for the majority of the arch was similar to,
RRT = [(1 − 2 OSI) TAWSS]−1 (11) or greater than, the flow in the ascending aorta. In the majority of
TS aortic models, flow velocity in the descending aorta was high,
R T−
→
1 T − τ dt
Z
w
transWSS = τw . −
→ →
n x R0 dt (12) with the exception of TS2.
T 0 T−
→
τ
0 w dt In Figure 4B, the non-dimensional velocity streamlines in the
aortic arch were visualized at maximum deceleration (t 2 ). In the
healthy aortae, flow was relatively laminar with the exception of
where − →
τw is the magnitude of the wall shear stress vector, and
−
→ the entrance to the LCCA and LSA branches in H3. In contrast,
n is the surface normal In this study, the TAWSS, OSI, RRT
a complex flow pattern with significant secondary flows was
and transWSS were taken over the fifth cardiac cycle, and both
observed for all TS aortic models. In the ascending aorta of
the WSS and TAWSS were normalized with respect to the mean
TS girls 2–4, the flow at maximum deceleration was laminar.
WSS at the inlet for each individual case. The OSI describes
However, in the TS girl with ascending aortic dilatation (TS1),
the degree of oscillatory flow ranging from zero, representing
the flow was highly disturbed in this region with significantly
unidirectional flow, to 0.5, representing reversing flow with no
low velocity values. In the aortic arch of TS3–TS4, vortical
mean shear direction (58). The RRT provides information on the
flow developed along the lesser curvature and extended to the
residence time of flow particles in close proximity to the wall and
entrance of the descending aorta, while in TS1 and TS2 the
is elevated in regions of low magnitude and high oscillatory WSS
region of vortical flow filled the majority of the aortic arch.
(59). RRT was normalized with respect to the surface integral
In the descending aorta of the TS girls, with the exception
average for the patient-specific aortic geometries. The transWSS
of TS1, vortical flow was present at the proximal wall with
quantifies multidirectional flow, with low values indicating that
undisturbed streamlines at the distal wall, with the inverse true
flow remains approximately parallel to a single axis throughout
for TS1. Unlike in the healthy geometries, the pattern of flow
the cardiac cycle and high values indicating large changes in flow
entering the TS aortic branches was unpredictable and highly
direction (60).
disturbed. Strong vortical flow patterns were observed in the
brachiocephalic branch of TS1, and recirculation regions at the
RESULTS proximal wall of TS2–TS4. The left common carotid artery of
TS1 and TS3, and the left subclavian branch of TS1–TS3 further
Blood Flow in the Aorta exhibit disturbed flow.
Blood flow was visualized in the geometries of Figure 1, using a
In Figure 4C, the non-dimensional velocity streamlines in the
combination of 3D streamlines (Figure 4) at three time points in
aortic arch were visualized at mid-diastole (t 3 ). For the healthy
the cardiac cycle, peak velocity (t 1 ), maximum deceleration (t 2 ),
aortae, the predominantly laminar flow pattern seen at maximum
and mid-diastole (t 3 ), and 2D and 3D vector-fields (Figure 5)
at peak velocity (t 1 ). Maximum deceleration was defined as the deceleration (Figure 4B) was replaced with strong, slow-moving
minimum rate of change of the velocity with respect to time. vortical motion throughout the entire vessel at mid-diastole
(Figure 4C). For TS1-TS2, there was little visible difference in
Velocity Streamlines the flow patterns between t2 (Figure 4B) and t3 (Figure 4C),
In Figure 4A, the non-dimensional velocity streamlines in the albeit with lower velocity values and a slight increase in vortical
aortic arch were visualized at peak velocity (t 1 ). In all three flow in the ascending aorta of TS2 and descending aorta of TS1.
healthy cases (H1-H3), the flow at peak systole was laminar For TS3, flow throughout all regions of the aorta and aortic
throughout the aortic arch, the descending aorta, and the three branches was clearly more disturbed in mid-diastole than in
major branches arising from the arch. A similar flow pattern was systole. Similar observations could be made for TS4, with the
observed for TS patients 1 and 4. In TS2 and TS3, the streamlines greatest flow disturbance seen in the ascending aorta and arch.
Frontiers in Cardiovascular Medicine | www.frontiersin.org 7 June 2021 | Volume 8 | Article 670841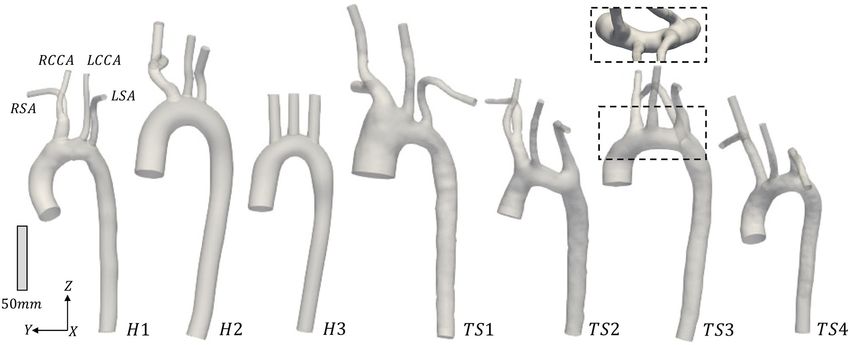
Johnston et al.                                                                                                                  Hemodynamic Abnormalities in TS Aortae

 FIGURE 4 | Velocity streamlines in the aortic arch of the healthy (H1-H3) and Turner syndrome (TS1-TS4) girls at (A) peak velocity (t1 ), (B) maximum deceleration (t2 ),
 and (C) mid-diastole (t3 ), colored by non-dimensional velocity magnitude that is normalized according to the average inlet velocity (Umean ), derived from patient
 PC-MRI data (anterior view). Note that the color legends in (B) and (C) were shifted compared to (A) to enhance visualization. For interpretation of the colored
 legends, please refer to the online version of the paper.

Through-Plane and In-Plane Velocities                                                    cases, perpendicular to the aortic centerline and relative to the
Furthermore, the through-plane and in-plane velocities were                              individual model inlet diameter, D: slice α-α′ was taken 1D
calculated for seven cross-sectional slices (α-α′ to η-η′ , Figure 5)                    upstream from the inlet; slice β-β′ was assumed midway between
of all models, at peak velocity (t1 ). The 3D through-plane                              the LCCA and LSA branches; γ-γ′ , 1D downstream from the LSA
velocity profiles were shown only for a healthy (H1) case,                               (TS3: from the LCCA); δ-δ′ , 2D downstream from the LSA (TS3:
in the corresponding geometry (left side of Figure 5), while                             from the LCCA); ε-ε′ , 0.5D upstream from the brachiocephalic
the cross-sections, colored by through-plane velocity contours                           junction; ζ-ζ′ , 0.5D upstream from the LCCA origin; and η-
and overlaid by in-plane velocity streamlines, were shown to                             η′ , 0.5D upstream from the LSA ostium. The slices in Figure 5
the right side of Figure 5 for all models. The cross-sectional                           are oriented so that the top and bottom edges correspond to
slices were considered at the same relative locations for all                            the anterior and posterior sides of the aorta, respectively, while

Frontiers in Cardiovascular Medicine | www.frontiersin.org                           8                                               June 2021 | Volume 8 | Article 670841
Johnston et al.                                                                                                                Hemodynamic Abnormalities in TS Aortae

 FIGURE 5 | (Left) Through-plane velocity profiles and (Right) contours of through-plane velocity overlayed by vectors of in-plane velocity on seven cross-sections α-α′
 to η-η′ along the aorta [locations shown on the 3D healthy (H1) model]. Contours colored by non-dimensional axial velocity at peak velocity for the healthy (H1–H3)
 and Turner syndrome (TS1–TS4) girls. Cross-sections are oriented looking downstream, with the top and bottom edges corresponding to the anterior and posterior
 sides of the aorta, respectively, and the left and right points as shown on the left. Cross-sections are not to scale.

the left and right points correspond to the greater and lesser                          asymmetry of the axial flow was present, it tended to be skewed
curvature of the arch, respectively, for slices α-α′ to δ-δ′ , and to                   toward a region of the lateral wall, as seen in the brachiocephalic
the outer and inner walls of the branches, for slices ε-ε′ to η-η′ .                    branch (ε-ε′ ) of TS2 and TS4, the left common carotid branch (ζ-
That is, all cross-sections are oriented looking downstream. In                         ζ′ ) of H3 and TS2, and the left subclavian branch (η-η′ ) of H1.
all figures, the velocity values were normalized according to the                       In the left common carotid branch (ζ-ζ′ ) of TS3, the flow velocity
corresponding mean inlet velocity magnitude.                                            was greatest posterior to the vessel center.
    As the velocity increases to a maximum during peak systole                               Figure 5 also revealed further information on the presence
(Figure 5), blood flow accelerates along the curvature of the arch,                     of secondary flows at peak velocity that were not visible in
with a tendency to skew toward the inner wall of the ascending                          Figure 4A. In the ascending aorta (α-α′ ), even though the flow
aorta (α′ ) as seen in TS1 and TS3, and to a lesser extent in H1                        was laminar for all cases presented (Figure 4A), the direction
and TS4. In H2 and TS2 the flow was skewed anterolaterally, and                         of secondary flow differed among the patients, although it was
in H3 the flow was uniform. In slice β-β′ , the flow was skewed                         never in the direction of the posterior wall. By the time the flow
laterally or posterolaterally for all healthy aortae, posteriorly for                   reached the distal end of the aortic arch (β-β′ ), the secondary
TS1 and TS3, laterally for TS4, and posteromedially for TS2. At                         flow direction changed for all geometries, except for H3 and TS1,
the entrance to the descending aorta, flow in the healthy aortae                        while recirculatory flow was present along the anterior, lateral,
was only slightly skewed: toward the outer curvature wall (γ) in                        or anterolateral walls in TS2–TS4, respectively. Secondary flow
H1 and H3, and toward the inner curvature wall (γ′ ) in H2. In                          in the first descending aortic slice (γ-γ′ ) of the healthy aortae
the TS aortae, flow was more visible skewed, specifically toward                        was present as a single recirculation zone at the posterolateral
the outer curvature wall in TS1 and TS3, and the anterior wall in                       wall of H3 exclusively. The same region of recirculating flow
TS2. In the remainder of the descending aorta (δ-δ′ ), the flow field                   was present in the first descending aortic slice of TS1. In TS2–
was well-structured with little asymmetry, except in TS2 where a                        TS4, secondary flow in slice γ-γ′ presented as a pair of counter-
region of higher velocity flow was located near the anteromedial                        rotating vortices at the posterior wall of TS2, the posterolateral
wall. For slices ε-ε′ to η-η′ , the individual branch anatomy of                        wall of TS3, and the anterolateral wall of TS4. An additional
each aorta influenced the axial and transverse flow fields. When                        region of recirculating flow was present at the anterior wall of

Frontiers in Cardiovascular Medicine | www.frontiersin.org                          9                                              June 2021 | Volume 8 | Article 670841
Johnston et al. Hemodynamic Abnormalities in TS Aortae
TS3. In slice δ-δ′ , taken further downstream in the descending The relatively homogenous distribution of TAWSSn on the
aorta, secondary flow direction changed from slice γ-γ′ in all healthy aortae was replaced with higher TAWSSn values and
geometries except for H2, but remained laminar in all. In the highly heterogeneous patterns on the walls of the Turner
majority of healthy aortic branches, excluding the BCA (ε-ε′ ) and syndrome geometries (Figure 6C). In the dilated aorta of TS1,
LSA (η-η′ ) in H2 and H3 respectively, in-plane velocities were low TAWSSn values (0–5) were concentrated at the proximal
laminar. The same was true for all aortic branches of TS1 and wall of the ascending aorta, downstream of the three branch
TS4. In TS2, flow recirculation was present in the brachiocephalic junctions, and at the proximal wall of the left subclavian artery.
branch (ε-ε′ ) near the anterior wall, and in the left subclavian Irregular low shear stresses were also found along the proximal
branch (η-η′ ) near the anteromedial wall. A single recirculation wall of the descending aorta among high shear stress regions.
region was present between the vessel center and medial wall Very high TAWSSn values dominated the three aortic branches
in the LCCA branch (ζ-ζ′ ), and between the vessel center and and almost circumferentially at two locations along the aorta, the
anterior wall in the LSA branch (η-η′ ) of TS3. first being between the left common carotid and left subclavian
branch, and the second at the transition from the arch to the
descending aorta. OSI values were highest at the proximal walls
Other Hemodynamic Metrics of the ascending and descending aorta, and downstream of the
The distribution of instantaneous normalized wall shear stress three branch junctions, more specifically at the anterior side. As
(WSSn) at peak systole (t1 ) and maximum deceleration (t2 ) low magnitude and high oscillatory wall shear stress leads to
are shown, respectively, in Figures 6A,B. Figure 6C displays an increase in the residence time of the blood adjacent to the
the normalized time-averaged wall shear stress (TAWSSn) for arterial wall, particularly elevated RRTn values were observed
all models. Additionally, the oscillatory shear index (OSI), at the ascending and descending aorta, and the distal wall of
normalized relative residence time (RRTn), and transverse WSS the brachiocephalic branch for TS1 (Figure 7B). The magnitude
(transWSS) are presented in Figures 7A–C. A further analysis on of transWSS in TS1 was overall very low, with higher values
the regional TAWSSn is provided in Figure 8. concentrated to the lesser curvature of the proximal arch and the
The WSSn distribution differed throughout the cardiac cycle aortic branches (Figure 7C). Case TS2 was defined by moderate-
for all models but was most visible at peak systole (Figure 6A) high TAWSSn and transWSS values (Figures 6C, 7C), extending
due to the lower values at maximum deceleration (Figure 6B). from the distal wall of the ascending aorta and throughout the
At peak systole (Figure 6A), each TS aortic geometry presented majority of the elongated arch. The lowest TAWSSn (Figure 6C),
a highly heterogeneous wall shear stress pattern compared to accompanied by high OSI (Figure 7A) and RRTn (Figure 7B),
the less diversified distribution on the aortic wall of the healthy and low transWSS (Figure 7C), was found along the proximal
cases. The WSSn pattern at maximum deceleration (Figure 6B) wall of the descending aorta. TS3 had a very heterogeneous
was less clear, with valuesJohnston et al. Hemodynamic Abnormalities in TS Aortae
FIGURE 6 | (A,B) Instantaneous normalized wall shear stress (WSSn ), and (C) normalized time-averaged wall shear stress (TAWSSn ) distributions shown (anterior
view) for the (H1-H3) healthy, and (TS1-T4) Turner syndrome cases. (A) Peak systole and (B) maximum deceleration. WSS and TAWSS were normalized with respect
to the mean WSS at the inlet for each individual case.
TAWSSn values averaged over each analysis plane for both groups range greatly throughout the systolic period (61, 62). The TS
(Table 4), the TS group had higher average values at every aortic girls included in this study had on average larger aortic root
location for both TAWSS and TAWSSn , with the exception of the diameters (23.66 ± 6.93 mm) and higher peak flow rates (269 ±
brachiocephalic branch (ε-ε′ ) for TAWSS. 49 ml/s, mean ± SD) than the healthy group (19.90 ± 2.48 mm
and 241 ± 55 ml/s respectively, mean ± SD). At peak systole,
DISCUSSION the velocity streamlines revealed the highest flow velocities in the
descending aorta of the TS geometries with the largest diameters
In our study, patient-specific blood flow simulations were (TS1 and TS3), but no vortical flow, except at some small
performed through the aortae of four Turner syndrome girls recirculation areas in the distal branches of TS3 (Figure 4A).
and three healthy girls. In healthy aortae, blood flow patterns The evolution of helical flow throughout peak to late systole is
Frontiers in Cardiovascular Medicine | www.frontiersin.org 11 June 2021 | Volume 8 | Article 670841Johnston et al. Hemodynamic Abnormalities in TS Aortae FIGURE 7 | (A) Oscillatory shear index (OSI), (B) normalized relative residence time (RRTn), based on the surface integral average for each individual case, and (C) transverse wall shear stress (transWSS) distributions shown (anterior view) for the (H1-H3) healthy and (TS1-T4) Turner syndrome cases. influenced by the curvature and non-planarity of the arch (63). with increasing age. One of our key findings in this study was that The visualization of multidirectional blood flow at maximum compared to the relatively homogeneous distribution of time- deceleration (Figure 4B), revealed increased vortical flow in the averaged wall shear stress on the healthy aortae, there was a highly arch, supra-aortic branches, and descending aorta of the TS heterogeneous pattern on the walls of the Turner syndrome patients compared to the healthy controls. This is likely due to the geometries. Taking into account the young age of our TS cohort anatomical variants of the TS aortae, rather than the transition (average age 13 ± 2 years) and their obesity level (75% of from peak systolic flow to diastolic flow, as the peak deceleration the TS girls examined here were obese or overweight, Table 1), value was higher for the healthy group (−13.73 m/s2 ± 1.52) than which is believed to accelerate the initiation and progression the TS group (−7.98 ± 1.40 m/s2 , mean ± SD). of endothelial dysfunction (64), the higher heterogeneity of Atherosclerosis has a non-uniform distribution within the WSS distribution found in TS girls may be an indication of arterial system and shows a predilection for arterial curvatures atherosclerotic disease manifesting earlier in life in these patients. and branch junctions. However, it is yet unclear why the Wall shear stress is a biomechanical force, predetermined endothelium is at times prone or immune to disease, particularly by fluid flow and arterial geometry, and a key player in the Frontiers in Cardiovascular Medicine | www.frontiersin.org 12 June 2021 | Volume 8 | Article 670841
Johnston et al.                                                                                                             Hemodynamic Abnormalities in TS Aortae

 FIGURE 8 | Normalized time-averaged wall shear stress (TAWSSn ) values at seven cross-sections along the aorta of the healthy (black, dotted lines, as average of
 H1–H3) and Turner syndrome girls (red, solid lines, as average of TS1–TS4). Cross-sections are located as shown on the 3D model of a healthy (H1) case. Standard
 deviation shown as error bars at each point.

pathogenesis of atherosclerosis (65). Aortic sites where blood                        consistency with the above theory. However, the time-averaged
flow departs from a laminar, unidirectional pattern, and wall                         WSS that we used here as part of our conclusions may not be
shear stresses are low and/or oscillatory, are often associated with                  the best indicator of disease predisposition, since atherogenesis
locations of atherosclerosis development (27, 63). However, this                      may also be associated with the time that endothelial cells are
link has primarily been established in the literature for adults                      exposed to WSS, rather than TAWSS, during the cardiac cycle
(27, 63). Studies on other species of younger age (e.g., mice                         (37). Additionally, atherogenesis may not depend only on low
and rabbits) do not necessarily follow the low and/or oscillatory                     and/or oscillatory WSS. Mass transfer of molecules such as Low
WSS theory (22, 37) and the underlying flow mechanisms related                        Density Lipoproteins (LDL) or Nitric Oxide (NO) between the
to children are not well-known in general. In our study, there                        blood and the endothelium may also play a role in the mechanism
appeared to be a correlation between the presence of aortic                           of atherogenesis, even though they might be related to WSS (37).
abnormalities, as seen in the TS group, and overall elevated
TAWSSn. Higher TAWSS values and increased vortical flows                              Comparison With Other Studies
may indicate a less atheroprotective environment in the young                         As far as we are aware, there are only three published studies on
TS patient cohort studied here, thus not showing complete                             the aortic flow of TS patients. In the 2014 study by Chen et al.

Frontiers in Cardiovascular Medicine | www.frontiersin.org                       13                                            June 2021 | Volume 8 | Article 670841
Johnston et al.                                                                                                           Hemodynamic Abnormalities in TS Aortae

TABLE 4 | Time-averaged wall shear stress (TAWSS), expressed in Pascals (Pa), and normalized time-averaged wall shear stress (TAWSSn ) averaged over each analysis
plane (α-α′ to η-η’) for the healthy (n = 3) and the Turner syndrome groups (n = 4).

Analysis plane                                               TAWSS, Pa                                                                TAWSSn

                                             H1–H3*                         TS1–TS4*                              H1–H3*                                TS1–TS4*

α-α′                                       1.04 ± 0.40                      1.86 ± 0.63                         3.65 ± 1.40                            6.55 ± 2.49
β-β′                                       2.19 ± 1.22                      2.86 ± 0.71                         7.70 ± 4.33                           13.29 ± 4.24
γ-γ′                                       1.23 ± 0.33                      2.08 ± 0.58                         4.24 ± 1.11                            8.74 ± 2.55
δ-δ′                                       1.03 ± 0.35                      1.94 ± 0.46                         3.63 ± 1.18                            8.60 ± 1.90
ε-ε′                                       3.50 ± 0.86                      2.52 ± 0.81                         13.38 ± 3.32                          13.94 ± 3.45
ζ-ζ′                                       1.79 ± 0.44                      3.83 ± 0.98                         6.42 ± 1.58                           20.36 ± 3.39
η-η′                                       1.59 ± 0.29                      1.97 ± 0.25                         5.81 ± 0.99                           13.13 ± 2.55

*Values are given as mean ± standard deviation.

(25), a steady flow rate of 4.5l/min was simulated through three                     and high OSI values. Additionally, the authors identified high
patient-specific Turner syndrome aortae (without patient age                         TAWSS (3 Pa) on the walls of the supra-aortic branches in their
information), with aortic abnormalities common to two aortic                         normal, dilated, and ETA geometries, and very high TAWSS (5–
geometries (TS1 and TS2) in our study. Although our study                            10 Pa) in the arch of the dilated and ETA models (49). We found
includes more complex simulations, accounting for patient-                           similar TAWSS values on the brachiocephalic walls of both the
specific transient flow, similarities can be made with Chen et al.                   healthy (3.50 ± 0.86 Pa) and TS groups (2.52 ± 0.86 Pa), on
(25) regarding the flow patterns: weak secondary flow in the                         the left common carotid walls of the TS group (3.83 ± 0.98 Pa)
ascending aorta (Figure 5 slice α-α’) became stronger throughout                     (Table 4), and on the arch cross-section of TS2 (5.28 ± 1.73 Pa).
the transverse aorta (Figure 5 slice β-β’); vortical flow was present                   The 4D-flow MRI study in the aorta of both healthy and
in the arch of the aortic model with ETA (TS2) (Figure 5 slice β-                    Turner syndrome girls by Arnold et al. (66) found significant
β’); and the flow in the descending aorta was remarkably different                   differences between the two cohorts (mean age patient group
between TS models (Figure 5 slices γ-γ’, δ-δ’). While we report                      16 ± 5 years for TS, 17 ± 4 years for healthy controls).
a large variation in the flow patterns of the descending aorta                       Specifically, during early and late systole, and early diastole,
among TS1–TS4, we further found much greater asymmetry                               helical flow was increased in the ascending and descending
in the through-plane velocities and stronger secondary flow,                         regions of TS individuals with significantly larger diameters.
especially at maximum deceleration, than Chen et al. (25). In the                    Peak systolic velocities did not vary significantly between the
same study, the authors determined three locations with low WSS                      TS and control group. In our study, the TS geometries with
(
Johnston et al. Hemodynamic Abnormalities in TS Aortae
law, utilized here to predict the outflow percentages, is based on cardiovascular changes associated with Turner syndrome is
fully developed laminar Poiseuille flow which is not the case for essential, and given the advantages of CFD in monitoring these
larger arteries where turbulence occurs (68, 69). However, in the changes, this method should be used alongside the standard
case of absent patient data at the model outlets, and a lack of Doppler echocardiography and magnetic resonance imaging in
Windkessel parameter values from the literature, especially for the clinical assessment of these patients.
children with Turner syndrome, Murray’s law was considered
the most appropriate method for the outlet boundary conditions.
CONCLUSION
Furthermore, it was difficult to validate the results of this study
since the patient data was obtained retrospectively. Prospective Personalized flow in seven patient-specific aortic geometries
MRI data obtained alongside Doppler ultrasound measurements (four TS, three healthy) was investigated in a comprehensive
of blood velocity would allow the validation of the numerical investigation of Turner syndrome children, using computational
results. Nonetheless, our numerical methodology has been used fluid dynamic methods. The visualization of multidirectional
extensively in the past by our group and other researchers for blood flow revealed increased vortical flow in the arch, supra-
biomedical engineering problems increasing our confidence in aortic branches, and descending aorta of the TS girls compared
the obtained results (20, 21, 37, 70). Finally, due to the limited to the healthy controls, but no significant difference was
availability of retrospective MRI data, especially for children, this found in the ascending aorta. This study found that young
study examined only a small cohort of TS patients at a specific Turner syndrome patients, at about 13 years of age, exhibit
age range, which undoubtedly limits the statistical significance of markedly elevated TAWSS values when compared to age-and
our results. gender-matched healthy controls, suggesting a correlation with
the presence of aortic abnormalities. The Turner syndrome
Clinical Significance girls, 75% of whom were obese or overweight, also display
Computational fluid dynamics can be a very powerful tool a highly heterogeneous pattern of TAWSS on the aorta,
in cardiovascular medicine. The evaluation of hemodynamic compared to the relatively homogeneous distribution of the
parameters of patient-specific aortic models that are challenging healthy aortae, which may be an indication of atherosclerotic
to measure in vivo can improve our understanding of disease manifesting earlier in life in these patients. These
cardiovascular disease processes, thus enhancing diagnostic results are not fully consistent with the low and/or oscillatory
capabilities, and progressing toward patient-specific precision WSS theory of atherogenesis, which nonetheless may depend
medicine. TS girls and women face a lifelong battle with a also on other factors, e.g., age, endothelial cells’ exposure
broad spectrum of cardiovascular concerns, from congenital time to WSS and not TAWSS, and mass transfer of LDL
heart abnormalities to an increased risk of hypertension, and NO molecules to the endothelium, as explained here.
ultimately reducing life expectancy. The current management of For TS children, age, obesity and aortic morphology may,
cardiovascular conditions in TS is the same as in the general therefore, play a key role in assessing cardiovascular risk. Further
population, due to a lack of understanding of the developmental investigations are required on the role of mechanobiological
origins of the cardiovascular manifestations seen specifically factors on atherogenesis in healthy and diseased children, and
in TS (4). The key clinical question is whether any of the the hemodynamics in different age groups of TS patients
cardiovascular risk in TS patients is modifiable. Currently, known in particular.
modifiable risk factors are hypertension and obesity and therefore
the treatment of hypertension and avoidance of being overweight
and obese is necessary for this group of patients. This begs the DATA AVAILABILITY STATEMENT
question - would this alter the flow dynamics more favorably too?
The original contributions presented in the study are included
In this study, the anatomical abnormalities observed in the aortae
in the article/supplementary material, further inquiries can be
of young TS girls, the majority (75%) of which were obese or
directed to the corresponding author.
overweight, were accompanied by abnormal flow patterns and
highly non-uniform distribution of wall shear stresses, which
may promote the development of cardiovascular diseases earlier ETHICS STATEMENT
in life. The type of analysis presented in this study could be used
clinically to predict patients at higher risk and therefore be more The studies involving human participants were reviewed
pro-active in lifestyle measures. Aortic dilatation, although rare, and approved by UK Health Research Authority, London–
is more common in TS patients and is catastrophic, associated Westminster Research Ethics Committee (IRAS Project ID:
with high mortality. Other risk factors are bicuspid aortic valves, 252866, REC Reference: 18/LO/2052). Written informed consent
hypertension and previous aortic surgeries, as well as pregnancy. to participate in this study was provided by the participants’ legal
It is still very difficult to predict even if aortic size index, a guardian/next of kin.
criterion to estimate the probability for aortic dissection in TS
patients, has been evaluated correctly (71). Pregnancy in some AUTHOR CONTRIBUTIONS
recommendations is contraindicated in all of TS due to this risk.
CFD modeling could help in this direction (72). Considering All roles according to CRediT (contributor roles taxonomy). LJ:
the excess of morbidity and mortality, the early diagnosis of methodology, software, formal analysis, writing—original
Frontiers in Cardiovascular Medicine | www.frontiersin.org 15 June 2021 | Volume 8 | Article 670841You can also read