Low-Calorie Sweetened Beverages and Cardiometabolic Health - Health Metrics
←
→
Page content transcription
If your browser does not render page correctly, please read the page content below
Circulation

                                                              AHA SCIENCE ADVISORY

                                                              Low-Calorie Sweetened Beverages
                                                              and Cardiometabolic Health
                                                              A Science Advisory From the American Heart Association
                                                              The American Diabetes Association supports this AHA Science Advisory and considers the clinical document to be of
                                                              educational value.

                                                              ABSTRACT: In the United States, 32% of beverages consumed by adults                   Rachel K. Johnson, PhD,
                                                              and 19% of beverages consumed by children in 2007 to 2010 contained                     MPH, RD, FAHA, Chair
                                                              low-calorie sweeteners (LCSs). Among all foods and beverages containing               Alice H. Lichtenstein, DSc,
                                                              LCSs, beverages represent the largest proportion of LCS consumption                     FAHA, Vice Chair
                                                              worldwide. The term LCS includes the 6 high-intensity sweeteners                      Cheryl A.M. Anderson,
                                                              currently approved by the US Food and Drug Administration and 2                         PhD, MPH, MS, FAHA
                                                              additional high-intensity sweeteners for which the US Food and Drug                   Jo Ann Carson, PhD, RDN,
                                                              Administration has issued no objection letters. Because of a lack of data               LD, FAHA
                                                                                                                                                    Jean-Pierre Després, PhD,
                                                              on specific LCSs, this advisory does not distinguish among these LCSs.
                                                                                                                                                      FAHA
                                                              Furthermore, the advisory does not address foods sweetened with LCSs.
                                                                                                                                                    Frank B. Hu, MD, PhD,
                                                              This advisory reviews evidence from observational studies and clinical trials           FAHA
                                                              assessing the cardiometabolic outcomes of LCS beverages. It summarizes                Penny M. Kris-Etherton,
Downloaded from http://ahajournals.org by on August 7, 2018

                                                              the positions of government agencies and other health organizations                     PhD, RD, FAHA
                                                              on LCS beverages and identifies research needs on the effects of LCS                  Jennifer J. Otten, PhD,
                                                              beverages on energy balance and cardiometabolic health. The use of LCS                  MS, RD
                                                              beverages may be an effective strategy to help control energy intake and              Amytis Towfighi, MD
                                                              promote weight loss. Nonetheless, there is a dearth of evidence on the                Judith Wylie-Rosett, EdD,
                                                              potential adverse effects of LCS beverages relative to potential benefits.              RD, FAHA
                                                              On the basis of the available evidence, the writing group concluded                   On behalf of the
                                                              that, at this time, it is prudent to advise against prolonged consumption               American Heart Associa-
                                                                                                                                                      tion Nutrition Commit-
                                                              of LCS beverages by children. (Although water is the optimal beverage
                                                                                                                                                      tee of the Council
                                                              choice, children with diabetes mellitus who consume a balanced diet
                                                                                                                                                      on Lifestyle and Car-
                                                              and closely monitor their blood glucose may be able to prevent excessive                diometabolic Health;
                                                              glucose excursions by substituting LCS beverages for sugar-sweetened                    Council on Cardiovascu-
                                                              beverages [SSBs] when needed.) For adults who are habitually high                       lar and Stroke Nurs-
                                                              consumers of SSBs, the writing group concluded that LCS beverages may                   ing; Council on Clinical
                                                              be a useful replacement strategy to reduce intake of SSBs. This approach                Cardiology; Council on
                                                              may be particularly helpful for persons who are habituated to a sweet-                  Quality of Care and
                                                              tasting beverage and for whom water, at least initially, is an undesirable              Outcomes Research;
                                                              option. Encouragingly, self-reported consumption of both SSBs and                       and Stroke Council
                                                              LCS beverages has been declining in the United States, suggesting that
                                                              it is feasible to reduce SSB intake without necessarily substituting LCS
                                                              beverages for SSBs. Thus, the use of other alternatives to SSBs, with a
                                                              focus on water (plain, carbonated, and unsweetened flavored), should be               Key Words: AHA Scientific Statement
                                                              encouraged.                                                                           ◼ beverages ◼ nutrition ◼ diet

                                                                                                                                                    © 2018 American Heart Association, Inc.

                                                                                                                                                    https://www.ahajournals.org/journal/circ

                                                              Circulation. 2018;138:00–00. DOI: 10.1161/CIR.0000000000000569                                       TBD TBD, 2018        e1
Johnson et al                                                                               LCS Beverages and Cardiometabolic Health

                                                                       W                                                              LCS TERMINOLOGY
                                                                                  ith the emergence of strong research evi-
CLINICAL STATEMENTS

                                                                                  dence linking consumption of sugar-sweet-
   AND GUIDELINES

                                                                                                                                      The AHA/American Diabetes Association 2012 statement
                                                                                  ened beverages (SSBs) to weight gain and
                                                                                                                                      used the term nonnutritive sweeteners to refer to LCSs,9
                                                                       adverse cardiometabolic health over the past decade,
                                                                                                                                      which included sweeteners that have a higher intensity
                                                                       some people are choosing beverages with low-calorie
                                                                                                                                      of sweetness per gram than caloric sweeteners such as
                                                                       sweeteners (LCSs) as alternatives. In contrast to SSBs,
                                                                                                                                      sucrose, corn syrups, and fruit juice concentrates. At that
                                                                       which are the largest source of added sugars in the
                                                                                                                                      time, 5 NNSs (aspartame, acesulfame-K, neotame, sac-
                                                                       American diet, LCS beverages contain few to no calo-
                                                                                                                                      charin, and sucralose) were classified as food additives
                                                                       ries, which makes them a potentially appealing substi-
                                                                                                                                      and subsequently given Generally Recognized as Safe
                                                                       tute for SSBs from a public health perspective. How-
                                                                       ever, the replacement of SSBs with LCS beverages has           status by the US Food and Drug Administration. Stevia
                                                                       been debated because of potential safety concerns1,2           had not received any determination regarding its Gener-
                                                                       and inconsistent findings regarding their health effects       ally Recognized as Safe status, but the US Food and Drug
                                                                       in observational studies and intervention trials.3–6           Administration issued no objection letters for a number
                                                                                                                                      of Generally Recognized as Safe notifications for stevia
                                                                                                                                      sweeteners.10 Since then, new sugar substitutes have been
                                                                       AMERICAN HEART ASSOCIATION’S                                   introduced. Some are NNSs, whereas others are reduced-
                                                                                                                                      energy sweeteners. Hence, in this AHA science advisory,
                                                                       PUBLISHED STATEMENTS AND                                       the term low-calorie sweeteners is used to refer to both
                                                                       ADVISORIES ON NONNUTRITIVE                                     zero- and reduced-energy food additives. The term low-
                                                                       SWEETENERS, ADDED SUGARS, AND                                  calorie sweeteners includes the 6 high-intensity sweeten-
                                                                       OVERALL DIET                                                   ers currently approved by the US Food and Drug Admin-
                                                                                                                                      istration (saccharin, aspartame, acesulfame-K, sucralose,
                                                                       The American Heart Association (AHA) recommends lim-
                                                                                                                                      neotame, and advantame) and 2 additional high-intensity
                                                                       iting the intake of added sugars to the equivalent of no
                                                                                                                                      sweeteners: steviol glycosides, obtained from the leaves
                                                                       more than 100 calories (25 g) per day in women and 150
                                                                                                                                      of the stevia plant (Stevia rebaudiana), and extracts ob-
                                                                       calories (37.5 g) per day in men,7 equivalent to 6 tea-
                                                                                                                                      tained from Siraitia grosvenorii Swingle fruit, also known
                                                                       spoons (2 tablespoons) and 9 teaspoons (3 tablespoons),
                                                                                                                                      as luo han guo or monk fruit.10 Other common terms for
                                                                       respectively. The AHA also recommends that children
                                                                                                                                      LCSs include nonnutritive sweeteners, artificial sweeten-
         Downloaded from http://ahajournals.org by on August 7, 2018

                                                                       and adolescents aged 2 to 18 years should limit their
                                                                                                                                      ers, sugar substitutes, and low-energy sweeteners. The
                                                                       intake of added sugars to
Johnson et al LCS Beverages and Cardiometabolic Health
science advisory does not distinguish among the dif- they are used to replace added sugars.18 However, this
CLINICAL STATEMENTS
ferent types of LCSs. Furthermore, it does not address AAP policy, which was published in March 2015, also
AND GUIDELINES
foods sweetened with LCSs. noted “data are scarce on long-term benefits for weight
management in children and adolescents or on the conse-
quences of long-term consumption.”18,19 A clinical report
POSITIONS OF GOVERNMENTAL from the AAP Committee on Nutrition, published in July
AGENCIES AND NONGOVERNMENTAL 2015,20 described the use of LCS beverages as controver-
sial for children and adolescents and an area of ongoing
HEALTH ORGANIZATIONS FOR LCSs
research and debate because they could (1) lead to taste
Every 5 years, the Secretaries for Health and Human Ser- preferences for and habitual consumption of sweetened
vices and the US Department of Agriculture update the beverages, (2) lead to reduced awareness of calorie intake,
Dietary Guidelines for Americans, guidelines that must be (3) be substituted for healthier beverages, and (4) alter gut
adhered to by federally supported food and nutrition pro- microbiota or increase glucose intolerance.20 This clinical
grams. The 2015 Dietary Guidelines Advisory Committee report stated that “there is no evidence of benefits of
reviewed the evidence to inform its conclusions about the these products over plain water, and artificially sweetened
relationship between LCS intake and body weight/obesity beverages currently have a limited place in a child’s diet.”20
and type 2 diabetes mellitus.14 The committee concluded A 2012 review by the American Medical Association’s
that (1) “moderate and generally consistent evidence Council on Science and Public Health addressed the evi-
from short-term RCTs [randomized controlled trials] con- dence for both the benefits and adverse effects of con-
ducted in adults and children supports that replacing sumption of LCS beverages.21 The American Medical As-
sugar-containing sweeteners with low-calorie sweeteners sociation concluded that there could be modest benefits
reduces calorie intake, body weight, and adiposity”; (2) of LCS beverages as an aid for weight loss and weight
“long-term observational studies conducted in children regulation. The report cited the following potential ad-
and adults provide inconsistent evidence of an associa- verse effects of LCS beverages: they contribute to the per-
tion between low-calorie sweeteners and body weight ception that individuals can consume more calories from
as compared to sugar-containing sweeteners”; and (3) other foods, foster a taste preference for sweet foods,
“long-term observational studies conducted in adults make naturally sweetened foods less appealing, and ad-
provide inconsistent evidence of an association between versely alter feelings of hunger and fullness. The report
low-calorie sweeteners and risk of type 2 diabetes.” noted mixed evidence for the link between diet beverage
Downloaded from http://ahajournals.org by on August 7, 2018
Two of the 5 primary 2015 to 2020 Dietary Guide- consumption and increased risks of metabolic syndrome,
lines for Americans specifically address added sugars. type 2 diabetes mellitus, and vascular events (stroke,
One is to “limit calories from added sugars and satu- myocardial infarction, and vascular death). The report
rated fats and reduce sodium intake.” The other is to stated that children could be at increased risk of these
“shift to healthier food and beverage choices” such harmful effects because of their size and cautioned that
thatJohnson et al LCS Beverages and Cardiometabolic Health
per concluded that in association with a weight loss or mean self-reported intake of SSBs was 2.03 servings per
CLINICAL STATEMENTS
maintenance plan, aspartame could help improve weight day (16.2 oz/d) among adults and 2.37 servings per day
AND GUIDELINES
loss and potentially be useful in long-term weight main- (19.0 oz/d) among children and adolescents. In 2013 to
tenance.25 Little evidence was identified on its effects in 2014, this declined to a low of 1.05 servings per day (8.4
children or other special populations. For both saccha- oz/d) among adults and 1.07 servings per day (8.6 oz/d)
rin and sucralose, the review found the evidence to be among children and adolescents (Table 3; Figure 2).
limited for either benefits or adverse effects. The review The decreasing trends in SSB consumption in children
identified no studies on the relationships between sac- and adolescents were previously reported in other stud-
charin or sucralose and energy density, nutrient quality, ies using NHANES conducted from 1999 to 2010.28–30
or behavior/cognitive effects and no evidence about its The present analysis is an update to these previous
effects in children. The review concluded that “non-nutri- findings. In addition, similar decreasing time trends in
tive sweeteners, when substituted for nutritive sweeten- SSB consumption were observed in another nationally
ers, may help consumers limit carbohydrate and energy representative survey, the Youth Risk Behavior Surveys,
intake as a strategy to manage blood glucose or weight.” in which the prevalence of daily soda consumption de-
creased from 33.8% to 20.4% in high school students
from 2007 through 2015.31 Interestingly, the Youth Risk
CONSUMPTION TRENDS AND USE Behavior Surveys found an accelerated decreasing trend
PATTERNS OF LCS BEVERAGES: in SSB consumption in younger participants (grade 9)
in more recent years (2011–2015). However, for LCS
NATIONAL HEALTH AND NUTRITION
beverages, to the best of our knowledge, the present
EXAMINATION SURVEY DATA analysis is the first report of time trends in US children
Data from the 2009 to 2012 National Health and Nutri- and adolescents. There could be biases attributable to
tion Examination Survey (NHANES) were used to assess the changes in dietary assessment methods in NHANES. For
prevalence of LCS consumption.26 On at least 1 of the 2 example, only 1-day 24-hour recall was used before
days of dietary recall, among children, 25% reported con- 2003, whereas a second 24-hour recall was added after
suming LCSs, and 19% reported consuming LCS bever- 2003; however, this change would not explain our find-
ages. Among adults, 41% reported consuming LCSs, and ings, because the observed trends were generally linear.
31% reported consuming LCS beverages. Females were
more likely to consume LCS beverages than males, as were
Downloaded from http://ahajournals.org by on August 7, 2018
people with high family incomes. People with overweight
LCS BEVERAGES AND
or obesity were more likely to consume LCSs than people CARDIOMETABOLIC RISK:
at a healthy (normal) weight. People of non-Hispanic white OBSERVATIONAL EVIDENCE
race/ethnicity reported higher consumption than people
of non-Hispanic black race and Hispanic ethnicity. People
LCS Beverages and Body Weight/
with diabetes mellitus were more likely to report consum- Adiposity
ing LCSs than people without diabetes mellitus. Some cross-sectional and prospective cohort studies
Trends in self-reported consumption of LCSs in bev- have found positive associations between LCS bev-
erages and foods have been analyzed in several stud- erage intake and weight gain. A meta-analysis of 9
ies. Among Americans ≥2 years of age, consumption of prospective cohort studies evaluated LCS use in foods
NNSs in both beverages and foods increased over the and beverages. Seven of the 9 cohorts examined in-
period from 1965 to 2004.27 Trends in self-reported con- takes of LCS beverages, whereas the other 2 cohorts
sumption of diet soda, LCS carbonated water, and LCS investigated intakes of only 1 type of LCS (saccha-
fruit drinks were assessed using NHANES data from 1999 rin). The intake of LCSs was not associated with body
to 2014 (Tables 1 and 2; Figure 1). LCS beverages include weight or fat mass but was significantly associated
these beverages, and thus, the self-reported intake of with a small increase in body mass index (BMI) (0.03
diet soda, LCS carbonated water, and LCS fruit drinks kg/m2; 95% confidence interval, 0.01–0.06 kg/m2).32
in NHANES was used as a proxy measure for LCS bever- Similarly, a systematic review of 14 prospective cohort
ages. One serving was defined as 8 oz of the beverage. studies evaluating the relationship of intake of LCS
Among adults, consumption of LCS beverages peaked beverages with risk of obesity, metabolic syndrome,
in 2005 to 2006, with a mean self-reported intake of and type 2 diabetes mellitus found that the majority
0.70 servings per day (5.6 oz/d), and declined to a low of studies reported positive associations. However, for
of 0.48 servings per day (3.8 oz/d) in 2013 to 2014. most studies, the associations were attenuated and
Among children and adolescents, mean self-reported became nonsignificant after adjustment for BMI.28,29
intake declined from its level in 1999 to 2000 (0.11 serv- Another review of 30 cohort studies found a positive
ings per day) to a low of 0.07 servings per day (0.56 association between LCS intake and body weight,
oz/d) in 2013 to 2014. By comparison, in 1999 to 2000, waist circumference, obesity, hypertension, metabolic
e4 TBD TBD, 2018 Circulation. 2018;138:00–00. DOI: 10.1161/CIR.0000000000000569Johnson et al LCS Beverages and Cardiometabolic Health
Table 1. Self-Reported Consumption of LCS Beverages (8-oz Servings/Day) in NHANES 1999 to 2014
CLINICAL STATEMENTS
P for
AND GUIDELINES
1999–2000 2001–2002 2003–2004 2005–2006 2007–2008 2009–2010 2011–2012 2013–2014 Trend
Adults (>19 y)
n 4232 4736 4447 4519 5416 5759 4800 5042
Mean (95% CI) 0.60 0.58 0.68 0.70 0.62 0.57 0.52 0.48 0.002
(0.49–0.71) (0.45–0.70) (0.54–0.81) (0.63–0.78) (0.53–0.72) (0.51–0.64) (0.45–0.60) (0.41–0.55)
Children and adolescents (2–19 y)
n 3828 4286 3825 4029 3105 3279 3134 3019
Mean (95% CI) 0.11 0.09 0.14 0.11 0.11 0.11 0.08 0.07 0.004
(0.09–0.14) (0.06–0.11) (0.10–0.17) (0.09–0.14) (0.07–0.14) (0.08–0.15) (0.05–0.12) (0.06–0.09)
Male adults
n 1975 2247 2135 2163 2661 2788 2394 2410
Mean (95% CI) 0.56 0.59 0.68 0.70 0.63 0.59 0.51 0.48 0.02
(0.42–0.71) (0.45–0.72) (0.48–0.88) (0.60–0.80) (0.52–0.74) (0.48–0.69) (0.40–0.63) (0.40–0.55)
Female adults
n 2257 2489 2312 2356 2755 2971 2406 2632
Mean (95% CI) 0.63 0.57 0.67 0.70 0.61 0.56 0.53 0.48 0.003
(0.53–0.74) (0.43–0.70) (0.57–0.78) (0.59–0.82) (0.49–0.74) (0.49–0.64) (0.43–0.64) (0.38–0.57)
Male children and adolescents
n 1937 2130 1902 1983 1610 1711 1586 1520
Mean (95% CI) 0.11 0.07 0.13 0.12 0.09 0.10 0.07 0.06Johnson et al LCS Beverages and Cardiometabolic Health
Table 2. NHANES/USDA Food Codes Used to Determine Data Provided To reduce the possibility of potential reverse causa-
CLINICAL STATEMENTS
in Table 1 and Figure 1
tion, some prospective studies with repeated measure-
AND GUIDELINES
USDA Food ments of diet and body weight have used “change of
Code Description Includes
change” analysis strategies to examine the associa-
92400100 Soft drink, NFS, diet Sugar free tion between changes in intake of LCS beverages and
92410250 Carbonated water, All flavors sugar-free, low- changes in body weight. For example, weight gain in
sweetened, with low- calorie water, diet tonic women who reported increasing their LCS soft drink in-
calorie or no-calorie water, Clearly Canadian
sweetener Zero take from 1991 to 1995 (1.59 kg) was significantly lower
92410320 Soft drink, cola, diet Diet Coke, Diet Pepsi, Tab,
than that for women who reported decreasing their LCS
Coke Zero, Pepsi One, not soft drink intake (4.25 kg), after adjustment for changes
specified as to caffeine, in other dietary factors. This finding was the opposite
Pepsi Max, sugar free
of the pattern of change observed for SSBs and weight
92410350 Soft drink, cola, Caffeine-free Diet Coke, gain reported previously.35 In a large pooled analysis of
decaffeinated, diet caffeine-free Diet Pepsi,
Diet Rite Cola, sugar free 3 cohorts of US men and women with repeated mea-
surements of diet and body weight over 4-year intervals
92410370 Soft drink, pepper type, Diet Dr. Pepper, Dr. Pepper
diet Ten, Pibb Zero, sugar free between 1986 and 2006, an increase of 1 serving per
92410400 Soft drink, pepper type, Caffeine-free Diet Dr.
day of LCS soda during each 4-year period was associ-
decaffeinated, diet Pepper, sugar free ated with 0.11 lb less weight gain, whereas increasing
92410420 Soft drink, cream soda, Sugar free the same amount of SSBs was associated with a 1.00-lb
diet greater weight gain.36 It was estimated that substituting
92410520 Soft drink, fruit flavored, Diet Slice, Diet Sprite, 1 serving per day of LCS beverages for the same amount
diet, caffeine free Diet 7-Up, Fresca, Diet of SSBs was associated with 0.47 kg less weight gain
7-Up, not specified
within each 4-year period.37
as to caffeine, Diet
Cherry 7-Up, Sierra Mist
Free, Sprite Zero, diet
fruit-flavored soda, all LCS Beverages and Type 2 Diabetes
flavors, Fanta Zero, Diet Mellitus
Tropicana Twister soda,
sugar free A meta-analysis of 10 prospective studies concluded that
consumption of 1 serving per day of LCS beverages was
Downloaded from http://ahajournals.org by on August 7, 2018
92410560 Soft drink, fruit flavored, Diet Mountain Dew, Diet
caffeine containing, diet Sunkist Orange, Diet Inca associated with a 25% increased risk of type 2 diabetes
Kola, Diet Cheerwine,
sugar free
mellitus.38 The association was attenuated to 8% after ad-
justment for adiposity, which implies that most of the asso-
92410620 Soft drink, ginger ale, diet Sugar free
ciation between LCS beverages and type 2 diabetes melli-
92410720 Soft drink, root beer, diet Sugar free
tus might be attributable to concurrent high adiposity. This
92410820 Soft drink, chocolate Canfield’s Diet Chocolate suggests that overweight and obese adults might prefer-
flavored, diet Fudge Soda, sugar free
entially report consuming more LCS beverages or might
92411610 Soft drink, cola, fruit or Sugar free, Diet Cherry have switched from SSBs to LCS beverages before the sur-
vanilla flavored, diet Coke, Diet Pepsi Wild
Cherry, Vanilla Coke Zero vey data were collected. Substantial heterogeneity among
92411620 Soft drink, cola, chocolate Caffeine free, sugar free
the cohorts and potential publication bias were detected
flavored, diet in this meta-analysis, further complicating interpretation of
the results.38 Investigators examined the relation of plain-
NFS indicates not further specified; NHANES, National Health and Nutrition
Examination Survey; and USDA, US Department of Agriculture. water intake and the substitution of plain water for SSBs
and fruit juices with incident type 2 diabetes mellitus in the
Nurses’ Health Study. Replacement of SSBs with LCS bever-
syndrome, type 2 diabetes mellitus, and cardiovascular ages was related to a 7% lower risk of type 2 diabetes mel-
events.33 However, this review had a number of limita- litus, and the replacement of SSBs with plain water, coffee,
tions, including potential reverse causation bias, dif- or low-fat milk was associated with the same or greater
ferent outcome measures, different types of LCSs, and magnitude of reduction in risk of diabetes mellitus.39
different lengths of follow-up times, which resulted
in too much variability to pool the results.34 Findings
from these observational studies may be confounded
LCS Beverages and Type 1 Diabetes
by related diet factors and lifestyle behaviors or bias Mellitus
attributable to reverse causation whereby people try- Limited research exists on the association of LCSs with
ing to control their weight consume LCS beverages CVD risk markers and obesity in people with type 1 dia-
as one strategy, with an overall approach to weight betes mellitus, although concern about the prevalence
control that is typically unsuccessful.6 of obesity in people with type 1 diabetes mellitus is sim-
e6 TBD TBD, 2018 Circulation. 2018;138:00–00. DOI: 10.1161/CIR.0000000000000569Johnson et al LCS Beverages and Cardiometabolic Health
CLINICAL STATEMENTS
AND GUIDELINES
Figure 1. Self-reported consumption of low-calorie sweetened (LCS) beverages (8-oz servings per day, mean and 95% confidence interval) from
1999 through 2014.
LCS beverages included diet soft drinks (all types), LCS carbonated water, and LCS fruit-flavored drinks. NHANES indicates National Health and Nutrition Examina-
tion Survey.
ilar to that of the general population.40–42 Bortsov et al42 cular events, notably stroke. An analysis of the Nurse’s
examined the relationship between LCS beverages and Health Study, a prospective cohort study of 84 085 wom-
Downloaded from http://ahajournals.org by on August 7, 2018
metabolic parameters in 1806 youth 10 to 22 years of en followed up for 28 years (1980–2008), and the Health
age with type 1 diabetes mellitus, of which 22% were Professionals Follow-Up Study, a prospective cohort
of a minority race/ethnicity (10% Hispanic, 8% blacks, study of 43 371 men followed up for 22 years (1986–
4% other races) and 48% were female. Higher intake 2008), showed that low-calorie soda consumption was
of LCS beverages was associated with higher hemo- associated with incident stroke (pooled relative risk of
globin A1c, total cholesterol, low-density lipoprotein total stroke for ≥1 serving of low-calorie soda per day
cholesterol, and triglycerides. These associations were versus none, 1.16; 95% confidence interval, 1.05–1.28).
partially confounded by BMI, saturated fat, and total Adjustment for diabetes mellitus and hypertension at-
fiber intake. Higher consumption of LCS beverages tenuated the association (1.09; 95% confidence interval,
was also associated with lower overall diet quality, and 1.04–1.14). Similarly, in the Northern Manhattan Study,46
the authors concluded that LCS beverage intake might a positive association was observed between baseline
have been a marker for an unhealthy lifestyle, which in daily intake of diet soft drinks and risk of incident vas-
turn was associated with worse metabolic and glycemic cular events, including stroke, myocardial infarction, and
control and CVD risk profile in these youth. vascular death. Although the authors attempted several
sensitivity analyses to reduce potential reverse causation,
the analyses were underpowered. Thus, they were not
LCS Beverages, CVD, and Brain/Cognitive
able to rule out reverse confounding or indication bias.
Outcomes For instance, people at increased risk of vascular events
To date, 2 large prospective studies43,44 with decades of because of preexisting vascular conditions might have
follow-up concluded that consumption of LCS bever- been advised to switch from SSBs to LCS beverages.46
ages was not associated with risk of coronary heart dis- Finally, a recent analysis of the Framingham Heart Study
ease43,44 or related biomarkers.43 Conversely, SSBs have Offspring cohort suggested that LCS beverage con-
been associated with increased risk of coronary heart sumption was associated with a higher risk of ischemic
disease, which implies a need to find healthy substi- stroke, all-cause dementia, and Alzheimer dementia.47
tutes for SSBs.7 Compared with daily intake of LCS beverages of 0 per
Three prospective analyses in 4 cohorts45 have shown week (reference category), the hazard ratios for drinking
an association between LCS beverages and risk of vas- ≥1 LCS beverage per day were 2.96 for ischemic stroke,
Circulation. 2018;138:00–00. DOI: 10.1161/CIR.0000000000000569 TBD TBD, 2018 e7Johnson et al LCS Beverages and Cardiometabolic Health
Table 3. Self-Reported Consumption of SSBs (8-oz Servings/Day) in NHANES 1999 to 2014
CLINICAL STATEMENTS
P for
AND GUIDELINES
1999–2000 2001–2002 2003–2004 2005–2006 2007–2008 2009–2010 2011–2012 2013–2014 trend
Adults (>19 y)
n 4232 4736 4447 4519 5416 5759 4800 5042
Mean (95% CI) 2.03 1.92 1.80 1.61 1.57 1.41 1.19 1.05Johnson et al LCS Beverages and Cardiometabolic Health
CLINICAL STATEMENTS
AND GUIDELINES
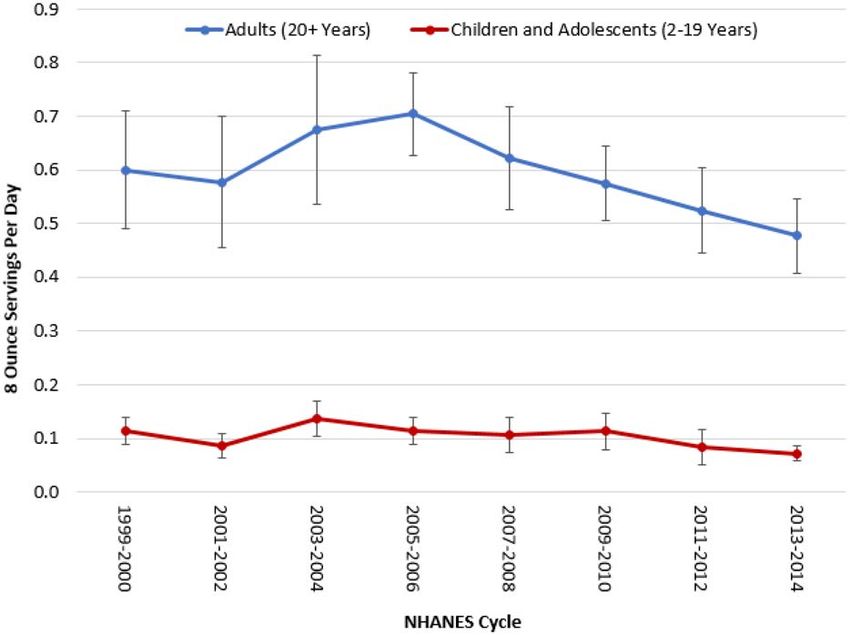
Figure 2. Self-reported consumption of sugar-sweetened beverages (SSBs) (8-oz servings per day, mean and 95% confidence interval) from 1999
through 2014.
SSBs included soft drinks, fruitades, sports drinks and other sugary beverages (fruit drinks, sweetened water, smoothie drinks, Frappuccino), and reduced-sugar
colas (half weight). NHANES indicates National Health and Nutrition Examination Survey.
2.47 for all-cause dementia, and 2.89 for Alzheimer de- causation. More research is needed on the relationship
Downloaded from http://ahajournals.org by on August 7, 2018
mentia, after adjustment for age, sex, total caloric in- between LCS beverages and brain health outcomes. Lit-
take, systolic blood pressure, treatment of hypertension, tle is known about the effects of substituting LCS bever-
prevalent CVD, atrial fibrillation, left ventricular hyper- ages for SSBs in people with type 1 diabetes mellitus and
trophy, total cholesterol, high-density lipoprotein choles- hyperglycemia associated with excess SSB intake.
terol, prevalent diabetes mellitus, and waist-to-hip ratio.
The authors were cautious in interpreting these findings
because of concerns about residual confounding and re-
LCS BEVERAGES AND
verse causality. In this cohort, diabetes mellitus and other CARDIOMETABOLIC RISK: CLINICAL
CVD risk factors were more prevalent in those who regu- TRIALS
larly consumed LCS beverages. Hence, it was not clear There are few randomized controlled trials (RCTs) rel-
whether LCS beverages increased the risk of stroke and evant to LCS beverages and CVD. The majority of these
dementia through diabetes mellitus or whether people
trials used LCS beverages as a replacement for SSBs.
with diabetes mellitus were more likely to consume LCS
None of the trials had sufficient sample size and patient
beverages. In addition, this study had few ethnic minori-
characteristics to examine cardiovascular outcomes as
ties, which limits its generalizability.
end points. Therefore, RCTs reported to date have ex-
amined CVD risk factors such as body weight, adiposity
Summary of Observational Evidence indices, and blood lipids.
Taken together, some observational data suggest a posi-
tive association between long-term consumption of LCS LCS Beverages and Body Weight
beverages with risk of type 2 diabetes mellitus and CVD; The effect of LCS beverages was assessed in 641 chil-
however, reverse causality and adiposity cannot be ruled dren from 4 to 11 years of age.48 Participants were ran-
out as driving factors in the observations. The positive domly assigned to receive one 8-oz can per day of an
association between LCS beverages and stroke risk was LCS beverage or SSB for a period of 18 months. At the
more consistent across cohorts. However, as stressed by end of the intervention period, the BMI Z score increased
the investigators, these results need to be interpreted by 0.15 SD units in the SSB group (body weight increase
cautiously because of methodological concerns with re- of 7.37 kg or ≈16 lb) and by 0.02 SD in the LCS bever-
gard to unmeasured or residual confounding and reverse age group (body weight increase of 6.35 kg or ≈14 lb).
Circulation. 2018;138:00–00. DOI: 10.1161/CIR.0000000000000569 TBD TBD, 2018 e9Johnson et al LCS Beverages and Cardiometabolic Health
Other adiposity indices (skinfold thicknesses, waist-to- that LCS beverages promoted a preference for sugary
CLINICAL STATEMENTS
height ratio, fat mass) were also significantly higher in food or drinks. These findings were consistent with
AND GUIDELINES
the SSB group compared with the LCS beverage group. those reported for a 12-week randomized behavioral
The effect of LCS beverages was also assessed in 224 weight loss treatment program that concluded that
overweight or obese adolescents who reported regu- water was not superior to LCS beverages in inducing
lar SSB consumption. Participants were randomized to a weight loss within the context of a comprehensive be-
1-year intervention to decrease SSB consumption (inter- havioral weight loss program.52 These results did not
vention group) or no intervention (control group). The support the position that LCS beverages promote the
primary outcomes were rate of weight gain after the consumption of other foods with a high energy con-
1-year intervention and after the 1-year postintervention tent.27,53 Of note, in multifaceted behavioral weight loss
follow-up period.49 The intervention group received home treatment programs, it is difficult to isolate the contri-
delivery every 2 weeks of bottled water and LCS bever- bution of LCS beverages per se from other changes in
ages, monthly parental motivational telephone calls, and 3 energy balance that lead to weight loss.
check-in visits. Intake of SSBs was significantly reduced in
the intervention compared with the control group at year
1 and remained lower than in the control group at the end LCS Beverages and Visceral Adiposity
of the 1-year postintervention follow-up period. However, and Ectopic Fat
although the rate of gain in BMI was significantly lower Imaging studies have shown that visceral adipose tissue
in the intervention group than in the control group at the accumulation, particularly when accompanied by ec-
end of the 1-year intervention period, the change in BMI topic fat deposition in liver, heart, and skeletal muscle,
was similar between the 2 groups at the end of the 1-year elevates CVD risk profiles in overweight and obese in-
postintervention follow-up. Although it was not possible dividuals.54,55 Therefore, a relevant question is whether
to precisely decipher the respective contributions of sub- long-term overconsumption of SSBs contributes to vis-
stituting water versus LCS beverages in place of SSBs to ceral or ectopic fat accumulation. In overweight or obese
the changes in body weight observed at the end of the adults, long-term overconsumption of fructose SSBs,
1-year intervention period, the investigators posited that provided as 25% of energy for 10 weeks, increased de
the change in intake of added sugars was the only variable novo lipogenesis, induced atherogenic dyslipidemia, in-
that could have contributed to the observed differences. creased circulating insulin levels, and increased visceral
A systematic review50 and a meta-analysis32 of trials
Downloaded from http://ahajournals.org by on August 7, 2018
adiposity.56 Although the relevance of this study to the
of relatively short duration and small sample size gener- consumption patterns of a large segment of the popula-
ally concluded that LCS beverages could contribute to tion has been questioned because of the extremely high
a modest weight loss and could therefore be a useful fructose content of the diet and its short duration, the
tool to help control body weight/fat, but longer follow- results of this trial suggested that body weight might
up studies are critically needed. Another review of 7 not be the optimal metric to fully appreciate the chang-
RCTs found no significant effect of LCSs on BMI and no es in cardiometabolic risk and body composition that
consistent effects on other measures of body compo- result from manipulating dietary added sugar.
sition33; however, these results should be treated with A 6-month RCT assessed the effects of replacing 1
caution because of a number of limitations. The RCTs serving of SSB per day with an isocaloric amount of
had great variability in exposure and outcome variables milk, LCS beverages, or water.57 Liver fat, visceral adi-
and a small number of participants, which increased pose tissue, and skeletal muscle fat were all significantly
the possibility that the results occurred by chance. In higher in the SSB group, although total body fat was
addition, the trials were rated as having a high risk of similar among the groups. LCS beverages were simi-
bias because the participants were not blinded to the lar to water in minimizing the accumulation of visceral
intervention and dropout rates were not provided.34 or ectopic fat. Replacing SSBs with either milk or an
A secondary analysis of a large RCT conducted in LCS beverage resulted in lower blood pressure than in
the Netherlands40 concluded that the children who the SSB group. Another imaging study examined the
benefited most from substituting LCS beverages for effect of substituting LCS beverages for SSBs in high
SSBs were those who at baseline were above the me- consumers of SSBs (at least 22 oz/d).58 At the end of the
dian BMI value, which suggests that children most sus- 12-week intervention period, replacing SSBs with LCS
ceptible to excess weight gain were those who ben- beverages resulted in a decrease in liver fat content.
efited the most from reducing their intake of SSBs.42
In a 6-month RCT involving 318 overweight and obese
adults, it was found that replacing SSBs with noncaloric Gut Microbiota
beverages such as LCS beverages or water resulted in One concern raised with the use of LCS beverages is
similar average weight losses for the 2 groups: 2.5% that they could have a negative impact on the gut mi-
and 2%, respectively.51 The study found no evidence crobiota and that such changes could have a deleteri-
e10 TBD TBD, 2018 Circulation. 2018;138:00–00. DOI: 10.1161/CIR.0000000000000569Johnson et al LCS Beverages and Cardiometabolic Health
ous effect on glucose tolerance.31,59 Little evidence on cern because intake patterns in animals do not repli-
CLINICAL STATEMENTS
this topic is available in humans.60 cate the day-to-day variation of humans. Thus, caution
AND GUIDELINES
is suggested before drawing conclusions with regard to
whether these findings, primarily conducted in rodents,
Summary of Clinical Trial Evidence are applicable to humans.
In summary, there is a lack of RCT evidence on the long-
term effects of consumption of LCS beverages on clini-
cal outcomes including cardiometabolic diseases and DATA GAPS AND RESEARCH NEEDS
mortality. It is notable that the longest RCT available Two major areas where additional research is needed were
provided LCS beverages to children 4 to 11 years of age identified by the 2015 Dietary Guidelines Advisory Com-
for 18 months.48 There is some short-term evidence that mittee: (1) identify sources and names of LCSs used in the
suggests that replacement of SSBs with LCS beverages food supply and quantify their consumption levels and
could help in the management of overweight and obe- trends in the US diet and (2) conduct prospective research
sity, particularly among high-risk overweight or obese on the association of LCS with health outcomes including
individuals with harmful levels of visceral or ectopic fat. clinical markers of CVD, with strong experimental designs
and multiple measures of LCS consumption. This would
enhance the development of evidence-based recommen-
LCS BEVERAGES AND dations regarding the use of LCS beverages in place of
CARDIOMETABOLIC RISK: SSBs for the promotion of optimal cardiometabolic health.
EXPERIMENTAL ANIMAL MODEL Additional work is needed to determine the mecha-
EVIDENCE nisms of action of LCSs to gain a better understanding
of any causal role they might play in CVD. Further pro-
The putative mechanisms that might explain the effects spective cohort studies and short-term RCTs, particular-
of LCSs on body weight have been addressed in several ly in children, are needed to elucidate the associations
reviews primarily focused on animal models.61–64 These between substituting SSBs with LCS beverages and the
include altered cephalic response to an energy load, development of risk factors for future CVD. It will be
increased food consumption, elevated rate of weight important to include analyses of beverage change pat-
gain, increased percent body fat, lower postprandial terns or beverage substitution analyses in new research.
thermogenesis, altered glucose homeostasis that in-
Downloaded from http://ahajournals.org by on August 7, 2018
There is a continuing need to examine the changing
cludes glucose dysregulation and insulin resistance, patterns of consumption of SSBs and LCS beverages,
changes in gut microbiota,64 and reduction of the ce- including a focus on exploring the patterns of consum-
phalic response to a caloric load in animal models.62,65 ers with chronically high intakes versus those whose
Although animal studies are informative, they are not consumption declines. Additionally, there is a need to
generalizable to humans. Nonetheless, animal studies address consumers’ increasing concerns about excess
can be useful for hypothesis testing in human studies. sugars intake and their demand for lower-sugar foods
Reports on the effect of LCSs on body weight in and beverages.
rodents have been inconsistent. A systematic review63
of 47 rodent studies of LCSs (compared with sugars or
unsweetened alternatives) concluded that body weight
significantly decreased in 22 studies, did not change
SUMMARY AND CONCLUSIONS
in 21 studies, and increased in 4 studies.63 Differences In the United States, LCS beverages make up 32%
among the studies included the LCS evaluated, route of and 19% of the beverages adults and children report
administration, and duration of the treatment. In addi- consuming, respectively. There is a scarcity of long-
tion, there could have been a repeat exposure effect, term RCTs of sufficient sample size and duration to
wherein animals exposed repetitively to either glucose adequately document the efficacy and safety of LCS
or LCSs were more likely to gain weight.63 beverages, particularly relative to SSBs, as a tool to help
maintain energy balance, control cardiometabolic risk
factors, and reduce risk of cardiovascular events. This
Summary of Animal Model Evidence lack of evidence does not mean that LCS beverages are
Collectively, the experimental animal evidence indicates or are not efficacious. The use of LCS beverages may be
that LCSs might have multiple biological effects that an effective strategy to help control energy intake and
alter energy intake and trigger insulin response. Inter- promote weight loss. Nonetheless, there is a dearth of
pretation of the animal model data for LCSs relative to evidence on the potential adverse effects of LCS bever-
potential human outcomes or mechanisms of action is ages relative to potential benefits. On the basis of the
challenging because of the scarcity of information on available evidence, the writing group concluded that,
the equivalency of responses. This is of particular con- at this time, it is prudent to advise against prolonged
Circulation. 2018;138:00–00. DOI: 10.1161/CIR.0000000000000569 TBD TBD, 2018 e11Johnson et al LCS Beverages and Cardiometabolic Health
consumption of LCS beverages by children. (Although ARTICLE INFORMATION
CLINICAL STATEMENTS
water is the optimal beverage choice, children with The American Heart Association makes every effort to avoid any actual or
AND GUIDELINES
diabetes mellitus who consume a balanced diet and potential conflicts of interest that may arise as a result of an outside relationship
or a personal, professional, or business interest of a member of the writing pan-
closely monitor their blood glucose may be able to pre- el. Specifically, all members of the writing group are required to complete and
vent excessive glucose excursions by substituting LCS submit a Disclosure Questionnaire showing all such relationships that might be
beverages for SSBs when needed.) For adults who are perceived as real or potential conflicts of interest.
This document was approved by the American Heart Association Science
habitually high consumers of SSBs, the writing group Advisory and Coordinating Committee on January 15, 2018, and the Ameri-
concluded that LCS beverages may be a useful replace- can Heart Association Executive Committee on February 22, 2018. A copy of
ment strategy to reduce intake of SSBs. This approach the document is available at http://professional.heart.org/statements by using
either “Search for Guidelines & Statements” or the “Browse by Topic” area.
may be particularly helpful for persons who are habitu- To purchase additional reprints, call 843-216-2533 or e-mail kelle.ramsay@
ated to a sweet-tasting beverage and for whom water, wolterskluwer.com.
at least initially, is an undesirable option. Encouragingly, The American Heart Association requests that this document be cited as
follows: Johnson RK, Lichtenstein AH, Anderson CAM, Carson JA, Després J-P,
self-reported consumption of both SSBs and LCS bever- Hu FB, Kris-Etherton PM, Otten JJ, Towfighi A, Wylie-Rosett J; on behalf of the
ages has been declining in the United States, suggest- American Heart Association Nutrition Committee of the Council on Lifestyle and
Cardiometabolic Health; Council on Cardiovascular and Stroke Nursing; Coun-
ing that it is feasible to reduce SSB intake without nec-
cil on Clinical Cardiology; Council on Quality of Care and Outcomes Research;
essarily substituting LCS beverages for SSBs. Thus, the and Stroke Council. Low-calorie sweetened beverages and cardiometabolic
use of other alternatives to SSBs, with a focus on water health: a science advisory from the American Heart Association. Circulation.
2018;138:e●●●–e●●●. doi: 10.1161/CIR.0000000000000569.
(plain, carbonated, and unsweetened flavored), should The expert peer review of AHA-commissioned documents (eg, scientific
be encouraged. The potential benefits from LCS bever- statements, clinical practice guidelines, systematic reviews) is conducted by the
ages as replacements for SSBs will not be fully realized if AHA Office of Science Operations. For more on AHA statements and guidelines
development, visit http://professional.heart.org/statements. Select the “Guide-
their use is accompanied by a compensatory increase in lines & Statements” drop-down menu, then click “Publication Development.”
energy intake from other sources. Additionally, an over- Permissions: Multiple copies, modification, alteration, enhancement, and/or
all healthful dietary pattern rich in vegetables, fruits, distribution of this document are not permitted without the express permission of
the American Heart Association. Instructions for obtaining permission are located
whole grains, nonfat or low-fat milk and dairy prod- at http://www.heart.org/HEARTORG/General/Copyright-Permission-Guidelines_
ucts, seafood, legumes, and nuts and low in red and UCM_300404_Article.jsp. A link to the “Copyright Permissions Request Form”
processed meats, added sugars (not more than 10% of appears on the right side of the page.
total energy), saturated fat, sodium, and refined grains
is advised.66 It is clear that there is a need for further Acknowledgments
Downloaded from http://ahajournals.org by on August 7, 2018
research on the effects of LCS beverages as they pertain The authors thank Heather M. Alger, PhD, Director of Risk Factor Programs,
American Heart Association, and Dong Wang, MD, ScD, postdoctoral fellow
to energy balance, cardiometabolic risk factors, and risk at the Department of Nutrition, Harvard T.H. Chan School of Public Health, for
of CVD and other chronic diseases. their expert assistance in the preparation of the manuscript.
Disclosures
Writing Group Disclosures
Other Speakers’ Consultant/
Writing Group Research Bureau/ Expert Ownership Advisory
Member Employment Research Grant Support Honoraria Witness Interest Board Other
Rachel K. Johnson The University of None None None None None None None
Vermont
Alice H. Lichtenstein Tufts University Jean None None None None None None None
Mayer USDA Human
Nutrition Research
Center on Aging
Cheryl A.M. Anderson University of California None None None None None None None
at San Diego
Jo Ann Carson University of Texas None None None None None None None
Southwestern Medical
Center
Jean-Pierre Després Centre de Recherché de CPAC and Heart and None None None None None None
l’Institut Universitaire Stroke Foundation*;
de Cardiologie et CHIR*; Fondation de
de Pneumologie de l’IUCPQ*; FRQS*; Heart
Québec, Canada & Stroke Foundation of
Canada*
Frank B. Hu Harvard T.H. Chan None None None None None None None
School of Public Health
(Continued )
e12 TBD TBD, 2018 Circulation. 2018;138:00–00. DOI: 10.1161/CIR.0000000000000569Johnson et al LCS Beverages and Cardiometabolic Health
Writing Group Disclosures Continued
CLINICAL STATEMENTS
Other Speakers’ Consultant/
AND GUIDELINES
Writing Group Research Bureau/ Expert Ownership Advisory
Member Employment Research Grant Support Honoraria Witness Interest Board Other
Penny M. Kris-Etherton Pennsylvania State None None None None None None None
University
Jennifer J. Otten University of None None None None None None None
Washington School of
Public Health
Amytis Towfighi University of Southern None None None None None None None
California
Judith Wylie-Rosett Albert Einstein College None None None None None None None
of Medicine
This table represents the relationships of writing group members that may be perceived as actual or reasonably perceived conflicts of interest as reported on
the Disclosure Questionnaire, which all members of the writing group are required to complete and submit. A relationship is considered to be “significant” if
(a) the person receives $10 000 or more during any 12-month period, or 5% or more of the person’s gross income; or (b) the person owns 5% or more of the
voting stock or share of the entity, or owns $10 000 or more of the fair market value of the entity. A relationship is considered to be “modest” if it is less than
“significant” under the preceding definition.
*Significant.
Reviewer Disclosures
Speakers’ Consultant/
Other Research Bureau/ Expert Ownership Advisory
Reviewer Employment Research Grant Support Honoraria Witness Interest Board Other
Christopher Gardner Stanford University None None None None None None None
Samuel S. Gidding Alfred I. duPont NIH (TODAY study NIH (CARDIA None None None None Nemours
Hospital for Children echocardiography echocardiography Foundation
reading center)† reading center)†; (Cardiology
NIH (Center for Division
Translational Head)†
Research)*
Downloaded from http://ahajournals.org by on August 7, 2018
Barbara V. Howard MedStar Health None None None None None None None
Research Institute
David Maahs Stanford University Medtronic, None None None None Insulet None
Dexcom, Bigfoot Corporation,
Biomedical, Abbott
Roche, Insulet Diabetes Care,
Corporation: all Helmsley
research support Charitable
to institution Trust
Melinda Maryniuk Joslin Diabetes None None None None None None None
Center
Joshua J. Neumiller Washington State None None None None None None None
University
Sacha Uelmen American Diabetes None None None None None None None
Association
This table represents the relationships of reviewers that may be perceived as actual or reasonably perceived conflicts of interest as reported on the Disclosure
Questionnaire, which all reviewers are required to complete and submit. A relationship is considered to be “significant” if (a) the person receives $10 000 or more
during any 12-month period, or 5% or more of the person’s gross income; or (b) the person owns 5% or more of the voting stock or share of the entity, or owns
$10 000 or more of the fair market value of the entity. A relationship is considered to be “modest” if it is less than “significant” under the preceding definition.
*Modest.
†Significant.
3. Crichton G, Alkerwi A, Elias M. Diet soft drink consumption is associ-
REFERENCES ated with the metabolic syndrome: a two sample comparison. Nutrients.
1. Soffritti M, Padovani M, Tibaldi E, Falcioni L, Manservisi F, Belpoggi F. The 2015;7:3569–3586. doi: 10.3390/nu7053569.
carcinogenic effects of aspartame: the urgent need for regulatory re-eval- 4. Fowler SP, Williams K, Resendez RG, Hunt KJ, Hazuda HP, Stern MP.
uation. Am J Ind Med. 2014;57:383–397. doi: 10.1002/ajim.22296. Fueling the obesity epidemic? Artificially sweetened beverage use and
2. Mishra A, Ahmed K, Froghi S, Dasgupta P. Systematic review of the rela- long-term weight gain. Obesity (Silver Spring). 2008;16:1894–1900. doi:
tionship between artificial sweetener consumption and cancer in humans: 10.1038/oby.2008.284.
analysis of 599,741 participants. Int J Clin Pract. 2015;69:1418–1426. doi: 5. Narain A, Kwok CS, Mamas MA. Soft drinks and sweetened bever-
10.1111/ijcp.12703. ages and the risk of cardiovascular disease and mortality: a system-
Circulation. 2018;138:00–00. DOI: 10.1161/CIR.0000000000000569 TBD TBD, 2018 e13Johnson et al LCS Beverages and Cardiometabolic Health
atic review and meta-analysis. Int J Clin Pract. 2016;70:791–805. doi: 21. American Medical Association. Report 5 of the Council on Science and
CLINICAL STATEMENTS
10.1111/ijcp.12841. Public Health (A-12): Taxes on Beverages With Added Sweeteners (Reso-
AND GUIDELINES
6. Pereira MA. Diet beverages and the risk of obesity, diabetes, and cardio- lution 417-A-11; Reference Committee D). 2012. https://www.ama-
vascular disease: a review of the evidence. Nutr Rev. 2013;71:433–440. assn.org/sites/default/files/media-browser/public/about-ama/councils/
doi: 10.1111/nure.12038. Council%20Reports/council-on-science-public-health/a12-csaph5-sugartax.
7. Johnson RK, Appel LJ, Brands M, Howard BV, Lefevre M, Lustig RH, Sacks pdf. Accessed February 28, 2017.
F, Steffen LM, Wylie-Rosett J; on behalf of the American Heart Associa- 22. American Medical Association House of Delegates. H-150.933: Taxes on
tion Nutrition Committee of the Council on Nutrition, Physical Activity, beverages with added sweeteners. In: Recognition of obesity as a dis-
and Metabolism and the Council on Epidemiology and Prevention. Di- ease. Resolution 420 (A-13; CSAPH Rep. 5, A-12). May 2013:4. https://
etary sugars intake and cardiovascular health: a scientific statement from www.npr.org/documents/2013/jun/ama-resolution-obesity.pdf. Accessed
the American Heart Association. Circulation. 2009;120:1011–1020. doi: February 28, 2017.
10.1161/CIRCULATIONAHA.109.192627. 23. Evert AB, Boucher JL, Cypress M, Dunbar SA, Franz MJ, Mayer-Davis EJ,
8. Vos MB, Kaar JL, Welsh JA, Van Horn LV, Feig DI, Anderson CAM, Pa- Neumiller JJ, Nwankwo R, Verdi CL, Urbanski P, Yancy WS Jr; American
tel MJ, Cruz Munos J, Krebs NF, Xanthakos SA, Johnson RK; on be- Diabetes Association. Nutrition therapy recommendations for the man-
half of the American Heart Association Nutrition Committee of the agement of adults with diabetes. Diabetes Care. 2013;36:3821–3842.
Council on Lifestyle and Cardiometabolic Health; Council on Clinical doi: 10.2337/dc13-2042.
Cardiology; Council on Cardiovascular Disease in the Young; Coun- 24. American Diabetes Association. 4. Lifestyle management: standards of
cil on Cardiovascular and Stroke Nursing; Council on Epidemiology medical care in diabetes—2018. Diabetes Care. 2018;41(suppl1):S38–
and Prevention; Council on Functional Genomics and Translational S50.
Biology; and Council on Hypertension. Added sugars and cardiovas- 25. Fitch C, Keim KS; Academy of Nutrition and Dietetics. Position of the
cular disease risk in children: a scientific statement from the Ameri- Academy of Nutrition and Dietetics: use of nutritive and nonnutritive
can Heart Association. Circulation. 2017;135:e1017–e1034. doi: sweeteners. J Acad Nutr Diet. 2012;112:739–758. doi: 10.1016/j.jand.
10.1161/CIR.0000000000000439. 2012.03.009.
9. Gardner C, Wylie-Rosett J, Gidding SS, Steffen LM, Johnson RK, Reader 26. Sylvetsky AC, Jin Y, Clark EJ, Welsh JA, Rother KI, Talegawkar SA. Con-
D, Lichtenstein AH; on behalf of the American Heart Association Nutri- sumption of low-calorie sweeteners among children and adults in the Unit-
tion Committee of the Council on Nutrition, Physical Activity and Me- ed States. J Acad Nutr Diet. 2017;117:441–448.e2. doi: 10.1016/j.jand.
tabolism, Council on Arteriosclerosis, Thrombosis and Vascular Biology, 2016.11.004.
Council on Cardiovascular Disease in the Young, and the American Dia- 27. Mattes RD, Popkin BM. Nonnutritive sweetener consumption in humans:
betes Association. Nonnutritive sweeteners: current use and health per- effects on appetite and food intake and their putative mechanisms. Am J
spectives: a scientific statement from the American Heart Association and Clin Nutr. 2009;89:1–14. doi: 10.3945/ajcn.2008.26792.
the American Diabetes Association. Circulation. 2012;126:509–519. doi: 28. Gu X, Tucker KL. Dietary intakes of the US child and adolescent
10.1161/CIR.0b013e31825c42ee. population and their adherence to the current dietary guidelines:
10. US Food and Drug Administration. High-intensity sweeteners. 2014. https:// trends from 1999 to 2012. FASEB J. 2017;31(suppl):29.1. Abstract.
www.fda.gov/food/ingredientspackaginglabeling/foodadditivesingredients/ http://www.fasebj.org/doi/abs/10.1096/fasebj.31.1_supplement.29.1.
ucm397716.htm. Accessed November 1, 2017. Accessed February 28, 2017.
11. Popkin BM, Hawkes C. Sweetening of the global diet, particularly bever- 29. Han E, Powell LM. Consumption patterns of sugar-sweetened bever-
ages: patterns, trends, and policy responses. Lancet Diabetes Endocrinol. ages in the United States. J Acad Nutr Diet. 2013;113:43–53. doi:
2016;4:174–186. doi: 10.1016/S2213-8587(15)00419-2. 10.1016/j.jand.2012.09.016.
Downloaded from http://ahajournals.org by on August 7, 2018
12. Piernas C, Ng SW, Popkin B. Trends in purchases and intake of foods 30. Kit BK, Fakhouri TH, Park S, Nielsen SJ, Ogden CL. Trends in sugar-
and beverages containing caloric and low-calorie sweeteners over the sweetened beverage consumption among youth and adults in the United
last decade in the United States. Pediatr Obes. 2013;8:294–306. doi: States: 1999-2010. Am J Clin Nutr. 2013;98:180–188. doi: 10.3945/
10.1111/j.2047-6310.2013.00153.x. ajcn.112.057943.
13. Sylvetsky AC, Rother KI. Trends in the consumption of low-calorie sweet- 31. Miller G, Merlo C, Demissie Z, Sliwa S, Park S. Trends in beverage con-
eners. Physiol Behav. 2016;164(part B):446–450. doi: 10.1016/j.physbeh. sumption among high school students: United States, 2007-2015.
2016.03.030. MMWR Morb Mortal Wkly Rep. 2017;66:112–116. doi: 10.15585/mmwr.
14. Dietary Guidelines Advisory Committee. Scientific report of the 2015 Di- mm6604a5.
etary Guidelines Advisory Committee: advisory report to the Secretary of 32. Miller PE, Perez V. Low-calorie sweeteners and body weight and com-
Health and Human Services and the Secretary of Agriculture. Washington, position: a meta-analysis of randomized controlled trials and prospec-
DC: US Department of Agriculture, Agricultural Research Service; Febru- tive cohort studies. Am J Clin Nutr. 2014;100:765–777. doi: 10.3945/
ary 2015. https://health.gov/dietaryguidelines/2015-scientific-report/PDFs/ ajcn.113.082826.
Scientific-Report-of-the-2015-Dietary-Guidelines-Advisory-Committee. 33. Azad MB, Abou-Setta AM, Chauhan BF, Rabbani R, Lys J, Copstein L,
pdf. Accessed May 31, 2017. Mann A, Jeyaraman MM, Reid AE, Fiander M, MacKay DS, McGavock J,
15. American Dental Association House of Delegates. Policies and recommen- Wicklow B, Zarychanski R. Nonnutritive sweeteners and cardiometabolic
dations on diet and nutrition. October 2016. American Dental Association health: a systematic review and meta-analysis of randomized controlled
website. http://www.ada.org/en/about-the-ada/ada-positions-policies-and- trials and prospective cohort studies. CMAJ. 2017;189:E929–E939. doi:
statements/policies-and-recommendations-on-diet-and-nutrition. Accessed 10.1503/cmaj.161390.
February 28, 2017. 34. Benefits of artificial sweeteners unclear. In: Behind The Headlines: Health
16. Reddy A, Norris DF, Momeni SS, Waldo B, Ruby JD. The pH of bever- News from NHS Choices. July 19, 2017. PubMed Health website. https://
ages in the United States. J Am Dent Assoc. 2016;147:255–263. doi: www.ncbi.nlm.nih.gov/pubmedhealth/behindtheheadlines/news/2017-
10.1016/j.adaj.2015.10.019. 07-19-benefits-of-artificial-sweeteners-unclear/. Accessed October 30,
17. American Academy of Pediatrics. Sweeteners and sugar substitutes: can I 2017.
give my children foods sweetened with no- and low-calories sweeteners? 35. Schulze MB, Manson JE, Ludwig DS, Colditz GA, Stampfer MJ, Willett WC,
2011. HealthyChildren.org website. https://www.healthychildren.org/ Hu FB. Sugar-sweetened beverages, weight gain, and incidence of type 2
English/healthy-living/nutrition/Pages/Sweeteners-and-Sugar-Substitutes. diabetes in young and middle-aged women. JAMA. 2004;292:927–934.
aspx. Accessed February 28, 2017. doi: 10.1001/jama.292.8.927.
18. Council on School Health; Committee on Nutrition. Snacks, sweetened 36. Mozaffarian D, Hao T, Rimm EB, Willett WC, Hu FB. Changes in diet and
beverages, added sugars, and schools. Pediatrics. 2015;135:575–583. lifestyle and long-term weight gain in women and men. N Engl J Med.
doi: 10.1542/peds.2014-3902. 2011;364:2392–2404. doi: 10.1056/NEJMoa1014296.
19. Foreyt J, Kleinman R, Brown RJ, Lindstrom R. The use of low-calorie 37. Pan A, Malik VS, Hao T, Willett WC, Mozaffarian D, Hu FB. Changes in
sweeteners by children: implications for weight management. J Nutr. water and beverage intake and long-term weight changes: results from
2012;142:1155S–1162S. doi: 10.3945/jn.111.149609. three prospective cohort studies. Int J Obes (Lond). 2013;37:1378–1385.
20. Daniels SR, Hassink SG; Committee on Nutrition. The role of the pediatri- doi: 10.1038/ijo.2012.225.
cian in primary prevention of obesity. Pediatrics. 2015;136:e275–e292. 38. Imamura F, O’Connor L, Ye Z, Mursu J, Hayashino Y, Bhupathiraju SN,
doi: 10.1542/peds.2015-1558. Forouhi NG. Consumption of sugar sweetened beverages, artificially
e14 TBD TBD, 2018 Circulation. 2018;138:00–00. DOI: 10.1161/CIR.0000000000000569You can also read