Simulating permeability reduction by clay mineral nanopores in a tight sandstone by combining computer X-ray microtomography and focussed ion beam ...
←
→
Page content transcription
If your browser does not render page correctly, please read the page content below
Solid Earth, 12, 1–14, 2021
https://doi.org/10.5194/se-12-1-2021
© Author(s) 2021. This work is distributed under
the Creative Commons Attribution 4.0 License.

Simulating permeability reduction by clay mineral nanopores in a
tight sandstone by combining computer X-ray microtomography
and focussed ion beam scanning electron microscopy imaging
Arne Jacob1 , Markus Peltz2 , Sina Hale3 , Frieder Enzmann1 , Olga Moravcova1 , Laurence N. Warr2 , Georg Grathoff2 ,
Philipp Blum3 , and Michael Kersten1
1 Geosciences   Institute, Johannes Gutenberg-University, J.-J. Becherweg 21, 55099 Mainz, Germany
2 Institute of Geography and Geology, University Greifswald, Friedrich-Ludwig-Jahn-Str. 17a, 17487 Greifswald, Germany
3 Institute of Applied Geosciences (AGW), Karlsruhe Institute of Technology (KIT),

Kaiserstraße 12, 76131 Karlsruhe, Germany

Correspondence: Arne Jacob (a.jacob@uni-mainz.de)

Received: 9 September 2020 – Discussion started: 30 September 2020
Revised: 23 November 2020 – Accepted: 25 November 2020 – Published: 11 January 2021

Abstract. Computer X-ray microtomography (µXCT) rep-              1   Introduction
resents a powerful tool for investigating the physical prop-
erties of porous rocks. While calculated porosities deter-        Depositional environment and subsequent diagenetic alter-
mined by this method typically match experimental measure-        ations are two key factors that influence the bulk miner-
ments, computed permeabilities are often overestimated by         alogical composition and the authigenic clay mineral inven-
more than 1 order of magnitude. This effect increases to-         tory of a reservoir (Wilson and Pittman, 1977; Worden and
wards smaller pore sizes, as shown in this study, in which        Morad, 1999), and therefore the fluid-flow properties of the
nanostructural features related to clay minerals reduce the       porous rock. A well-established technique to image and anal-
permeability of tight reservoir sandstone samples. Focussed       yse rapidly the 3D physical properties of porous rocks is
ion beam scanning electron microscopy (FIB-SEM) tomog-            computer X-ray microtomography (µXCT) combined with
raphy was applied to determine the permeability effects of        the concept of digital rock physics (Andrä et al., 2013a, b;
illites at the nanometre scale, and Navier–Stokes equations       Okabe and Blunt, 2004). By applying monochromatic syn-
were applied to calculate the permeability of these domains.      chrotron radiation, it is possible to overcome conventional
With these data, microporous domains (porous voxels) were         µXCT artefacts like beam hardening and problems that arise
defined using microtomography images of a tight reservoir         due to limited phase contrast, lack of resolution and edge
sample. The distribution of these domains could be extrap-        preservation, as well as low signal-to-noise ratios (Brunke
olated by calibration against size distributions measured in      et al., 2008; Kling et al., 2018; Lindquist et al., 2000; Mayo
FIB-SEM images. For this, we assumed a mean permeability          et al., 2015; Spanne et al., 1994). Synchrotron-based µXCT
for the dominant clay mineral (illite) in the rock and assigned   scans with image resolutions in the order of 1 µm can pro-
it to the microporous domains within the structure. The re-       vide a sound basis for flow and transport modelling of tight
sults prove the applicability of our novel approach by com-       sandstones as suggested by Peng et al. (2014). They found
bining FIB-SEM with X-ray tomographic rock core scans to          that synchrotron µXCT imaging is necessary for tight sand-
achieve a good correspondence between measured and simu-          stones when the connectivity of the pore space is low and
lated permeabilities. This methodology results in a more ac-      pore throats cannot be resolved using a conventional µXCT
curate representation of reservoir rock permeability in com-      scanner. They further concluded that a high abundance of
parison to that estimated purely based on µXCT images.            the smallest resolvable pores falsifies modelled permeabil-
                                                                  ities due to an overestimation of actual pore sizes. Several
                                                                  studies have shown sub-micrometre pore structures to be a

Published by Copernicus Publications on behalf of the European Geosciences Union.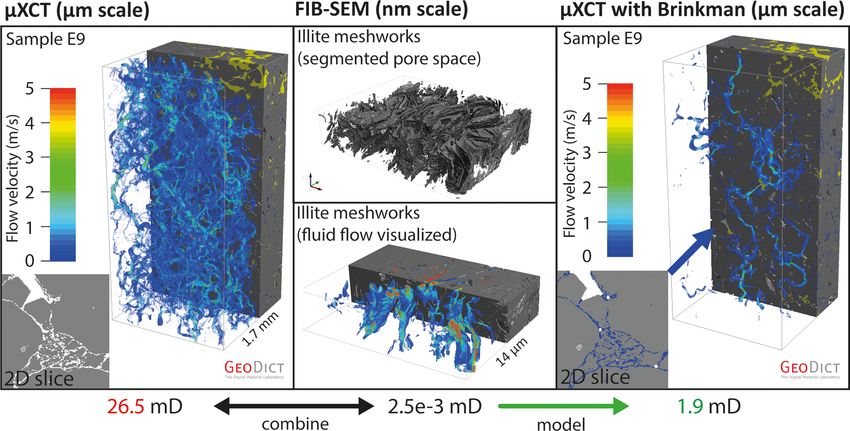
2 A. Jacob et al.: Simulating permeability reduction by clay mineral nanopores
frequent feature of tight reservoir rocks (Jiang, 2012; Shah et for sub-resolution domains in µXCT-based Stokes–Brinkman
al., 2016; Soulaine et al., 2016). Most of these nanostruc- models (Brinkman, 1949; Neale and Nader, 1974). This
tures are related to different types of clay minerals; most novel morphology-based approach for sub-resolution-rich
commonly illite, kaolinite, chlorite and smectite (e.g. Wil- materials results in simulated permeabilities that fit experi-
son and Pittman, 1977; Worden and Morad, 1999; Desbois et mental results significantly better than using Navier–Stokes
al., 2016). simulations alone.
Although known for years, considering such structural
features below µXCT resolution in pore-scale models re-
mains challenging (Alyafei et al., 2015; Guan et al., 2019; 2 Sample preparation and characterization
Liu and Mostaghimi, 2018; Liu et al., 2020; Menke et al.,
In this study, a well-characterized illite-bearing Upper
2019; Peng et al., 2012). Soulaine et al. (2016) systemat-
Rotliegend sandstone from Germany was used, which was
ically analysed the effect of sub-resolution domains with
sampled from the quarry Schwentesius near Bebertal vil-
varying permeabilities on the simulated permeabilities of
lage (Heidsiek et al., 2020). This well-known location ex-
Berea sandstone (20 vol % porosity, 2 vol % sub-resolution
poses an analogue of the Permian gas reservoir sandstone of
domains) and found that calculated permeabilities can be
the Flechtingen High, which formed part of the North Ger-
reduced by up to 50 %, if microporous domain permeabili-
man Basin. Thin section analyses of this reservoir rock have
ties converge towards zero. Thus, it is evident that neglect-
shown that illite is the main clay mineral, which primarily
ing sub-resolution information can lead to a significant over-
occurs as a coating along detrital grains, illite meshworks
estimation of rock permeability in such simulations (e.g.
grown on coatings, diagenetically altered K-feldspar and il-
Saxena et al., 2018, 2017). Menke et al. (2019) utilized a
litized lithoclasts (Fischer et al., 2012).
multi-scale Brinkman area approach, applying different per-
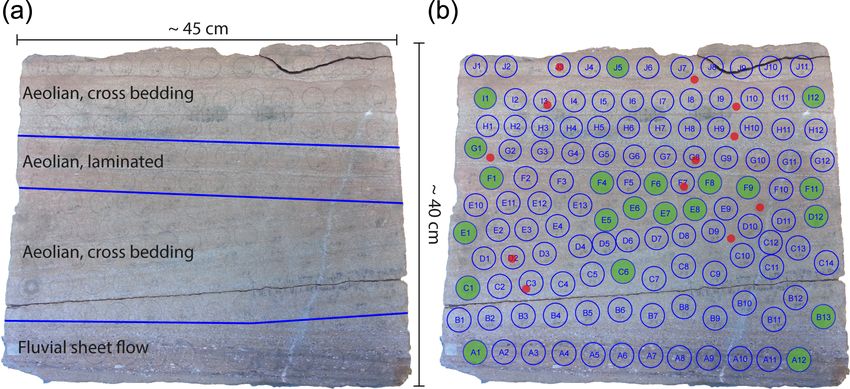
Samples were taken from a large sandstone block dis-
meabilities for each microporous domain to simulate flow in
playing a variety of different aeolian and fluvial deposi-
mono-mineralic carbonate rock. They showed that Stokes–
tional facies (Fig. 1a). We identified several facies denoted
Brinkman models are in good agreement with experimen-
A to J from four different types of sedimentary depositional
tal data, whereas Stokes and/or Navier–Stokes models alone
layers. The samples of the different facies were numbered
were not able to predict permeability in a conventional flow
from left to right. Samples were drilled out and extracted
scenario. They also demonstrated that for pure carbonates, a
from marked locations in the form of plugs with a diame-
direct correlation can be established between observed den-
ter of 2.5 cm. The plugs were cut into three segments which
sity contrasts and specific physical properties, such as poros-
were used for X-ray diffraction analyses, helium porosime-
ity and permeability. However, this approach is not applica-
try measurements and FIB-SEM imaging. Mini plugs were
ble in a system with more than one rock-forming mineral,
drilled directly beside the plugs with a diameter of 3 mm
such as a tight sandstone, where density contrasts relate to
and a length between 10 and 20 mm. The larger plugs were
different mineral phases as well as sub-resolution porosities.
used for mineralogical and geochemical analysis, and to
The lack of distinct material information for a voxel is of-
measure permeabilities experimentally. The mini plugs were
ten ascribed to the partial volume effect (e.g. Kessler et al.,
scanned at the synchrotron radiation-based µXCT imaging
1984; Ketcham and Carlson, 2001). To overcome the impact
beamline P05 at the PETRA of DESY Hamburg (Germany).
of this effect on physical properties of a rock, imaging tech-
After the synchrotron measuring campaign, the mini plugs
niques that can resolve the pore structure at different length
were additionally examined by FIB-SEM and energy disper-
scales have to be applied. For estimating the permeability of
sive X-ray spectroscopy (EDX) imaging to obtain qualitative
reservoir rocks, the resolution achieved by synchrotron radi-
and quantitative information about the clay mineral particles
ation imaging lies within an acceptable range (Saxena et al.,
found within the rock pore space. Microporous structures
2018). Several studies have demonstrated that, by combin-
in the Rotliegend sandstone sample could be resolved by
ing X-ray and scanning electron imaging, the pore space of
comparing µXCT and FIB-SEM images. The term “micro-
tight clay-bearing rocks can be spatially resolved from the
porous” refers to the definition of sub-micrometre porosity
millimetre down to the nanometre scale (e.g. Desbois et al.,
by Soulaine et al. (2016), who differentiated between void,
2016; Hemes et al., 2015; Markussen et al., 2019).
solid and microporous voxels in µXCT images. According
In this study, we aim to demonstrate a new approach by
to for example Tinet et al. (2020), the term “nanoporous” is
combining synchrotron-based µXCT imaging with focussed
used to describe structures with predominant pore sizes in the
ion beam scanning electron microscopy (FIB-SEM) to im-
nanometre range (0.2–1000 nm). In this range, the clay min-
prove flow simulations in a tight sandstone formation with
erals often appear as a greyish pore-filling phase in µXCT
high clay mineral content. First, we used machine learning-
images.
based image segmentation to enhance pore space segmen-
tations of artefact-rich FIB-SEM topologies. Then, we con-
ducted Navier–Stokes simulations on FIB-SEM topologies.
Finally, we subsequently used these simulations as input data
Solid Earth, 12, 1–14, 2021 https://doi.org/10.5194/se-12-1-2021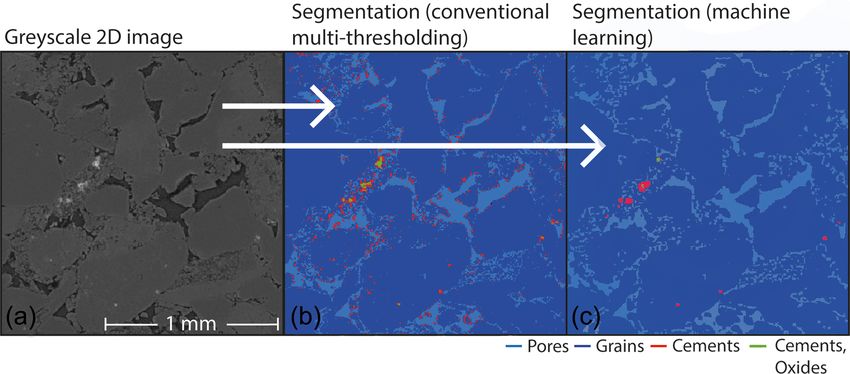
A. Jacob et al.: Simulating permeability reduction by clay mineral nanopores                                                             3

Figure 1. (a) Upper Rotliegend sandstone block showing four main deposition facies. (b) Sampling locations and sizes of the extracted plugs
(green) and the mini plugs (red) extracted.

3     Analytical procedures                                             brated by polynomial calibration and has a measuring accu-
                                                                        racy of ±0.5 % plus ±0.1 % of the full scale. To measure
3.1    Mineralogical characterization                                   the differential pressure, an Emerson Rosemount 3051S Ul-
                                                                        tra was used with an accuracy of ±0.045 %. To control the
X-ray diffraction analyses using the Rietveld analysis pro-             inflow and outflow, two pressure sensors (Brooks 5866) with
gram Profex 4.0 (Doebelin and Kleeberg, 2015; Ufer et al.,              an accuracy of ±0.5 % were installed. For permeability mea-
2012) have shown a homogenous mineralogical composition                 surements, the inflow and outflow pressures of the helium
along the layers of the sample block with only slight varia-            flux were sequentially increased in up to six pressure steps.
tions in content (Fig. 2).                                              The differential pressure was kept constant at 200–500 mbar
   The main components are quartz (58 wt %–69 wt %), au-                depending on the sample properties. The intrinsic sample
thigenic and diagenetic feldspars (12 wt %–20 wt %), cal-               permeability was derived from the apparent gas permeabil-
cite (1 wt %–18 wt %), and illite (10 wt %–17 wt %). In the             ity, Kg , determined for each pressure step using Darcy’s law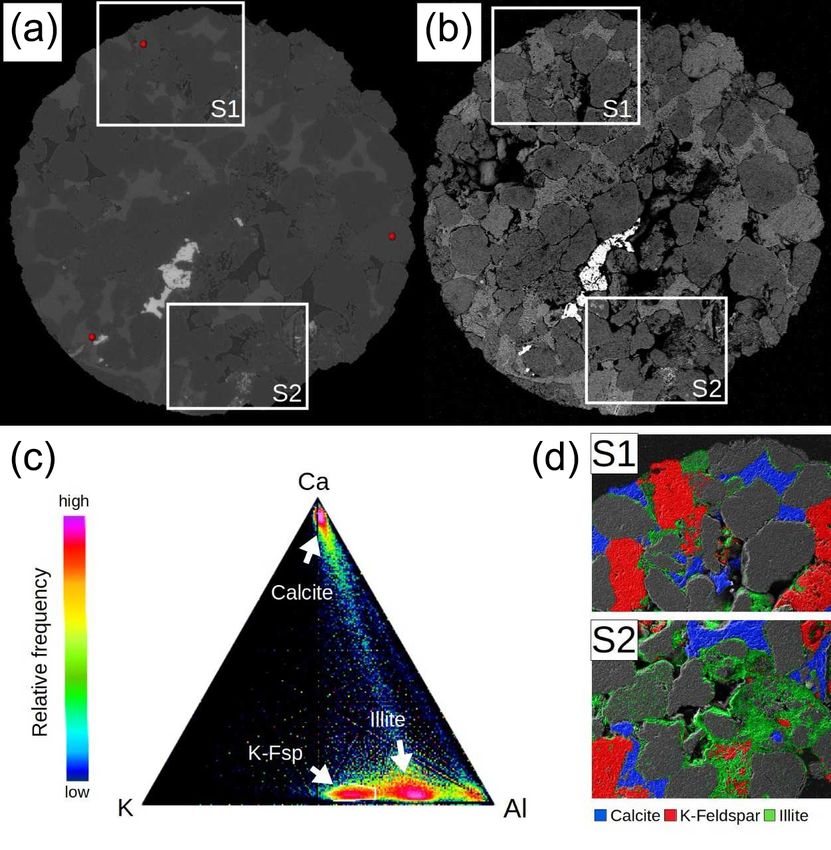
4                                               A. Jacob et al.: Simulating permeability reduction by clay mineral nanopores

Figure 2. XRD analysis of the main minerals in the plugs based on Rietveld calculations, determined for several samples of facies A to J of
the sandstone block.

(130–140◦ ), mercury only penetrates a pore when pressure is            ple to sample, these values were adjusted for each segmenta-
applied. Under the assumption of cylindrical pores, the ap-             tion within a small range of ±50. A qualitative comparison
plied pressure is directly proportional to the pore throat di-          with machine learning segmentation revealed a better pore-
ameter as described by the Washburn equation (Washburn,                 to-solid segmentation and resolving of small pore throats by
1921):                                                                  thresholding (Fig. 3). Since the main goal was to achieve the
                                                                        best possible permeability estimation, the differentiation be-
      −4γ · cos θ                                                       tween pore and solid is more important for permeability es-
D=                ,                                            (2)
         P                                                              timation than the accurate segmentation into different phases
where D is pore throat diameter, γ is the surface tension, θ            (Khan et al., 2016). Leu et al. (2014) point out that even a
is the contact angle and P is the applied pressure.                     small variation in pore throat morphology can have a large
                                                                        impact on the estimation of permeability.
3.3   Synchrotron-based µXCT                                               For permeability simulations, we either used the fast
                                                                        Fourier transformation (SIMPLE-FFT) or the left-identity-
For synchrotron tomography, a beam energy of 29.87 KeV                  right (LIR) solvers, both implemented in the FlowDict mod-
was used while the sample-detector distance was 1.2 cm. The             ule of the GeoDict software package (Linden et al., 2015;
effective image resolution of the detector equipped with a              Moulinec and Suquet, 1995). While the SIMPLE-FFT solver
CCD camera was 1.22 µm per pixel, while the image size                  is fast for calculating low-porosity domains, the LIR solver
was 3056 × 3056 pixels. We used an advanced reconstruc-                 is better suited for high-porosity domains and requires less
tion script described in Moosmann et al. (2014) with the                memory. Both iterative finite volume solvers can apply
MATLAB® software and binned the images by a factor of                   Navier–Stokes and Navier–Stokes–Brinkman equations. De-
2 before reconstruction to increase the signal-to-noise ratio.          rived from these equations, Darcy’s law (Eq. 1) is used to
This decreased the voxel resolution to 2.43 µm and changed              calculate the permeability of a material (Darcy, 1856):
the image size to 1528 × 1528 pixels. The number of pro-
                                                                               K
jections was 1200, with the information of five subsequent              u=−      (∇p − f ).                                            (3)
images used to calculate an average for every projection im-                   η
age. After reconstruction of the 3D image stacks, the scans             In Eq. (3), u is the three-dimensional average fluid-flow ve-
were denoised using the non-local means filter of the Geo-              locity, K is the permeability, η is the fluid viscosity, p is the
Dict 2020 software package (Buades et al., 2011). Image                 intrinsic average pressure tensor and f is the force density
segmentation of the mini plugs was realized by conventional             field, which was defined using the Navier–Stokes conserva-
greyscale thresholding. The greyscale values for each phase             tion of momentum equation for all three dimensions (Eq. 4):
on a 16 bit intensity range were 0–8550 for pores, 8551–
                                                                        −η1u + (u · ∇) u + ∇p = f .                                    (4)
12 880 for grains, 12 881–25 000 for cements and 25 001–
65 535 for high-density cements and oxides. Since the best              The Brinkman term can be added to the Navier–Stokes equa-
threshold values for each phase varied slightly from sam-               tion where porous voxels are required. These voxels include

Solid Earth, 12, 1–14, 2021                                                                      https://doi.org/10.5194/se-12-1-2021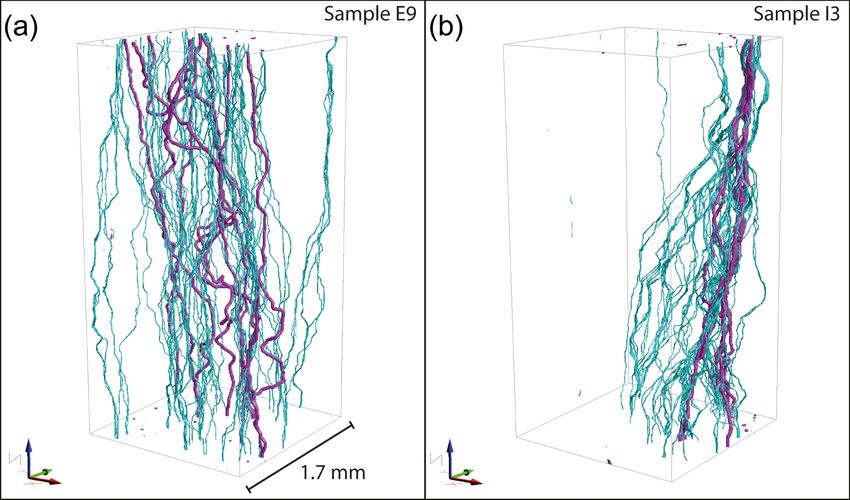
A. Jacob et al.: Simulating permeability reduction by clay mineral nanopores                                                     5

Figure 3. (a) Greyscale 2D µXCT image of a mini plug. (b) Segmented phases using multi thresholding. (c) Segmented phases using the
machine learning image classification module of the software ilastik (Version 1.3.3) by Berg et al. (2019).

the nanoporous flow resistivity:                                    Alignment operation of the module ImportGeo of the Geo-
                                                                    Dict 2020 software package was used to align the images,
−η1u + (u · ∇) u + ηK −1 u + ∇p = f ,                      (5)      while the Curtaining Filter was used for stripes correction
                                                                    (Fig. 4). In general, the segmentation of pores in FIB-SEM
where K −1 is the inverse of the permeability tensor and            images was not straightforward since scans of porous pol-
ηK −1 the flow resistivity. The applicability and robustness of     ished sections are pseudo-2D and contain information from
combining Navier–Stokes equations with the Brinkman term            behind the actual imaging plane (De Boever et al., 2015).
has been validated by Iliev and Laptev (2004).                         As multi-thresholding and watershed segmentation algo-
   We calculated the permeability with symmetric bound-             rithms have problems with shine-through artefacts (Prill et
ary conditions in tangential and flow direction with a pres-        al., 2013), capturing the correct 3D pore space geometry is
sure drop of 20 370 Pa. The symmetric boundary conditions           of crucial importance for the determination of a realistic per-
are valid for low-porosity structures with non-periodic pore        meability. Recent advances have shown that machine learn-
throat geometries. The differential pressure value was set to       ing image segmentation software can successfully be utilized
be able to compare the results with helium permeation flux          to segment pore space in CT scans (Berg et al., 2018).
measurements where similar values have been used. As a                 The software ilastik, an interactive learning and segmen-
convergence stopping criterion, a low error bound of 0.05           tation toolkit by Berg et al. (2019), was used for the in-
was chosen. The error bound criterion uses the result of a          teractively supervised machine learning segmentation of the
previous iteration to predict the final solution by linear and      phases in our FIB-SEM images (Fig. 4). The built-in pixel
quadratic extrapolation. This stops the iteration when the rel-     classification module groups the probability of each pixel
ative difference regarding the prediction is smaller than 5 %.      to be assigned to a phase according to their different im-
During this process, the solver recognizes oscillations and lo-     aged features. The software provides a set of different images
cal minima or maxima which prevents a premature stopping            based on features derived from the original image (filtering
of the solver during the iteration process.                         and smoothing, edge detection, etc.). Examples of the correct
                                                                    class (phase) provided by the user builds a decision surface
3.4   FIB-SEM measurements                                          in feature space. Based on these features, a random forest
                                                                    classifier assigns each pixel or voxel to a certain phase. This
In this study, a Zeiss Auriga crossbeam electron micro-             method works for both 2D and 3D data. The accuracy of this
scope equipped with a Gemini electron column and an Orsay           method increases with the number of user-provided training
Physics ion beam was used. SEM images were taken at 1 kV            data. In a manually controlled workflow, it was possible to
with an in-lens secondary electron (SE2) detector, and FIB          reach high segmentation accuracies with only minor over- or
slicing was executed with a beam current between 0.5 and            underestimations of the pore space (Fig. 4c, d).
2 nA and a voltage of 30 kV. This resulted in a slice thick-
ness of 25 nm. A large FOV of ∼ 20 µm could be reached.             3.5   Defining microporous domains
To derive structural information from the FIB-SEM images,
extensive post-processing of the data was required. Follow-         The need to define microporous domains results from the
ing image alignment and cropping, stripes and shadow arte-          mismatch of permeability between µXCT simulations and
facts were filtered out before image segmentation. The Slice        gas-driven permeameter tests. While the simulation of per-

https://doi.org/10.5194/se-12-1-2021                                                                 Solid Earth, 12, 1–14, 2021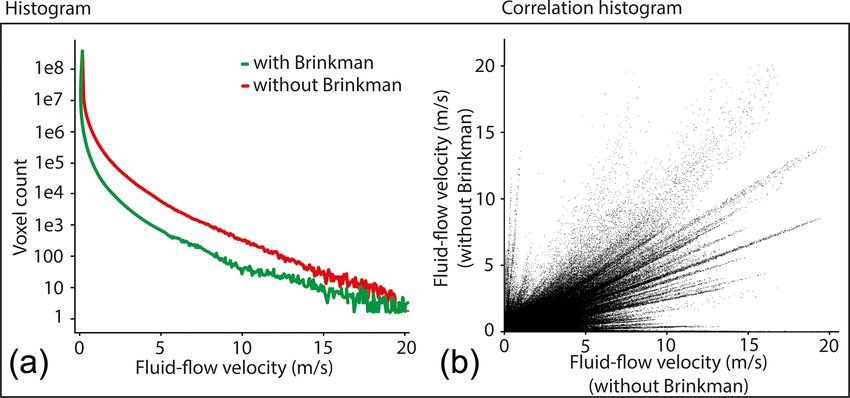
6                                                A. Jacob et al.: Simulating permeability reduction by clay mineral nanopores

Figure 4. (a) Raw SEM image of secondary illite growth in a porous feldspar with streaks and shadow artefacts. (b) Images with aligned slices
of a cropped region of interest. (c) Filtered greyscale SEM image of the illite meshworks. (d) The binarized result after image segmentation
with pixel classification algorithms of the software ilastik.

meability in structures with high permeability and porosity              grains. This corresponds to approximately two voxels in the
obtained by µXCT scans is precise, the effect of nanoporos-              µXCT images. To refine flow and reduce the influence of
ity below resolution on permeability increases with decreas-             overestimated pore sizes in these specific regions, we de-
ing permeability (Pittman and Thomas, 1979; Saxena et al.,               fine all pores with a diameter ≤ 2 voxels as microporous do-
2018). When comparing backscattered electron (BSE) im-                   mains. The Brinkman term accounts for small pores, where
ages with µXCT images of the same slice, it becomes ap-                  grains are porous themselves (Brinkman, 1949). To extract
parent that the smallest pores in µXCT images simplify the               these regions from the initial pore space segmentation Fp∗
real pore structure (Fig. 5). Furthermore, SEM and EDX im-               we calculated Euclidian distance maps as used by Maurer et
ages revealed that most of the pores are filled with clay min-           al. (2003):
erals. Since both void and microporous regions share simi-                    p
lar greyscale values, it is impossible to correctly differentiate        d = (x2 − x1 ) + (y2 − y1 ) + (z2 − z1 ),                (6)
upon segmentation. In this approach, the segmentation of the
pores includes clay minerals with a low absorption contrast.             where d is the distance between two points; x1 , y1 and z1 are
To determine the distribution of illite in µXCT scans, we used           the coordinates of the first point; and x2 , y2 and z2 are the
correlative µXCT, SEM and EDX measurements. For this, a                  coordinates of the second point. By selecting d(≤ 2) all pore
3 mm plug was embedded into epoxy resin and then ground                  voxels with the nearest distance of ≤ 2 voxels to the next
and polished until the region of interest was reached. Two               solid surface are masked, including the outer rim of larger
sites were chosen for EDX mappings (Fig. 5). Comparing                   pores (Fig. 6b). To obtain a mask with pores ≤ 2 voxels, this
EDX mappings with CT images shows that the distribution of               rim layer surplus must be removed. This was realized by per-
illite agrees with the textural findings of Fischer et al. (2012).       forming a morphological dilation operation on d(> 2) using
    Furthermore, it becomes apparent that illite enrichments             a structure element SE2 of 23 voxels. By subtracting the di-
coincide with regions that are usually referred to as void               lated image from d (> 2), the microporous domain data Fµ2
pore space in µXCT images. The mismatch between real                     (Fig. 6c) can be obtained.
pore structure and segmented pore space is highest in small
                                                                         Fµ2 = d (≤ 2) − δSE2 (d(> 2))                                   (7)
pores and throats. An average size of ∼ 5 µm was measured
for illites which cover the surfaces of the quartz and feldspar

Solid Earth, 12, 1–14, 2021                                                                       https://doi.org/10.5194/se-12-1-2021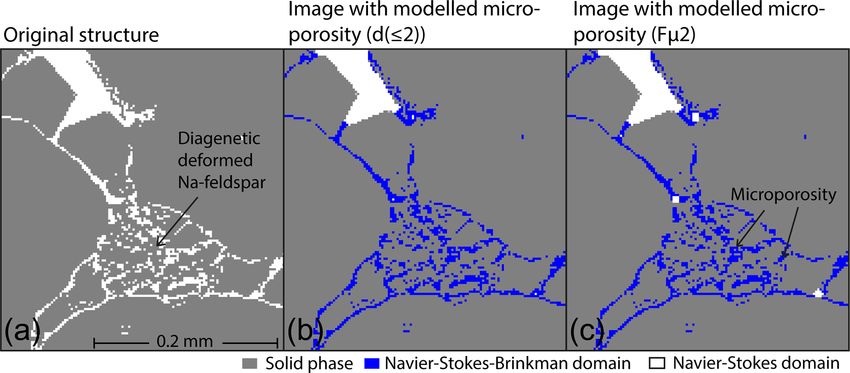
A. Jacob et al.: Simulating permeability reduction by clay mineral nanopores                                                           7

                                                                        both aeolian facies (Table 2; Fig. 1, sample series E and F).
                                                                        The quadratic regression coefficient ranges from 0.732 to
                                                                        0.998, which indicates a high accuracy of the permeameter
                                                                        test. The small variation of the physical rock properties be-
                                                                        tween the main layers is induced by different angles of the
                                                                        grain layering in each plug sample and small-scale variations
                                                                        in grain and pore size distributions. The observed variance is
                                                                        in the typical range of observed permeability fluctuations for
                                                                        tight reservoir sandstones (Lis-Śledziona, 2019). Consider-
                                                                        ing the observed permeability, the studied rock samples are
                                                                        at the lower end of the permeability range known for sedi-
                                                                        mentary reservoir rocks (Gluyas and Swarbrick, 2004).
                                                                           The pore size distribution of the sub-sample analysed by
                                                                        mercury intrusion porosimetry (Sect. 3.2) was obtained by
                                                                        a semi-logarithmic representation of the normalized intru-
                                                                        sion volume achieved per pressure interval (Fig. 8). The con-
                                                                        sumed capillary stem intrusion volume of 27 % was within
                                                                        the acceptable range needed for precise measurements. We
                                                                        discovered a major peak at approximately 1 µm, representing
                                                                        the most common pore throat diameter.
                                                                           In addition to the mercury porosimetry results, calcula-
Figure 5. (a) µXCT and corresponding (b) BSE image of the pol-          tions of the pore size distribution of FIB-SEM and µXCT
ished section including the close-up regions S1 and S2 that were        mini plug images were conducted using the GeoDict module
used for EDX mapping to analyse the distribution of illites. (c)        PoroDict. This module provides an algorithm that virtually
Ternary plot of Ca, K and Al content of each pixel in the mappings.     pushes spheres of different sizes into a medium to determine
Calcite, illite and K-feldspar plot in three distinct regions. By se-   the 3D pore size distribution (Münch and Holzer, 2008). FIB-
lecting these areas, a phase map overlay was created that visualizes    SEM measurements of the pore size distribution cover the
the location of these phases in SE images. (d) Region S1 and S2
                                                                        small pores related to the illite nanoporosity, while µXCT
with phase map overlays. Illite is predominantly found in the vicin-
                                                                        porosimetry illustrates the pore size distribution of the larger-
ity of altered feldspars, as coating along grain boundaries and as
authigenic pore filling.                                                scale intergranular pore space skeleton.
                                                                           The µXCT pore volume analysis shows a constant rise to-
                                                                        wards the smallest observed pore diameters (2.44 µm; Fig. 9).
   In GeoDict the permeabilities of the microporous domains             The steepest slope is observed between 7.3 and 12.2 µm,
are calculated with the Brinkman term. Based on flow sim-               which indicates that the largest volume of pore bodies is ob-
ulations on 3D FIB-SEM images of illite meshworks, an                   served in that range. The calculated pore size distribution
isotropic permeability was assigned to the microporous do-              from nanoporous 3D structures of illite meshworks obtained
mains (Fig. 6). Yoon and Dewers (2013) confirmed the va-                by FIB-SEM imaging shows three distinct peaks at 75, 125
lidity of the approach of extrapolating structural features of          and 250 nm. This illustrates that the most common inscribed
clays measured by FIB-SEM to the pore scale. The complete               pore diameters are relatively small compared to the actual ex-
workflow for a precise permeability simulation is illustrated           tent of the pores, which is considered typical for slit-shaped
in Fig. 7.                                                              pore systems where the pore axial ratio is high (Desbois et
                                                                        al., 2016). Ultimately, this results from the different thick-
                                                                        nesses of clay platelets and heterogeneity in the alignment of
4     Results and discussion                                            the illite nanostructure (Aplin et al., 2006).
                                                                           An apparent gap exists between diameters observed by
4.1    Permeability measurements and pore size                          MICP and 3D imaging with FIB-SEM and µXCT. While
       distribution                                                     MICP peaks at around 1 µm, diameters observed by µXCT
                                                                        start at 2.4 µm and the largest inscribed diameters observed
Four to six pressure stages were applied to the plug samples            by FIB-SEM are below 700 nm. However, it must be noted
to determine their gas permeability. In Table 1, parameters             that pressure-controlled MICP generally gives information
which were used for the permeameter test are shown for sam-             about the dimension of pore throats, whereas pore size dis-
ple F8. These values yield a Klinkenberg factor of 0.56 and             tributions provided by imaging techniques give information
a quadratic regression coefficient of 0.94.                             about pore body volumes (Zhao et al., 2015). Furthermore,
   Overall, the measured intrinsic permeabilities range be-             pore shielding may cause an underestimation of larger pores
tween 1.1 and 5.4 mD with an average value of 2.9 mD for                for MICP (Abell et al., 1999; Gane et al., 2004). The occur-

https://doi.org/10.5194/se-12-1-2021                                                                      Solid Earth, 12, 1–14, 2021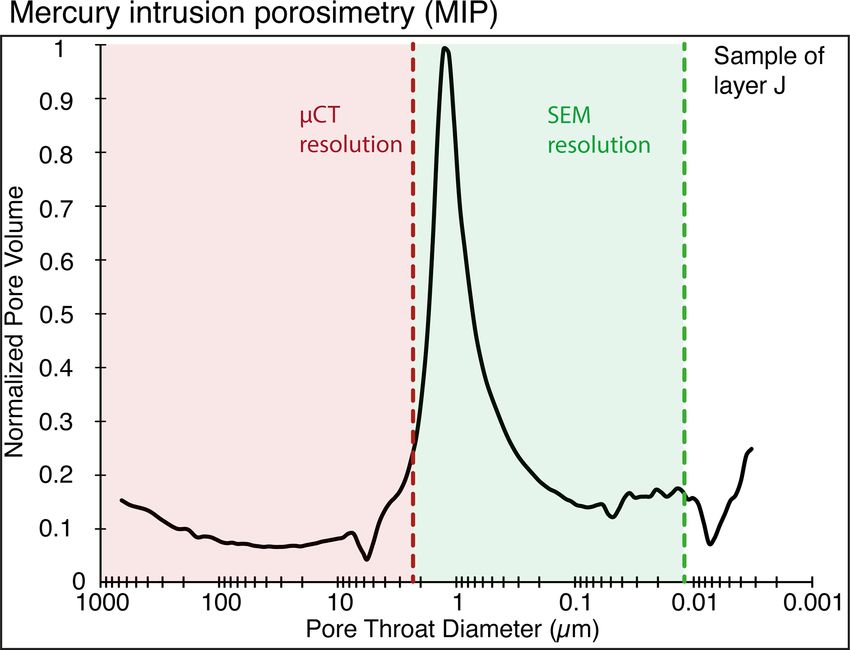
8                                                A. Jacob et al.: Simulating permeability reduction by clay mineral nanopores

Figure 6. (a) Segmented µXCT image of the pore space of a mini plug. (b) Image with applied microporous domain using the Euclidian
distance map approach. (c) Image with removed outer rim layer of larger pores.

Figure 7. Workflow for microporous domain modelling combining FIB-SEM nanoporosity with µXCT scans. Sample E9 of the aeolian
layer with well-distributed flow paths was selected for visualization. Upon the modelling of the microporous domains, the total fluid-flow
velocity decreases. Displayed simulated permeabilities include the mean values of five samples with the best distribution of percolation paths.
Fluid-flow velocities close to zero are transparent.

rence of authigenic illites is the likely cause of this effect            els resulting from clay mineral modelling ranges between
as they are commonly found in pore throat areas. Since the                3.3 vol % and 7.1 vol % of the total structure volume for all
Washburn equation assumes ideal pore throats of cylindri-                 µXCT scans considered. A comparison of the modelled clay
cal shape, the underestimation of larger pores becomes more               minerals in µXCT scans with XRD mass balancing high-
evident with the increasing complexity of the pore throat                 lights a large difference between the mineral abundances
system at both the millimetre and nanometre scale (Wash-                  measured (Table 3, Fig. 2).
burn, 1921). Therefore, a direct comparison between the used                 While the mean amount of clay minerals based on XRD
methods is unlikely to result in compatible results.                      measurements was 12.7 wt % (about 11.3 vol % within a
                                                                          structure with 8 % porosity), an average amount of 5.4 vol %
4.2   Permeability simulation                                             was modelled by the distance map algorithm. This is ex-
                                                                          pected since the illite content inside grains was not modelled
A calculated isotropic permeability of 2.53 × 10⁻³ mD was                 since it has no effect on permeability. We simulated perme-
used for the microporous domains based on the Navier–                     ability of 12 mini plug samples that were scanned by µXCT
Stokes fluid-flow simulations of permeability of FIB-SEM                  and compared them with measurements from gas permeame-
scans of the illite meshworks. The number of porous vox-                  ter experiments. As a first step, we extracted and illustrated

Solid Earth, 12, 1–14, 2021                                                                        https://doi.org/10.5194/se-12-1-2021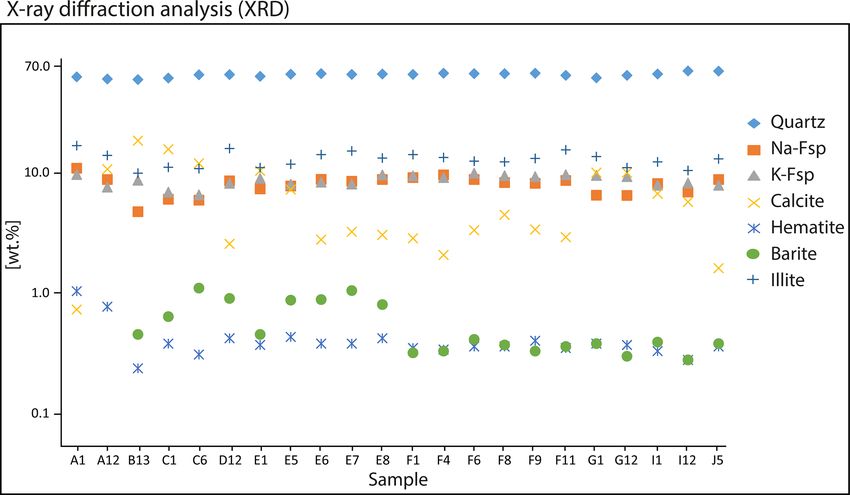
A. Jacob et al.: Simulating permeability reduction by clay mineral nanopores                                                               9

Table 1. Parameters of the gas permeameter flux experiment (sample F8), including measured helium gas flow rate, recorded inflow and
outflow pressures as well as calculated apparent gas permeability for each pressure stage. For evaluating the intrinsic sample permeability,
the sample cross section (0.025 m) and length (0.05 m) as well as the dynamic viscosity of helium (18.4 × 10⁻⁶ Pas) is also needed.

                              Pressure              Inflow         Outflow             Flow rate           Apparent
                              stage           pressure (Pa)   pressure (Pa)            (m3 s−1 )   permeability (mD)
                              1                  129 522.3           109 151         2.8803e−08                 2.38
                              2                  149 587.1          129 167.9        2.8401e−08                 2.38
                              3                  174 634.9          154 120.4        2.7072e−08                 2.28
                              4                  224 581.7          204 228.1        2.5041e−08                 2.16
                              5                  324 516.8          304 066.2        2.4409e−08                 2.13

Table 2. Intrinsic permeabilities and porosities of the measured sandstone plug samples.

                                         E5      E6    E7     E8      E13       F4     F6    F8    F9    Mean       Standard
                                                                                                                 deviation (±1σ )
                Permeability (mD)     1.1       5.1    5.4    2.2     4.2       2.3    2.3   1.9   1.4    2.9          1.5

                                                                                Figure 9. Pore throat diameters from µXCT (a) and FIB-SEM im-
                                                                                ages (b).

Figure 8. Distribution of the pore throat diameters of a sample                 of a volume of a rock, we considered only permeability cal-
of the aeolian facies in layer J obtained from mercury intrusion                culations of samples which show no flow impingement for
porosimetry (MICP).                                                             modelling (Bear, 1972; Leu et al., 2014; Zhang et al., 2000).
                                                                                The validity of the simulations was ensured by applying the
                                                                                variance algorithm on the flow fields discussed in Jacob et
the 10 largest and 100 largest open flow paths through the                      al. (2019).
pore space of all mini plug cores before the modelling of the                      The mean value of the experimentally obtained intrinsic
microporous domains (Fig. 10). This yields information con-                     gas permeabilities was 2.9 mD (Table 2, Fig. 11a). Samples
cerning the heterogeneity of the flow fields and allows the va-                 with no flow impingement had an initial mean permeabil-
lidity of the Navier–Stokes simulations to be checked. Struc-                   ity of 26.5 mD, whereas the mean permeability simulated on
tures with flow impingement often cause numerical prob-                         µXCT images was 26.5 mD (Fig. 11b). With applied micro-
lems, which results in an artificial underestimation of the per-                porous domains, a mean permeability of 1.9 mD was calcu-
meability simulations. Significant underestimations of per-                     lated (Fig. 11c).
meability after clay mineral modelling were also found in ar-                      The mismatch between measured and simulated perme-
eas where the percolation paths in the samples were limited                     abilities could be decreased to 1 mD (−34.5 %) compared to
to a few voxels in the structure before modelling.                              23.6 mD (+813.8 %) prior to the modelling. Hence, our ap-
   This effect leads to an artificial permeability drop, which                  proach significantly improved the match between measured
renders calculations less precise. Since evenly distributed                     and simulated permeabilities and lies within the standard de-
flow paths are necessary to determine the true permeability                     viation of the permeabilities measured by the gas permeame-

https://doi.org/10.5194/se-12-1-2021                                                                              Solid Earth, 12, 1–14, 2021
10 A. Jacob et al.: Simulating permeability reduction by clay mineral nanopores
Table 3. Modelled clay mineral content within the microporous domains in µXCT scans.
C3 D2 D9 E9 F7 G2 G8 H9 I3 I9 J3 J7 Mean Standard
deviation (±1σ )
Clay mineral content (vol %) 4.7 3.3 5.0 5.4 7.1 5.0 6.0 6.3 4.1 6.2 6.2 6.1 5.4 1.0
Figure 10. Comparison of percolation paths in two µXCT recon-
structions of the 3D imaging data without microporous domain
modelling. (a) Well distributed percolation paths in a µXCT recon- Figure 11. Comparison of measured and simulated permeabilities.
struction of mini plug sample E9 without microporous domain mod- The boxes indicate the upper and lower quartile of derived perme-
elling. (b) Constricted percolation paths with flow impingement ability values. Median values are coloured in red; mean values are
limited to a small region of the structure in mini plug sample I3 coloured in black. (a) Measured permeabilities using the gas per-
without microporous domain modelling. The 10 largest percolation meameter test. (b) Simulated permeabilities using µXCT data. (c)
paths are coloured in purple; the 100 largest percolation paths are Simulated permeabilities using µXCT data with modelled microp-
coloured in cyan. orous domains.
showed a good match between the experimental and simu-
ter (Table 2). Histograms of the simulated fluid-flow veloci- lated permeability, the need to include heterogeneities of clay
ties indicate a strong decrease in velocities due to the mod- mineral layering to improve the simulations was depicted in
elling of the microporous domains in sample E9 (Fig. 12). Villiéras et al. (1997).
Correlation histograms of the velocities depict differences in- The presented approach might also be applicable to other
duced by the modelling. While identical fluid-flow field ve- rock types such as mudrocks, carbonates, etc., if the precon-
locities would plot as a single straight line, the velocities, in ditions are met. The examined rock properties (e.g. perme-
this case, show straight lines with varying slopes. This in- ability) should be based on the same scale dependencies as
dicates a general decrease in the fluid-flow velocities with a the rock analysed in this work (e.g. Grathoff et al., 2016).
splitting of different flow path velocities. Points which plot
as a line represent a main fluid-flow path with a direct cor-
relation of the velocities between the original and the mod- 5 Conclusions
elled structure’s flow field. Furthermore, a wider spread of
the distribution of high velocities results from microporous Overall, the outcome of this study shows that combining
domain modelling. This indicates narrow pore throats where µXCT and FIB-SEM imaging with numerical models con-
fluid-flow velocities are locally enhanced compared to the stitutes a valuable and novel approach for determining phys-
structure before the modelling. ical properties of clay-bearing tight reservoir rocks. Con-
Based on our combined analytical and numerical study, sidering the high number of accessible pores in the scans,
further research may help to increase the accuracy of simu- the phenomenon of flow impingement was mainly attributed
lated permeabilities even further. Since isotropic permeabil- to the unresolvable nanoporosity. While permeability, which
ities of the microporous domains were applied to µXCT im- is one of the most important reservoir properties, is often
ages, the accuracy can be improved by taking the anisotropy determined by simulations based on µXCT scans of small
of clay mineral fabrics and surface topology into account. samples taken from a field-scale reservoir, we were able to
This can be done by applying anisotropic permeabilities in demonstrate that an accurate estimation for clay-rich and
the calculation of the microporous domains. While this study low-permeability rocks is only possible if nanoscale poros-
Solid Earth, 12, 1–14, 2021 https://doi.org/10.5194/se-12-1-2021A. Jacob et al.: Simulating permeability reduction by clay mineral nanopores 11
Figure 12. Comparison of unmodelled µXCT images and modelled microporous domain images (a). Correlation histogram prior to and after
the modelling that shows a decrease in the main fluid-flow velocities, while few velocities after the modelling were increased with a wide
spread of distribution (b).
ity is also included. Thus, our simulations using the Euclid- tigate whether clay mineral modelling is also a valid tool for
ian distance map approach resulted in an improved match such sedimentary rocks.
with stationary gas permeameter measurements in contrast to
permeability simulations merely based on unmodified µXCT
images. Adopting this multi-method approach, we increased Data availability. Data can be partially accessed upon request by
the accuracy of simulated permeabilities of samples mea- Arne Jacob, Markus Peltz and Frieder Enzmann.
sured by µXCT. These results have important implications
for improved modelling of reservoirs relevant to gas and
water applications. A realistic simulated permeability of a Supplement. The supplement related to this article is available on-
tight reservoir sandstone could only be achieved by appro- line at: https://doi.org/10.5194/se-12-1-2021-supplement.
priate modelling of the nanoporosity related to matrix clay
minerals (illite) that occur below the µXCT resolution. The
Author contributions. The conceptualization was developed by AJ,
simulated permeability based on combined µXCT and FIB-
MP, SH, FE, LNW, GG, PB and MK. The process methodology
SEM images and modelled microporous domains showed was developed by AJ and MP. The software was provided by FE
good agreement with the experimental results. Obtaining an while the programming was conducted by AJ and MP. The final
even distribution of the simulated fluid-flow paths through validation of the results was done by AJ, MP, SH, FE, LNW, GG, PB
the sample without flow impingement was necessary to ob- and MK. Formal analysis was executed by AJ and MP. The review
tain an accurate permeability estimation from 3D imaging. and editing was executed by AJ, MP, SH, FE, OM, LNW, GG, PB
Resolving the nanopore structure and distribution of clay and MK. The visualization of the results was conducted by AJ and
mineral-related features by the combined analytical and nu- MP. Supervision was provided by FE, LNW, GG, PB and MK. The
merical modelling approach represents a tool for achieving project was administrated by FE, LNW, GG, PB and MK.
a more accurate understanding of the fluid-flow behaviour
within tight sandstones, with direct relevance to predicting
the injection, storage or extraction of gas or water in a reser- Competing interests. The authors declare that they have no conflict
voir rock. Our multi-method approach can be applied to de- of interest.
termine more accurate permeability values and flow paths for
reservoir rocks with high clay mineral content if direct exper-
Acknowledgements. This work was supported by the German Fed-
imental measurements are not successful. Hence, future stud-
eral Ministry of Education and Research (BMBF) “Geological Re-
ies should focus on distinguishing the different morphologies search for Sustainability (GEO:N)” program, which is part of the
of clay minerals and their related anisotropic effect on rock BMBF “Research for Sustainable Development (FONA3)” frame-
permeability. The permeability of the nanoporous structures work program. It is part of the project ResKin (Reaction kinetics in
depends highly on the layering of the clays and their spatial reservoir rocks, 03G0871E). We would like to thank Fabian Wilde
orientation on the grain surfaces and within feldspars. This and the staff of PETRA synchrotron facility at DESY Hamburg for
approach should include a variety of various sedimentologi- their assistance with the imaging beamline P05. Jens Hornung and
cal facies, also with high porosity and permeability, to inves- Meike Hintze from the TU Darmstadt are also acknowledged for
https://doi.org/10.5194/se-12-1-2021 Solid Earth, 12, 1–14, 202112 A. Jacob et al.: Simulating permeability reduction by clay mineral nanopores
providing us with gas permeability measurements of the studied Brinkman, H. C.: Calculations on the flow of heterogeneous
samples. mixtures through porous media, Appl. Sci. Res., 1, 333,
https://doi.org/10.1007/BF02120339, 1949.
Brunke, O., Brockdorf, K., Drews, S., Müller, B., Donath, T.,
Financial support. This research has been supported by the Herzen, J., and Beckmann, F.: Comparison between x-ray tube-
German Federal Ministry of Education and Research (BMBF) based and synchrotron radiation-based µCT, edited by: Stock, S.
(grant no. 03G0871E). R., San Diego, California, USA., 2008.
Buades, A., Coll, B., and Morel, J.-M.: Non-Local Means
This open-access publication was funded Denoising, Image Processing On Line, 1, 208–212,
by Johannes Gutenberg University Mainz. https://doi.org/10.5201/ipol.2011.bcm_nlm, 2011.
Darcy, H.: Les Fontaines Publiques de la Ville de Dijon, Les
Fontaines Publiques de la Ville de Dijon: Exposition et Appli-
Review statement. This paper was edited by Florian Fusseis and re- cation des Principes a Suivre et des Formulesa Employer dans
viewed by two anonymous referees. les Questions de Distribution d’Eau, Dalmont, 1856.
De Boever, W., Derluyn, H., Van Loo, D., Van Hoorebeke,
L., and Cnudde, V.: Data-fusion of high resolution X-ray
CT, SEM and EDS for 3D and pseudo-3D chemical and
References structural characterization of sandstone, Micron, 74, 15–21,
https://doi.org/10.1016/j.micron.2015.04.003, 2015.
Abell, A. B., Willis, K. L., and Lange, D. A.: Mercury Desbois, G., Urai, J. L., Hemes, S., Schröppel, B., Schwarz, J.-
Intrusion Porosimetry and Image Analysis of Cement- O., Mac, M., and Weiel, D.: Multi-scale analysis of poros-
Based Materials, J. Colloid Interf. Sci., 211, 39–44, ity in diagenetically altered reservoir sandstone from the Per-
https://doi.org/10.1006/jcis.1998.5986, 1999. mian Rotliegend (Germany), J. Petrol. Sci. Eng., 140, 128–148,
Ahmad, K. M., Kristaly, F., and Docs, R.: Effects of clay https://doi.org/10.1016/j.petrol.2016.01.019, 2016.
mineral and physico-chemical variables on sandstone Doebelin, N. and Kleeberg, R.: Profex?: a graphi-
rock permeability, J. Oil Gas Petrochem. Sci., 1, 18–26, cal user interface for the Rietveld refinement pro-
https://doi.org/10.30881/jogps.00006, 2018. gram BGMN, J. Appl. Crystallogr., 48, 1573–1580,
Alyafei, N., Raeini, A. Q., Paluszny, A., and Blunt, M. J.: A Sen- https://doi.org/10.1107/S1600576715014685, 2015.
sitivity Study of the Effect of Image Resolution on Predicted Filomena, C. M., Hornung, J., and Stollhofen, H.: Assessing ac-
Petrophysical Properties, Transp. Porous. Med., 110, 157–169, curacy of gas-driven permeability measurements: a comparative
https://doi.org/10.1007/s11242-015-0563-0, 2015. study of diverse Hassler-cell and probe permeameter devices,
Andrä, H., Combaret, N., Dvorkin, J., Glatt, E., Han, J., Kabel, Solid Earth, 5, 1–11, https://doi.org/10.5194/se-5-1-2014, 2014.
M., Keehm, Y., Krzikalla, F., Lee, M., Madonna, C., Marsh, Fischer, C., Dunkl, I., Von Eynatten, H., Wijbrans, J. R., and
M., Mukerji, T., Saenger, E. H., Sain, R., Saxena, N., Ricker, Gaupp, R.: Products and timing of diagenetic processes in Upper
S., Wiegmann, A., and Zhan, X.: Digital rock physics bench- Rotliegend sandstones from Bebertal (North German Basin,
marks—Part I: Imaging and segmentation, Comput. Geosci., 50, Parchim Formation, Flechtingen High, Germany), Geol. Mag.,
25–32, https://doi.org/10.1016/j.cageo.2012.09.005, 2013a. 149, 827–840, https://doi.org/10.1017/S0016756811001087,
Andrä, H., Combaret, N., Dvorkin, J., Glatt, E., Han, J., Kabel, 2012.
M., Keehm, Y., Krzikalla, F., Lee, M., Madonna, C., Marsh, M., Gane, P. A. C., Ridgway, C. J., Lehtinen, E., Valiullin, R.,
Mukerji, T., Saenger, E. H., Sain, R., Saxena, N., Ricker, S., Furó, I., Schoelkopf, J., Paulapuro, H., and Daicic, J.: Com-
Wiegmann, A., and Zhan, X.: Digital rock physics benchmarks– parison of NMR Cryoporometry, Mercury Intrusion Porosime-
part II: Computing effective properties, Comput. Geosci., 50, 33– try, and DSC Thermoporosimetry in Characterizing Pore Size
43, https://doi.org/10.1016/j.cageo.2012.09.008, 2013b. Distributions of Compressed Finely Ground Calcium Car-
Aplin, A. C., Matenaar, I. F., McCarty, D. K., and van der Pluijm, bonate Structures, Ind. Eng. Chem. Res., 43, 7920–7927,
B. A.: Influence of mechanical compaction and clay mineral di- https://doi.org/10.1021/ie049448p, 2004.
agenesis on the microfabric and pore-scale properties of deep- Gao, H. and Li, H. A.: Pore structure characterization, perme-
water Gulf of Mexico mudstones, Clay. Clay. Miner., 54, 500– ability evaluation and enhanced gas recovery techniques of
514, https://doi.org/10.1346/CCMN.2006.0540411, 2006. tight gas sandstones, J. Nat. Gas Sci. Eng., 28, 536–547,
Bear, J.: Dynamics of fluids in porous media, American Elsevier https://doi.org/10.1016/j.jngse.2015.12.018, 2016.
Pub. Co, New York, 1972. Gluyas, J. G. and Swarbrick, R. E.: Petroleum geoscience, Black-
Berg, S., Saxena, N., Shaik, M., and Pradhan, C.: Gen- well Pub, Malden, MA, USA, 2004.
eration of ground truth images to validate micro-CT Grathoff, G. H., Peltz, M., Enzmann, F., and Kaufhold, S.: Porosity
image-processing pipelines, Leading Edge, 37, 412–420, and permeability determination of organic-rich Posidonia shales
https://doi.org/10.1190/tle37060412.1, 2018. based on 3-D analyses by FIB-SEM microscopy, Solid Earth, 7,
Berg, S., Kutra, D., Kroeger, T., Straehle, C. N., Kausler, B. X., 1145–1156, https://doi.org/10.5194/se-7-1145-2016, 2016.
Haubold, C., Schiegg, M., Ales, J., Beier, T., Rudy, M., Eren, K., Guan, K. M., Nazarova, M., Guo, B., Tchelepi, H., Kovscek, A. R.,
Cervantes, J. I., Xu, B., Beuttenmueller, F., Wolny, A., Zhang, and Creux, P.: Effects of Image Resolution on Sandstone Porosity
C., Koethe, U., Hamprecht, F. A., and Kreshuk, A.: ilastik: inter- and Permeability as Obtained from X-Ray Microscopy, Transp.
active machine learning for (bio)image analysis, Nat. Methods,
https://doi.org/10.1038/s41592-019-0582-9, 2019.
Solid Earth, 12, 1–14, 2021 https://doi.org/10.5194/se-12-1-2021A. Jacob et al.: Simulating permeability reduction by clay mineral nanopores 13
Porous. Med., 127, 233–245, https://doi.org/10.1007/s11242- Structures in Tight Formations, Energies, 10, 1575,
018-1189-9, 2019. https://doi.org/10.3390/en10101575, 2017.
Heidsiek, M., Butscher, C., Blum, P., and Fischer, C.: Small-scale Liu, M. and Mostaghimi, P.: Reactive transport modelling
diagenetic facies heterogeneity controls porosity and permeabil- in dual porosity media, Chem. Eng. Sci., 190, 436–442,
ity pattern in reservoir sandstones, Environ. Earth Sci., 79, 425, https://doi.org/10.1016/j.ces.2018.06.005, 2018.
https://doi.org/10.1007/s12665-020-09168-z, 2020. Liu, M., Starchenko, V., Anovitz, L. M., and Stack, A. G.:
Hemes, S., Desbois, G., Urai, J. L., Schröppel, B., and Grain detachment and transport clogging during min-
Schwarz, J.-O.: Multi-scale characterization of poros- eral dissolution in carbonate rocks with permeable grain
ity in Boom Clay (HADES-level, Mol, Belgium) using boundaries, Geochem. Cosmochim. Ac., 280, 202–220,
a combination of X-ray µ-CT, 2D BIB-SEM and FIB- https://doi.org/10.1016/j.gca.2020.04.022, 2020.
SEM tomography, Micropor. Mesopor. Mat., 208, 1–20, Markussen, Ø., Dypvik, H., Hammer, E., Long, H., and Hammer,
https://doi.org/10.1016/j.micromeso.2015.01.022, 2015. Ø.: 3D characterization of porosity and authigenic cementation
Iliev, O. and Laptev, V.: On numerical simulation of flow in Triassic conglomerates/arenites in the Edvard Grieg field us-
through oil filters, Comput. Visual. Sci., 6, 139–146, ing 3D micro-CT imaging, Mar. Petrol. Geol., 99, 265–281,
https://doi.org/10.1007/s00791-003-0118-8, 2004. https://doi.org/10.1016/j.marpetgeo.2018.10.015, 2019.
Jacob, A., Enzmann, F., Hinz, C., and Kersten, M.: Analy- Maurer, C. R., Rensheng, Q., and Raghavan, V.: A linear time algo-
sis of Variance of Porosity and Heterogeneity of Permeabil- rithm for computing exact Euclidean distance transforms of bi-
ity at the Pore Scale, Transp. Porous. Med., 130, 867–887, nary images in arbitrary dimensions, IEEE T. Pattern Anal., 25,
https://doi.org/10.1007/s11242-019-01342-7, 2019. 265–270, https://doi.org/10.1109/TPAMI.2003.1177156, 2003.
Jiang, S.: Clay Minerals from the Perspective of Oil and Gas Ex- Mayo, S., Josh, M., Nesterets, Y., Esteban, L., Pervukhina,
ploration, in: Clay Minerals in Nature – Their Characterization, M., Clennell, M. B., Maksimenko, A., and Hall, C.:
Modification and Application, edited by: Valaskova, M., Inte- Quantitative micro-porosity characterization using syn-
chOpen, 2012. chrotron micro-CT and xenon K-edge subtraction in sand-
Kessler, R. M., Ellis, J. R., and Eden, M.: Analysis of Emis- stones, carbonates, shales and coal, Fuel, 154, 167–173,
sion Tomographic Scan Data: Limitations Imposed by Resolu- https://doi.org/10.1016/j.fuel.2015.03.046, 2015.
tion and Background, J. Comput. Assist. Tomo., 8, 514–522, Menke, H., Gao, Y., Linden, S., and Andrew, M.: Using nano-
https://doi.org/10.1097/00004728-198406000-00028, 1984. XRM and high-contrast imaging to inform micro-porosity
Ketcham, R. A. and Carlson, W. D.: Acquisition, optimization permeability during Stokes-Brinkman single and two-phase
and interpretation of X-ray computed tomographic imagery: ap- flow simulations on micro-CT images, preprint, EarthArXiv,
plications to the geosciences, Comput. Geosci., 27, 381–400, https://doi.org/10.31223/osf.io/ubg6p, 2019.
https://doi.org/10.1016/S0098-3004(00)00116-3, 2001. Moosmann, J., Ershov, A., Weinhardt, V., Baumbach, T., Prasad, M.
Khan, F., Enzmann, F., and Kersten, M.: Multi-phase classification S., LaBonne, C., Xiao, X., Kashef, J., and Hofmann, R.: Time-
by a least-squares support vector machine approach in tomog- lapse X-ray phase-contrast microtomography for in vivo imag-
raphy images of geological samples, Solid Earth, 7, 481–492, ing and analysis of morphogenesis, Nat. Protoc., 9, 294–304,
https://doi.org/10.5194/se-7-481-2016, 2016. https://doi.org/10.1038/nprot.2014.033, 2014.
Kling, T., Vogler, D., Pastewka, L., Amann, F., and Blum, P.: Nu- Moulinec, H. and Suquet, P.: A FFT-Based Numerical Method
merical Simulations and Validation of Contact Mechanics in a for Computing the Mechanical Properties of Composites from
Granodiorite Fracture, Rock. Mech. Rock. Eng., 51, 2805–2824, Images of their Microstructures, in: IUTAM Symposium on
https://doi.org/10.1007/s00603-018-1498-x, 2018. Microstructure-Property Interactions in Composite Materials,
Klinkenberg, L. J.: The permeability of porous Media to liquids and edited by: Pyrz, R., Springer Netherlands, Dordrecht, 235–246,
gases, Drilling and Production Practice, API-41-200, 1941. 1995.
Leu, L., Berg, S., Enzmann, F., Armstrong, R. T., and Kersten, Münch, B. and Holzer, L.: Contradicting Geometrical Concepts
M.: Fast X-ray Micro-Tomography of Multiphase Flow in Berea in Pore Size Analysis Attained with Electron Microscopy
Sandstone: A Sensitivity Study on Image Processing, Transp. and Mercury Intrusion, J. Am. Ceram. Soc., 91, 4059–4067,
Porous. Med., 105, 451–469, https://doi.org/10.1007/s11242- https://doi.org/10.1111/j.1551-2916.2008.02736.x, 2008.
014-0378-4, 2014. Neale, G. and Nader, W.: Practical significance of brinkman’s exten-
Linden, S., Wiegmann, A., and Hagen, H.: The LIR space partition- sion of darcy’s law: Coupled parallel flows within a channel and
ing system applied to the Stokes equations, Graphical Models, a bounding porous medium, Can. J. Chem. Eng., 52, 475–478,
82, 58–66, https://doi.org/10.1016/j.gmod.2015.06.003, 2015. https://doi.org/10.1002/cjce.5450520407, 1974.
Lindquist, W. B., Venkatarangan, A., Dunsmuir, J. and Wong, Okabe, H. and Blunt, M. J.: Prediction of permeability for porous
T.: Pore and throat size distributions measured from syn- media reconstructed using multiple-point statistics, Phys. Rev. E,
chrotron X-ray tomographic images of Fontainebleau 70, 066135, https://doi.org/10.1103/PhysRevE.70.066135, 2004.
sandstones, J. Geophys. Res., 105, 21509–21527, Peng, S., Hu, Q., Dultz, S., and Zhang, M.: Using X-ray com-
https://doi.org/10.1029/2000JB900208, 2000. puted tomography in pore structure characterization for a Berea
Lis-Śledziona, A.: Petrophysical rock typing and permeability pre- sandstone: Resolution effect, J. Hydrol., 472–473, 254–261,
diction in tight sandstone reservoir, Acta Geophys., 67, 1895– https://doi.org/10.1016/j.jhydrol.2012.09.034, 2012.
1911, https://doi.org/10.1007/s11600-019-00348-5, 2019. Peng, S., Marone, F., and Dultz, S.: Resolution effect in X-ray mi-
Liu, G., Bai, Y., Fan, Z., and Gu, D.: Determination of crocomputed tomography imaging and small pore’s contribution
Klinkenberg Permeability Conditioned to Pore-Throat
https://doi.org/10.5194/se-12-1-2021 Solid Earth, 12, 1–14, 202114 A. Jacob et al.: Simulating permeability reduction by clay mineral nanopores to permeability for a Berea sandstone, J. Hydrol., 510, 403–411, Ufer, K., Kleeberg, R., Bergmann, J., and Dohrmann, R.: Rietveld https://doi.org/10.1016/j.jhydrol.2013.12.028, 2014. Refinement of Disordered Illite-Smectite Mixed-Layer Struc- Pittman, E. D. and Thomas, J. B.: Some Applications of Scanning tures by a Recursive Algorithm. II: Powder-Pattern Refinement Electron Microscopy to the Study of Reservoir Rock, J. Petrol. and Quantitative Phase Analysis, Clay. Clay. Miner., 60, 535– Tech., 31, 1375–1380, https://doi.org/10.2118/7550-PA, 1979. 552, https://doi.org/10.1346/CCMN.2012.0600508, 2012. Prill, T., Schladitz, K., Jeulin, D., Faessel, M., and Wieser, Villiéras, F., Michot, L. J., Bardot, F., Cases, J. M., François, M. C.: Morphological segmentation of FIB-SEM data of and Rudziński, W.: An Improved Derivative Isotherm Summa- highly porous media, J. Microsc.-Oxford, 250, 77–87, tion Method To Study Surface Heterogeneity of Clay Minerals https://doi.org/10.1111/jmi.12021, 2013. † , Langmuir, 13, 1104–1117, https://doi.org/10.1021/la9510083, Saxena, N., Hofmann, R., Alpak, F. O., Berg, S., Diet- 1997. derich, J., Agarwal, U., Tandon, K., Hunter, S., Freeman, Washburn, E. W.: The Dynamics of Capillary Flow, Phys. Rev., 17, J., and Wilson, O. B.: References and benchmarks for pore- 273–283, https://doi.org/10.1103/PhysRev.17.273, 1921. scale flow simulated using micro-CT images of porous me- Wilson, M. D. and Pittman, E. D.: Authigenic Clays in Sand- dia and digital rocks, Adv. Water Resour., 109, 211–235, stones: Recognition and Influence on Reservoir Proper- https://doi.org/10.1016/j.advwatres.2017.09.007, 2017. ties and Paleoenvironmental Analysis, J. Sediment. Res., Saxena, N., Hows, A., Hofmann, R., O. Alpak, F., Freeman, J., 47, 3–31, https://doi.org/10.1306/212F70E5-2B24-11D7- Hunter, S., and Appel, M.: Imaging and computational consid- 8648000102C1865D, 1977. erations for image computed permeability: Operating envelope Worden, R. H. and Morad, S.: Clay Minerals in Sandstones: Con- of Digital Rock Physics, Adv. Water Resour., 116, 127–144, trols on Formation, Distribution and Evolution, in Clay Mineral https://doi.org/10.1016/j.advwatres.2018.04.001, 2018. Cements in Sandstones, edited by: Worden, R. H. and Morad, S., Shah, S. M., Gray, F., Crawshaw, J. P., and Boek, E. S.: Micro- Blackwell Publishing Ltd., Oxford, UK, 1–41, 1999. computed tomography pore-scale study of flow in porous me- Yoon, H. and Dewers, T. A.: Nanopore structures, statisti- dia: Effect of voxel resolution, Adv. Water Resour., 95, 276–287, cally representative elementary volumes, and transport https://doi.org/10.1016/j.advwatres.2015.07.012, 2016. properties of chalk: NANOPORE STRUCTURES, SREV, Soulaine, C., Gjetvaj, F., Garing, C., Roman, S., Russian, A., Gouze, AND FIB-SEM, Geophys. Res. Lett., 40, 4294–4298, P., and Tchelepi, H. A.: The Impact of Sub-Resolution Porosity https://doi.org/10.1002/grl.50803, 2013. of X-ray Microtomography Images on the Permeability, Transp. Zhang, D., Zhang, R., Chen, S., and Soll, W. E.: Pore scale Porous. Med., 113, 227–243, https://doi.org/10.1007/s11242- study of flow in porous media: Scale dependency, REV, 016-0690-2, 2016. and statistical REV, Geophys. Res. Lett., 27, 1195–1198, Spanne, P., Thovert, J. F., Jacquin, C. J., Lindquist, W. B., Jones, K. https://doi.org/10.1029/1999GL011101, 2000. W., and Adler, P. M.: Synchrotron Computed Microtomography Zhao, H., Ning, Z., Wang, Q., Zhang, R., Zhao, T., Niu, of Porous Media: Topology and Transports, Phys. Rev. Lett., 73, T., and Zeng, Y.: Petrophysical characterization of tight 2001–2004, https://doi.org/10.1103/PhysRevLett.73.2001, 1994. oil reservoirs using pressure-controlled porosimetry com- Tinet, A.-J., Corlay, Q., Collon, P., Golfier, F., and Kalo, bined with rate-controlled porosimetry, Fuel, 154, 233–242, K.: Comparison of various 3D pore space reconstruc- https://doi.org/10.1016/j.fuel.2015.03.085, 2015. tion methods and implications on transport properties of nanoporous rocks, Adv. Water Resour., 141, 103615, https://doi.org/10.1016/j.advwatres.2020.103615, 2020. Solid Earth, 12, 1–14, 2021 https://doi.org/10.5194/se-12-1-2021
You can also read