Measured solid state and subcooled liquid vapour pressures of nitroaromatics using Knudsen effusion mass spectrometry
←
→
Page content transcription
If your browser does not render page correctly, please read the page content below
Atmos. Chem. Phys., 20, 8293–8314, 2020
https://doi.org/10.5194/acp-20-8293-2020
© Author(s) 2020. This work is distributed under
the Creative Commons Attribution 4.0 License.

Measured solid state and subcooled liquid vapour pressures of
nitroaromatics using Knudsen effusion mass spectrometry
Petroc D. Shelley1 , Thomas J. Bannan1 , Stephen D. Worrall2 , M. Rami Alfarra1,3 , Ulrich K. Krieger4 ,
Carl J. Percival5 , Arthur Garforth6 , and David Topping1
1 Department    of Earth and Environmental Sciences, University of Manchester, Manchester, UK
2 Aston  Institute of Materials Research, School of Engineering and Applied Science, Aston University, Birmingham, UK
3 National Centre for Atmospheric Science (NCAS), University of Manchester, Manchester, UK
4 Institute for Atmospheric and Climate Science, ETH Zurich, Zurich, Switzerland
5 NASA Jet Propulsion Laboratory, California Institute of Technology, 4800 Oak Grove Dr, Pasadena, CA 91109, USA
6 Department of Chemical Engineering and Analytical Science, University of Manchester, Manchester, UK

Correspondence: Petroc D. Shelley (petroc.shelley@manchester.ac.uk)

Received: 24 January 2020 – Discussion started: 31 January 2020
Revised: 26 May 2020 – Accepted: 23 June 2020 – Published: 17 July 2020

Abstract. Knudsen effusion mass spectrometry (KEMS) was           cles in an electrodynamic balance (EDB). The KEMS and the
used to measure the solid state saturation vapour pressure        EDB showed good agreement with each other for the com-
(PSsat ) of a range of atmospherically relevant nitroaromatic     pounds investigated.
compounds over the temperature range from 298 to 328 K.
The selection of species analysed contained a range of geo-
metric isomers and differing functionalities, allowing for the
impacts of these factors on saturation vapour pressure (P sat )   1   Introduction
to be probed. Three subsets of nitroaromatics were inves-
tigated: nitrophenols, nitrobenzaldehydes and nitrobenzoic        Organic aerosols (OAs) are an important component of the
acids. The PSsat values were converted to subcooled liquid        atmosphere with regards to resolving the impact aerosols
saturation vapour pressure (PLsat ) values using experimental     have on both climate and air quality (Kroll and Seinfeld,
enthalpy of fusion and melting point values measured us-          2008). To predict how OA will behave requires knowledge
ing differential scanning calorimetry (DSC). The PLsat val-       of their physiochemical properties. OAs consist of primary
ues were compared to those estimated by predictive tech-          organic aerosols (POAs) and secondary organic aerosols
niques and, with a few exceptions, were found to be up to         (SOAs). POAs are emitted directly into the atmosphere as
7 orders of magnitude lower. The large differences between        solid or liquid particulates and make up about 20 % of OA
the estimated PLsat and the experimental values can be at-        mass globally (Ervens et al., 2011), but the exact percent-
tributed to the predictive techniques not containing param-       age of POA varies by a significant amount from region to
eters to adequately account for functional group position-        region. SOAs are not emitted into the atmosphere directly
ing around an aromatic ring, or the interactions between said     as aerosols but instead form through atmospheric processes
groups. When comparing the experimental PSsat of the mea-         such as gas-phase photochemical reactions followed by gas-
sured compounds, the ability to hydrogen bond (H bond)            to-particle partitioning in the atmosphere (Pöschl, 2005). A
and the strength of the H bond formed appear to have the          key property for predicting the partitioning of compounds
strongest influence on the magnitude of the P sat , with steric   between the gaseous and aerosol phase is the pure compo-
effects and molecular weight also being major factors. Com-       nent equilibrium vapour pressure, also known as the satura-
parisons were made between the KEMS system and data               tion vapour pressure (P sat ) (Bilde et al., 2015). It has been
from diffusion-controlled evaporation rates of single parti-      estimated that the number of organic compounds in the at-
                                                                  mosphere is in excess of 100 000 (Hallquist et al., 2009);

Published by Copernicus Publications on behalf of the European Geosciences Union.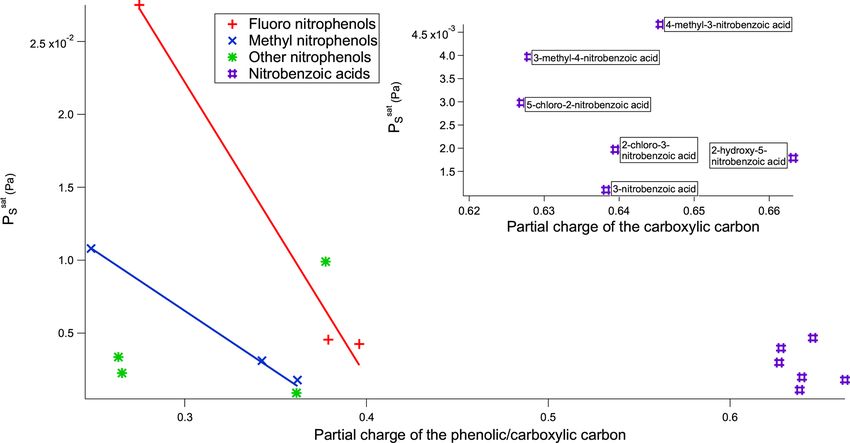
8294                   P. D. Shelley et al.: Measured solid state and subcooled liquid vapour pressures of nitroaromatics

therefore it is not feasible to measure the P sat of each ex-     try with a focus on monofunctional compounds with P sat on
perimentally. Instead, P sat values are often estimated using     the order of 103 –105 Pa (Bilde et al., 2015). SOAs, in con-
group contribution methods (GCMs) that are designed to            trast, are typically multifunctional compounds with P sat of-
capture the functional dependencies on predicting absolute        ten many orders of magnitude below 10−1 Pa (Barley and
values. GCMs start with a base molecule with known prop-          McFiggans, 2010). GCM development, with a focus on the
erties, typically the carbon skeleton. A functional group is      P sat of SOA, has to deal with a lack of robust experimental
then added to the base molecule. This addition will change        data and, historically, large differences in measurement data
the P sat , and the difference between the base molecule and      depending on the technique and instrument used to acquire
the functionalised molecule is the contribution from that par-    the data. To address this problem Krieger et al. (2018) iden-
ticular functional group. If this concept is true then the con-   tified a reference data set for validating P sat measurements
tribution from the functional group should not be affected by     using the polyethylene glycol (PEG) series. To improve the
the base molecule to which it is added (Bilde et al., 2015).      performance of GCMs when applied to highly functionalised
Whilst this is true in many cases, there are numerous ex-         compounds, more data are required that probe both the ef-
ceptions. These exceptions normally occur when proxim-            fect of relative functional group positioning and the effects
ity effects occur, such as neighbouring group interactions        of interaction between functional groups on P sat , such as in
or other mesomeric effects. In this work there will be a fo-      the work by Booth et al. (2012) and Dang et al. (2019). In
cus on the Nannoolal et al. method (Nannoolal et al., 2008),      this study the solid state saturation vapour pressure (PSsat )
the Myrdal and Yalkowsky method (Myrdal and Yalkowsky,            and subcooled liquid saturation vapour pressure (PLsat ) of
1997), and SIMPOL (Pankow and Asher, 2008). Detailed as-          three families of nitroaromatic compounds are determined
sessments of such methods have been made by Barley and            using Knudsen effusion mass spectrometry (KEMS), build-
McFiggans (2010) and O’Meara et al. (2014), often show-           ing on the work done by Dang et al. (2019) and Bannan
ing predicted values differ significantly from experimental       et al. (2017). These include substituted nitrophenols, substi-
data. The limitations and uncertainties of GCMs come from a       tuted nitrobenzoic acids and nitrobenzaldehydes. Nitroaro-
range of factors including underrepresentation of long-chain      matics are useful tracers for anthropogenic emissions (Gros-
hydrocarbons (> C18 ); underrepresentation of certain func-       jean, 1992), and many nitroaromatic compounds are noted
tional groups, such as nitro or nitrate groups; a lack of data    to be highly toxic (Kovacic and Somanathan, 2014). Stud-
for the impact of intramolecular bonding; and the tempera-        ies quantifying the overall role of nitrogen-containing organ-
ture dependence due to the need for extrapolation over large      ics on aerosol formation would also benefit from more re-
temperature ranges to reach ambient conditions (Bilde et al.,     fined P sat (Duporté et al., 2016; Smith et al., 2008). Even
2015). This has important implications for partitioning mod-      if mechanistic models perform poorly in predicting aerosol
elling, in a mechanistic sense, such as an over- or underes-      mass due to missing process phenomena, resolving the par-
timation of the fraction partitioning to the particulate state.   titioning is still important. Several studies have reported the
Different GCMs have different levels of reliability for dif-      observation of methyl nitrophenols (Chow et al., 2016; Ki-
ferent classes of compounds and perform much more reli-           tanovski et al., 2012; Schummer et al., 2009) and nitroben-
ably if the compound of interest resembles those used in the      zoic acids (van Pinxteren and Herrmann, 2007). Nitroben-
parameterisation data set of the GCM (Kurtén et al., 2016).       zaldehydes can form from the photo-oxidation of toluene in
For example, in the assessment by O’Meara et al. (2014), for      a high-NOx environment (Bouya et al., 2017). Both nitro-
the compounds to which it is applicable, EVAPORATION              phenols and nitrobenzoic acids were identified in the review
(Estimation of VApour Pressure of ORganics, Accounting            paper by Bilde et al. (2015) as compounds of interest and
for Temperature, Intramolecular, and Non-additivity effects,      recommendations for further study. Aldehyde groups tend to
Compernolle et al., 2011) was found to give the minimum           have little impact on P sat by themselves but the =O of the
mean absolute error, the highest accuracy for SOA loading         aldehyde group can act as a hydrogen bond acceptor.
estimates and the highest accuracy for SOA composition.               There is a general lack of literature vapour pressure data
Despite this, EVAPORATION should not be used for aro-             for nitroaromatic compounds, and despite recent work on ni-
matic compounds, as there are no aromatic compounds in the        trophenols by Bannan et al. (2017), there is still a lack of data
parameterisation data set (Compernolle et al., 2011). Meth-       on such compounds in the literature. This is reflected, in part,
ods developed with OA in mind, such as EVAPORATION                in the effectiveness of the GCMs to predict the P sat of such
(Compernolle et al., 2011), are not without their limitations     compounds.
due to the lack of experimental data available for highly             Here we present PSsat and PLsat data for 20 nitroaromatic
functionalised, low-volatility organic compounds (Bannan et       compounds. The PSsat data were collected using KEMS with
al., 2017). As the degree of functionality increases, so does     a subcooled correction performed with thermodynamic data
the difficulty in predicting the P sat as more intramolecular     from a differential scanning calorimeter (DSC). The trends in
forces, steric effects and shielding effects must be consid-      the PSsat data are considered, and chemical explanations are
ered. The majority of GCMs designed for estimating P sat of       given to explain the observed differences.
organic compounds were developed for the chemical indus-

Atmos. Chem. Phys., 20, 8293–8314, 2020                                             https://doi.org/10.5194/acp-20-8293-2020
P. D. Shelley et al.: Measured solid state and subcooled liquid vapour pressures of nitroaromatics                          8295

   As identified by Bilde et al. (2015), experimental P sat can   cles effusing through the orifice do not disturb the thermo-
differ by several orders of magnitude among techniques. One       dynamic equilibrium of the cell. The molecular beam is then
way of mitigating this is to collect data for a compound using    ionised using a standard 70 eV electron impact ionisation and
multiple techniques, whilst running reference compounds to        analysed using a quadrupole mass spectrometer.
assess consistency among the employed methods. We there-             After correcting for the ionisation cross section (Booth et
fore use supporting data from the electrodynamic balance          al., 2009), the signal generated is proportional to the P sat .
(EDB) at ETH Zurich for three of the nitroaromatic com-           Once the calibration process is completed it is possible to
pounds.                                                           measure a sample of unknown P sat . When the sample is
   The PLsat data are then compared with the predicted PLsat of   changed it is necessary to isolate the sample chamber from
the GCMs, highlighting where they perform well and where          the measurement chamber using a gate valve so that the sam-
they perform poorly. Finally, these measurements using the        ple chamber can be vented, whilst the ioniser filament and
new PEG reference standards are compared to past KEMS             the secondary electron multiplier (SEM) detector can remain
measurements using an old reference standard due to differ-       on and allow for direct comparisons with the reference com-
ences in experimental P sat between this work and previous        pound. The P sat of the sample can be determined from the
KEMS work.                                                        intensity of the mass spectrum, if the ionisation cross sec-
                                                                  tion at 70 eV and the temperature at which the mass spec-
                                                                  trum was taken are known. The samples of unknown P sat are
2     Experimental                                                typically solid so it is the PSsat that is determined. After the
                                                                  PSsat (Pa) has been determined for multiple temperatures, the
Compound selection
                                                                  Clausius–Clapeyron equation (Eq. 1) can be used to deter-
A total of 10 nitrophenol compounds were selected for this        mine the enthalpy and entropy of sublimation as shown in
study including 9 monosubstituted, 4 nitrobenzaldehydes in-       Booth et al. (2009).
cluding 1 monosubstituted and 6 nitrobenzoic acids includ-                 1Hsub 1Ssub
ing 5 monosubstituted. The nitrophenols are shown in Ta-          ln P sat =     +      ,                                     (1)
                                                                             RT    R
ble 1, the nitrobenzaldehydes are shown in Table 2 and the
nitrobenzoic acids are shown in Table 3. All compounds se-        where T is the temperature (K), R is the ideal gas con-
lected for this study were purchased at a purity of 99 % and      stant (J mol−1 K−1 ), 1Hsub is the enthalpy of sublima-
were used without further preparation. All compounds are          tion (J mol−1 ) and 1Ssub is the entropy of sublimation
solid at room temperature.                                        (J mol−1 K−1 ). P sat was obtained over a range of 30 K in
                                                                  this work, starting at 298 K and rising to 328 K. The reported
2.1    Knudsen effusion mass spectrometry system                  solid state vapour pressures are calculated from a linear fit of
       (KEMS)                                                     ln (P sat ) vs. 1/T using the Clausius–Clapeyron equation.

The KEMS system is the same system that has been used             2.2   Differential scanning calorimetry (DSC)
in previous studies (Bannan et al., 2017; Booth et al., 2009,
2010), and a summary of the measurement procedure will            According to the reference state used in atmospheric mod-
be given here. For a more detailed overview see Booth et          els, and as predicted by GCMs, PLsat is required. Therefore
al. (2009). To calibrate the KEMS, a reference compound           it is necessary to convert the PSsat determined by the KEMS
of known P sat is used. In this study the polyethylene gly-       system into a PLsat . As with previous KEMS studies (Ban-
col series (PEG series), PEG-3 (P298 = 6.68 × 10⁻² Pa) and        nan et al., 2017; Booth et al., 2010, 2017) the melting point
PEG-4 (P298 = 1.69 × 10⁻² Pa) (Krieger et al., 2018), were        (Tm ) and the enthalpy of fusion (1Hfus ) are required for the
used. The KEMS has been shown to accurately measure the           conversion. These values were measured with a TA Instru-
P sat of PEG-4 in the study by Krieger et al. (2018), but the     ments DSC 2500 differential scanning calorimeter (DSC).
KEMS did not measure the P sat of PEG-3. In this study when       Within the DSC, heat flow and temperature were calibrated
using PEG-4 as a reference compound for PEG-3 the mea-            using an indium reference and heat capacity using a sapphire
sured P sat of PEG-3 had an error of 30 % compared to the         reference. A heating rate of 10 K min−1 was used. A sam-
experimental values from Krieger et al. (2018), which is well     ple of 5–10 mg was measured using a microbalance and then
within the quoted 40 % error margin of the KEMS (Booth et         pressed into a hermetically sealed aluminium DSC pan. A
al., 2009). When using PEG-3 as the reference compound for        purge gas of N2 was used with a flow rate of 30 mL min−1 .
PEG-4, the measured P sat of PEG-4 had an error of 20 %.          Data processing was performed using the Trios software
   The reference compound is placed in a temperature-             supplied with the instrument. 1cp,sl was estimated using
controlled Knudsen cell. The cell has a chamfered orifice         1cp,sl = 1Sfus (Grant et al., 1984; Mauger et al., 1972).
through which the sample effuses, creating a molecular
beam. The size of the orifice is ≤ 1/10 the mean free path
of the gas molecules in the cell. This ensures that the parti-

https://doi.org/10.5194/acp-20-8293-2020                                           Atmos. Chem. Phys., 20, 8293–8314, 2020
8296 P. D. Shelley et al.: Measured solid state and subcooled liquid vapour pressures of nitroaromatics
Table 1. Nitrophenols measured with the KEMS.
Compound Structure CAS Supplier
2-Nitrophenol 88-75-5 Acros Organics
3-Methyl-2-nitrophenol 4920-77-8 Sigma-Aldrich
4-Methyl-2-nitrophenol 119-33-5 Acros Organics
5-Fluoro-2-nitrophenol 446-36-6 Fluorochem
4-Amino-2-nitrophenol 119-34-6 Acros Organics
4-Methyl-3-nitrophenol 2042-14-0 Sigma-Aldrich
4-Chloro-3-nitrophenol 610-78-6 Alfa Aesar
3-Methyl-4-nitrophenol 2581-34-2 Fluorochem
2-Fluoro-4-nitrophenol 403-19-0 Fluorochem
3-Fluoro-4-nitrophenol 394-41-2 Acros Organics
Atmos. Chem. Phys., 20, 8293–8314, 2020 https://doi.org/10.5194/acp-20-8293-2020P. D. Shelley et al.: Measured solid state and subcooled liquid vapour pressures of nitroaromatics 8297
Table 2. Nitrobenzaldehydes measured with the KEMS.
Compound Structure CAS Supplier
2-Nitrobenzaldehyde 552-89-6 Sigma-Aldrich
3-Nitrobenzaldehyde 99-61-6 Sigma-Aldrich
2-Chloro-5-nitrobenzaldehyde 6361-21-3 Acros Organics
4-Nitrobenzaldehyde 555-16-8 Sigma-Aldrich
2.3 Electrodynamic balance (EDB) Clausius–Clapeyron equation can be used to calculate P sat at
a given temperature (Eq. 1).
As single particles injected from a dilute solution may ei-
ther stay in a supersaturated liquid state or crystallise, it is
The recently published paper by Dang et al. (2019) measured
important to identify its physical state.
the P sat of several of the same compounds that are stud-
For 4-methyl-3-nitrophenol a 3 % solution dissolved in
ied in this paper using the same KEMS system; however, in
isopropanol was injected into the EDB. After the injection
this study the newly defined best-practice reference sample
and fast evaporation of the isopropanol, all particles were
was used (Krieger et al., 2018), whereas Dang et al. (2019)
non-spherical but with only small deviations from a sphere,
used malonic acid. The difference in reference compound
meaning that it was unclear whether the phase was amor-
led to a discrepancy in the experimental P sat . Supporting
phous or crystalline. To determine the phase of this first ex-
measurements for the compounds were performed using the
periment, a second experiment was performed, where a solid
EDB from ETH Zurich in order to rule out instrumental
particle was injected directly into the EDB. Mass loss with
problems with the KEMS. The EDB from ETH Zurich has
time was measured by following the DC voltage necessary to
been used to investigate P sat of low-volatility compounds
compensate for the gravitational force acting on the particle
in the past (Huisman et al., 2013; Zardini et al., 2006; Zar-
to keep the particle levitating. When comparing the P sat from
dini and Krieger, 2009), and a brief overview will be given
both of these experiments it is clear that the initial measure-
here. For full details see Zardini et al. (2006) and Zardini
ment of 4-methyl-3-nitrophenol was in the crystalline phase.
and Krieger (2009). The EDB can be applied to both liq-
3-Methyl-4-nitrophenol was only injected as a solution but
uid particles and non-spherical solid particles (Bilde et al.,
the particle crystallised and was clearly in the solid state.
2015). The EDB uses a double ring configuration (Davis et
4-Methyl-2-nitrophenol was injected as both a 3 % and
al., 1990) to levitate a charged particle in a cell with a gas
10 % solution. Despite being able to trap a particle, the parti-
flow free from the evaporating species under investigation.
cle would completely evaporate within about 30 s. This evap-
There is precise control of both temperature and relative hu-
oration timescale is too small to allow the EDB to collect
midity within the cell. Diffusion-controlled evaporation rates
any quantitative data. Using the equation for large particles
of the levitated particle are measured at a fixed temperature
neglecting evaporative cooling (Hinds, 1999) (Eq. 2), it is
and relative humidity by precision sizing using optical reso-
nance spectroscopy in backscattering geometry with a broad-
band LED source and Mie theory for the analysis (Krieger et
al., 2018). P sat is calculated at multiple temperatures, and the
https://doi.org/10.5194/acp-20-8293-2020 Atmos. Chem. Phys., 20, 8293–8314, 20208298 P. D. Shelley et al.: Measured solid state and subcooled liquid vapour pressures of nitroaromatics
Table 3. Nitrobenzoic acids measured with the KEMS.
Compound Structure CAS Supplier
5-Chloro-2-nitrobenzoic acid 2516-95-2 Sigma-Aldrich
3-Nitrobenzoic acid 121-92-6 Sigma-Aldrich
4-Methyl-3-nitrobenzoic acid 96-98-0 Sigma-Aldrich
2-Chloro-3-nitrobenzoic acid 3970-35-2 Sigma-Aldrich
2-Hydroxy-5-nitrobenzoic acid 96-97-9 Sigma-Aldrich
3-Methyl-4-nitrobenzoic acid 3113-71-1 Sigma-Aldrich
possible to estimate PLsat : 3 Theory
Rρ · dp2 3.1 Subcooled correction
t= sat , (2)
8DM PT The conversion between PSsat and PLsat is done using the
Prausnitz equation (Prausnitz et al., 1998) (Eq. 3):
where t is the time that the particle was trapped within the
cell of the EDB, R is the ideal gas constant, ρ is the density sat
PL 1Hfus Tm
1cp,sl Tm
of the particle, dp is the diameter of the particle, D is the dif- ln = − 1 − − 1
PSsat RTm T R T
fusion coefficient, M is the molecular mass, T is the temper-
ature, and P sat is the saturation vapour pressure. Equation (2) 1cp,sl Tm
+ ln , (3)
gives approximately 4.3 × 10⁻³ Pa for PLsat at 290 K. R T
where PLsat /PSsat is the ratio between PLsat and PSsat , 1Hfus is
the enthalpy of fusion (J mol−1 ), 1cp,sl is the change in heat
capacity between the solid and liquid states (J mol−1 K−1 ),
T is the temperature (K), and Tm is the melting point (K).
Atmos. Chem. Phys., 20, 8293–8314, 2020 https://doi.org/10.5194/acp-20-8293-2020P. D. Shelley et al.: Measured solid state and subcooled liquid vapour pressures of nitroaromatics 8299
3.2 Vapour pressure predictive techniques is used for halogen-containing compounds. When selecting
a GCM to model P sat it is essential to investigate whether
The most common P sat prediction techniques are GCMs. the method is applicable to the compounds of interest. Of
Several different GCMs have been developed (Moller et al., the popular P sat GCMs, the Myrdal and Yalkowsky method
2008; Myrdal and Yalkowsky, 1997; Nannoolal et al., 2008; (Myrdal and Yalkowsky, 1997) contains only three nitroaro-
Pankow and Asher, 2008) with some being more general and matic compounds, the Nannoolal et al. method (Nannoolal et
others, such as the EVAPORATION method (Compernolle et al., 2008) contains 13, the Moller et al. (2008) method con-
al., 2011), having been developed with OA as the target com- tains no more than 14, SIMPOL (Pankow and Asher, 2008)
pounds. The Myrdal and Yalkowsky method (Myrdal and contains 25 and EVAPORATION (Compernolle et al., 2011)
Yalkowsky, 1997), the Nannoolal et al. method (Nannoolal et contains zero. The specific nitroaromatics used by the Nan-
al., 2008), and the Moller et al. method (Moller et al., 2008) noolal et al. method and the Moller et al. method are not
are combined methods requiring a boiling point, Tb , as an in- stated (to the author’s knowledge) as the data were taken di-
put. If the Tb of a compound is known experimentally it is rectly from the Dortmund Data Bank. Despite the SIMPOL
an advantage, but most atmospherically relevant compounds (Pankow and Asher, 2008) method containing 25 nitroaro-
have an unknown Tb so the Tb that is used as an input is cal- matic compounds, 11 of these are taken from a gas chro-
culated using a GCM. The combined methods use a Tb calcu- matography method using a single data point from a single
lated using a GCM for many of the same reasons that GCMs data set (Schwarzenbach et al., 1988).
are used to calculate P sat , i.e. the difficulty in acquiring ex-
perimental data for highly reactive compounds or compounds 3.3 Inductive and resonance effects
with short lifetimes. The Nannoolal et al. method (Nannoolal
et al., 2004), Stein and Brown method (Stein and Brown, All functional groups around an aromatic ring either with-
1994), and Joback and Reid method (Joback et al., 1987) are draw or donate electron density. This is a result of two ma-
most commonly used. The Joback and Reid method is not jor effects, the inductive effect and the resonance effect, or
considered in this paper due to its known biases (Barley and a combination of the two (Ouellette et al., 2015a). The in-
McFiggans, 2010), with the Stein and Brown method being ductive effect is the unequal sharing of the bonding electron
an improved version of Joback and Reid. The Tb used in the through a chain of atoms within a molecule. A methyl group
combined methods is, however, another source of potential donates electron density, relative to a hydrogen atom, so is
error, and for methods that extrapolate P sat from Tb , the size therefore considered an electron-donating group, whereas a
of this error increases with increasing difference between chloro group withdraws electron density and is therefore con-
Tb and the temperature to which it is being extrapolated sidered an electron-withdrawing group. The resonance effect
(O’Meara et al., 2014). EVAPORATION (Compernolle et al., occurs when a compound can have multiple resonance forms.
2011) and SIMPOL (Pankow and Asher, 2008) do not require In a nitro group, as the oxygen atoms are more electroneg-
a boiling point, only requiring a structure and a temperature ative than the nitrogen atom, a pair of electrons from the
of interest. The main limitation for many GCMs, aside from nitrogen–oxygen double bond can be moved onto the oxygen
the data required to create and refine them, is not accounting atom followed by a pair of electrons being moved out of the
for intramolecular interactions, such as hydrogen bonding, or ring to form a carbon–nitrogen double bond and leaving the
steric effects. The Nannoolal et al. method (Nannoolal et al., ring with a positive charge. This leads to the nitro group act-
2008), Moller et al. method (Moller et al., 2008) and EVAP- ing as an electron-withdrawing group. In an amino group, on
ORATION (Compernolle et al., 2011) attempt to address this the other hand, the hydrogens are not more electronegative
by having secondary interaction terms. In the Nannoolal et al. than the nitrogen; instead the lone pair on the nitrogen can
method (Nannoolal et al., 2008), there are terms to account be donated into the ring, causing the ring to have a negative
for ortho, meta and para isomerism of aromatic compounds; charge and the amino group to act as an electron-donating
however, there are no terms for dealing with tri- or greater group. Examples of the inductive effect and the resonance
substituted aromatics, and in these instances all isomers give effect are given in Fig. 1 (Ouellette et al., 2015a).
the same prediction. A common misuse of GCMs occurs Some functional groups, such as an aromatic OH group,
when a GCM is applied to a compound containing function- can both donate and withdraw electron density at the same
ality not included in the training set, e.g. using EVAPORA- time. In phenol the OH group withdraws electron density via
TION (Compernolle et al., 2011) with aromatic compounds the inductive effect, but it also donates electron density via
or using SIMPOL (Pankow and Asher, 2008) with com- the resonance effect. This is shown in Fig. 2. As the reso-
pounds containing halogens. As the GCM does not have the nance effect is typically much stronger than the inductive ef-
tools to deal with this functionality it will either misattribute fect, OH has a net donation of electron density in phenol (see
a contribution, in the EVAPORATION (Compernolle et al., Fig. 2).
2011) example the aromatic structure would be treated as a The positioning of the functional groups around the aro-
cyclical aliphatic structure, or simply ignore the functional- matic ring determines to what extent the inductive and reso-
ity, as is the case when SIMPOL (Pankow and Asher, 2008) nance effects occur. The changes in electron density due to
https://doi.org/10.5194/acp-20-8293-2020 Atmos. Chem. Phys., 20, 8293–8314, 20208300 P. D. Shelley et al.: Measured solid state and subcooled liquid vapour pressures of nitroaromatics
Figure 1. The inductive effect and the resonance effect.
Figure 2. Phenol can withdraw electron density via the inductive
effect (a) and donate electron density via the resonance effect (b). Figure 3. Intramolecular hydrogen bonding in 2-fluoro-4-
nitrophenol (a) in comparison to intermolecular hydrogen bonding
in 3-fluoro-4-nitrophenol (b).
the inductive effect and the resonance effect also change the
partial charges on the atoms within the aromatic ring. These
changes impact the strength of any potential H bonds that
bonding. The nitrophenols and nitrobenzoic acids studied ex-
may form.
hibit a range of overlapping PSsat so nothing can be inferred
when considering these two types of compounds together as
4 Results and discussion groups; therefore the differences within each of the groups
must be considered.
4.1 Solid state vapour pressure Considering first the nitrophenols, Table 4, the highest PSsat
compound is 2-fluoro-4-nitrophenol (2.75 × 10⁻² Pa). There
PSsat values measured directly by the KEMS are given in are two potential H-bonding explanations for why this com-
Tables 4, 5 and 6 for the nitrophenols, nitrobenzaldehy- pound has such a high PSsat relative to the other nitrophe-
des and nitrobenzoic acids respectively. Measurements were nols and fluoro nitrophenols. First, in this isomer the pres-
made at increments of 5 K from 298 to 328 K, with the ence of the F atom on the C adjacent to the OH group gives
exception of the following compounds that melted during rise to intramolecular H bonding (Fig. 3a), which reduces the
the temperature ramp. 2-Nitrophenol was measured between extent of intermolecular interaction possible and increases
298 and 318 K, 3-methyl-4-nitrophenol was measured be- PSsat . This effect can clearly be seen from the fact that in
tween 298 and 313 K, 4-methyl-2-nitrophenol was measured 3-fluoro-4-nitrophenol, where the F atom is positioned fur-
between 298 and 303 K, 5-fluoro-2-nitrophenol was mea- ther away from the OH group, the PSsat is significantly lower
sured between 298 and 308 K, and 2-nitrobenzaldehyde was (4.55 × 10⁻³ ) due to the fact that intermolecular H bond-
measured between 298 and 313 K. The Clausius–Clapeyron ing can occur (Fig. 3b). However, in the work by Shugrue
equation (Eq. 1) was used to calculate the enthalpies and et al. (2016) it is stated that neutral organic fluoro and nitro
entropies of sublimation. The melting points of compounds groups form very weak hydrogen bonds, which whilst they
studied are given in Table 7. Generally speaking, considering do exist, can be difficult to even detect by many conventional
the different groups of compounds as a whole, the nitroben- methods.
zaldehydes studied exhibit higher PSsat (order of magnitude) The second explanation depends on the inductive ef-
than the nitrophenols and nitrobenzoic acids studied. This is fect mentioned previously. By using MOPAC2016 (Stewart,
most likely due to the fact that none of the nitrobenzalde- 2016), a semi-empirical quantum chemistry program based
hydes studied herein are capable of undergoing hydrogen on the neglect of diatomic differential overlap (NDDO) ap-
bonding (H bonding), whilst all of the nitrophenols and ni- proximation (Dewar and Thiel, 1977), the partial charges of
trobenzoic acids, to varying extents, are capable of hydrogen the phenolic carbon can be calculated. The partial charge of
Atmos. Chem. Phys., 20, 8293–8314, 2020 https://doi.org/10.5194/acp-20-8293-2020P. D. Shelley et al.: Measured solid state and subcooled liquid vapour pressures of nitroaromatics 8301
Table 4. PSsat at 298 K, enthalpies and entropies of sublimation, and partial charge of the phenolic carbon of nitrophenols determined using
KEMS.
Compound P298 1Hsub 1Ssub Partial charge of the
(Pa) (kJ mol−1 ) (J mol−1 K−1 ) phenolic carbon
2-Nitrophenol 8.94 × 10⁻⁴ 79.32 206.78 0.362
3-Methyl-2-nitrophenol 9.90 × 10⁻³ 94.79 279.50 0.378
4-Methyl-2-nitrophenol 3.11 × 10⁻³ 95.26 271.45 0.343
5-Fluoro-2-nitrophenol 4.25 × 10⁻³ 95.84 276.14 0.396
4-Amino-2-nitrophenol 3.36 × 10⁻³ 111.24 325.81 0.264
4-Methyl-3-nitrophenol 1.08 × 10⁻² 96.14 284.98 0.249
4-Chloro-3-nitrophenol 2.26 × 10⁻³ 104.49 299.83 0.266
3-Methyl-4-nitrophenol 1.78 × 10⁻³ 90.85 251.97 0.362
2-Fluoro-4-nitrophenol 2.75 × 10⁻² 103.76 317.90 0.275
3-Fluoro-4-nitrophenol 4.55 × 10⁻³ 108.61 319.55 0.379
A similar trend occurs in the methyl nitrophenols as in
the fluoro nitrophenols with a larger partial charge of the
phenolic carbon corresponding to a lower PSsat , as shown in
Fig. 5. 3-Methyl-2-nitrophenol is an exception to this and
is discussed shortly. 3-Methyl-4-nitrophenol has the most
positive partial charge with 0.362 and the lowest PSsat of
1.78 × 10⁻³ Pa, 4-methyl-2-nitrophenol has the next most
positive partial charge of 0.343 and the next lowest PSsat of
3.11 × 10⁻³ , and 4-methyl-3-nitrophenol has the least pos-
itive partial charge of 0.249 and the highest PSsat of 1.08 ×
Figure 4. The orientation of the OH group can impact the partial 10−2 . 3-Methyl-2-nitrophenol does not follow this trend,
charge of the phenolic carbon. however, with it having a partial charge of 0.378 and a PSsat
of 9.90 × 10⁻³ . As shown in Fig. 5, 3-methyl-2-nitrophenol
would be expected to have a much lower PSsat than is ob-
served due to the high partial charge on the phenolic carbon.
the phenolic carbon can be dependent on the orientation of A possible explanation as to why 3-methyl-2-nitrophenol
the OH if the molecule does not have a plane of symmetry, does not follow this same trend is the positioning of its func-
so in this work the partial charge used is an average of the tional groups. As shown in Fig. 6a, all of the functional
two extreme orientations of the OH, as shown in Fig. 4. A groups are clustered together and the proximity of the func-
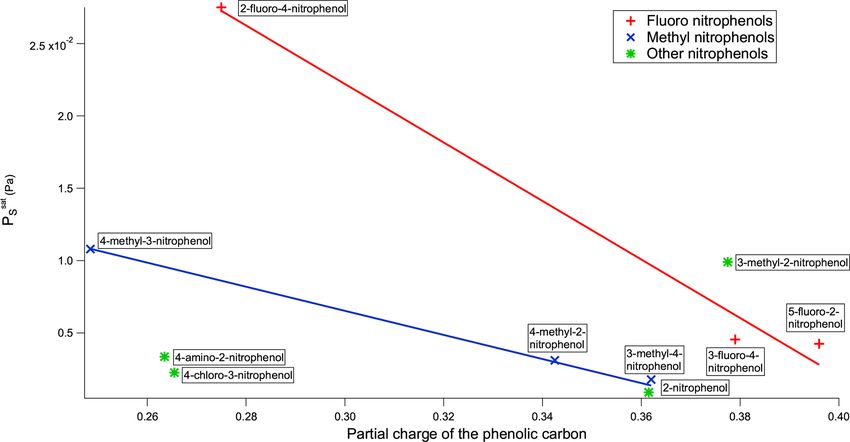
plot of PSsat vs. the partial charge of the phenolic carbon for tional groups sterically hinders the formation of H bonds,
the nitrophenols can be found in Fig. 5. thus increasing the PSsat . Conversely as shown in Fig. 6b
The partial charge of the phenolic carbon in 2-fluoro-4- the fact that the methyl group is further away in 4-methyl-
nitrophenol is 0.275 with a PSsat of 2.75 × 10⁻² Pa, whereas 2-nitrophenol leads to less steric hindrance of H-bond for-
for 3-fluoro-4-nitrophenol it is 0.379 with a PSsat of 4.55 × mation.
10−3 Pa. The more positive the partial charge of the phenolic Whilst 3-methyl-2-nitrophenol has a higher PSsat than is
carbon the better it is able to stabilise the increased negative expected given the partial charge on the phenolic carbon, 4-
charge which will develop on the O atom as a result of H- amino-2-nitrophenol has a much lower PSsat (Fig. 5). This is
bond formation. As a result stronger intermolecular H bonds likely due to 4-amino-2-nitrophenol being capable of form-
are formed, therefore giving rise to a lower PSsat . Moving ing more than one hydrogen bond, whereas all the other
the nitro group from being para to the OH in 3-fluoro-4- compounds investigated were only capable of forming one
nitrophenol to meta to the OH in 5-fluoro-2-nitrophenol fur- H bond. However, despite 4-amino-2-nitrophenol being ca-
ther reduces the PSsat to 4.25×10⁻³ Pa. This reduction in PSsat pable of forming more than 1 H bond, replacing the methyl
can also be explained via the combination of the inductive group on 4-methyl-2-nitrophenol with an amino group to
effect and the resonance effect as the partial charge of the form 4-amino-2-nitrophenol surprisingly increases the PSsat
phenolic carbon rises from 0.379 to 0.396, again implying from 3.11 × 10⁻³ to 3.36 × 10⁻³ Pa. The higher PSsat can be
stronger intermolecular H bonds and, therefore, a lower PSsat . explained via the combination of the inductive effect and
For the fluoro nitrophenols, as shown in Fig. 5, as the partial the resonance effect. Whilst the partial charge of the phe-
charge of the phenolic carbon increases the PSsat increases.
https://doi.org/10.5194/acp-20-8293-2020 Atmos. Chem. Phys., 20, 8293–8314, 20208302 P. D. Shelley et al.: Measured solid state and subcooled liquid vapour pressures of nitroaromatics
Figure 5. PSsat vs. partial charge of the phenolic carbon of the nitrophenols.
on 4-methyl-3-nitrophenol with a chloro group to form 4-
chloro-3-nitrophenol reduces the PSsat from 1.08 × 10⁻² to
2.26×10⁻³ Pa. This reduction in PSsat can be explained by the
increase in partial charge of the phenolic carbon from 0.249
to 0.266, as well as a 13 % increase in molecular weight.
Replacing the F atom in 3-fluoro-4-nitrophenol with a
methyl group to form 3-methyl-4-nitrophenol further reduces
the PSsat (1.78 × 10⁻³ ), although exactly why is unclear. The
methyl group cannot engage in intermolecular H bonding; it
will sterically hinder any H bonding that the NO2 group un-
dergoes; and it reduces the partial charge of the phenolic car-
Figure 6. Diagram emphasising how the proximity of the bulky bon of the molecule (from 0.379 to 0.362) (Stewart, 2016),
methyl group sterically hinders intermolecular interactions with the which would reduce the strength of H-bonding interactions
nitro group in 3-methyl-2-nitrophenol (a) but not in 4-methyl-2- between the molecules. It is possible that the crystallographic
nitrophenol (b). packing density of 3-methyl-4-nitrophenol is higher although
no data are available to support this, although when look-
ing at PLsat data (Sect. 4.2) 3-methyl-4-nitrophenol exhibits a
higher PLsat than 3-fluoro-4-nitrophenol, which is what would
nolic carbon in 4-methyl-2-nitrophenol is 0.343, the partial
be expected given the respective partial charges of the phe-
charge of the phenolic carbon in 4-amino-2-nitrophenol is
nolic carbons.
only 0.264, and the partial charge of the carbon bonded to the
Removing the methyl group from 4-methyl-2-nitrophenol
amine group is only 0.211. So whilst 4-amino-2-nitrophenol
to give 2-nitrophenol causes the PSsat to drop from 3.11 ×
is capable of forming two intermolecular H bonds compared
10−3 to 8.94 × 10⁻⁴ Pa. This reduction in PSsat matches an
to 4-methyl-2-nitrophenol’s one, they will be much weaker.
increase in the positive partial charge of the phenolic carbon,
4-Amino-2-nitrophenol is a good example of a compound
from 0.343 to 0.383, implying an increase in the strength of
with multiple competing factors affecting PSsat leading to
the intermolecular H bonds and therefore a reduction in PSsat .
higher PSsat than would be expected due to one factor and
Now considering the nitrobenzaldehydes (Table 5) the
lower PSsat than expected from another.
highest PSsat compound is 2-nitrobenzaldehyde (3.32×10⁻¹ ).
Similar to 4-amino-2-nitrophenol, 4-chloro-3-nitrophenol
Comparing this to 2-nitrophenol (8.94 × 10⁻⁴ ) shows how
also has a lower PSsat than expected according to the par-
significant the ability to form H bonds is to the PSsat of
tial charge of the phenolic carbon. This can be seen in
a compound, with replacing a hydroxyl group (capable of
Fig. 5. Unlike 4-amino-2-nitrophenol the explanation for 4-
H bonding) with an aldehyde group (incapable of H bond-
chloro-3-nitrophenol is simpler. Replacing the methyl group
Atmos. Chem. Phys., 20, 8293–8314, 2020 https://doi.org/10.5194/acp-20-8293-2020P. D. Shelley et al.: Measured solid state and subcooled liquid vapour pressures of nitroaromatics 8303
Table 5. PSsat at 298 K, enthalpies and entropies of sublimation, and crystallographic packing densities of nitrobenzaldehydes determined
using KEMS.
Compound P298 1Hsub 1Ssub Crystallographic
(Pa) (kJ mol−1 ) (J mol−1 K−1 ) packing density
2-Nitrobenzaldehyde 3.32 × 10⁻¹ 73.81 238.13 1.473
3-Nitrobenzaldehyde 1.21 × 10⁻¹ 83.51 262.67 1.528
2-Chloro-5-nitrobenzaldehyde 4.21 × 10⁻² 101.26 313.39
4-Nitrobenzaldehyde 3.40 × 10⁻² 103.80 320.10 1.546
Figure 7. PSsat vs. packing density of the nitrobenzaldehydes.
ing) raising the PSsat of the compound by more than 2 or- weight the greater the overall extent of interaction between
ders of magnitude. The decrease in PSsat observed by mov- its molecules and the lower its PSsat .
ing the nitro group from being ortho to the aldehyde group Finally, considering the nitrobenzoic acids (Table 6),
in 2-nitrobenzaldehyde to being meta in 3-nitrobenzaldehyde the highest PSsat compound is 4-methyl-3-nitrobenzoic acid
(1.21 × 10⁻¹ ) and para in 4-nitrobenzaldehyde (3.40 × 10⁻² ) (4.67 × 10⁻³ ). Its isomer, 3-methyl-4-nitrobenzoic acid, pos-
can be explained using the different crystallographic packing sesses a slightly lower PSsat (3.97×10⁻³ ) as well as a slightly
densities of the three isomers as shown in Fig. 7. Crystallo- lower partial charge of the carboxylic carbon (0.644 vs.
graphic packing density is a measure of how densely packed 0.628) although the difference in PSsat is not significant.
the molecules of a given compound are when they crystallise Removing the methyl group from 4-methyl-3-nitrobenzoic
– the more closely packed molecules are the greater the over- acid to give 3-nitrobenzoic acid (1.10 × 10⁻³ ) reduces the
all extent of interaction between them and the lower the PSsat . observed PSsat most likely due to the reduction in steric
The order of the PSsat observed here for the three isomers hindrance around the nitro group, which would allow
of nitrobenzaldehyde matches that of their crystallographic for more effective H bonding. In addition 3-nitrobenzoic
packing densities (Coppens and Schmidt, 1964; Engwerda et acid possesses a lower PSsat than the corresponding 3-
al., 2018; King and Bryant, 1996), with the lowest PSsat cor- nitrobenzaldehyde due to its ability to form H bonds. Adding
relating with the highest packing density and vice versa. a hydroxyl group or a Cl atom to 3-nitrobenzoic acid to give
The addition of a Cl atom to 3-nitrobenzaldehyde is also 2-hydroxy-5-nitrobenzoic acid (1.79 × 10⁻³ ) or 2-chloro-3-
observed to decrease the PSsat compounds. This can be simply nitrobenzoic acid (1.97 × 10⁻³ ) respectively increases the
rationalised due to the greater than 25 % increase this causes observed PSsat as the addition of the extra functional group
to the molecular weight. The higher a compound’s molecular leads to increased intramolecular H bonding occurring. Ad-
ditionally, comparing 2-hydroxy-5-nitrobenzoic acid with 2-
https://doi.org/10.5194/acp-20-8293-2020 Atmos. Chem. Phys., 20, 8293–8314, 20208304 P. D. Shelley et al.: Measured solid state and subcooled liquid vapour pressures of nitroaromatics
Table 6. PSsat at 298 K, enthalpies and entropies of sublimation, and partial charge of the carboxylic carbon of nitrobenzoic acids determined
using KEMS.
Compound P298 1Hsub 1Ssub Partial charge of the
(Pa) (kJ mol−1 ) (J mol−1 K−1 ) carboxylic carbon
5-Chloro-2-nitrobenzoic acid 2.98 × 10⁻³ 80.66 221.09 0.627
3-Nitrobenzoic acid 1.10 × 10⁻³ 87.82 237.49 0.638
4-Methyl-3-nitrobenzoic acid 4.67 × 10⁻³ 74.66 205.82 0.646
2-Chloro-3-nitrobenzoic acid 1.97 × 10⁻³ 73.54 194.48 0.640
2-Hydroxy-5-nitrobenzoic acid 1.79 × 10⁻³ 78.20 209.30 0.663
3-Methyl-4-nitrobenzoic acid 3.97 × 10⁻³ 65.95 175.21 0.628
fluoro-4-nitrophenol demonstrates how the increased abil- gether intramolecular H bonding can occur, which competes
ity of carboxylic acid to partake in H bonding compared with intermolecular H bonding and generally raises PSsat . The
to an F atom leads to a suppression of PSsat . 5-Chloro-2- positioning of non-H-bonding functional groups within the
nitrobenzoic acid has a higher PSsat (2.98 × 10⁻³ Pa) than molecule can also have an impact upon the extent of H bond-
2-chloro-3-nitrobenzoic acid (1.97 × 10⁻³ Pa), its structural ing, with bulky substituents positioned close to H-bonding
isomer. The increase in PSsat can be attributed to the increased groups causing steric hindrance, which reduces the extent of
partial charge of the carbon within the carboxylic acid group H bonding and generally raises PSsat . The positioning of all
(0.627 increasing to 0.640). the functional groups around the aromatic ring affect the par-
When comparing nitrobenzoic acids as a whole with ni- tial charges of the atoms, via a combination of the inductive
trophenols, nitrobenzoic acids have a much higher PSsat than effect and the resonance effect. The inductive effect and the
would be expected based solely on the partial charges of the partial charges appear to be most important when compar-
carboxylic carbon. As can be seen in Fig. 8, there is over- ing isomers and less important when one functional group
lap in the range of PSsat for the nitrobenzoic acids and many has been swapped for another. In addition greater molecular
of the nitrophenols; however, there is no overlap in terms of weight and increased crystallographic packing density also
partial charges of the carboxylic and phenolic carbons, with negatively correlate with PSsat as they both lead to increased
all of the nitrobenzoic acids having partial charges of the car- overall intermolecular interactions. However in many cases
boxylic carbon greater than 0.6, whilst the nitrophenols had these different factors compete with each other, making it
much lower partial charges of the phenolic carbon between difficult to predict the expected PSsat , and currently it is not
0.2 and 0.4. It is widely known that the H bonds of carboxylic possible to determine which factor will dominate in any
acids are stronger than the H bonds of alcohols (Ouellette et given case. Dipole moments were also investigated but over-
al., 2015b), so therefore it would be expected that the car- all showed very little impact on PSsat .
boxylic acids would have a lower PSsat . A likely reason as to
why the PSsat of the nitrobenzoic acids is higher than would 4.2 Subcooled liquid vapour pressure
be expected, compared to the nitrophenols, based only on the
partial charge of the carboxylic carbon is the propensity for The PLsat were obtained from the PSsat using thermochemical
carboxylic acids to dimerise (see Fig. 9). Nitrophenols are data obtained through use of a DSC and Eq. (3). The results
unable to dimerise, instead being able to form H bonds with are detailed in Table 7.
up to two other molecules as shown in Fig. 9. By dimeris- Comparing the PLsat of the nitrophenols with the solid state
ing, the nitrobenzoic acids, despite having much stronger values there are a few changes in the overall ordering, but
H bonds than the nitrophenols, will not have a proportion- they mostly have little effect upon the preceding discussion.
ally lower PSsat . A few previously significant increases/decreases in P sat be-
In summary the ability to form H bonds appears to be come insignificant, and a few that were insignificant are now
the most significant factor affecting the PSsat of a com- significant. One point of note, however, is that 3-methyl-4-
pound, where molecules that are able to form these strong nitrophenol (5.86 × 10⁻² ) now exhibits a higher P sat than 3-
intermolecular interactions generally always exhibit lower fluoro-4-nitrophenol (3.32 × 10⁻² ). This trend is what would
PSsat than those that cannot. Additionally different functional be expected based on the reduction in steric hindrance, in-
groups are able to form different numbers of H bonds, with creased potential for H bonding and increase in the partial
those that are able to form more H bonds generally suppress- charge of the phenolic carbon that the F atom provides in
ing PSsat to a greater extent than those that form less. The rela- comparison to the methyl group.
tive positioning of those functional groups responsible for the
H bonding is also important as when positioned too close to-
Atmos. Chem. Phys., 20, 8293–8314, 2020 https://doi.org/10.5194/acp-20-8293-2020P. D. Shelley et al.: Measured solid state and subcooled liquid vapour pressures of nitroaromatics 8305 Figure 8. PSsat vs. partial charge of the phenolic/carboxylic carbon of the nitrophenols and nitrobenzoic acids. Figure 9. Diagram demonstrating how a carboxylic acid functionality allows a molecule to dimerise using H bonds in 4-methyl-3- nitrobenzoic acid (a) whilst a hydroxyl group only allows for hydrogen bonding to two other molecules with no opportunity to dimerise in 4-methyl-3-nitrophenol (b). For the nitrobenzaldehydes one change in the overall or- (5.76 × 10⁻² ). This change could be explained as a result dering of the P sat s is observed after converting to PLsat , but of the higher partial charge of the carboxylic carbon of 4- this has no effect on the preceding discussion. methyl-3-nitrobenzoic acid (0.646 vs. 0.628) (Stewart, 2016) Finally, for the nitrobenzoic acids, whilst some previously playing a more important role in the subcooled liquid state insignificant differences in PSsat have now become signifi- than in the solid state. cant, the only change that impacts upon the discussion is that the P sat of 3-methyl-4-nitrobenzoic acid (3.04 × 10⁻¹ ) is now higher than that of 4-methyl-3-nitrobenzoic acid https://doi.org/10.5194/acp-20-8293-2020 Atmos. Chem. Phys., 20, 8293–8314, 2020
8306                      P. D. Shelley et al.: Measured solid state and subcooled liquid vapour pressures of nitroaromatics

Table 7. PLsat , melting point, and the enthalpy and entropy of fusion of the nitrophenols.

                         Compound                                    P298        Tm         1Hfus             1Sfus
                                                                     (Pa)        (K)    (kJ mol−1 )   (J mol−1 K−1 )
                         2-Nitrophenol                       1.38 × 10⁻³      319.77          18.55           58.02
                         3-Methyl-2-nitrophenol              1.22 × 10⁻²      313.47          10.73           34.23
                         4-Methyl-2-nitrophenol              3.29 × 10⁻³      306.67           2.43            7.92
                         5-Fluoro-2-nitrophenol              5.01 × 10⁻³      309.16          11.63           37.62
                         4-Amino-2-nitrophenol               9.29 × 10⁻³      401.89          37.15           92.44
                         4-Methyl-3-nitrophenol              6.85 × 10⁻²      351.59          32.74           93.13
                         4-Chloro-3-nitrophenol              5.80 × 10⁻²      400.32          36.15           90.31
                         3-Methyl-4-nitrophenol              5.86 × 10⁻²      401.27          38.87           96.86
                         2-Fluoro-4-nitrophenol              6.42 × 10⁻²      394.17           9.95           25.24
                         3-Fluoro-4-nitrophenol              3.32 × 10⁻²      366.46          29.36           80.12
                         2-Nitrobenzaldehyde                   2.15 × 100     317.66          77.98          245.49
                         3-Nitrobenzaldehyde                 2.75 × 10⁻¹      332.71          20.66           62.09
                         2-Chloro-5-nitrobenzaldehyde        8.41 × 10⁻²      353.38          12.30           34.82
                         4-Nitrobenzaldehyde                 1.93 × 10⁻¹      380.40          22.51           59.16
                         5-Chloro-2-nitrobenzoic acid        1.40 × 10⁻²      458.17          13.75           30.00
                         3-Nitrobenzoic acid                 1.90 × 10⁻³      418.03           5.57           13.33
                         4-Methyl-3-nitrobenzoic acid        5.76 × 10⁻²      464.70          21.87           47.06
                         2-Chloro-3-nitrobenzoic acid        6.29 × 10⁻³      458.17          10.28           22.43
                         2-Hydroxy-5-nitrobenzoic acid       1.87 × 10⁻²      505.55          18.68           36.95
                         3-Methyl-4-nitrobenzoic acid        3.04 × 10⁻¹      492.43          35.39           71.86

4.3    Comparison with estimations from GCMs                                evant P sat data have been collected after the end of the devel-
                                                                            opment of this model. The Myrdal and Yalkowsky method’s
                                                                            (Myrdal and Yalkowsky, 1997) reliance on a predicted boil-
In Fig. 10 the experimentally determined PLsat values of the
                                                                            ing point may also be a major source of error in the P sat
nitroaromatics are compared to the predicted values of sev-
                                                                            predictions of the nitroaromatics.
eral GCMs. All predicted values can be found in Table S1
                                                                               On average the SIMPOL method (Pankow and Asher,
in the Supplement. The average difference between the ex-
                                                                            2008) predicts values closest to the experimental data, on
perimental PLsat and the predicted PLsat for each class of com-
                                                                            average predicting PLsat 1.3 orders of magnitude higher than
pound and overall is shown in Table 8. These GCMs are SIM-
                                                                            the experimental values, despite absolute differences of up to
POL (Pankow and Asher, 2008), the Nannoolal et al. method
                                                                            4.4 orders of magnitude.
(Nannoolal et al., 2008), and the Myrdal and Yalkowsky
                                                                               The Nannoolal et al. method (Nannoolal et al., 2004) is
method (Myrdal and Yalkowsky, 1997). The Nannoolal et
                                                                            persistently worse than the Stein and Brown method (Stein
al. method (Nannoolal et al., 2008) and the Myrdal and
                                                                            and Brown, 1994) for the nitroaromatic compounds involved
Yalkowsky method (Myrdal and Yalkowsky, 1997) are both
                                                                            in this study as shown in Table 8. When discussing the Nan-
combined methods which require a boiling point to func-
                                                                            noolal et al. method (Nannoolal et al., 2008) and the Myrdal
tion. As for many compounds where the experimental boiling
                                                                            and Yalkowsky method (Myrdal and Yalkowsky, 1997) from
point is unknown, boiling point group contribution methods
                                                                            this point onwards they are used with the Stein and Brown
are required. The Nannoolal et al. method (Nannoolal et al.,
                                                                            method (Stein and Brown, 1994) unless stated otherwise.
2004) and the Stein and Brown method (Stein and Brown,
                                                                               The Nannoolal et al. method (Nannoolal et al., 2008) has
1994) are used.
                                                                            slightly better agreement with the experimental data when
   The Myrdal and Yalkowsky method (Myrdal and
                                                                            compared to the Myrdal and Yalkowsky method (Myrdal
Yalkowsky, 1997) shows poor agreement with the experi-
                                                                            and Yalkowsky, 1997), on average predicting PLsat 2.52 or-
mental data for almost all compounds but is not particu-
                                                                            ders of magnitude higher than the experimental values,
larly surprising given that it only contains three nitroaro-
                                                                            whereas the Myrdal and Yalkowsky method (Myrdal and
matic compounds in this method’s fitting data set, with none
                                                                            Yalkowsky, 1997) on average predicts PLsat 2.65 orders of
of these compounds containing both a nitro group and an-
                                                                            magnitude higher than the experimental values. The Nan-
other oxygen-containing group. The Myrdal and Yalkowsky
                                                                            noolal et al. method (Nannoolal et al., 2008), unlike the oth-
method (Myrdal and Yalkowsky, 1997) is the oldest method
                                                                            ers, contains parameters for ortho, meta and para isomerism
examined in this study, and much of the atmospherically rel-

Atmos. Chem. Phys., 20, 8293–8314, 2020                                                       https://doi.org/10.5194/acp-20-8293-2020
P. D. Shelley et al.: Measured solid state and subcooled liquid vapour pressures of nitroaromatics 8307
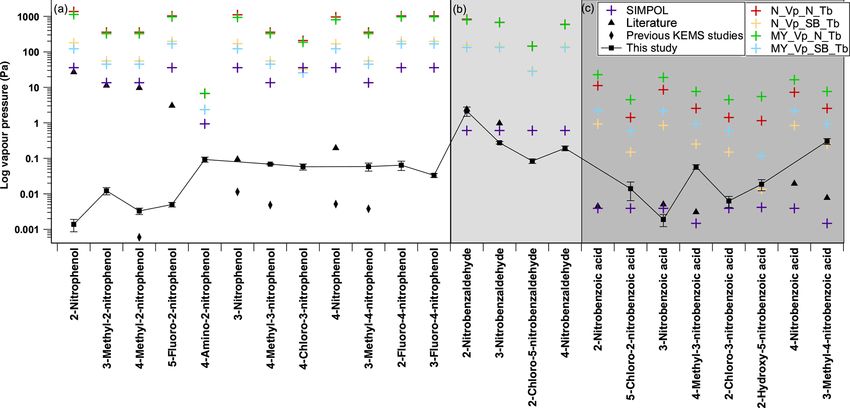
Figure 10. Comparison of estimated and measured subcooled saturation vapour pressures. N_Vp (Nannoolal vapour pressure), MY_Vp
(Myrdal and Yalkowsky vapour pressure), SIMPOL (SIMPOL vapour pressure), N_Tb (Nannoolal boiling point), SB_Tb (Stein and Brown
boiling point), literature – black triangle (2-nitrophenol, 3-methyl-2-nitrophenol, 4-methyl-2-nitrophenol, 5-fluoro-2-nitrophenol and 4-
nitrophenol from Schwarzenbach et al., 1988; 3-nitrophenol from Ribeiro da Silva et al., 1992; 2-nitrobenzaldehyde and 3-nitrobenzaldehyde
from Perry et al., 1984; 2-nitrobenzoic acid, 3-nitrobenzoic acid and 4-nitrobenzoic acid from Ribeiro Da Silva et al., 1999; 4-methyl-3-
nitrobenzoic acid and 3-methyl-4-nitrobenzoic acid from Monte et al., 2001), and literature data for previous KEMS studies – black diamond
(3-nitrophenol and 4-nitrophenol from Bannan et al., 2017; 4-methyl-2-nitrophenol, 4-methyl-3-nitrophenol and 3-methyl-4-nitrophenol
from Dang et al., 2019). Error bars on the experimental data points are ±1 standard deviation. Panel (a) contains nitrophenols, panel (b)
contains nitrobenzaldehydes and panel (c) contains nitrobenzoic acids.
Table 8. Average difference between the experimental PLsat and the predicted PLsat . N_Vp is the Nannoolal et al. vapour pressure method
(Nannoolal et al., 2008), MY_Vp is the Myrdal and Yalkowsky vapour pressure method (Myrdal and Yalkowsky, 1997), N_Tb is the Nan-
noolal et al. boiling point method (Nannoolal et al., 2004), and SB_Tb is the Stein and Brown boiling point method (Stein and Brown,
1994).
Average difference N_Vp_N_Tb N_Vp_SB_Tb MY_Vp_N_Tb MY_Vp_SB_Tb SIMPOL
(orders of magnitude)
Nitrophenols 4.24 3.49 4.21 3.40 2.92
Nitrobenzaldehydes 3.18 2.50 3.17 2.46 0.29
Nitrobenzoic acids 2.06 0.91 2.56 1.52 −0.83
All compounds 3.38 2.52 3.50 2.65 1.26
and even demonstrates the same trend as the experimen- bach et al. (1988), however, are questionable in reliability due
tal data for 2-nitrobenzaldehyde, 3-nitrobenzaldehyde and 4- to being taken from a single data point from a single data set.
nitrobenzaldehyde, although 3 orders of magnitude higher. The values given are also 3–4 orders of magnitude greater
Despite the ortho, meta and para parameters, as soon as a than those measured in this work as well as those measured
third functional group is present around the aromatic ring the by Bannan et al. (2017) and those measured by Dang et
Nannoolal et al. method (Nannoolal et al., 2008) no longer al. (2019). The use of the Schwarzenbach et al. (1988) ni-
accounts for relative positioning of the functional groups. trophenol P sat data, which make up 11 of the 12 nitrophenol
Figure 10a shows the comparison between the experi- data points within the fitting data set of the SIMPOL method
mental and predicted PLsat for the nitrophenols. Both SIM- (Pankow and Asher, 2008), is a likely cause of the SIMPOL
POL (Pankow and Asher, 2008) and the Nannoolal et al. method (Pankow and Asher, 2008) overestimating the P sat
method (Nannoolal et al., 2008) contain nitrophenol data of nitrophenols by 3 to 4 orders of magnitude. The one ni-
from Schwarzenbach et al. (1988). These data of Schwarzen- trophenol used in the SIMPOL method (Pankow and Asher,
https://doi.org/10.5194/acp-20-8293-2020 Atmos. Chem. Phys., 20, 8293–8314, 2020You can also read