A tax on sugar-sweetened beverages: Modelled impacts on sugar consumption and government revenue - Australian Medical ...
←
→
Page content transcription
If your browser does not render page correctly, please read the page content below

A tax on sugar-sweetened beverages: Modelled impacts on sugar consumption and government revenue
June 2021
42 Macquarie Street Barton ACT 2600
Telephone: 02 6270 5400
www.ama.com.au
CONTENTS

EXECUTIVE SUMMARY...............................................................................................................................2
PROBLEM..........................................................................................................................................................5
    Overweight and obesity in Australia.....................................................................................................5
    Sugar-sweetened beverages (SSBs).................................................................................................... 7
    The cost of obesity..................................................................................................................................... 8
ACTION...............................................................................................................................................................9
    Public support for an SSB tax.................................................................................................................9
    An SSB tax as part of a broader obesity strategy............................................................................9
    The international experience of SSB taxes...................................................................................... 10
    SSB tax design............................................................................................................................................13
IMPACT..............................................................................................................................................................17
    Original modelling: impact of tax on sugar consumption and government revenue..........17
    Impact on obesity and healthcare expenditure...............................................................................21
    Impact on lower socioeconomic groups.......................................................................................... 22
    Impact on the sugar industry................................................................................................................ 23
    Impact on remote communities............................................................................................................24
PROPOSAL..................................................................................................................................................... 25
APPENDICES................................................................................................................................................. 26
    Appendix A: Modelling the tax............................................................................................................ 26
    Appendix B: Sensitivity for model parameters............................................................................... 30
REFERENCES.................................................................................................................................................34
A tax on sugar-sweetened beverages: Modelled impacts on sugar consumption and government revenue

EXECUTIVE SUMMARY

Overweight and obesity is a significant and growing issue in Australia.                            With increasing population body mass index (BMI), direct healthcare costs increase,
The management of the obesity crisis in Australia is a national and economic                       many of which are borne by government(s).
priority, and Australia’s response to it must be commensurate with the breadth of its              As population BMI rises, so do direct healthcare costs, as well as indirect costs due to
prevalence, the speed of its growth, and major impacts on individuals and society.                 reduced productivity.
Rates of obesity in Australian adults have been steadily increasing for at least 25 years          A systematic review of worldwide costing studies estimated that people living with
(from 19% in 1995 to 31% in 2018). Among children (aged 5-17), there has also been an              obesity have medical costs that are approximately 30 per cent greater than their
upwards trend (from 5% in 1995 to 8% in 2018). It is estimated that a third (33%) of the           healthy weight peers.
projected adult population will be obese by 2025.
                                                                                                   The AMA estimates that if no action is taken to stem the obesity crisis, by 2025
The AMA wants to see steps taken towards reducing obesity because it is a major risk
                                                                                                   taxpayers will have footed a further $29.5 billion (over four years) for the direct
factor for a range of chronic and preventable conditions including type 2 diabetes,
                                                                                                   healthcare costs of obesity.
heart disease, stroke and cancer. This not only diminishes the health and wellbeing of
Australians, but places a huge financial burden on our health system, in particular our
public hospitals.
We live in an environment that effectively promotes weight gain through widely
available, advertised and highly affordable processed food products with little or no
nutritional benefit. This is confounded by limited population understanding of what is in
food and drink products and what constitutes a healthy diet.
Sugar-sweetened beverages (SSBs) are a major contributor to the obesity crisis and
provide almost no nutritional benefit.
SSBs are soft drinks containing ‘free sugars’ such as sucrose, high-fructose corn
syrup or fruit juice. This category of beverage typically includes carbonated and
non-carbonated fruit, dairy/milk, sport, energy and cordial drinks containing free
sugars, and excludes alcoholic and artificially-sweetened (diet) drinks. SSBs contain
large amounts of free sugar — delivering a high number of liquid calories but providing
almost no nutritional benefit. In this report it is suggested to tax a subset of SSBs — all
non-alcoholic drinks containing free sugars, excluding 100 per cent fruit juice, milk-
based and cordial drinks. The focus is on drinks that provide no nutritional benefit.
There is a strong association between SSB consumption and increased energy intake,
weight gain and obesity. Conversely, reduced consumption of SSBs is significantly
associated with weight loss.

2 Australian Medical Association 2021
A tax on sugar-sweetened beverages: Modelled impacts on sugar consumption and government revenue

A tax on SSBs would be an important first step towards tackling obesity and would
raise revenue to take further steps.
To effect a change in SSB consumption, both a clear message for consumers that
the product is unhealthy, and a tangible deterrent are warranted. A tax can deliver
on both counts by creating a price signal that the product is unhealthy, and reducing
consumption through higher prices (and therefore lower affordability). Furthermore, an
appropriately designed tax can also incentivise manufacturers of SSBs to reformulate
their products to contain less free sugar.
There is clear evidence that taxes on unhealthy food and drink can improve
population diets. SSB taxes in other countries have been successful in reducing
consumption and incentivising reformulation of SSBs. The World Health Organization
recommends that countries implement SSB taxes, and at a sufficient scale to impact
on consumer purchases.
More than 45 jurisdictions across the world have implemented SSB taxes. There
has been confirmed success already in a number of countries, including the United
Kingdom (2018), Mexico (2014), France (2012), Chile (2014), Catalonia, Spain (2016), and
in some US jurisdictions (Portland 1991; Cleveland 2003; Berkeley 2015), where robust
evaluations have shown a drop in consumption following the tax.
Meanwhile, a tax on SSBs enjoys majority support from the Australian public, with
support even higher if tax revenue is hypothecated to fund initiatives to tackle obesity.
Revenue should be earmarked for preventive health measures such as awareness
and education initiatives to improve health literacy around diet and nutrition. For the
majority of the population, there is an affordable alternative to SSBs in the form of tap
water, and part of the intent of an SSB tax would be to move consumers towards this
untaxed, healthy substitute. This means that any barriers to safe water access also
require action. Therefore, revenue should also be used to ensure all Australians have
reliable access to a clean, safe water supply.

                                                                                                                                                     Australian Medical Association 2021 3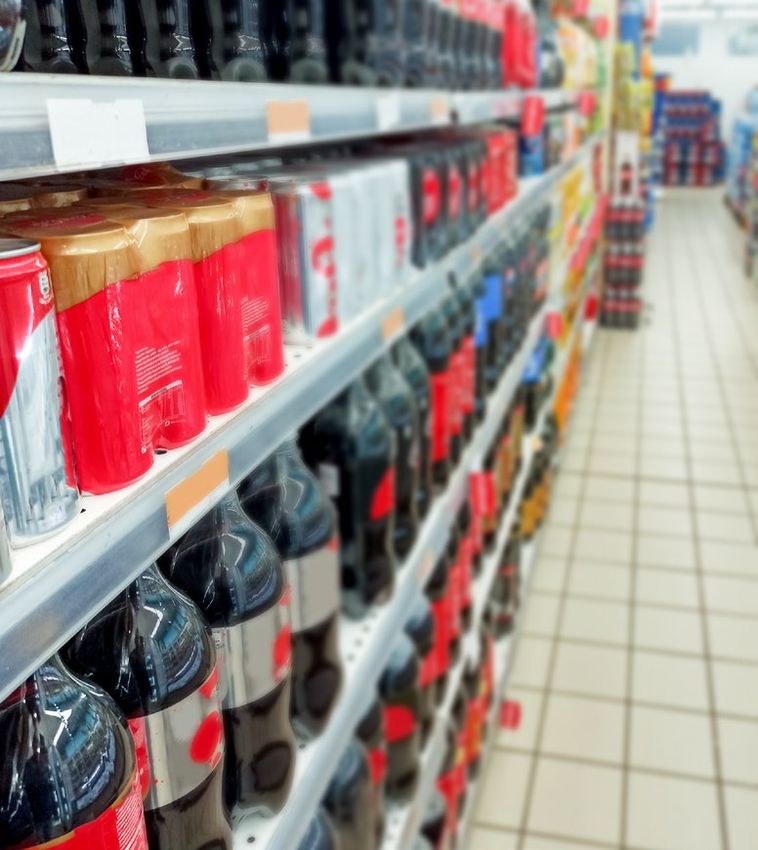
A tax on sugar-sweetened beverages: Modelled impacts on sugar consumption and government revenue

Modelling indicates a tax on select SSBs would reduce sugar consumption from soft                  Reduced sugar consumption and improved diet would likely lead to a reduction in
drinks by 12 to 18 per cent and raise annual government revenue of $814 million to                 the prevalence of obesity and substantial healthcare savings.
$749 million.
                                                                                                   Previous Australian modelling estimated that an SSB tax that increases the retail price
Utilising publicly available data, the AMA has modelled the impact of a tax on                     by 20 per cent would lead to a reduction in the prevalence of obesity of around 2 per
select SSBs.                                                                                       cent and healthcare expenditure savings of $609 million to $1.73 billion.
The tax that has been modelled is a specific excise tax based on sugar content, set at
                                                                                                   For the benefit of doctors, patients and broader society, there is a clear imperative
$0.40 per 100 grams of sugar (per unit of product). This tax rate was chosen with the
                                                                                                   to act now to arrest the growing obesity crisis – a crisis that places a huge financial
World Health Organization’s recommendation in mind – that a tax on SSBs would
need to raise the retail price by at least 20 per cent in order to have a meaningful               burden on our health system, in particular our public hospitals. A tax on SSBs would
health effect.                                                                                     be a targeted and sensible first step towards improving diets and thereby tackling
                                                                                                   obesity, that would relieve pressure on our public hospitals in the long term without
The impact of the tax on consumption and revenue was modelled using two
                                                                                                   draining any existing resource from the health budget in the short term.
different published price elasticities – one derived theoretically for Australia, and
one derived from real-world impact evaluations of SSB taxes around the world                       The AMA acknowledges that there is not wide political support at present for an SSB
(predominantly high-income countries). This takes into account both the Australian                 tax. For this reason, the AMA will campaign to demonstrate community support and
context and the realities of how humans have responded to SSB taxes in comparable                  put this issue on the political agenda.
countries. In particular, the latter price elasticity allows us to account for real-world
variation in price pass-through to the consumer, and the effect of a price signal that
the product is unhealthy.
This model builds on and refines previous modelling undertaken in this field. To
the best of our knowledge, an excise tax based on sugar content has not been
modelled in the Australian context to this level of detail and accuracy. In addition, use
of the composite real-world price elasticity, published in 2019 by Andrea Teng and
colleagues at the University of Otago, provides greater confidence in the outcomes.
There would be minimal impact on the sugar industry.
About 80 per cent of Australia’s domestic sugar production is exported. The
AMA estimates that only 5.3 per cent of total domestic production goes towards
domestic sugar-sweetened beverage manufacture. The estimated change in SSB
consumption modelled in this report translates to a 0.64 to 1.01 per cent drop in
demand for domestic sugar production. The domestic sugar market already has a
much greater level of volatility than this change. Given this, the impact on the sugar
industry is anticipated to be minimal and does not appear to warrant a government
assistance package.
4 Australian Medical Association 2021
A tax on sugar-sweetened beverages: Modelled impacts on sugar consumption and government revenue

PROBLEM

Overweight and obesity in Australia                                                         Projected prevalence
The management of the obesity crisis in Australia is a national and economic                Overweight and obesity is the second biggest modifiable risk factor contributing to the
priority, and Australia’s response to it must be commensurate with the breadth of its       burden of disease in Australia, after tobacco.7 There is some evidence that overweight
prevalence, the speed of its growth, and major impacts on individuals and society.          and obesity is set to overtake tobacco as the major cause of preventable death in
                                                                                            Australia.8
Prevalence now
                                                                                            The prevalence of obesity in Australia is expected to continue to increase. In 2015,
Obesity data suggest that 31 per cent of Australian adults and 8 per cent of children       PwC estimated that a third (33%) of the projected adult population would be obese by
are obese. When including those who are overweight this increases to 67 per cent of         2025.9 The latest data from the Australian Institute for Health and Welfare indicates
adults and 25 per cent of children.1                                                        that Australia is on track to at least meet if not exceed this projection, with 31 per cent
For Aboriginal and Torres Strait Islander peoples, the rates of overweight and obesity      of adults obese in 2017-18.10
are even higher, at 74 per cent of adults and 38 per cent of children.2 Indeed,             Health impact
high body mass is estimated to account for 16 per cent of the health gap between
Aboriginal and Torres Strait Islander peoples and the total Australian population.3         Obesity is a major risk factor for chronic and preventable conditions including type
                                                                                            2 diabetes, heart disease, hypertension, stroke, gall bladder disease, osteoarthritis,
The obesity problem is particularly pronounced in Australia. We have the sixth highest      sleep apnoea and respiratory problems, mental health disorders and some cancers
proportion of overweight or obese people (aged 15+) among 22 Organisation for               (including endometrial, prostate, breast and colon).
Economic Co-operation and Development (OECD) member countries.4
                                                                                            From a health perspective, it is far better to prevent obesity in the first place than try
Trend over time                                                                             to manage it once established. This means a focus on children’s health and health
Rates of obesity in Australian adults have been steadily increasing for at least 25 years   literacy is needed. Overweight and obesity in children and adolescents is associated
(from 19% in 1995 to 31% in 2018).5 Among children (aged 5-17), there has also been an      with poorer health and wellbeing, worse performance at school, and an increased risk
upwards trend (from 5% in 1995 to 8% in 2018).6                                             of overweight and obesity in adulthood.11

                                                                                                                                                        Australian Medical Association 2021 5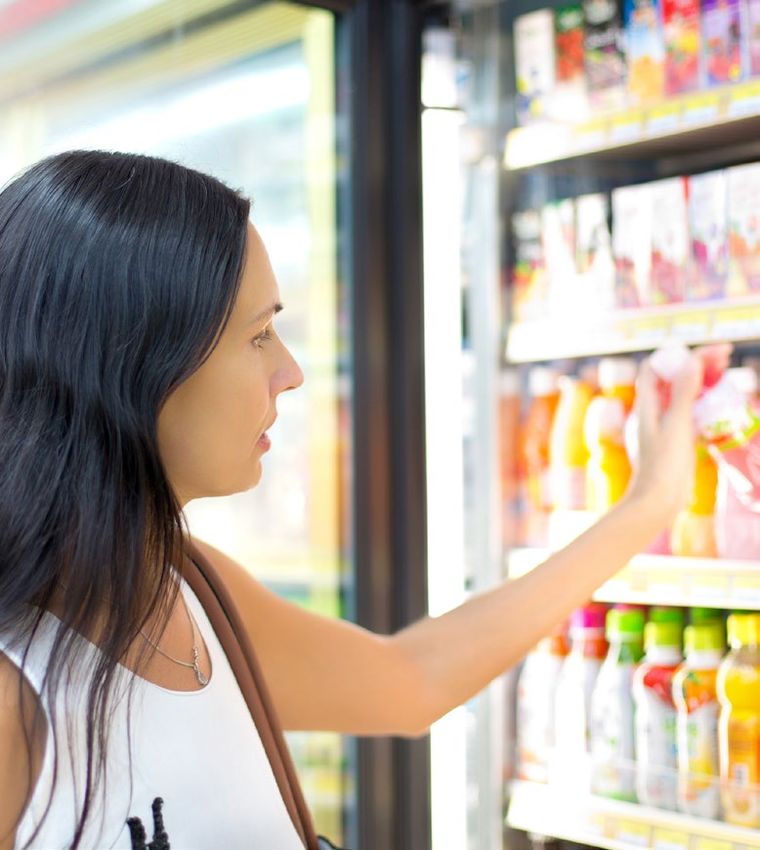
A tax on sugar-sweetened beverages: Modelled impacts on sugar consumption and government revenue

The obesogenic environment
The ‘obesogenic environment’ refers to the conditions of life that promote or enable
obesity through factors such as high availability, affordability and promotion of
unhealthy food and drink, limited opportunities to exercise, and limited access to
accurate information about nutrition.
The scale of the obesity crisis is not surprising given the significant consumption
of processed foods and foods high in salt, fat and sugar, and low levels of physical
activity and health literacy in Australia.
We live in an environment that promotes weight gain through widely available,
advertised and highly affordable products with little or no nutritional benefit. This is
confounded by limited population understanding of what is in food and drink products
and what constitutes a healthy diet.
There is a clear need for improved health literacy specifically around SSBs in Australia;
awareness of both sugar content and health risks is limited, especially among the
most frequent consumers.12
Shaping a better overall environment is crucial for the whole life course. Good
nutrition starts during pregnancy, and continues through infancy and childhood.
Habits formed early can be hard to break in adulthood, and public health policies
should focus on preventing unhealthy patterns from forming in the first place, such as
high consumption of SSBs. Children learn about food through exposure to a variety
of foods, by observing how the adults around them interact with food, including in
childcare settings and schools, and through other exposures such as marketing.
In addition to a tax on SSBs, a range of complementary public health measures
should be taken to adjust the obesogenic environment. These are discussed later in
the report.

6 Australian Medical Association 2021
A tax on sugar-sweetened beverages: Modelled impacts on sugar consumption and government revenue

Sugar-sweetened beverages (SSBs)                                                           SSB consumption in Australia
                                                                                           Australians consume a lot of SSBs, with young males the biggest consumers.20
What are SSBs?                                                                             Thirty-six per cent of adults and 41 per cent of children consume SSBs at least weekly;
Sugar-sweetened beverages are drinks containing ‘free sugars’ such as sucrose,             9 per cent of adults and 7 per cent of children consume them daily.21 The AMA
high-fructose corn syrup or fruit juice. This category of beverage typically includes      estimates that Australians consume at least 2.4 billion litres of SSBs per year (see
carbonated and non-carbonated fruit, dairy/milk, sport, energy and cordial drinks          page 28).
containing free sugars, and excludes alcoholic and artificially-sweetened (diet) drinks.
In this report it is suggested to tax a subset of SSBs.                                    SSB consumption as a driver of obesity
‘Free sugars’ means they are free-moving within the substance, as opposed to being         There is a strong association between SSB consumption and increased energy intake,
encapsulated in the plant cells as they are in whole fruit and vegetables. Free sugars     weight gain and obesity.22 Conversely, reduced consumption of SSBs is significantly
tend to be digested more rapidly and enter the blood stream quicker. Free sugar            associated with weight loss.23 Evidence also supports a strong association between
includes both ‘added sugar’ (added by manufacturers, cooks or consumers) and               consumption of SSBs and type 2 diabetes and cardiovascular disease, independent of
naturally occurring sugar (such as in honey, syrup and fruit juice).13                     body fatness.24

SSBs contain large amounts of free sugar – delivering a high number of liquid calories     The main mechanism by which consumption of SSBs leads to poor health outcomes
but providing almost no nutritional benefit. There are 8-12 teaspoons (33-50 grams) of     is via excess energy intake. Liquid calories are thought to provide lower feelings of
sugar in the average 375 millilitre can of soft drink.14                                   fullness than solid calories, and tend not to be factored into daily energy intake (i.e.
                                                                                           people tend not to offset liquid calories by eating less).25
In 2019-20, Australians consumed on average 70 grams of free sugar a day, with over
a quarter (18g) of this coming from sugary drinks. Overall, free sugars contributed        SSBs as the target of the tax
12.4 per cent of total dietary energy, which exceeds the World Health Organization’s       SSBs are a logical target for a public health intervention, given the high level of
recommendation that free sugars make up less than 10 per cent of dietary energy.15,16      consumption of these products, which provide almost no nutritional benefit but make a
Other expert groups have recommended lower targets, for example the UK Scientific          major contribution to the obesity crisis, and to poor dental health, through high levels
Advisory Committee on Nutrition recommended no more than 5 per cent.17                     of free sugar.
There is a clear positive association between higher intake of dietary sugars, including   A tax can deliver both a clear message for consumers that the product is unhealthy,
from SSBs, and body fatness in adults.18 SSBs also increase the risk of dental caries in   and a tangible deterrent in the form of higher prices. An appropriately designed tax
children and adults.19                                                                     can also incentivise manufacturers to reduce the sugar content in their products.
                                                                                           SSBs are also a practical target for a tax, as they are a discreet category that is
                                                                                           easily identifiable, representing a small step in the right direction that is more easily
                                                                                           implemented than a wider ranging intervention.

                                                                                                                                                       Australian Medical Association 2021 7
A tax on sugar-sweetened beverages: Modelled impacts on sugar consumption and government revenue

The cost of obesity                                                                                ‘... the AMA estimates that if no action is taken to stem the
As population BMI rises, direct healthcare costs increase, many of which are borne by
                                                                                                   obesity crisis, by 2025 taxpayers will have footed a further
government(s). Indirect costs also increase due to reduced productivity.26                         $29.5 billion for the direct healthcare costs of obesity (over
A systematic review of worldwide costing studies estimated that people living with
                                                                                                   four years to 2024-25).’
obesity have medical costs that are approximately 30 per cent greater than their
healthy weight peers.27
The exact cost of overweight and obesity to society is difficult to determine. Annual
cost estimates for the Australian context range from $5.3 billion28 to $8.6 billion29 for
obesity only, to $14.9 billion30 for obesity and overweight combined. These estimates
include both direct and indirect costs, with some discrepancy in the final estimate
being accounted for by different data sources and which costs are included.
If you look at only the direct healthcare costs of obesity, which can be estimated
with more accuracy, annual cost estimates for the Australian context range from
$2.6 billion31 to $3.8 billion32 for obesity only, to $8.6 billion33 for obesity and
overweight combined.
The increased health care costs associated with obesity are observable early in life,
with Australian research indicating that children (aged between two and five years)
who are obese incur health care costs that are 60 per cent greater than children of
healthy weight.34

Projected cost of obesity to 2025
By a previous estimate, a third (33%) of the projected adult population will be obese
by 2025.35 Building on this, the AMA estimates that if no action is taken to stem the
obesity crisis, by 2025 taxpayers will have footed a further $29.5 billion for the direct
healthcare costs of obesity (over four years to 2024-25).36
Now is the time for action. Our political leaders must recognise the urgency and
scale of the problem. This report sets out a modest first step of introducing a tax on
sugar-sweetened beverages, to stem the obesity epidemic and recover some of the
external costs to society from the sale of these products.

8 Australian Medical Association 2021
A tax on sugar-sweetened beverages: Modelled impacts on sugar consumption and government revenue
ACTION
• reducing food insecurity in urban, rural and remote areas, including by improving
Public support for an SSB tax the supply chain for healthy foods, providing financial support for food banks,
community gardens and cooking programs; and
Australian surveys have consistently shown majority support for a tax on sugar-
sweetened beverages.37 Public support is even higher if tax revenue is hypothecated • building stronger safeguards against unhealthy food and drink products into
to fund initiatives to tackle obesity.38 A nationally representative survey undertaken in the food regulatory system, for example through reformulation targets and a
2017 found 60 per cent of Australians support a tax on sugary drinks. This increased requirement for added sugar labelling.
to 77 per cent support if the proceeds were used to fund obesity prevention.39 This would require building upon and expanding current government policies.
As mentioned above, there is a clear need for improved health literacy around SSBs
An SSB tax as part of a broader obesity strategy in Australia, with awareness of both sugar content and health risks being limited,
particularly among the most frequent consumers.43 Meanwhile there is strong public
A tax on SSBs would be an important first step towards tackling obesity and would
support from Australians for a government funded awareness campaign on the health
raise revenue to take further steps.
effects of SSBs44 and evidence that such an awareness campaign would work.45
There is clear evidence that taxes on unhealthy food and drink can improve
A benefit of starting with a tax on SSBs is that, in addition to reducing consumption,
population diets.40 Indeed, the World Health Organization lists a tax on SSBs as an
it would raise revenue that could be used to fund complementary measures such as
effective intervention in its Global Action Plan for the Prevention and Control of NCDs
awareness and education initiatives.
2013-2020.41 Larger effects are seen for taxes on non-core food or drink products
(e.g. SSBs) for which there are close substitutes that are untaxed (e.g. water).42 The AMA also recommends that some of the revenue is set aside to evaluate the
However, an SSB tax is not a silver bullet for tackling overweight and obesity by itself; impact of the tax, to inform the design of the tax in future years and similar public
it would be more effective for government(s) to maintain a suite of existing and new health measures in future.
complementary measures. Such measures could include: Furthermore, the revenue could be used to fund projects to improve access to safe
• adjusting the environment by protecting children from exposure to the marketing drinking water in remote Aboriginal and Torres Strait Islander communities. In some
of unhealthy food and drink products and reducing their availability and remote areas SSBs can be seen as a safer alternative to the community’s water
prominence; supply, and consumption can be high including among young children and babies.46
This proposal is discussed in more detail later in the report.
• implementing mass media campaigns, school education programs, and better
product labelling to improve nutrition literacy;
• subsidising fruits and vegetables to increase intake and encourage substitution;
• promoting physical activity;
• installing more water fountains in public spaces;
Australian Medical Association 2021 9A tax on sugar-sweetened beverages: Modelled impacts on sugar consumption and government revenue The international experience of SSB taxes SSB taxes in other countries have been successful in reducing consumption and incentivising reformulation of SSBs. The World Health Organization recommends that countries implement SSB taxes, and at a sufficient scale to impact on consumer purchases.47 Over 45 jurisdictions across the world have implemented SSB taxes.48 There has been confirmed success already in a number of countries, including the United Kingdom (2018), Mexico (2014), France (2012), Chile (2014), Catalonia, Spain (2016) and in some US jurisdictions (Portland 1991; Cleveland 2003; Berkeley 2015), where robust evaluations have shown a drop in consumption following the tax.49 Below, case studies of Mexico and the UK are presented. Mexico is a useful case study because several high quality evaluations are available, and it is interesting to see a strong pass-through rate and a sustained consumer response. The UK is presented as an interesting case of widespread product reformulation in response to the tax, and hypothecation of revenue for preventive health initiatives. 10 Australian Medical Association 2021
A tax on sugar-sweetened beverages: Modelled impacts on sugar consumption and government revenue

Mexico case study: Excise tax
Implemented: January 2014.
Target: Manufacturers of soft drinks with added sugar.
Design: Specific tax – liquid volume.
One peso per litre excise tax. Represented approx. 10% increase in price at time tax was passed (September 2013).50
Indexation: Adjustment triggered by cumulative inflation of 10%.51
Scope: Any non-alcoholic beverage with added sugar (including powder and concentrates).52
Outcome: For purchases of beverages subject to the tax, there was an average decline of 5.5% in the first year, and an average decline of 9.7% in the second
year (an average decline of 7.6% over the two years combined), compared to predicted purchases if no tax was implemented. In contrast, untaxed beverages increased on
average 5.3% in the first year and decreased on average 1% in the second year (an average increase of 2.1% over the two years combined).53
There were significant declines in taxed beverage purchases across all socio-economic groups, with the largest reductions seen at the lowest socio-economic level.54
The production volume of still bottled water increased by 5.2% two years after the tax was implemented, which may indicate substitution to water by consumers.55 Indeed,
modelling that compared actual purchases with predicted purchases if no tax was implemented, found a 16.2% increase in purchases of (still and sparkling) bottled water
after the tax.56
Pass-through: There was overshifting for carbonated SSBs and undershifting for non-carbonated SSBs. The price changes represented about an 11% increase for
carbonated SSBs and 3% increase for non-carbonated SSBs (in 2014 compared to 2013).57
Stimulus: Authors of one of the evaluation studies reflected that it is possible the effect was not entirely due to elastic demand; it may have been amplified by other
contemporaneous initiatives in Mexico that raised awareness of the negative health effects of unhealthy food and drink. Conversely, a post-tax increase in marketing
efforts by the drinks industry may have attenuated the effect of the tax.58
Hypothecation: None known.

Revenue: Unknown.

                                                                                                                                                     Australian Medical Association 2021 11
A tax on sugar-sweetened beverages: Modelled impacts on sugar consumption and government revenue UK case study: Soft Drinks Industry Levy Announced: March 2016. Implemented: April 2018. Target: Manufacturers and importers of sugary soft drinks. Design: Specific tax – sugar content. £0.24 per litre for drinks with over 8g sugar per 100ml (high levy category). £0.18 per litre for drinks with 5 to 8g sugar per 100ml (low levy category). No charge for drinks with less than 5g sugar per 100ml (no levy category).59 Indexation: Unknown. Scope: All sugar-sweetened beverages, excluding 100% fruit juice and milk-based drinks.60 Outcome: In response, many manufacturers reduced the sugar content of drinks subject to the levy. Over 50% of manufacturers did so between the announcement and when it was implemented, with Treasury saying this was the equivalent of removing 45 million kg of sugar from the market every year.61 Almost one year after implementation (February 2019), the percentage of drinks with enough sugar to be subject to the levy had fallen from an expected level of 49% to 15%.62 After implementation there was a peak in the proportion of drinks with a sugar level between 4.5 and 5g per 100ml, indicating that many manufacturers chose to reformulate to just below the 5g threshold.63 Between 2015 and 2018, the total volume of sugars sold from soft drinks decreased by 29%. Meanwhile, the total volume sales of bottled water and products exempt from the tax rose by 23%.64,65 The levy has been found to have no long term negative effects on the share value or turnover of domestic soft drinks manufacturers.66 Pass-through: The price of drinks in the high levy category rose by £0.075 per litre – a 31% pass-through rate.67 Stimulus: Authors of the evaluation study reflected that the stimulus for these changes was likely to have been a mixture of manufacturers wanting to avoid the levy, and responding to a greater consumer demand for lower sugar drinks following the widespread media attention after the announcement of the levy.68 Introduction of the tax was also accompanied by a large public awareness campaign.69 Hypothecation: Revenue was ring-fenced for sports and health initiatives in schools.70 Revenue: At announcement, expected revenue was £520m in year 1. At implementation, this was revised down to £240m due to widespread reformulation. However, the government committed to sustain the funding for schools at the higher level even if revenue from the levy declined.71 12 Australian Medical Association 2021
A tax on sugar-sweetened beverages: Modelled impacts on sugar consumption and government revenue

SSB tax design                                                                            An excise tax is the most logical option for targeting the manufacturer based on sugar
                                                                                          content. Of course, there is no guarantee that an excise tax will be fully passed on to
Type of tax                                                                               the consumer, as the retailer, wholesaler or manufacturer may choose to absorb it in
                                                                                          part or in full. However, the international experience is that the SSB tax pass-through
A number of taxation options are available, including taxing on the basis of sugar
                                                                                          is sufficient to have an impact on consumption.74 The government also has a range of
content, liquid volume or value (ad valorem). Most other countries with SSB taxes in
                                                                                          options to influence tax pass-through such as raising the tax over time, or investigating
place have used one of these three options.72
                                                                                          other options to ensure the tax is effective at the point of sale in influencing the
A sugar content tax is the most logical option, given that harm is caused proportionate   consumer via a price signal.
to the sugar content, not the value or the liquid volume. It is the only option that
                                                                                          The excise tax would need to be accompanied by an equivalent customs tax to
creates an incentive for manufacturers to lower the sugar content of their products,
                                                                                          ensure domestic SSB manufacturers are not unfairly disadvantaged. Domestic
and therefore is the option most targeted at reducing sugar consumption.
                                                                                          manufacturers that adapt to the tax by reformulating beverages would have a
A liquid volume tax does not efficiently target the element that causes harm – a large    competitive advantage over imports which do not.
bottle with a small amount of sugar would be taxed more than a small bottle with a
large amount of sugar. Some commentators argue that a specific tax on liquid volume
is the best option to generate revenue (given the weaker incentive to reformulate), but
not to reduce sugar consumption.73
Application of an ad valorem tax (where tax is paid as a fixed percentage of the
retail price, e.g. 15%) would mean that premium products are taxed more than cheap
products, which can incentivise consumers and producers to switch to cheaper
products in potentially larger quantities. For example, switching from a 1.25 litre
branded beverage to a 2 litre unbranded one. This could create the opposite effect to
that which is desired – to raise prices in order to reduce consumption.

Target of tax
A tax could be applied at various points in the process, including customs and excise,
wholesale or retail. The main point of consideration here is to what extent the tax
targets the manufacturer versus the wholesaler, retailer or consumer.
In the case of an SSB tax, arguably the ideal situation is that it targets both the
manufacturer (thereby incentivising reformulation) and the consumer (thereby sending
a price signal that the product is harmful, and reducing consumption by increasing
the price).

                                                                                                                                                     Australian Medical Association 2021 13
A tax on sugar-sweetened beverages: Modelled impacts on sugar consumption and government revenue
Tax rate
The World Health Organization’s recommendation is that a tax on SSBs would need to raise the retail price by at least 20 per cent in order to have a meaningful health effect.75
Modelling studies and real-world evaluations indicate that SSB taxes elicit a response in consumption that is proportional to the tax applied (i.e. the greater the tax, the larger the
drop in consumption), with small taxes (around 5%) raising revenue without having a notable impact on consumer purchases.76
SSB tax rates vary around the world. Several comparable countries to Australia have implemented sugar content taxes, some of which are set at a similar rate to that which is
proposed in this report – $0.40/100g sugar (see Table 1).
Table 1: Sugar content tax rates in comparable countries
VALUE IN AUD TAX ON 375ML CAN OF COKE
COUNTRY LOCAL TAX RATE
(AND UNITS HARMONISEDFOR COMPARISON) WITH 40G SUGAR77 (AUD)
France Sliding scale ranging from €7.53/hectolitre $0.12/litre if 1g sugar/100ml
if 1g sugar/100ml to €20/hectolitre if >11g $0.12*
sugar/100ml78 $0.32/litre if >11g sugar/100ml
Catalonia, Spain €0.12/litre if >8g sugar/100ml79 $0.19/litre if >8g sugar/100ml $0.07
Republic of Ireland €0.20/litre if 5-8g sugar/100ml $0.32/litre if 5-8g sugar/100ml
$0.18
€0.30/litre if >8g sugar/100ml80 $0.48/litre if >8g sugar/100ml
Portugal €8.22/100 litres if 8g sugar/100ml
United Kingdom £0.18/litre if 5-8g sugar/100ml $0.32/litre if 5-8g sugar/100ml
$0.16
£0.24/litre if >8g sugar/100ml82 $0.43/litre if >8g sugar/100ml
Australia (proposed tax) $0.40/100g sugar per unit of product $0.40/100g sugar per unit of product $0.16
*Sugar content is 10.6g/100ml but >11g threshold has been applied due to the intermittent tax threshold in the sliding scale not being available.
14 Australian Medical Association 2021A tax on sugar-sweetened beverages: Modelled impacts on sugar consumption and government revenue
Ad valorem and liquid volume tax rates also vary worldwide, with California and
Pennsylvania in the United States having rates in the region of the World Health
Organization’s recommended minimum 20 per cent increase on retail price.83 Some
Middle Eastern countries have implemented SSB excise taxes at rates in the 50 to 100
per cent range, and Bermuda has a 75 per cent import tax on SSBs.84
As a sugar content tax works differently to an ad valorem tax, to find a tax rate that
satisfied the WHO’s recommended minimum of 20 per cent, the retail price and sugar
content of a range of SSBs had to be taken into account. With a sugar content tax,
the effective tax rate (i.e. the percentage change in price) changes depending on the
sugar content of the product and its original retail price. The tax rate of $0.40/100g
sugar was chosen because it would raise the price of the average supermarket SSB
by at least 20 per cent. The impact of the tax would be larger on products that are
the cheapest (usually those sold in the supermarket) and have the most sugar; a
smaller impact would be seen on products that are priced up (usually those sold in
‘convenience’ locations such as petrol stations and bars) or have less sugar. This is
explained further in Appendix A.
Overall proposal
Here, the AMA proposes that the most logical and effective tax would be an excise
(and customs) tax based on sugar content, to have the effect of at least a 20 per cent
increase on (supermarket) retail price. This position is supported by the World Health
Organization85 and the Obesity Policy Coalition (representing Cancer Council Victoria,
Diabetes Victoria, VicHealth and The Global Obesity Centre at Deakin University).86
The tax should be targeted at the manufacturer in order to incentivise reformulation.
In order to achieve a minimum 20 per cent increase on (supermarket) retail price, the
tax rate should be set at $0.40/100g sugar.
The tax must also be indexed by CPI to account for inflation, so as not to erode its
impact over time.
Australian Medical Association 2021 15A tax on sugar-sweetened beverages: Modelled impacts on sugar consumption and government revenue
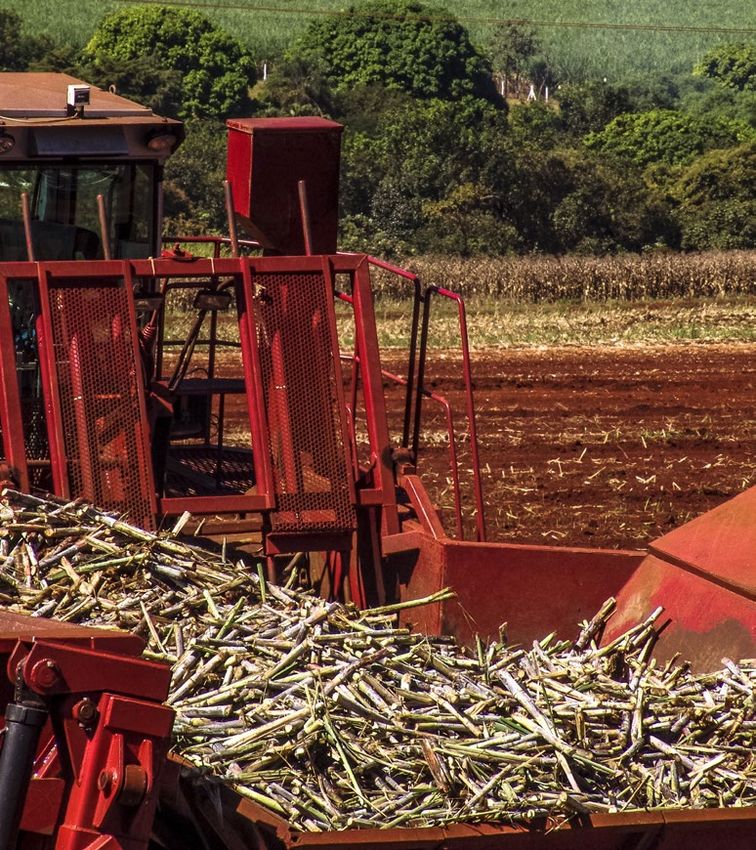
Figure 1: Overview of sugar-sweetened beverages’ journey from sugar cane to consumer, showing point at which tax would be applied.
T
APPAX
L
HER IED
E
IMPORT
EXPORT
International manufacturers
80% exported and distributors of SSBs
TAX D
15% other domestic use IE
APPLRE
HE
5% domestic SSB manufacture
Sugarcane Domestic manufacturers
farms and distributors of SSBs
BAR
Purchasers Retailers
16 Australian Medical Association 2021A tax on sugar-sweetened beverages: Modelled impacts on sugar consumption and government revenue
IMPACT
Original modelling: impact of tax on sugar consumption and Here two main scenarios are presented:
government revenue 1. The impact of the tax on consumption and revenue, assuming no product
reformulation.
In this scenario two different published price elasticities are used – one derived
Modelling indicates a tax on select SSBs would reduce consumption by
theoretically for Australia, and one derived from real-world impact evaluations
12 to 18 per cent and raise annual government revenue of $814 million to
of SSB taxes around the world (predominantly high-income countries). Price
$749 million.
elasticity is a measurement of the change in demand for a product, in relation
to a change in its price. For example, a price elasticity of -0.63 means that
Utilising publicly available data, the AMA has modelled the impact of a tax on demand falls by 0.63% for every 1% increase in the price. Using these two price
select SSBs. elasticities takes into account both the Australian context and the realities
The tax that has been modelled is a specific excise tax based on sugar content, set of how humans have responded to SSB taxes in comparable countries. In
at $0.40 per 100 grams of sugar (per unit of product). This tax rate was chosen with particular, the latter price elasticity allows us to account for real-world variation
the World Health Organization’s recommendation in mind – that a tax on SSBs would in price pass-through to the consumer and the effect of a price signal that the
need to raise the retail price by at least 20 per cent in order to have a meaningful product is unhealthy.88
health effect. Full pass-through of the tax to the consumer has been assumed. 2. The impact of the tax on consumption and revenue, assuming some
The policy intent is for the SSB tax to apply to non-alcoholic drinks product reformulation.
containing free sugars, excluding 100 per cent fruit juice, milk-based and cordial In this scenario the tax is applied as well as assuming that manufacturers
drinks. The focus is on drinks that provide no nutritional benefit. The modelling undertake some product reformulation (i.e. lower the sugar content) in response
matches this as far as possible, taking conservative estimates where the source data to the tax. Only the composite real-world price elasticity in used in this case.
was not sufficiently granular.87
This model builds on and refines previous modelling undertaken in this field. To the
The model allows for all parameters and assumptions to be changed and has best of our knowledge, an excise tax based on sugar content has not been modelled
been used to explore a number of scenarios. There is further capacity to work with in the Australian context to this level of detail and accuracy. In addition, use of the
government to model a range of different options. composite real-world price elasticity, published in 2019, provides greater confidence
in the outcomes.
Detailed information about the estimations and assumptions contained in the model
are included in Appendix A.
Australian Medical Association 2021 17A tax on sugar-sweetened beverages: Modelled impacts on sugar consumption and government revenue
Outcomes The fall in beverage sales and shift to lower sugar Figure 3: Sugar consumed from beverages (all soft drinks) at a
alternatives results in a drop in sugar consumption from population level before and after introduction of the tax, showing
Scenario 1: No product reformulation modelled response under two different price elasticities.
soft drinks at a population level of 12 per cent (PE1) to
Here the results are presented from the modelling 18 per cent (PE2) (see Figure 3). This translates to 11.0
of the proposed tax, with two different estimates of litres fewer SSBs and 1.1 kilograms less sugar per person
price elasticity. The first is as measured by Sharma per year using PE1, or 17.5 fewer litres and 1.71 kilograms
et al (-0.63, referred to as price elasticity/PE 1) in the less sugar per person per year using PE2 (averaged
Australian context from HomeScan data of supermarket across the whole population).
purchases.89 The second is based on the estimate from
Annual revenue raised is $814m under PE1 and $749m
Teng et al’s meta-analysis (-1.0, referred to as price
under PE2 (see Figure 4). Revenue is lower under PE2
elasticity/PE 2) of real-world responses in consumer
because a greater price elasticity corresponds to a
sales after the introduction of SSB taxes, and represents
greater reduction in consumption of SSBs subject to the
a larger effect on consumer behaviour.90
tax, which in turn means less tax is paid. Indeed, with
In this scenario, it is assumed there is no product a sugar content tax, diminishing revenues is one sign
reformulation in response to the tax. of success.
In both cases the sales of SSBs fall after the introduction Figure 2: Beverages (all soft drinks) consumed at a population Figure 4: Annual revenue raised from SSBs subject to the tax
of the tax (see Figure 2). Total sales fall from 2.4 level before and after introduction of the tax, showing modelled before and after its introduction, showing modelled response
response under two different price elasticities. under two different price elasticities.
billion litres to 2.2 billion litres under the first price
elasticity, and 2.4 billion litres to 2.0 billion litres under
the second. There is a greater shift toward non-SSB
alternatives using the second, real-world estimate. This
reflects the larger cross-price elasticity used with the
second estimate.
18 Australian Medical Association 2021A tax on sugar-sweetened beverages: Modelled impacts on sugar consumption and government revenue
Scenario 2: With product reformulation rate does not mean every product reformulates by The drop in total sales is smaller than under scenario
this amount, rather it is the average across all sugar 1, because the tax impact on prices is lessened due to
This scenario explores what the outcomes could
sweetened beverages. lower sugar content in beverages after reformulation,
be if SSB manufacturers responded by undertaking
and the assumed higher cross-price elasticity (see
reformulation of their products (i.e. reducing sugar The higher of the two price elasticities (PE2) was used
Figure 5).
content) in order to avoid the tax. but with the cross-price elasticity assumption lifted to
1.0 (where a 1% increase in the price of SSBs results in Figure 5: Beverages (all soft drinks) consumed at a population
To model this, the UK’s average reduction in sugar level before and after introduction of the tax, showing modelled
a 1% increase in non-sugar sweetened beverages). This
content per litre following the introduction of their outcome for Australia if average reduction in sugar content
reflects the assumption that consumers would be more
sugar content tax was used. Therefore, this scenario matched the post-tax UK level.
likely to switch from high to low sugar options under
represents what would happen in terms of beverage
a reformulation scenario. This assumption is based on
consumption, sugar consumption and revenue raised
two things: (a) that industry reformulation would likely be
if a similar magnitude of change happened in Australia.
accompanied by promotional activity by manufacturers
While noting that the design of the two sugar content
to increase consumers’ willingness to accept the new
taxes differ, the UK is used as a comparator due to the
formulations, which in turn would likely increase the
availability of a detailed evaluation study.
willingness to switch to lower sugar options; and (b) that,
The exact causes of the change in the UK are not given the disparity in sugar content between sugar and
known because it is not possible to measure from no-sugar beverages becomes smaller, it is likely that more
published data. What is known is that the volume people will be willing to move their consumption to a
of sugars sold from soft drinks fell from 15.5 grams lower sugar product rather than discontinue consumption
per person per day in 2015 to 10.8 grams in 2018, a all together.
reduction of 30 per cent.91 The change in average
Sugar consumption from soft drinks at a population level
sugar content per litre could have been achieved either
falls by 34 per cent under this scenario (see Figure 6),
through product reformulation, or through consumers
which is a greater effect seen than in scenario 1. This
switching to lower sugar products, or (most likely) a
translates to 14.2 litres fewer SSBs and 3.1 kilograms less
combination of both.
sugar per person per year (averaged across the whole
To model the scenario the contribution of each element population).
to the overall effect was estimated; a reformulation
Annual revenue is lower under scenario 2, at $606m
rate of 22.5 per cent (i.e. 22.5% reduction in sugar
(see Figure 7). This is because the tax is based on sugar
content) was used, with the remainder of the change
content which has been reduced. Again, lower revenue
attributed to consumer switching and estimated using
would be a good indication of a stronger health impact.
price elasticity 2.92 The 22.5 per cent reformulation
Australian Medical Association 2021 19A tax on sugar-sweetened beverages: Modelled impacts on sugar consumption and government revenue Figure 6: Sugar consumed from beverages (all soft drinks) at a Figure 7: Annual revenue raised from SSBs subject to the tax population level before and after introduction of the tax, showing before and after its introduction, showing modelled outcome modelled outcome for Australia if average reduction in sugar for Australia if average reduction in sugar content matched the content matched the post-tax UK level. post-tax UK level. 20 Australian Medical Association 2021
A tax on sugar-sweetened beverages: Modelled impacts on sugar consumption and government revenue

Impact on obesity and healthcare expenditure                                              They modelled the impact of a 20 per cent ad valorem tax on a broader range of
                                                                                          SSBs (soft drinks, flavoured water, sports, energy, fruit drinks, cordials containing
                                                                                          added sugar), again with the assumption that the tax is fully passed on to the
  Reduced sugar consumption and improved diet would likely lead to a                      consumer.
  reduction in the prevalence of obesity and substantial healthcare savings.
                                                                                          The diseases modelled were stroke, ischemic heart disease, hypertensive heart
According to previous Australian modelling, an SSB tax that increases the retail price    disease, diabetes mellitus, osteoarthritis of the knee and hip, breast cancer, colon
by 20 per cent would lead to a reduction in the prevalence of obesity of around 2         cancer, endometrial cancer and kidney cancer. As a result of the tax, the model
per cent, and healthcare expenditure savings of $609 million to $1.73 billion (over the   predicted the Australian population would gain 175,300 HALYs and 111,700 years of life
lifetime of the population modelled).                                                     would be saved (over the lifetime of the population modelled).

This research, by Veerman et al (2016), modelled the impact of a 20 per cent ad           This resulted in healthcare expenditure savings of $1.73 billion (over the lifetime of
valorem tax on SSBs (non-alcoholic drinks with added sugar, excluding fruit juice,        the population).94
energy, milk-based and cordial drinks), with the assumption that the tax was fully
passed on to the consumer.
Using the same price elasticity as PE1 in our model, they estimated there would be on
average a 12.6 per cent decrease in SSB consumption in Australia. This translated to a
decline in the prevalence of obesity of 2.7 per cent in men and 1.2 per cent in women,
and within 25 years: 800 fewer cases of type 2 diabetes, 240 fewer heart disease
cases, and 70 fewer cases of stroke per year.
By year 25 after introduction of the tax, the model estimated there would be 16,000
fewer prevalent cases of diabetes, 4,400 fewer cases of heart disease, 1,100 fewer
persons living with the consequences of stroke, and overall 1,600 fewer deaths mostly
resulting from heart disease.
Healthcare expenditure savings would total $609 million (over the lifetime of the
population modelled). Annual healthcare cost savings would rise over the first 20
years and then stabilise at around $29 million per year.93
Lal et al (2017) built on this work, using a model to estimate how a change in
overweight and obesity caused by an intervention impacts the epidemiology of
several obesity-related diseases, which in turn influences health-adjusted life years
(HALYs) in the population.

                                                                                                                                                     Australian Medical Association 2021 21
A tax on sugar-sweetened beverages: Modelled impacts on sugar consumption and government revenue
Impact on lower socioeconomic groups Indeed, a 20 per cent ad valorem tax on SSBs was modelled with particular attention
paid to the impact on different socio-economic status (SES) groups in Australia. It was
Lower socioeconomic groups would likely experience a disproportionate health found that half (49.5%) of the total health gains accrued to the two most disadvantaged
benefit as a result of the tax. SES quintiles. While the tax burden (annual expenditure) was higher in lower income
A flat tax (one that levies the same fixed amount on every citizen regardless of groups, the absolute monetary difference in tax paid between higher and lower
income) will inevitably have a greater impact on lower income consumers of the taxed income groups was small.
product, as a proportion of their expenditure/income. This model also found that $299.4 million in out-of-pocket health costs was saved
However, this regressive effect is reduced if there is an untaxed substitute that over the lifetime of the population, and that healthcare cost savings as a percentage
consumers can easily switch to.95 In the case of SSBs, healthy substitutes such as of household expenditure was highest in the most disadvantaged SES groups.97
water are readily available and affordable to most people, and consumers can avoid Therefore, when viewed holistically, an SSB tax could be considered a progressive
the tax, as well as improving their health, by making this change. This is the benefit of measure, since lower SES groups would theoretically experience a disproportionate
taxing a well-defined group of products with almost no nutritional benefit as opposed health benefit in response to the tax, compared to higher SES groups. There is also
to taxing a whole food group, whereby consumers cannot avoid the tax. potential to use the revenue from the tax to implement initiatives that would produce a
benefit for lower SES groups, such as targeted subsidies on healthy foods.
In some remote communities the water supply is unsafe and/or unstable. It
Noting the broader social determinants that can adversely impact on equity and
must be recognised that price signals do not have the same relevance in this
access to health care, broader preventive measures beyond an SSB tax are also key
circumstance, if there is no safe and affordable source of hydration to switch to.
to achieving better health outcomes.
Therefore, the impact of price rises in these areas must be considered to avoid
creating further disadvantage, with particular attention paid to the safety and
availability of drinking water, and the price of bottled water. The AMA recommends
implementing the tax alongside measures to ensure reliable, safe access to water ‘Lower socioeconomic groups would likely experience a
and affordable hydration beyond SSBs, and this is discussed later in the report. disproportionate health benefit as a result of the tax.’
People who live with greater socioeconomic disadvantage are more likely to have
poorer diets, be overweight and obese, and at a higher risk of cardiovascular disease,
than people of comparatively less disadvantage.96 Therefore, it is likely that an SSB tax
would have a particularly positive health impact on this group.
22 Australian Medical Association 2021A tax on sugar-sweetened beverages: Modelled impacts on sugar consumption and government revenue
Impact on the sugar industry
There would be minimal impact on Australia’s sugar industry as about 80 per
cent of Australia’s domestic sugar production is exported (averaged over the past
decade).98 Only 5.3 per cent of total domestic production goes towards domestic
SSB manufacture.99 The estimated change in SSB consumption due to the proposed
tax is 12 to 18 per cent (scenario 1), which translates to a 0.64 to 1.01 per cent drop
in demand for domestic sugar production. In absolute numbers, average sugar
production is about 4.4 billion tonnes and change brought about by the tax represents
around 28 - 44 thousand tonnes.
The domestic sugar market has a much greater level of volatility than the likely
change caused by the SSB tax. Between 2010-11 and 2019-20, Australian Bureau of
Agricultural and Resource Economics and Sciences (ABARES) data show domestic
production varied between 3.4 billion tonnes and 4.9 billion tonnes. Exports varied
between 2.6 billion tonnes and 4.1 billion tonnes. Prices (seasonal pool prices) also
varied between $383 a tonne and $518 a tonne.100
Given this, the impact on the sugar industry is anticipated to be minimal and does
not appear to warrant a government assistance package. However, government may
wish to consider whether there are any specific small farmers that mainly supply the
domestic market, who may warrant an assistance package which could be funded
from the tax revenue.
‘There would be minimal impact on Australia’s sugar
industry as about 80 per cent of Australia’s domestic sugar
production is exported ...’
Australian Medical Association 2021 23You can also read