Healthcare Price Finder: A Web-Based Application for Estimating
←
→
Page content transcription
If your browser does not render page correctly, please read the page content below
Healthcare Price Finder: A Web-
      Based Application for Estimating
    Healthcare Medical Cost by Modeling
    Medicare Data With Machine Learning
                  The Harvard community has made this
               article openly available. Please share how
               this access benefits you. Your story matters

Citation              Luo, Zhejing. 2020. Healthcare Price Finder: A Web-Based
                      Application for Estimating Healthcare Medical Cost by Modeling
                      Medicare Data With Machine Learning. Master's thesis, Harvard
                      Extension School.

Citable link          https://nrs.harvard.edu/URN-3:HUL.INSTREPOS:37365606

Terms of Use          This article was downloaded from Harvard University’s DASH
                      repository, and is made available under the terms and conditions
                      applicable to Other Posted Material, as set forth at http://
                      nrs.harvard.edu/urn-3:HUL.InstRepos:dash.current.terms-of-
                      use#LAA
Healthcare Price Finder: A Web-based Application for Estimating Healthcare Medical

             Cost by Modeling Medicare Data with Machine Learning

                                   Zhejing Luo

                   A Thesis in the Field of Software Engineering

           for the Degree of Master of Liberal Arts in Extension Studies

                                Harvard University

                                   August 2020
Copyright 2020 Zhejing Luo
Abstract

       The pricing intransparency in the healthcare system of the United States has been

a long-standing problem. This thesis describes the Healthcare Price Finder project, a

web-based solution that helps users to estimate how much the medical procedures cost.

Using the Medicare Provider Utilization and Payment Dataset between 2012 and 2017,

an XGBoost regression machine learning model was trained to predict the cost of medical

procedures The model enables the Healthcare Price Finder to provide medical cost

estimates even when past pricing data is not available. A Healthcare Price Finder web

application was also developed using JavaScript framework and libraries including

React.js and Node.js, and provides an easy-to-use interface for average users to get cost

estimates for medical procedures and look up the past prices from the Medicare Provider

and Payment dataset. The current version of the Healthcare Price Finder tool was

developed with California data, and can be scaled up to provide medical procedure

charge amount estimates and past price lookups for the entire United States.

                                             i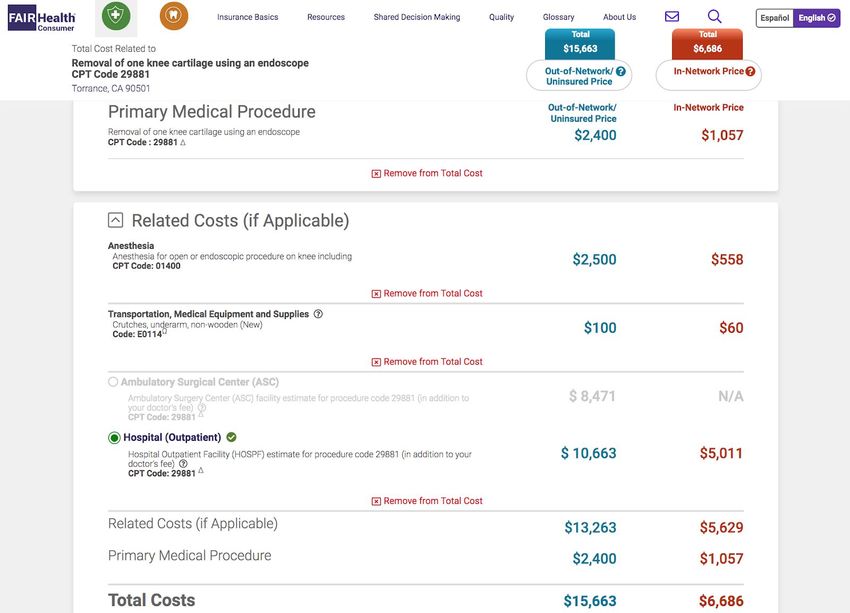
Dedication

       Dedicated to my precious son Aris Yang, who made the grand entrance into our

life and brought us immense love and joy at an unusually eventful time in history (which

also happens to be the middle of my thesis project).

                                            ii
Acknowledgments

       First and foremost, I would like to express my gratitude to my thesis supervisor,

Dr. Zoya Kinstler, for her guidance throughout my thesis project. Dr. Kinstler provided

crucial input that steered this project into the right direction, and her empathy and

encouragement during this journey was invaluable to me. I would also like to thank my

research advisor, Dr. Sylvain Jaume, who helped me with my project and for his valuable

advice and support during the thesis process. My sincere thanks also goes to my thesis

pre-work course instructor, Eric Gieseke, for helping me in shaping the idea of this

project.

       I am very grateful for the support I received from the accessibility and

accommodations office staff, including Linda Suillivan, Caitlin Mason, and Leora Simo.

Big thanks to my advisor Nada El-Newahy.

       Last but not least, completing this thesis project would have been impossible

without the support from my mother Zaihua Yang and my husband Ryan Giordano.

Thank you for being the cornerstones of my life.

                                             iii
Table of Contents
Abstract i
Dedication ii
Acknowledgments iii
List of Tables iv
List of Figures v
Chapter I. Introduction 1
Chapter II. Background 2
Chapter III. Prior Work 4
3.1 Review of Existing Medical Price Estimator Solutions 4
3.1.1 ClearHealthCosts 4
3.1.2 FairHealth Consumer 9
3.1.3 Healthcare Bluebook 12
3.1.4 Mayo Clinic Cost Estimator 15
3.2 What Can Be Done Better? 18
Chapter IV. System Overview 20
4.1 System Architecture 20
4.2 Technology Choices 22
Chapter V. Data 25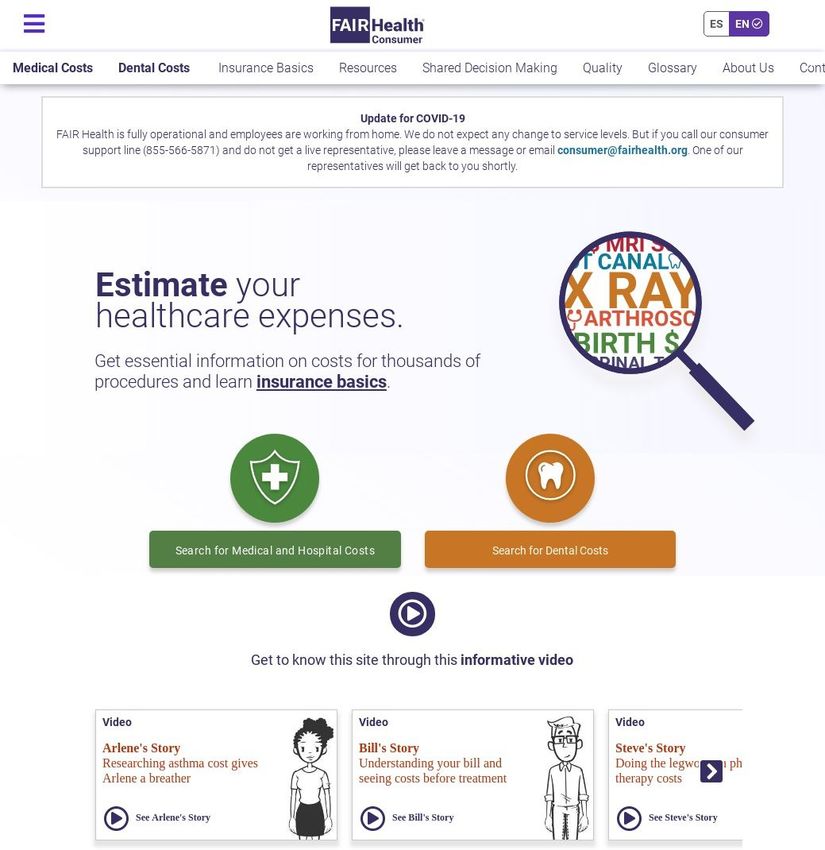
5.1 Data source 25
5.2 Dataset Details 27
5.3 Data Cleaning 34
Chapter VI. Machine Learning 36
6.1 Machine Learning Price Prediction 36
6.2 XGBoost 36
6.3 Feature Encoding 39
6.4 Feature Selection 42
6.5 Model Parameter Tuning 52
6.6 Model Evaluation 54
6.7 Scaling with More Data 55
Chapter VII. Application Implementation 58
7.1 Application Architecture 58
7.2 User Interface 60
7.3 Relational Database 67
7.3.1 Payment Table 68
7.3.2 HCPCS Tables 69
7.3.3 Provider Tables 71
7.4 Front-End (Client) 74
7.5 Back-End (Server) 76
Chapter VIII. Summary and Future Work 78
References 81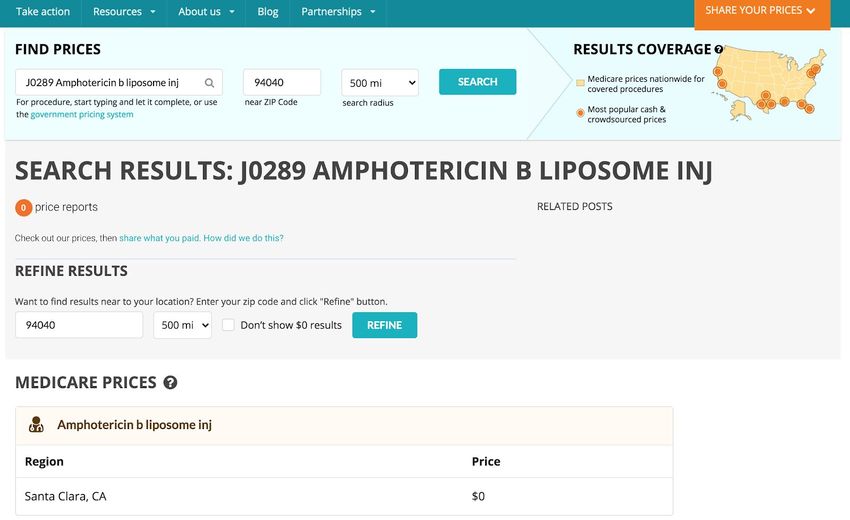
List of Tables
Table 1. AWS tools used in the Healthcare Price Finder project. 23
Table 2. Total number of the rows in the full Medicare Provider Utilization and Payments
dataset and the California subset by year. 26
Table 3. List of the columns in Medicare Provider Utilization and Payments dataset.
27
Table 4. Full list of features in the model training data. 40
Table 5: XGBoost regression model parameters and the optimized selected values for the
medical price estimator model. 52
Table 6. 10-fold cross-validation results of the tuned XGBoost model. 54
Table 7. PAYMENT table columns in Healthcare Price Finder relational database. 69
Table 8. HCPCS table columns in Healthcare Price Finder relational database. 70
Table 9. HCPCS_AGGREGATED table columns in Healthcare Price Finder relational
database. 71
Table 10. PROVIDER table columns in Healthcare Price Finder relational database. 72
Table 11. PROVIDER_COORDINATES table columns in Healthcare Price Finder
relational database. 73
Table 12. PROVIDER_TYPE table columns in Healthcare Price Finder relational
database. 73
iv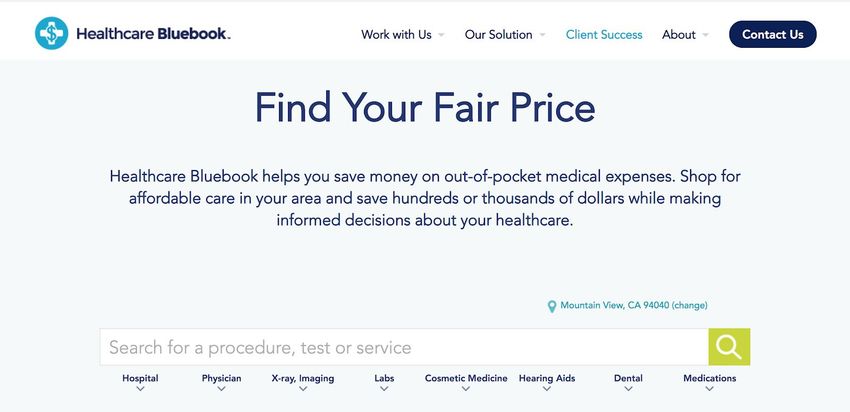
List of Figures
Figure 1. ClearHealthCosts landing page. 6
Figure 2. ClearHealthCosts search results page. 7
Figure 3. ClearHealthCosts sample search result page when no past price is found. 8
Figure 4. FAIR Health Consumer landing page. 10
Figure 5. FairHealth Consumer search results page with the Related Costs section. 11
Figure 6. FairHealth Consumer search results page with Local Price Comparison. 12
Figure 7. Healthcare Bluebook search tool landing page. 13
Figure 8. Healthcare Bluebook search results page (free version). 14
Figure 9. Mayo Clinic Cost Estimator landing page. 15
Figure 10. Locations supported in Mayo Clinic Cost Estimator. 16
Figure 11. Mayo Clinic Cost Estimator search result page (no insurance selected). 17
Figure 12. System overview diagram of the Healthcare Price Finder project. 20
Figure 13. F scores in a trained XGBoost model with 100 decision trees and max tree
depth of 5. 46
Figure 14. Feature permutation weights in a trained XGBoost model with 100 decision
trees and max tree depth of 5. 46
Figure 15. F scores in a trained XGBoost model with 100 decision trees and max tree
depth of 8. 49
Figure 16. Feature permutation weights in a trained XGBoost model with 100 decision
trees and max tree depth of 8. 49
viFigure 17. Overview flowchart of the Healthcare Price Finder Application. 59
Figure 18. Healthcare Price Finder application landing page. 60
Figure 19. Healthcare Price Finder main search page after entering location and a
keyword in the search bar. 61
Figure 20. Healthcare Price Finder procedure price details page (when the past prices on
the procedure at user’s location is available). 63
Figure 21. Healthcare Price Finder procedure price details page (when the past prices on
the procedure at user’s location is not available). 65
Figure 22. Healthcare Price Finder provider details page. 66
Figure 23. Healthcare Price Finder relational database schema. 68
Figure 24. Healthcare Price Finder Application front-end core structure UML diagram. 74
Figure 25. Healthcare Price Finder Application Back-end server UML diagram. 76
viChapter I.
Introduction
The goal of this master’s thesis project is to explore the possibility of predicting
the price of medical procedures in the United States using the 2012-2017 Medicare
Provider Utilization and Payment Data: Physician and Other Supplier dataset that was
released to the public by the Center of Medicaid and Medicare Services, and use the
discovery results to develop a user-friendly web-based application -- Healthcare Price
Finder -- to grant anyone in America with the ability to get estimates of how much the
healthcare procedure they need would cost, and easy access to the past medical pricing
data at where they live.
Machine learning techniques are used to develop an XGBoost (Extreme Gradient
Boosting) regression model for providing estimates of the medical procedures based on
the healthcare procedure and the location selected by the user.
As a proof of concept, only the California subset of the source data is used in this
project for a manageable scope and quick iterations. But the machine learning modelling
techniques and the web application developed for this project can be scaled up to support
medical price estimates in the entire United States, and contribute to increasing the
pricing transparency in US healthcare.
1Chapter II.
Background
Court records show that 66.5 percent of the bankruptcy filers from 2013 to 2016
were tied to medical issues, this makes medical bills the No.1 cause of personal
bankruptcies in the United States (Himmelstein et al., 2019). One unique characteristic of
the US healthcare billing system is pay-after-service, that people often have no idea how
much their medical bill is going to be until they receive the bill long after the visit is
completed. Because of this, healthcare consumers often have no means of negotiating or
comparing the prices between healthcare providers prior to their visit, and are often
forced to pay the expensive bills for the medical services they cannot afford.
This billing system is one manifestation of a multitude of transparency lacking in
the US healthcare system, which has led to an unparalleled inefficiency -- United States
is the country with the highest healthcare GDP spending in the world, while also having
one of the lowest life expectancies among developed countries (Kumar et al., 2011).
Medicare is the US federal health insurance program for people who are 65 or
older, certain younger people with disabilities, and people with End-Stage Renal Disease
(permanent kidney failure requiring dialysis or a transplant, sometimes called ESRD).
Centers for Medicare and Medicaid Services (CMS) Open Payments program is a part of
the national transparency program Open Payments that collects and publishes information
2about relationships between drug and medical supply manufacturers and distributors, on
one side, and healthcare providers on the other. In the Open Payments program, Centers
for Medicare and Medicaid Services (CMS) released the aggregated pricing data of all
the claims filed to Medicare. However, this dataset is released to the public in large raw
text files, a format that is difficult to access by the general public.
Currently multiple services exist to help average consumers to compare the prices
of medical service by providing access to the healthcare price estimates based on
payments data from CMS or other insurers. However, most of them only support looking
up historical data, and are unable to extrapolate price estimates when past data is missing.
In this project, I attempt to fill this gap by developing a machine learning model that is
able to predict healthcare procedure prices even with missing data. I also created a web
application to offer this model to the general public for estimating the healthcare costs.
3Chapter III.
Prior Work
3.1 Review of Existing Medical Price Estimator Solutions
As of today, there are multiple medical price lookup and estimation tools online,
however, many of them are behind paywalls or require some form of organization
membership. Three (including UnitedHealth Group, Anthem, Aetna) out of the five
biggest commercial insurance companies by market value as well as some of the smaller
medical insurance companies like Kaiser Permanente provide some form of treatment
cost estimators tool as a part of their benefits. However, these tools are only available to
their insurance plan members, and non-members are unable to access them. There are
also some companies providing treatment cost estimators for a fee, like IBM Watson’s
Treatment Cost Calculator. However, since I am aiming to build a tool that anyone with
or without insurance can use free of charge, this section only discusses the existing
medical procedure price estimator solutions online that are available for free to the
general public.
3.1.1 ClearHealthCosts
ClearHealthCosts (clearhealthcosts.com) was founded by ex-New York Times
journalist Jeanne Pinder in 2010, and has been partnering with multiple public media
platforms to help people to understand how much their medical procedures cost.
4ClearHealthCosts has received a lot of media attention and was featured on the news
multiple times, and their CEO Jeanne Pinder presented “ What if all US health care costs
were transparent?” on TEDTalks Residency in December 2018.
Figure 1. ClearHealthCosts landing page
5According to the ClearHealthCosts website, they use crowdsourced healthcare
prices from their independent reporting, from healthcare providers, from participating
consumers and from databases.
Figure 2. ClearHealthCosts search results page
ClearHealthCosts website has a straightforward search interface. User enters the
procedure name in the search bar, and a dropdown list automatically appears and displays
the most probable match in medical procedures. With a medical procedure selected, the
user enters a zip code, chooses a search radius in miles, then clicks the Search button to
6see the results. However, some of the healthcare procedure names came from user
supplied data and contain errors or cannot be matched with any specific medical billing
codes. The procedure names that are listed along with medical billing codes are often
abbreviated, which can be challenging for average users who do not have a medical
background to understand or even choose correctly.
The search results page on ClearHealthCosts does not list providers nor the
amount they charge individually, while it’s known the amount charged for the same
procedure from different healthcare providers can vary substantially. On the search
results page, often only a “Medicare price” is listed, although it is unclear how this price
is calculated. Another issue ClearHealthCosts search results is a lot of healthcare
procedure searches lead to empty results -- only a “$0” is shown, especially with less
common medical billing codes.
Figure 3. ClearHealthCosts sample search result page when no past price is found
7While having the highest publicity among the healthcare price estimator tools,
there are still places that can be improved in the presentation of the pricing data and the
data quality.
3.1.2 FAIR Health Consumer
FAIR Health (www.fairhealthconsumer.org) is an independent national nonprofit
organization founded in 2009 with the mission to help people to understand healthcare
costs and health coverage and to bring transparency to healthcare costs and insurance.
According to the FAIR Health’s website, the cost estimates are based on claims for
medical and dental services paid for by private insurance plans and includes more than 31
billion private health care claims and 20 billion Medicare claims for 10,000 services in all
areas of the United States, dating back to 2002.
8Figure 4. FAIR Health Consumer landing page
FAIR Health Consumer takes a step by step approach when asking users to enter
information for the medical procedure price estimate search, with prompts as one or
multiple pages at each step. Users are first asked to choose their insurance status, then
9enter the provider zip code, and search for healthcare procedures by keywords or
browsing the pre-defined categories.
Figure 5. FairHealth Consumer search results page with the Related Costs section
10The FAIR Health search results page presents the price estimates in two columns,
first one for the Out-of-Network/Uninsured price, and the second one for In-Network
Insured price. In addition to the price estimates of the selected healthcare procedure and
location, FAIR Health Consumer also shows the estimated prices of the related medical
procedures and the total cost, as well as the prices for the selected procedure in nearby
cities. However, no healthcare provider specific data is shown on the results page,
possibly due to reasons like the contractual agreements with data providers for
anonymization, or intentional data presentation as a part of the product design. The FAIR
Health Consumer price estimator tool stands out among competitors with it’s sheer
volume of historical data; however, gaps still exist on price estimates of the healthcare
procedures that do not have sufficient historical data.
Figure 6. FairHealth Consumer search results page with Local Price Comparison
113.1.3 Healthcare Bluebook
Healthcare Bluebook (healthcarebluebook.com) is a Nashville based company
that aims to help patients to select healthcare providers using quality and cost data.
Healthcare Bluebook’s medical price estimate tool is targeted at businesses to help their
employees to find affordable medical care, but a free search tool is available to any
healthcare consumer online.
Figure 7. Healthcare Bluebook search tool landing page
On the search interface, the user enters the location city or zip code first, and
types in the search bar to get the list of medical services that are likely matches or choose
from the list of the medical service categories under the search bar, and eventually select
one medical service.
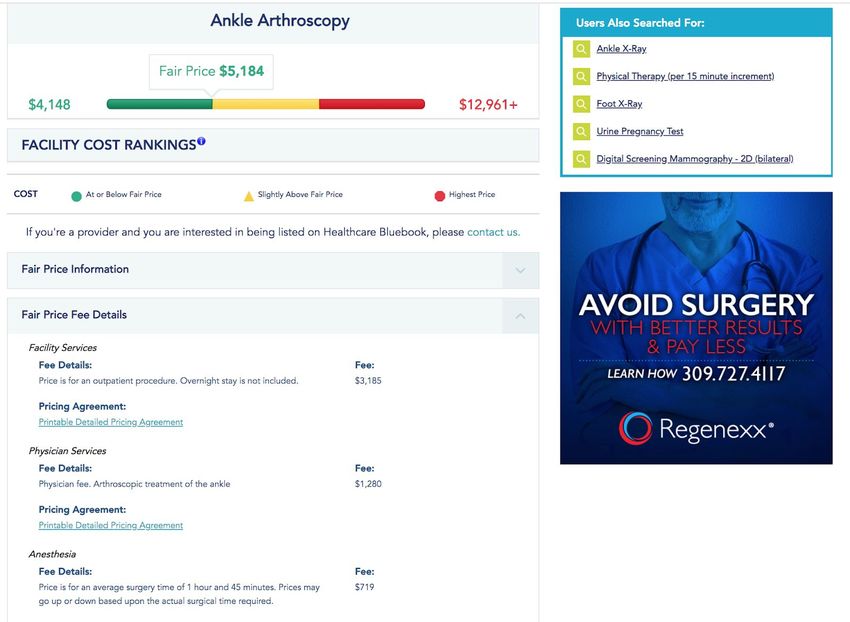
12The pricing estimates provided by Healthcare Bluebook are the total price of the
full medical service including all the procedures and physician charges instead of
individual procedures by HCPCS billing codes. In fact, the HCPCS procedure billing
codes are never displayed in Healthcare Bluebook’s search results. The search results
show a “Fair Price” box for the expected price of the medical procedure, and a
color-coded price range bar with the green rating for “At or Below Fair Price”, yellow
rating for “Slightly Above Fair Price”, and red rating for the “Highest Price”. It’s unclear
how the fair price and the price ranges are calculated. The free version of the Healthcare
Bluebook does not include the pricing data for individual healthcare providers, but it is
available in the premium version for business users. According to the screenshots of the
premium version shown on the website, each healthcare provider is color-coded by the
amount they expect to charge to help users to find providers who charge reasonable
prices for their service. Healthcare Bluebook’s pricing estimate result does not take
medical insurance into consideration.
13Figure 8. Healthcare Bluebook search results page (free version)
3.1.4 Mayo Clinic Cost Estimator
Mayo Clinic is a nonprofit research medical center currently based in three major
locations: Rochester, Minnesota; Jacksonville, Florida; and Scottsdale, Arizona. They
have made the price of their cosmetics procedures and medical services and procedures
accessible to the public through a Cost Estimator Tool (costestimator.mayoclinic.org).
This review only covers the medical services and procedures estimation tool.
14Figure 9. Mayo Clinic Cost Estimator landing page
The user starts the price estimates search on a simple interface by entering the
medical procedure name in the search bar. However, users have to navigate through as
many as 10 steps to select one of the 3 Mayo Clinic locations, enter their insurance
information, choose their medicare participation status, etc. on different pages in this tool
before reaching the actual price estimates page. It’s also revealed at a very late step that
this cost estimator tool is only able to provide prices from the three Mayo Clinic locations
and may not be suitable for all users. It is possible to improve the user experience of
Mayo Clinic Cost Estimator search by combining some of the steps and alert users of the
limitation of the tool as early as possible.
15Figure 10. Locations supported in Mayo Clinic Cost Estimator
On the search results page of the Mayo Clinic Cost Estimator tool, only an
estimated average total cost amount is displayed, rest of the items are all shown as
“N/A”. The cost estimates results are based on full procedures instead of HCPCS medical
billing codes. Only the procedures available at Mayo Clinics are included in the search,
which means this tool is unable to provide estimates for some of very common medical
procedures. The design and the available data in the Mayo Clinic Cost Estimator tool
make it highly useful for a very specific consumer group -- users who want to find out
how much some medical procedures would cost before and after insurance at one of the
three Mayo Clinic locations. It is not suitable for average users who just want to get a
quick estimate of how much the healthcare procedure they need would cost.
16Figure 11. Mayo Clinic Cost Estimator search result page (no insurance selected)
3.2 What Can Be Done Better?
In order to stand out competitively against previous medical procedure price
estimation solutions, the Healthcare Price Finder application should aim to develop some
unique features that other reviewed medical price estimator solutions cannot provide,
while also including as many of their strengths as possible in a reasonable range.
One common weakness among the reviewed price estimator tools is all of them
are strictly based on the past pricing data, which makes them incapable of providing
medical price estimates when past data is unavailable, and weakness can lower the user
experience significantly. I plan to close this gap in the Healthcare Price Finder
application by using machine learning modelling to provide estimates for the medical
procedure costs even when past data is not available.
17Another thing I noticed is none of the reviewed tools presents healthcare provider
level pricing data for free. Because of this, their functionality is limited to providing
generic price estimates at the selected locations, but cannot tell the users which healthcare
providers should be avoided for charging much higher than peers on the selected
procedure. In order to help users to choose a healthcare provider who charges reasonable
amounts for their services, I plan to make the provider-level medical pricing data
available for any user to look up, and maybe include provider-centered pages to help
users to look up provider information like the address for planning their visit. In future
developments, this part can be fledged into provider recommendations features.
The Healthcare Price Finder application should be designed with an easy-to-use
interface with simple steps in the search process since it’s a common strength among the
past medical price estimator solutions.
18Chapter IV.
System Overview
4.1 System Architecture
This section explains the overall structure of the proposed Healthcare Price Finder
project, from preprocessing the data that supports the machine learning model to the final
website that displays the price of the healthcare procedures at the selected location to the
users. The project is constructed with four main components -- machine learning, data
storage, web application front end, and web application back end. Below shows the
architectural chart of all the components integrated.
Figure 12. System overview diagram of the Healthcare Price Finder project
19The Machine Learning component includes data preprocessing, which cleans the
Medicare Utilization and Payments raw data and passes cleaned data to the Data Storage
component. The cleaned data then goes through feature encoding and engineering to
select the key columns from the dataset that are essential for creating an effective
machine learning model. The model parameters go through further calibration and
cross-validation to optimize the prediction accuracy, and the selected parameters are used
to build the most accurate machine learning model as measured by model Root Mean
Square Error (RMSE) metric and achieved within based on the chosen parameters (see
section 6.4 Feature Selection). The final model is deployed as an API endpoint, which
responds to user queries of healthcare procedure and location with estimated provider
charge amounts.
The Data Storage component stores the cleaned data in a relational database. The
Medicare data is modelled into three categories of tables in star-schema -- the main fact
table for historical payments, and dimensional tables for the Healthcare Common
Procedure Coding System (HCPCS) data and healthcare providers data.
The Front-End component renders the interface for the user to interact with the
application, like selecting the healthcare procedure they need and entering their location,
and passes the user inputs to the Back-End server component for retrieving relevant data.
The Back-End component handles the requests sent by the Front-End clients, connects to
the different services like Google Maps API and XGBoost model deployed on an AWS
20Sagemaker endpoint, and responds to the Front-End request with relevant data. Finally,
the Front-End presents the results on the user interface.
4.2 Technology Choices
Python was selected as the main programming language used in this project.
Compared to other data processing tools and programming languages, Python stands out
with the following qualities:
1. Python is the most commonly used programming language in the Machine
Learning field, and it is well-supported across platforms with abundant
documentation.
2. Python has multiple powerful libraries including Pandas, NumPy, and
IPython that are easy to use and saves time during development.
3. Python is a powerful tool for data wrangling and cleaning.
4. Python is highly interoperable and works well as the “glue” by offering
integration with other tools.
XGBoost (eXtreme Gradient Boosting) is an implementation of the Gradient
Boosted Decision Trees algorithms for predictive modelling (Chen & Guestrin, 2016).
Gradient Boosted Decision Trees is one of the “ensemble learning” machine learning
algorithms. Ensemble machine learning methods involve iteratively generating multiple
models, measuring their performance, and building new models to reduce the errors in
the previous models; the iteratively created models are combined into an ensemble of the
models for making predictions. The XGBoost implementation stands out with some
21major strengths including being fast, scalable, and outperforming other algorithms. It has
been empirically proven to be highly effective in data science studies and won a wide
array of machine learning competitions on Kaggle. In this project, XGBoost is used to
create a model that predicts the medical billing price by the medical procedure and
location that user enters. More information on details of the application of the XGBoost
machine learning techniques in this project can be found in Chapter VI.
The medical procedure price predictive model and the data storage part of the
application were implemented and hosted on Amazon Web Services (AWS) platform.
The following tools were used:
Table 1. AWS tools used in the Healthcare Price Finder project
AWS Tools Description
Sagemaker A cloud machine learning platform with the ability to build,
train, and deploy machine learning models quickly. Used for
training and hosting the healthcare price estimator model in this
project.
Relational A web service for setting up, operating, and scale distributed
Database Service relational databases in the cloud. AWS RDS for MySQL is used
(RDS) in this project for data table storage and supporting data
querying.
Simple Storage A scalable object storage service on the cloud. S3 is used to store
Service (S3) the raw data files and the trained model in this project.
I chose to use AWS mainly because AWS is almost the industry standard -- it is
known as the best overall cloud computation platform with rich functionalities. With a
22large user base, the AWS platform is often better documented with real examples
compared to other cloud computation platforms. I also have worked with AWS in the
past, which makes the development process easier. AWS allows users to pay only for the
actual amount of computing resources that were consumed, and scales up or down based
on the user demand easily for a reasonable price. Many tools commonly used for data
processing and other web services are streamlined together on the AWS platform, which
simplifies the setup process and provides better compatibility and reliability.
JavaScript and its frameworks like React.js, Node.js, and some smaller libraries
are used to implement the Healthcare Price Finder web application. Google Maps API
geocoding service is used here to determine the geographical location of addresses,
calculate the distance between the users and healthcare providers, and display the
providers in range on the interactive map.
23Chapter V.
Data
5.1 Data Source
The source data, Medicare Provider Utilization and Payment Data: Physician and
Other Supplier, is a part of the open datasets released to the public by US Center
Medicare and Medicaid (https://www.cms.gov/) for transparency. It collects the
utilization and payments for procedures and services by healthcare providers to the
federal Medicare insurance plan members without any personal identifying information
of the members. Physicians and other healthcare providers determine the amount they
charge for the services and procedures provided, and Medicare pays by a pre-negotiated
rate.
The dataset contains 100% of the processed Medicare claims from the healthcare
providers and payment (allowed amount and payment amount) information from calendar
year 2012 to 2017, organized by National Provider Identifier (NPI) and Healthcare
Common Procedure Coding System (HCPCS) code, and place of service.
It should be noted that healthcare providers who did not file any Medicare claims
and HCPCS codes that were not covered in the Medicare claims between 2012 and 2017
are missing from this dataset. However, it is possible to add them to the model by
supplementing the Medicare Provider Utilization and Payments dataset with the official
complete HCPCS codes list and the National Provider Registry dataset from the National
Plan Provider Enumeration System.
24Since more than 90% of the Medicare enrollees are 55 years or older, this source
dataset has more data on medical procedures that are more commonly used by the older
population, and less data on procedures mainly utilized by the younger population, like
the pediatric surgeries. Because of this demographic bias, the source data does not reflect
the pattern of healthcare utilization of the general population. However, the health
spending data in 2016 showed that people who are age 55 and over made up 29% of the
population but accounted for 56% of all, indicating the aging population tends to have
more healthcare needs. Therefore, the Medicare Provider Utilization and Payments
dataset still represents the medical needs of a substantial percentage of the total
population, thus still highly useful for studying the pricing and utilization of a large
number of medical procedures.
For the proof of concept of the Healthcare Price Finder project, we only used the
data for the state of California which was 7.8% of the full United States dataset.
Table 2. Total number of the rows in the full Medicare Provider Utilization and Payments
dataset and the California subset by year
Year Entire US California State % of CA data in US
2012 9,153,272 720,674 7.87%
2013 9,287,876 724,547 7.80%
2014 9,316,307 726,474 7.80%
2015 9,497,891 740,947 7.80%
2016 9,714,896 759,715 7.82%
2017 9,847,443 779,555 7.92%
25Total 56,817,685 4,451,912 7.84%
5.2 Dataset Details
Below is a table listing all the columns present in the Medicare Provider
Utilization and Payments dataset since 2012, and the description of each column. The
column naming conventions are slightly different across the years, and only 2017 column
names are shown here.
Table 3. List of the columns in Medicare Provider Utilization and Payments dataset
Column Name Field Name (from 2017) Data Type
1 National Provider Identifier npi Plain Text
(NPI)
2 Last Name/Organization provider_last_org_name Plain Text
Name of the Provider
3 First Name of the Provider provider_first_name Plain Text
4 Middle Initial of the Provider provider_mi Plain Text
5 Credentials of the Provider credentials Plain Text
6 Gender of the Provider provider_gender Plain Text
7 Entity Type of the Provider entity_code Plain Text
8 Street Address 1 of the provider_street1 Plain Text
Provider
9 Street Address 2 of the provider_street2 Plain Text
Provider
10 City of the Provider provider_city Plain Text
11 Zip Code of the Provider provider_zip Plain Text
2612 State Code of the Provider provider_state Plain Text
13 Country Code of the Provider provider_country Plain Text
14 Provider Type provider_type Plain Text
15 Medicare Participation medicare_participation_indicator Plain Text
Indicator
16 Place of Service place_of_service Plain Text
17 HCPCS Code hcpcs_code Plain Text
18 HCPCS Description hcpcs_description Plain Text
19 HCPCS Drug Indicator hcpcs_drug_indicator Plain Text
20 Number of Services line_srvc_cnt Numeric
21 Number of Medicare bene_unique_cnt Numeric
Beneficiaries
22 Number of Distinct Medicare bene_day_srvc_cnt Numeric
Beneficiary/Per Day Services
23 Average Medicare Allowed average_medicare_allowed_amt Numeric
Amount
24 Standard Deviation of stdev_medicare_allowed_amt Numeric
Medicare Allowed Amount
(before 2014 only)
25 Average Submitted Charge average_submitted_chrg_amt Numeric
Amount
26 Standard Deviation of stdev_submitted_chrg_amt Numeric
Submitted Charge Amount
(before 2014 only)
27 Average Medicare Payment average_medicare_payment_amt Numeric
Amount
28 Standard Deviation of stdev_medicare_payment_amt Numeric
Medicare Payment Amount
(before 2014 only)
29 Average Medicare average_medicare_standard_amt Numeric
Standardized Amount (after
272016 only)
1. npi – National Provider Identifier (NPI) for the performing provider on the
claim. The provider NPI is the numeric identifier registered in NPPES (National Plan and
Provider Enumeration System).
2. provider_last_org_name – When the provider is registered in NPPES as an
individual (entity type code=’I’), this is the provider’s last name. When the provider is
registered as an organization (entity type code = ‘O’), this is the organization name.
3. provider_first_name – When the provider is registered in NPPES as an
individual (entity type code=’I’), this is the provider’s first name. When the provider is
registered as an organization (entity type code = ‘O’), this will be blank.
4. provider_mi – When the provider is registered in NPPES as an individual
(entity type code=’I’), this is the provider’s middle initial. When the provider is
registered as an organization (entity type code = ‘O’), this will be blank.
5. credentials – When the provider is registered in NPPES as an individual (entity
type code=’I’), these are the provider’s credentials. When the provider is registered as an
organization (entity type code = ‘O’), this will be blank.
6. provider_gender – When the provider is registered in NPPES as an individual
(entity type code=’I’), this is the provider’s gender. When the provider is registered as an
organization (entity type code = ‘O’), this will be blank.
287. entity_code – Type of entity reported in NPPES. An entity code of ‘I’
identifies providers registered as individuals and an entity type code of ‘O’ identifies
providers registered as organizations.
8. provider_street1 – The first line of the provider’s street address, as reported in
NPPES.
9. provider_street2 – The second line of the provider’s street address, as reported
in NPPES.
10. provider_city – The city where the provider is located, as reported in NPPES.
11. provider_zip – The provider’s zip code, as reported in NPPES.
12. provider_state – The state where the provider is located, as reported in
NPPES. The fifty U.S. states and the District of Columbia are reported by the state postal
abbreviation. The following values are used for all other areas: 'XX' = 'Unknown' 'AA' =
'Armed Forces Central/South America' 'AE' = 'Armed Forces Europe' 'AP' = 'Armed
Forces Pacific' 'AS' = 'American Samoa' 'GU' = 'Guam' 'MP' = 'North Mariana Islands'
'PR' = 'Puerto Rico' 'VI' = 'Virgin Islands' 'ZZ' = 'Foreign Country'
13. provider_country – The country where the provider is located, as reported in
NPPES. The country code will be ‘US’ for any state or U.S. possession.
14. provider_type – Derived from the provider specialty code reported on the
claim. For providers that reported more than one specialty code on their claims, this is the
specialty code associated with the largest number of services.
15. medicare_participation_indicator – Identifies whether the provider
participates in Medicare and/or accepts assignment of Medicare allowed amounts. The
29value will be ‘Y’ for any provider that had at least one claim identifying the provider as
participating in Medicare or accepting assignment of Medicare allowed amounts within
HCPCS code and place of service. A non-participating provider may elect to accept
Medicare allowed amounts for some services and not accept Medicare allowed amounts
for other services.
16. place_of_service – Identifies whether the place of service submitted on the
claims is a facility (value of ‘F’) or non-facility (value of ‘O’). Non-facility is generally
an office setting; however other entities are included in non-facility.
17. hcpcs_code – HCPCS code used to identify the specific medical service
furnished by the provider. HCPCS codes include two levels. Level I codes are the Current
Procedural Terminology (CPT) codes that are maintained by the American Medical
Association and Level II codes are created by CMS to identify products, supplies and
services not covered by the CPT codes (such as ambulance services). CPT codes,
descriptions and other data only are copyright 2016 American Medical Association. All
rights reserved. CPT is a registered trademark of the American Medical Association
(AMA).
18. hcpcs_description – Description of the HCPCS code for the specific medical
service furnished by the provider. HCPCS descriptions associated with CPT codes are
consumer friendly descriptions provided by the AMA. CPT Consumer Friendly
Descriptors are lay synonyms for CPT descriptors that are intended to help healthcare
consumers who are not medical professionals understand clinical procedures on bills and
patient portals. CPT Consumer Friendly Descriptors should not be used for clinical
30coding or documentation. All other descriptions are CMS Level II descriptions provided
in long form. Due to variable length restrictions, the CMS Level II descriptions have been
truncated to 256 bytes. As a result, the same HCPCS description can be associated with
more than one HCPCS code.
19. hcpcs_drug_indicator –Identifies whether the HCPCS code for the specific
service furnished by the provider is a HCPCS listed on the Medicare Part B Drug
Average Sales Price (ASP) File.
20. line_srvc_cnt – Number of services provided; note that the metrics used to
count the number provided can vary from service to service.
21. bene_unique_cnt – Number of distinct Medicare beneficiaries receiving the
service.
22. bene_day_srvc_cnt – Number of distinct Medicare beneficiary/per day
services. Since a given beneficiary may receive multiple services of the same type (e.g.,
single vs. multiple cardiac stents) on a single day, this metric removes double-counting
from the line service count to identify whether a unique service occurred.
23. average_Medicare_allowed_amt – Average of the Medicare allowed amount
for the service; this figure is the sum of the amount Medicare pays, the deductible and
coinsurance amounts that the beneficiary is responsible for paying, and any amounts that
a third party is responsible for paying.
24. stdev_Medicare_allowed_amt – Standard deviation of the Medicare allowed
amounts. The standard deviation indicates the amount of variation from the average
31Medicare allowed amount that exists within a single provider, HCPCS service, and place
of service. Note: This variable has been removed beginning with calendar year 2014 data.
25. average_submitted_chrg_amt – Average of the charges that the provider
submitted for the service.
26. stdev_submitted_chrg_amt – Standard deviation of the charge amounts
submitted by the provider. The standard deviation indicates the amount of variation from
the average submitted charge amount that exists within a single provider, HCPCS service,
and place of service. Note: This variable has been removed beginning with calendar year
2014 data.
27. average_medicare_payment_amt – Average amount that Medicare paid
after deductible and coinsurance amounts have been deducted for the line item service.
28. stdev_medicare_payment_amt – Standard deviation of the Medicare
payment amount. The standard deviation indicates the amount of variation from the
average Medicare payment amount that exists within a single provider, HCPCS service,
and place of service. Note: This variable has been removed beginning with calendar year
2014 data.
29. average_medicare_standardized_amt – Average amount that Medicare paid
after beneficiary deductible and coinsurance amounts have been deducted for the line
item service and after standardization of the Medicare payment has been applied.
Standardization removes geographic differences in payment rates for individual services,
such as those that account for local wages or input prices and makes Medicare payments
across geographic areas comparable, so that differences reflect variation in factors such
32as physicians’ practice patterns and beneficiaries’ ability and willingness to obtain care.
Note: This variable is available starting with the calendar year 2014 data.
5.3 Data Cleaning
The raw Medicare Provider Utilization and Payment Data: Physician and Other
Supplier datasets from the CMS Open Data website has many inconsistencies. For
example, the source datasets are formatted slightly differently across the years, and some
columns have data quality issues like human error from the data entry, or contain
multiple forms of the same information. In order to combine the datasets from all the
years as the training data for further processing in the next steps, additional data cleaning
work is required. Data cleaning aims to identify and remove errors and duplicated data, in
order to create a reliable dataset. Performing data cleaning improves the quality of the
training data for analytics and enables accurate decision-making.
Data cleaning steps applied to the raw dataset include:
1) Remove all the data outside of the United States.
2) Use column names from the 2017 Medicare dataset as the standard
column names. The data from all previous years are all mapped to the
standard column names.
3) Remove all the columns from the raw datasets that aren’t present in all the
years. This includes “Standard Deviation of Medicare Allowed Amount”,
“Standard Deviation of Submitted Charge Amount”, and “Standard
Deviation of Medicare Payment Amount” from 2012 data and 2013 data,
33and “Average Medicare Standardized Amount” for all the datasets from
2014 and after.
4) Remove duplicate rows from the datasets.
5) For 9-digit zip codes in provider_zip column, only the first 5 basis digits
which indicate the destination post office or delivery area are kept.
Anything after the 5 basis digits is truncated.
6) Add a year column to distinguish the data from each year.
7) Capitalize all the letters in the credentials column and remove all the
non-letters. eg) “M.D.” and “md” both become “MD” and recognized as
the same title.
8) Change all the provider specialty names in provider_type column to the
version in the dataset from the most recent year (2017 at the time of this
project).
9) Extract California dataset using “state” column (STATE = ‘CA’).
34Chapter VI.
Machine Learning
6.1 Machine Learning Price Prediction
Machine Learning (ML) is a subset of the Artificial Intelligence (AI) methods that
enables a system to learn from the data and detect patterns for automated probabilistic
model building without being explicitly programmed (Murphy, 2012). Analytical models
created with ML methods have been successfully applied in multiple fields to solve
problems. ML is especially useful for enabling fast analysis of a large amount of data. In
this project, I use ML techniques to estimate the billing price of medical procedures
based on the Medicare utilization and payments data from CMS from 2012 to 2017.
Specifically, the Gradient Boosted Decision Trees method XGBoost is used.
6.2 XGBoost
XGBoost (eXtreme Gradient Boosting) is an implementation of the Gradient
Boosted Decision Trees (GBDT) machine learning method (Chen and Guestrin, 2015).
Gradient Boosting (GB) is an approach that falls under the ensemble learning category in
machine learning. Decision Trees (DT) algorithms build tree-like models of decisions and
possible outcomes composed of a root node, internal nodes and leaf nodes (end nodes),
starting from a root node and branch out through the internal nodes and eventually reach
leaf nodes for outcomes. GBDT yields an ensemble of decision tree models where each
35decision tree model learns from the results from the previous tree to enhance the
prediction effectiveness.
XGBoost algorithm is outlined as below:
1) Regularized learning:
Given a dataset with samples, there are independent variables (
), and each of these variables has features . For each of these
variables , there are corresponding dependent variables ( ) . A tree
ensemble model uses the independent variables and additive functions to
predict the dependent variable :
Eq. (1)
is the space of classification and regression trees (CART), and
corresponds to an independent tree structure with leaf scores.
With as a loss function that measures the gap between the prediction
and the target , and is a term for penalizing the complexity of the model, the
goal of each tree in the ensemble model is to minimize the regularized objective
in Eq. (2):
Eq. (2)
For any independent tree structure , is the number of leaves, and is
the weight score of the leaf. The penalty the tree complexity is defined as:
Eq. (3)
362) Gradient Tree Boosting
Let be the prediction of the -th instance at the -th iteration, a new
tree that improves the results the predicted results the most can be trained and
added to the ensemble model to minimize the model training objective :
Eq. (4)
By expanding Eq (1) ~ Eq (4), the optimal weight for of leaf , and the
corresponding optimal values can be written as:
Eq. (5)
Eq. (6)
In practice, it is often difficult to compute this value for all the possible tree
structures exhaustively. Instead, a greedy algorithm that starts from one leaf and
iteratively adds branches to the tree replaces this formula. Let be the instances sets of
left nodes and the instances sets of right nodes after the split, then all the nodes
, and the loss reduction after the split is converted as below:
Eq. (7)
37Furthermore, two techniques are used in XGBoost algorithms to prevent
overfitting. The first technique is shrinkage, which lowers the influence of each
individual tree and leaves space for future trees to improve the model. The second
technique is subsampling on features, in addition to the traditional random forest row
subsampling. Both techniques are applied in the XGBoost model created in this project.
More details on the XGBoost algorithm can be found in a study conducted by Chen and
Guestrin in 2016.
For regression models, Mean Absolute Error (MAE) and Root Mean Squared
Error (RMSE) are two of the most commonly used accuracy metrics for continuous
results. MAE shows the average magnitude of the errors without considering their
direction between the prediction results and the actual data, where all the differences are
weighted equally. RMSE measures the average magnitude of the errors quadratically by
taking the square root of the squared differences between the prediction results and the
actual data, and gives a higher penalty to large errors. In this project, larger errors are
particularly undesirable compared to smaller errors for users looking for an estimate of
billing amount of the healthcare procedures, therefore RMSE is selected as the scoring
metric in all the machine learning models, and MAE is only used as a reference metric in
the interpretation of the final predictive model.
6.3 Feature Encoding
After removing the unique name columns and description columns from the full
Medicare Payments dataset, the following 12 columns are used as features:
38Table 4. Full list of features in the model training data
Column Name Field Name in Cleaned Feature Cardinality
Dataset Type
1 Year YEAR Numeric 6
2 National Provider NPI Categorical 106,746
Identifier (NPI)
3 Credentials of the CREDENTIALS Categorical 1,557
Provider
4 Gender of the GENDER Categorical 3
Provider
5 Entity Type of the ENTITY_CODE Categorical 2
Provider
6 City of the Provider CITY Categorical 742
7 Zip Code of the ZIP_CODE Categorical 1390
Provider
8 State Code of the STATE Categorical 1
Provider
9 Provider Type PROVIDER_TYPE Categorical 90
10 Medicare MEDICARE_PARTICIPAT Categorical 2
Participation Indicator ION
11 Place of Service PLACE_OF_SERVICE Categorical 2
12 HCPCS Code HCPCS_CODE Categorical 5530
Most of the features available are categorical, and 5 out of 12 features have a
cardinality greater than 500. Since the XGBoost implementation package requires all the
input data to be numeric or boolean, all the categorical columns have to be encoded first
before being used for model training.
39Two encoding methods were considered in the project. The first one is label
encoding, which sorts all the unique values in a column and converts each value into an
integer number ordinally. The second one is one-hot encoding, which consists of
replacing each categorical feature with a series of new features, where each new feature
represents a unique value in the original categorical feature, with value 1 indicating
existent, and value 0 indicating non-existent.
With many of the machine learning models, one-hot encoding is often
recommended over other ordinal encoding methods like label encoding. The issue with
label encoding is it may lead to the predictive models falsely assuming the unique
categories are ordered like the integers they convert into. This can cause errors or
unexpected results especially in regression models when the relationship between the
categories and target values are non-linear. One-hot encoding binarizes each category and
prevents this ordinal error from label encoding; however. when a categorical feature has a
high number of unique values, expanding it with one-hot encoding creates a large and
sparse data, which requires an unreasonable amount of computing power to train a
machine learning model.
Both encoding methods were tested with the data in this project, and the
disadvantages described above with one-hot encoding were significantly taxing on the
model performance. The source dataset contains multiple high cardinality columns like
ZIP_CODE, NPI, and HCPCS_CODE, and one-hot encoding causes the dataset to grow
more than 300 times in size, rendering the model fitting extremely difficult and expensive
to perform. Different methods like clustering and splitting the dataset were tested to
40reduce the dimensionality of the dataset, but none of them mitigates this issue without
sacrificing model performance or adding too much complexity.
Compared to the test model results yielded with one-hot encoding, label encoded
data performs well in XGBoost without significant decrease in model performance and
takes much less computing resources. Further investigation confirmed that the decision
tree based algorithms like XGBoost are tolerant of label encoded categorical features,
since decision trees can make repeated splits on the same features to handle
numeric-encoded features in a non-linear manner. Moreover, two categorical features --
HCPCS_CODE and ZIP_CODE -- in the source dataset, are also “ordered” to a certain
degree while being categorical, as similar healthcare procedures often have similar codes
in the HCPCS coding system, and locations that are geographically close also have
similar zip codes. The linearity in label encoding enables the XGBoost to establish
connections between values that are similar and take this connection into consideration
while fitting models. Using label encoding also allows the model to work with the
categorical values that are not present in the training dataset, as long as they are included
as a part of the possible values in the label encoder. As a result, label encoding is selected
as the categorical value encoding method used in this project.
6.4 Feature Selection
Feature selection is an approach of improving the effectiveness of machine
learning models by identifying and removing the features that do not help much in
making predictions. In this project, features are selected based on the feature importance
41and effectiveness estimated from multiple rough training models, as well as their
relevance of features in medical price estimator product design -- it must be feasible to
determine the value of all the feature columns in the machine learning model input when
users look up the price estimates for medical procedures. For example, there are multiple
types of credentials for mental health professionals practicing in the psychotherapy, and
it’s often difficult for clients to find out the which type of the qualification a provider has
prior to the visit, therefore making credentials a poor feature from product design
perspective, even if it is highly relevant to the model outcome.
In XGBoost regression models, the Feature Importance metric (F-score) is the
number of times a feature appears in a tree. However, this metric is biased towards
features that have high cardinality, since the number of possible decision tree splits grows
nonlinearly with higher cardinality. The calculation of F-score in XGBoost regression
models is outlined as below:
● Inputs: fitted random forest predictive model , tabular dataset (training
or validation) .
● For each feature (column of ):
○ For each tree in the random forest predictive model ,
compute , the number of the times feature appears in .
○ Compute feature importance weight for feature defined as:
42In order to reduce the bias introduced by the high cardinality features, a different
metric Feature Permutation Weight which measures how prediction score decreases when
a feature is not available is also considered during the feature selection process. The
feature permutation importance algorithm is outlined as below:
● Inputs: fitted predictive model , tabular dataset (training or validation)
.
● Compute the reference score of the model on data (RMSE is used
as the reference score in this regression model).
● For each feature (column of ):
○ For each repetition in :
■ Randomly shuffle column of dataset to generate a
corrupted version of the data named .
■ Compute the score of model on corrupted data .
○ Compute importance for feature defined as:
I first trained a rough XGBoost regression model to predict the billing charge
amount in XGBoost with all the features to get an estimation of the feature importance.
80% of the dataset is used as the training data for fitting the model, and 20% of the
dataset as the test data for validating the model. Most of the default parameter values are
used for the first feature selection rough model, except max_depth is set at 5 instead of
43You can also read