Nebula: A Coordinating Grammar of Graphics - zjuidg
←
→
Page content transcription
If your browser does not render page correctly, please read the page content below

IEEE TRANSACTIONS ON VISUALIZATION AND COMPUTER GRAPHICS, VOL. XX, NO. X, XX 2021                                                                 1

    Nebula: A Coordinating Grammar of Graphics
               Ran Chen, Xinhuan Shu, Jiahui Chen, Di Weng, Junxiu Tang, Siwei Fu, Yingcai Wu

      Abstract—In multiple coordinated views (MCVs), visualizations across views update their content in response to users’ interactions in
      other views. Interactive systems provide direct manipulation to create coordination between views, but are restricted to limited types of
      predefined templates. By contrast, textual specification languages enable flexible coordination but expose technical burden. To bridge
      the gap, we contribute Nebula, a grammar based on natural language for coordinating visualizations in MCVs. The grammar design is
      informed by a novel framework based on a systematic review of 176 coordinations from existing theories and applications, which
      describes coordination by demonstration, i.e., how coordination is performed by users. With the framework, Nebula specification
      formalizes coordination as a composition of user- and coordination-triggered interactions in origin and destination views, respectively,
      along with potential data transformation between the interactions. We evaluate Nebula by demonstrating its expressiveness with a
      gallery of diverse examples and analyzing its usability on cognitive dimensions.

      Index Terms—Coordination, multiple coordinated views, interactive visualization, grammar of graphics

                                                                           F

1    I NTRODUCTION

M      ULTIPLE coordinated views (MCVs), wherein visual-
       izations across views update their content in response
to users’ interactions in other views, are prevalent in mod-
                                                                               visualizations. For example, users must write excessive code
                                                                               to synchronize the selection of Vega-Lite with the d3-event of
                                                                               D3 and establish coordination between the two libraries.
ern visualization systems [1]. An example of MCVs is the                           The gap between the expressiveness and usability in co-
scatterplot matrix, wherein users select points in one scatter-                ordinating visualizations motivates us to develop Nebula, a
plot, and other scatterplots will highlight the corresponding                  grammar for the rapid construction of flexible coordination
points (Fig. 1). By coordinating multiple views and syn-                       based on a novel demonstration-driven coordination frame-
chronizing visualizations automatically, MCVs facilitate a                     work. Our approach is threefold. First, we capture and ana-
comprehensive and multifaceted analysis, presenting un-                        lyze the current views of coordination through an extensive
foreseen data relations and improving user performance [1].                    review of the existing theories and applications to abstract
    Despite the widespread use of MCVs, constructing ef-                       coordination properly. We observe that although researchers
fective and expressive coordination between views remains                      model coordination as data flows and state changes between
challenging. Interactive systems, such as Tableau, only pro-                   multiple views [7], they incline to describe coordinations by
vide limited types of coordination based on predefined tem-                    demonstration, i.e., how coordination is performed by users.
plates (low expressiveness). Textual specification languages                   Second, we propose a novel demonstration-driven coordi-
(e.g., D3 [2], Vega [3], and Vega-Lite [4]) allow users to                     nation framework based on the observation. This frame-
author flexible coordination, but it can be difficult because                  work formalizes coordination as a composition of user- and
these languages lack a proper abstraction of coordination                      coordination-triggered interactions, along with the potential
(low usability). Specifically, the difficulties are manifested                 data transformations between the two types of interactions.
in two aspects. First, these languages model coordination                      Such a framework complements the state-of-the-art research
as a complex composition of basic visualization elements                       on the concise representation of coordination. Third, we
(e.g., marks, transforms, encodings) and interaction con-                      design Nebula, a grammar that allows users to construct
figurations (e.g., initialization, events) rather than explicit                coordination based on the framework intuitively with the
interaction responses (e.g., selecting, highlighting). Such a                  structured templates written in natural language. For exam-
poor closeness of mapping [5] may increase the gulf of execu-                  ple, the coordination in a scatterplot matrix (Fig. 1) can be
tion [6] in the construction of coordination. Second, users                    constructed in Nebula simply with “select items in any scat-
usually coordinate visualizations from different libraries to                  terplot, then highlight items in other scatterplots.” Moreover, the
construct various MCVs. However, the incompatible mech-                        architecture of Nebula decouples coordination specifications
anisms of libraries exacerbate the difficulty of coordinating                  from visualization design, thereby improving compatibility
                                                                               with different visualization libraries.
                                                                                   We evaluate the expressiveness and usability of Neb-
•   Ran Chen, Jiahui Chen, Di Weng, Junxiu Tang, and Yingcai Wu are with
    the State Key Lab of CAD&CG, Zhejiang University, Hangzhou 310027,
                                                                               ula with two different approaches [8], respectively. For
    China. They are also with the Zhejiang Lab, Hangzhou 311121, China.        expressiveness, we create a gallery of the diverse examples
    Email: {chenran928, jhchen6, dweng, tangjunxiu, ycwu}@zju.edu.cn.          that reproduce the frequently-occurring coordinations in the
•   Xinhuan Shu is with the Hong Kong University of Science and Technol-       reviewed literature. We also demonstrate how the coordi-
    ogy, Hong Kong, China. Email: xinhuan.shu@connect.ust.hk.
•   Siwei Fu is with the Zhejiang Lab, Hangzhou 311121, China. Email:          nation constructed by Nebula could support complicated
    fusiwei339@gmail.com.                                                      visual analysis tasks with a real-world application of MCVs.
•   Yingcai Wu and Siwei Fu are the co-corresponding authors.                  For usability, we conduct a qualitative analysis based on
Manuscript received Oct 30, 2020; revised Feb 3, 2021.                         the Cognitive Dimensions of Notation framework [5]. The
IEEE TRANSACTIONS ON VISUALIZATION AND COMPUTER GRAPHICS, VOL. XX, NO. X, XX 2021                                                                     2

                                                                                          to enable precise control of coordination, which visualized
                                                                                          the structures of MCVs as dataflow graphs [18]. Koytek et
                                                                                          al. [19] focused on brushing and linking coordination and
                                                                                          developed a specific design space that divides coordination
                                      1
                                                                       2                  into the source, link, and target to refer to data points and
                                                                                          relationships between views.
                                                                                              To conclude, researchers commonly regard coordination
                                                                                          as a dataflow graph in MCVs. However, such a dataflow
                                                                                          graph is often invisible and cannot directly reflect the in-
                                                                                          teraction responses in coordination. This work extends the
                                                                   2                      dataflow graph and introduces a novel framework that
                                  2
                                                                                          abstracts coordination by demonstration. In particular, the
                                                                                          framework formalizes coordination as a composition of
                                                                                          interactions and potential data transformations.
    " 1 Select items in any scatterplot, 2 then highlight items in other scatterplots."

                                                                                          2.2   Coordination Support in Visualization Tools
Fig. 1. Top: Example of MCVs showing an interactive scatterplot matrix,
where the points selected by users in any scatterplot will highlight                      A multitude of visualization authoring tools has emerged
the corresponding points in the other scatterplots. Bottom: A Nebula                      in recent years to assist in constructing MCVs. This sec-
specification which describes the above coordination by demonstration
in a natural language sentence.
                                                                                          tion reviews the realization of coordination in these tools
                                                                                          to support MCVs, which is classified into two categories:
                                                                                          interactive systems and programming-based tools [20].
result indicates that Nebula shows some advantages in most                                    Grammel et al. [21] and Mei et al. [22] surveyed a
dimensions, suggesting that it may offer potential usability                              variety of interactive systems for authoring visualization
benefits to users.                                                                        in a non-programming environment. Nevertheless, only a
                                                                                          small part of these systems support coordinating multi-
                                                                                          ple visualizations. For example, Snap [14] enables users
2     R ELATED WORK                                                                       to coordinate views by joining data tables of these views
This section presents works regarding foundations of coor-                                based on relational data models and coupling primary-
dination and coordination support in visualization tools.                                 and foreign-key actions on these data tables. Improvise [7]
                                                                                          provides live properties, a direct shared-object coordination
                                                                                          mechanism, along with an indirect coordination mechanism
2.1     Foundations of Coordination                                                       (coordinated queries), using a visual abstraction language.
A variety of theories, models, and frameworks have been                                   However, creating coordinations in these systems, which
proposed since the late 1990s to characterize MCVs [9]. Most                              require high learning overhead and verbose operations, can
of these works focus on the design of multiple views [10],                                be tedious for users. To address the issue, advanced visual
[11], [12], [13]. By contrast, we focus on existing works                                 models or paradigms out of programming are applied to
on coordination. North and Shneiderman [1] defined co-                                    help construct coordinations. For example, business intelli-
ordination as a link between visualizations and classified                                gence (BI) software, such as Tableau (formerly Polaris [23]),
coordinations into six categories based on user actions and                               enable users to create common coordinations based on
data relationships at both ends of the link. Following a                                  predefined templates. MyBrush [19] supports customizing
similar definition, Baldonado et al. [11] generalized user                                various brushing and linking coordinations by configuring
actions as interactions. North et al. [14] extended the line of                           the details (e.g., visual attributes, temporality) of source,
research and proposed a conceptual model named “Snap-                                     link, and target. Lyra2 [24] allows users to rapidly create
Together Visualization” based on the relational data model.                               interactions in multiple views by demonstration and a set
In the model, multiple views are coordinated by joining                                   of heuristics. Dataflow systems (e.g., VisFlow [25]) provide
data from different data tables through primary- and foreign-                             dataflow operators that can construct coordination along
key actions. North et al. [15] further discussed visualization                            the dataflow, in which interactions in upstream views could
schemas based on the Snap model and represented MCVs                                      change the visual representation of downstream views. The
as graphs whose nodes and edges respectively represent                                    construction can be further simplified With the assistance of
visualizations and coordinations. Pattison et al. [16] pre-                               natural language interfaces (e.g., FlowSense [26]). Despite
sented a component-based framework for the implemen-                                      their capability to reduce technical burdens, these methods
tation of generic visualizations and coordinations in the                                 suffer from limited expressiveness, i.e., only supporting
Model-View-Controller (MVC) pattern. Visualization com-                                   limited types of coordinations.
ponents in this framework are abstracted into data models,                                    By contrast, programming-based tools allow users to
while coordination components are used to observe changes                                 author custom coordination. Visualization programming
in data and trigger changes of dependent data. Boukhelifa et                              toolkits and libraries, such as ProtoVis [27] and D3 [2],
al. [17] enhanced the framework by shared abstract objects.                               can achieve extremely high expressiveness. However, they
Weaver [7] combined the shared-object direct coordination                                 also face similar problems to Snap and Improvise, namely,
mechanism [17] and an indirect coordination mechanism                                     considerable programming expertise and tedious execu-
based on an expression-based visual abstraction language                                  tion codes. To alleviate the issue, declarative grammars
IEEE TRANSACTIONS ON VISUALIZATION AND COMPUTER GRAPHICS, VOL. XX, NO. X, XX 2021                                                        3

grounded in The Grammar of Graphics [28] are introduced                                              MCVs
to enable rapidly generating visualizations through con-
                                                                            View #1            Coordinations              View #2
cise JSON syntax. These grammars mask the underlying
execution details and focus on design decision-making by                dataset selection         Data              dataset selection
composing visualization elements, thus increasing efficiency            color scales ...     Transformations        color scales ...
and reducing the learning cost. Recently, various declarative
grammars have emerged [3], [4], [29], [30], [31]; however,
                                                                    Fig. 2. In traditional models, MCVs comprise views and coordinations.
these grammars are not targeted at coordination and lack
                                                                    Views control the visual representations by their backing data and
specific design. For example, Vega-Lite requires users to           states. Coordinations propagate interaction responses by building links
first configure interaction with its interaction primitive selec-   to transmit and transform these data and states, which can be modeled
tion and then apply selection to basic visualization building       as a coordination dataflow graph.
blocks (e.g., transform, encoding) in different views to specify
coordination. Such a grammar highly couples visualization           the views, while the links represent data transmission and
design and coordination specifications, requiring users to          transformation between the views.
frequently switch context between individual visualization
elements and coordination between visualizations, which
introduces obstacles to the construction of coordination.           4     L ITERATURE R EVIEW AND A NALYSIS
    In summary, authoring toolkits balancing expressiveness         To abstract the concept of coordination properly, we conduct
and usability for creating coordination remain absent. Thus,        an extensive literature review and capture the view of
we propose a novel coordination grammar, Nebula, which              coordination in visualization. We choose this methodology
allows users to specify coordinations by demonstration in           because it covers a wide range of real practices of creating
structured natural language templates. The Nebula archi-            coordination. Consequently, the survey collects a corpus of
tecture decouples coordination specifications from visual-          176 coordination techniques and informs the design of the
ization design, thus improving compatibility to integrating         coordination framework by demonstration.
external visualization libraries.
                                                                    4.1    Survey on Coordination
3   T ERMINOLOGY                                                    Toward a deep and comprehensive understanding of coor-
                                                                    dination, we surveyed coordination techniques from papers
To clarify the scope of our research, we introduce the related
                                                                    and visualization systems to cover as many scenarios as pos-
terms used in our paper and present the model in Fig. 2.
                                                                    sible. First, we began by collecting papers on coordination
    MCVs. MCVs are developed to aid exploratory visual-
                                                                    theories and surveys. Next, we expanded the collection by
ization. MCVs generally comprise a set of views and coordi-
                                                                    studying commercial visualization systems and academic
nations between these views [1]. The coordinated views are
                                                                    visualization authoring tools, which typically implement a
updated accordingly upon the users’ interactions in some
                                                                    wide range of coordinations to facilitate the construction
of the views. A typical example is the interactive scatterplot
                                                                    of MCVs. Finally, to enrich the diversity, we selected a
matrix (Fig. 1).
                                                                    collection of design study papers involving different data
    View. A view comprises a visualization or a composition
                                                                    types (e.g., high-dimensional, time-series, geospatial, and
of several visualizations, along with potential widgets (e.g.,
                                                                    hierarchical) published in the past decade, along with the
button, slider, and text), to control visual properties [4],
                                                                    corresponding visual analytics systems that integrate rich
such as size, title, and label. For example, each scatterplot
                                                                    coordination applications for various visualization tasks.
in a scatterplot matrix can be regarded as a view, while
                                                                        We then manually extracted coordinations from these
the scatterplot matrix can also be regarded as a view when
                                                                    papers and systems for the subsequent analysis. Specifically,
cooperating with other visualizations. Moreover, a view can
                                                                    we first captured each coordination by reading these papers
accept interactions and manipulate its visual representations
                                                                    or documents, watching their videos, and using the online
accordingly. In particular, interactions will result in the
                                                                    demos. We then recorded authors’ descriptions for these co-
modification of the backing data and states in the view [32].
                                                                    ordinations, because these descriptions are carefully crafted
    Coordination. Coordination creates links among the
                                                                    and explained to the audience, thus preserving authors’
views. These links propagate the responses of user in-
                                                                    intent and intuitively presenting coordinations with a rich
teractions (i.e., visual changes) from one view to others.
                                                                    trove of details, e.g., purposes, tasks, and realizations.
Specifically, these links propagate the data and state changes
                                                                        Consequently, the survey involves 45 papers, 1 com-
between the views. For example, after a selection interaction
                                                                    mercial visualization system, 6 visualization tools, and 31
is performed by users in one view to specify a subset of data,
                                                                    visual analytics systems, arriving at a corpus of 176 co-
the coordination may trigger other views to update their
                                                                    ordination techniques. All these materials are available at
subsets accordingly (e.g., highlight the data). Data transfor-
                                                                    https://nebula-vis.github.io/survey.
mation, such as subsetting, merging, filtering, and intersec-
tion, is often required to resolve data inconsistencies among
the views as the data changes are propagated. Moreover,             4.2    Data Analysis
advanced algorithms, such as clustering and reduction, are          To gauge an appropriate abstraction level, we first observe
needed for remarkably complex data transformation sce-              the description of coordinations by visualization researchers
narios. Coordination can also be modeled as a dataflow              in the survey and the reasonable abstraction of these de-
graph [7], where the nodes denote the data and states in            scriptions. Importantly, we find researchers tend to describe
IEEE TRANSACTIONS ON VISUALIZATION AND COMPUTER GRAPHICS, VOL. XX, NO. X, XX 2021                                                              4

the coordination by demonstration, i.e., depicting the users’       A    select                        203   B    select 41 54 11 15 7 7
interactions in some views and the corresponding updates                     set             82                       set        3        1
of other views. For example, Satyanarayan et al. [4] de-               navigate    35                           navigate 3           8 1
                                                                           filter 30                                filter             2    1
scribed coordinations in Vega-Lite using the sentences, such
                                                                    reconfigure 10                           reconfigure 1 1
as “selections in one view can also be used to filter input data                                                 append                        2
                                                                        append 9
to another view” and “panning/zooming the bound interval                                                                     c t et te r re d e
                                                                        encode 4                                                       e
                                                                                                                           le s a ilt u n od
selection in the first view also updates the second view”. In ad-                                                        se avig f nfig ppeenc
                                                                                0    50      100 150 200                      n      co a
dition, although not directly characterizing the coordination                                                                      re
dataflow graphs, these descriptions maintain the rationality                coordination-triggered                 count
of these dataflow graphs. Therefore, based on the analysis                  user-triggered
                                                                                                                   1                         54
of the authors’ descriptions by demonstration, we model
the abstraction of coordination into the following three parts      Fig. 3. Statistics of the corpus of 176 coordination techniques. (A) The
(Fig. 4(A)):                                                        frequency distribution of interactions in coordination. (B) The frequency
 User-triggered interactions—interactions that are directly        distribution of one-to-one interaction compositions in coordination. The
                                                                    y- and x-axes respectively represent the user- and the coordination-
   performed by users.                                              triggered sides.
 Coordination-triggered interactions—“virtual” interac-
   tions performed in coordinated views that cause content
   updates in response to user-triggered interactions.              and refining the coordination abstraction iteratively.
 Data transformations—transformations that manage the
   potential inconsistency of the backing data between the          4.3   Findings
   user- and coordination-triggered interactions.                   Based on our survey, we compute a series of summary statis-
In the above examples, “selection in one view” and “pan-            tics to gain an overview of the coordination usage. Fig. 3(A)
ning/zooming the first view” are user-triggered interactions,       shows the frequency of each interaction in coordination.
while “filter input data to another view” and “updates the second   The 176 coordinations contain a total of 373 interactions.
view” are coordination-triggered interactions.                      Among these interactions, Select is the most frequently used
     To effectively investigate and summarize the user- and         interaction technique in coordination (203/373). Another
the coordination-triggered interactions, we divide them into        commonly used interaction is Set (82/373), while others are
seven categories (Fig. 4(B)), which were initially drawn from       less than 10%. The distribution is reasonable, as coordina-
the interaction taxonomy of Yi et al. [33] and refined in           tions are realized based on dataflow graphs while Select and
the context of coordination during the survey. The seven            Set provide direct means to manipulate data. In addition,
categories are described as follows.                                Select is mainly used on the user-triggered side (151/203),
 Select specifies some elements of interest (e.g., data items      while the others mainly occur on the coordination-triggered
   and intervals) by actions such as clicking and brushing.         side. After investigating the examples, we find Select is
 Filter alters the exclusion criteria for visual elements.         mostly used by users for searching a data subset of interest,
 Navigate alters the viewpoint and scales of visualization         followed by the further exploration on the subset in other
   by actions such as panning, zooming, and rotating.               views with various interactions.
 Encode pertains to changing the fundamental visual rep-               Furthermore, we study the composition of these in-
   resentation (e.g., color, size, and shape) of the data.          teractions considering pairing the user- and coordination-
 Reconfigure changes the spatial arrangement (e.g., sorting,       triggered interactions. In total, 26 composition types are
   adjusting baselines) of visualizations.                          identified from the 176 coordinations, including 16 one-to-
 Set is frequently used in coordination to operate view            one (one user- and another coordination-triggered interac-
   configuration (e.g., replace the dataset, operate the control    tion) and 10 complex (at least two interactions on either
   widgets, such as slider, and modify the text of title/axis).     user- or coordination-triggered side) types. Specifically, 16
 Append appends new data to the visualization without              one-to-one types appear 158 times (89.8%), while 10 com-
   overwriting the old one. Such interaction is especially          plex types only appeared 18 times (10.2%). As expected, sim-
   useful in coordinations related to streaming data.               ple compositions are more common in coordination, while
     Compared with the original taxonomy, Select, Filter, En-       complex compositions may be designed for specific scenar-
code, and Reconfigure are retained. In addition, Navigate is        ios. Fig. 3(B) presents the frequency distribution of these
derived by merging Explore and Abstract/Elaborate due to            one-to-one compositions, where Select → Set (54/158) and
their similarity in navigating to different data perspectives.      Select → Select (41/158) are the top two popular composi-
Next, Connect is removed because it is usually used in              tions, followed by Select → Filter (15/158), Select → Navigate
multiple views and can be replaced by the composition               (11/158), Navigate → Navigate (8/158), Select → Reconfigure
of other interactions. Finally, two unique interactions in          (7/158), and Select → Append (7/158). This distribution
coordination (i.e., Set and Append) are observed and added          is consistent with the statistics on individual interactions,
to the categories. It is noted that these categories are summa-     where Select and Set are dominant in coordination.
rized following the literature survey and may be adjusted to            Then, we examine the backing data transformations be-
better fit the coordination context in the future. For example,     tween the pairs of user- and coordination-triggered inter-
Append currently focuses on streaming data and may be               actions. Although data transformations may not be directly
extended to general interactive scenarios.                          elaborated, we infer the implementation from the descrip-
     Two of the authors individually coded all the collected        tions of coordination and the experience of authoring visu-
coordinations and resolved the disagreements by discussing          alization. For example, a coordination in a scatterplot matrix
IEEE TRANSACTIONS ON VISUALIZATION AND COMPUTER GRAPHICS, VOL. XX, NO. X, XX 2021                                                                    5

A        User-trigger                                       Coordination-trigger          B                                            a   b
                                    Coordinations
    Select Navigate ...                                     Select Navigate ...

                                       Data                                                   Interaction     Select     Filter   Encode       Set
            View #1               Transformations                  View #2
      dataset selection                                       dataset selection
      color scales ...                                        color scales ...                                Navigate Reconfigure Append

Fig. 4. Overview of our novel coordination framework. (A) The coordination is abstracted by demonstration and formally modeled as a composition
of user- and coordination-triggered interactions above the views in the traditional model, along with potential data transformations. (B) Interactions
are further divided into seven categories and control the visual representations of views based on the data and states.

aims to highlight the intersection of points selected in two                5.1     Coordination Components
views (Fig. 5(D). Realizing the coordination requires a data
                                                                            5.1.1    Interactions in Coordination
transformation that computes the intersection of the two sets
of points selected by their respective views. Consequently,                 To construct the coordination dataflow graph, interactions
we find that 82 out of the 176 coordinations involve at least               are usually associated with the backing data and states
one data transformation (46.6%). These data transformations                 of views. Thus, interacting with views will modify these
are diverse for various purposes (e.g., mining features of                  data and states. Coordination connects these data and states
a dataset, joining two data tables, and maintaining the                     to propagate interaction responses between views. These
consistency between two data structures).                                   data and states are called targets of interactions, which are
    Finally, we investigate the coordination structures, i.e.,              elaborated following the taxonomy of interactions in Section
the composition of these interactions and data transforma-                  4.2 (Fig. 4(B)).
tions. We found that most of these coordinations are asym-                      Select. The targets of Select are the selected elements,
metric (163/176). That is, the coordination arising from the                which include two types: items (Fig. 6(A)) and intervals
user-triggered interactions in view A to the coordination-                  (Fig. 6(C)). The selected items refer to single or multiple data
triggered interactions in another view B is different from                  records in views (e.g., points in scatterplots, nodes and links
that from view B to A if it exists. The result is consistent with           in graphs) and are usually stored in arrays. The selected
most multiple-view systems, wherein different views carry                   intervals are similar to the intervals of Vega-Lite [4], which
out different tasks, and the coordination links these views                 specify a range of data (e.g., brushing a period of time or
based on a specific workflow of the system. Meanwhile,                      lassoing a geospatial area).
we found a rare but special coordination structure from the                     Filter. Unlike Select, the targets of Filter are the elements
remaining 13 coordinations, which are symmetric. Typical                    that users intend to discard (Fig. 6(B)) but possess the same
examples include scatterplot matrix and small multiples,                    types: items and intervals.
in which multiple views present the same type of visual-                        Navigate. Navigate alters the viewpoint and the scales of
izations. The symmetric structure motivates a method to                     visualization. The targets can be one-dimensional or multi-
rapidly specify coordination between views.                                 dimensional scales. For example, scrolling a document up
                                                                            and down is a one-dimensional Navigate interaction because
5    C OORDINATION F RAMEWORK                                               it only alters the page number. Typical two-dimensional
Informed by our survey and the analysis in Section 4.2, we                  Navigate interactions include panning and zooming in maps
propose a novel demonstration-driven coordination frame-                    (Fig. 7(B)). Both interactions modify the scales of the x and
work illustrated in Fig. 4(A). The framework abstracts co-                  the y dimensions of the map, which are usually stored in
ordination by demonstration, namely, how coordination is                    two variables (e.g., intervals of the longitude and latitude,
performed by users. Thus, the coordination in MCVs can                      positions of the upper-left and the lower-right points, the
be formalized as a composition of user- and coordination-                   position of the focal points, and the zoom level).
triggered interactions, along with potential data transfor-                     Encode. The targets of Encode indicate the visual chan-
mations. To maintain the rationality of the underlying struc-               nels (e.g., position, color, and size). Encode is usually per-
ture, the abstraction is based on the coordination dataflow                 formed to modify visual channels or their properties via
graph [7], which encapsulates the data and states of views                  control widgets. For example, users can interact with a
into interactions (node) and manages data transmission and                  control slider whose value encodes the size of the points
transformation between interactions (link).                                 to change the size (Fig. 8). These targets are usually stored
    Based on the summary statistics of the corpus in Section                as a value of an object.
4.3, we first elaborate two basic components in coordina-                       Reconfigure. The targets of Reconfigure describe the
tion, i.e., seven categories of interactions (Fig. 4(B)) and                spatial arrangement of data in the canvas. For example,
data transformations in Section 5.1. We then discuss the                    LineUp [34], a multi-attribute ranking visualization tailored
composition of these components in Section 5.2. Finally, we                 from stacked bar charts, enables users to adjust the column
generalize the coordination structures in terms of various                  (attribute) order by dragging and dropping the column
compositions of interactions and data transformations in                    headers (Fig. 9). Such interactions modify the spatial po-
Section 5.3.                                                                sitions of attributes to reconfigure the visualization.
IEEE TRANSACTIONS ON VISUALIZATION AND COMPUTER GRAPHICS, VOL. XX, NO. X, XX 2021                                               6

    Set. The targets of Set are view configurations, which are     selected data can be set as the input dataset in another view
usually modified through control widgets (e.g., select, input,     (Select → Set in Fig. 6(A)). This process can involve mining
and text). For example, users can select to import new data        algorithms in data transformation to discover features of
and change the parameters of algorithms via the select and         selection. For example, users select data in one view which
input widgets (Fig. 10).                                           are then computed through a clustering algorithm, and the
    Append. Append focuses on streaming data and updates           clustered results are set as the input data in coordinated
the visualization with new data based on the existing encod-       views for further analysis. Another common coordination is
ing mechanism. The target of Append is the newly-generated         Select → Navigate, in which the selection is used to guide
data to be added to the visualization (Fig. 10).                   the navigation. A typical scenario is hierarchical browsing,
                                                                   wherein overview provides a global map, and selection
5.1.2 Data Transformations                                         in overview will navigate to the corresponding area for
Data transformation is required in coordination in the pres-       details (Fig. 7(A)). This composition usually requires a data
ence of inconsistency between the backing data of user- and        transformation to extract the navigation information from
coordination-triggered interactions in views. The inconsis-        the selection. One exception is that the target of Select is
tency may originate from the following various reasons: dif-       interval, which may directly serve as the input of Navigate
ferent interactions (e.g., Select and Navigate), types of views    (Fig. 6(C)). Select → Reconfigure is usually used to rearrange
(e.g., Select in scatterplots and node-link graphs), or underly-   the data in a view based on the selection in another view
ing implementations (e.g., Select in D3 [2] and Vega-Lite [4])     through a specific data transformation to extract the spatial
at both ends of links in the coordination dataflow graph.          arrangement from the selection. An example is the user-
Moreover, the inconsistency can be caused by visualizing           guided matrix reordering [35], where the selected data in
different datasets in these views. For example, two views          the scatterplot will be arranged in adjacent orders in the
may visualize two related data tables (e.g., information of        matrix based on a reordering algorithm. Select → Append
employees and their companies) and are coordinated in              appends the new selection instead of overwriting the old
an MCV system for association analysis. Moreover, users            for further exploration and comparison, which is used in
can specify data in one view and visualize their patterns          the decision-making of alternatives [36].
in another view after applying mining algorithms, thus                 Set → ∗. Since Set is mainly used to configure views,
requiring the data transformation between the two views for        it rarely triggers coordination. In our survey, Set commonly
extracting features. To support these scenarios, we leverage       works with itself (Set → Set) to update the input dataset in
data transformations to connect interactions. Specifically,        the coordinated view in correspondence to the dataset set by
these transformations handle the inconsistency between in-         users in the origin view. Another case is Set → Reconfigure.
teractions and transmit data from the user-trigger interac-        For example, a bar chart visualizes attribute weights of a
tions to the coordinated views; examples include mapping           data table, where changing the length of bars modifies the
the selected points in scatterplots to the nodes in node-          attribute weights and thus sorts the table [37].
link graphs, formatting different data structures, joining two         Navigate → ∗. The target of Navigate is the scales of
related data tables, and leveraging mining algorithms.             visualizations, which means that Navigate-triggered coor-
                                                                   dinations mainly focus on the scales or internal data in
                                                                   coordinated views. For the former, one common example
5.2   Component Compositions                                       is Navigate → Navigate, where the scales are shared in
The basic compositions comprise one user-triggered in-             coordinated views to maintain synchronicity with the view
teraction in one view and one coordination-triggered               in which users pan and zoom (Fig. 7(B)). This composition
interaction in another view, along with potential data             is commonly used in multifaceted analysis, which visualizes
transformations between the two interactions. We denote            the same dataset in multiple views, such as the scatter-
this one-to-one type of composition as interaction →               plot matrix and small multiples. For the latter, one case is
(transf ormation) → interaction. Therefore, the universal          Navigate → Select/Filter, where the data in the navigated
set covering all compositions can be a 7 × 7 matrix. Since         area in a view will be highlighted/filtered in another view
our goal is to reveal the mechanism of the component               (Fig. 7(C)). This composition is widely used in the bottom-
composition and inform the understanding of coordination,          up analysis. For example, in a large network, the nodes and
we discuss the representative one-to-one compositions with         links in the navigated area showing the details of its struc-
high frequency in the survey (Fig. 3(B)). The discussion is        ture are highlighted/filtered in the overview heatmap [38].
organized from the interactions triggered by users.                    Filter → ∗. Filter-triggered coordinations are usually
    Select → ∗. Select is the most widely used user-triggered      used to discard uninteresting elements in multiple views to
interaction, which allows specifying a subset of data as           maintain their consistency, or discover patterns of these ele-
a step toward further analysis. In our survey, Select can          ments. For the former scenario, the filtered elements trigger
trigger six categories of interactions, except Encode in the       the corresponding filtering of the corresponding elements
coordinated views. Specifically, the selection can be used to      in other views (Filter → Filter). The latter one involves the
highlight the related data (Select → Select in Fig. 1) or filter   Filter → Append coordination, where the elements filtered
the unrelated data (Select → Filter in Fig. 6(B)) in another       by users are continuously appended to a view [39] to reveal
view. These coordinations may involve data transforma-             users’ implicit preference.
tion to handle data transmission. For example, visualizing             Encode → ∗. Encode focuses on visual channels. There-
two datasets in two views may require a join operation             fore, it is mainly composed with itself (Encode → Encode) to
on the two datasets to find associations. Moreover, the            keep multiple views consistent in the visual encoding (e.g.,
IEEE TRANSACTIONS ON VISUALIZATION AND COMPUTER GRAPHICS, VOL. XX, NO. X, XX 2021                                                      7

the same point size of scatterplots in Fig. 8).                                                    TABLE 1
    Reconfigure → ∗. Reconfigure specifies the spatial ar-                          Synonym list for interactions in Nebula.
rangements of interest, which can be used in the subsequent                    Type                       Synonyms
analysis to discover valuable information masked behind                    select          highlight
them. For example, reordering usually contains implied user                navigate        pan, zoom, scroll
                                                                           reconfigure     rearrange, arrange, organize, sort, align
preference, which can be applied to infer and highlight the                set             modify, change, replace
data of interest (Reconfigure → Select) [35] and compute and               append          add
visualize the weights of dimensions (Reconfigure → Set) [37]
supported by data transformations. Moreover, despite the
absence of examples of Reconfigure → Reconfigure in our           symmetric, in which selecting points in any scatterplot can
survey, the coordination can be useful to keep consistency        highlight the corresponding selections in other scatterplots.
in spatial arrangements between multiple views (e.g., the
attribute order between stacked bar chart and LineUp [34]
in Fig. 9).
                                                                  6     N EBULA
    Append → ∗. The survey does not find instances that           In this section, we introduce Nebula, a coordinating gram-
use Append as the user-triggered interaction. However, we         mar with a generalized MCV architecture. The Nebula
assume that Append can at least trigger itself (Append →          grammar is motivated by two goals: (1) expressiveness: to
Append) to input streaming data in multiple views.                enable expressive specification of various coordinations and
                                                                  (2) usability: to do so with concise and accessible primitives
                                                                  to facilitate efficient coordination specification. To achieve
5.3   Coordination Structures                                     the goals, Nebula is grounded in the demonstration-driven
Based on the basic components and their compositions, we          coordination framework and provides a natural language
elaborate two types of coordination structures found in our       grammar based on structured templates. Moreover, the Neb-
literature review: asymmetric and symmetric structures.           ula architecture reduces the technical burden to integrate
    Asymmetric Structure is a unidirectional coordination         external toolkits; thus users can coordinate visualizations
structure, in which all links between interactions and data       from different toolkits using the Nebula grammar. Fig. 5
transformations are unidirectional. This structure is a su-       illustrates the grammar, architecture, and workflow.
perset of one-to-one interaction composition and is ex-
tended to a larger scope including one-to-many, many-to-          6.1    Grammar
one, and many-to-many structures. The one-to-many struc-
                                                                  A Nebula specification is a natural language (NL) sentence
ture can be defined as interaction → (transf ormation) →
                                                                  based on structured templates, which describe coordination
interactions, which means that a user-triggered interaction
                                                                  by demonstration. Informed by our coordination frame-
can cause multiple coordination-triggered interactions. A
                                                                  work, the specification is a three-tuple:
typical example is that an interaction performed in the
overview view of a visual analytics system can elicit mul-            coordination := (origin, transf ormation, destination)
tiple coordination-triggered interactions in detailed views
and cause updates simultaneously. The many-to-one struc-          The origin and destination components describe the user-
ture can be defined as interactions → transf ormation →           and coordination-triggered interactions, respectively, while
interaction, which means users should perform multiple            the transformation component describes the potential data
interactions to cause a coordination-triggered interaction.       transformations between origin and destination. We explain
The process must involve data transformations that receive        each component in detail.
multiple inputs from user-triggered interactions and trans-
form into one output to the coordinated view (e.g., Fig. 10).     6.1.1 Origin
The many-to-many structure is defined as interactions →           The origin component specifies the users’ interactions in the
transf ormation → interactions, which can be a compo-             view and is defined as a three-tuple structured template:
sition of one-to-many and many-to-one structures. In ad-
                                                                               horigini → htypei htargeti in hviewi
dition, all these aforementioned unidirectional asymmetric
structures can be further nested and composed to generate         The type field identifies the interaction type from the seven
complex structures.                                               interaction categories, and the target field specifies the target
    Symmetric Structure is a special directed complete            manipulated by the interaction (Section 5.1.1). The view field
graph structure in coordination. All interactions are iden-       defines which view is interacted with. Examples of these
tical in this structure, and each pair of interactions is con-    specifications include “select items in scatterplot1” (Fig. 6(A))
nected by a bidirectional link. Thus, this structure can be       and “navigate scales in map” (Fig. 7(B)).
regarded as symmetric because interactions can trigger or             To support the flexible creation of coordination, Nebula
be triggered by others. Such coordination is widely used in       provides synonyms for users to specify the interaction type.
the scatterplot matrix and small multiples that visualize one     Table 1 shows a synonym list that Nebula supports for each
dataset in multiple views in the same visualization type and      interaction category. For example, using Pan, Zoom, or Scroll
allow comparison and discovery of associations between            to replace Navigate further specifies the interaction represen-
data dimensions or subsets. For example, the scatterplot          tations and presents an intuitive statement to users. These
matrix in Fig. 1 encodes each pair of dimensions in x and         synonyms are summarized based on common colloquial de-
y channels. The selecting and highlighting coordination are       scriptions of coordination in our literature review. It is noted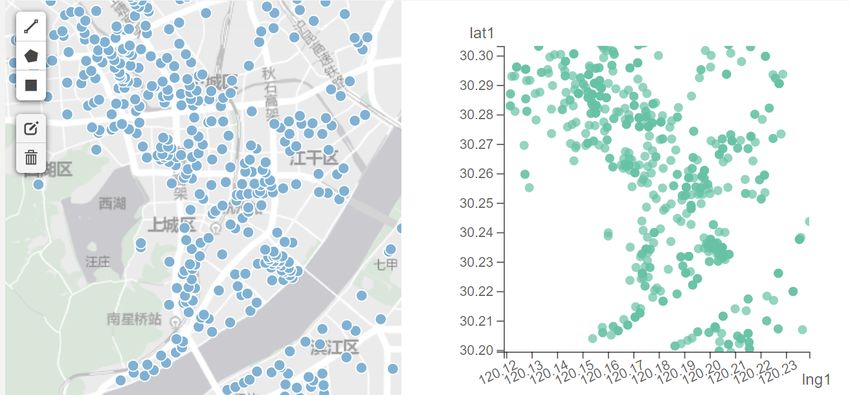
IEEE TRANSACTIONS ON VISUALIZATION AND COMPUTER GRAPHICS, VOL. XX, NO. X, XX 2021                                                                              8

                                   A. Grammar                                                B. Views and Data Transformations
    " 1 Select items in scatterplot1 and scatterplot2,
      2 then intersect, 3 then highlight items in scatterplot3."
                                                                                                                 Reactive Layer @ View
                                                                                                          Streaming Data 1      Streaming Data 2         ...
               Origin                                                                                          type : select       type : navigate       ...
                     select    items in scatterplot1                          search                         target : items      target : scales         ...
                                                                                                            values : [ ... ]    values : [ ... ]         ...
                     select    items in scatterplot2
 parse                type     target      view                                                             Rendering                 Interaction
                                                                                                               API                        API
               Transformation
                                                                                                                    Original View #1
                 intersect with $1 and $2
                   name         parameter                                                                           dataset selection
                                                                                                                    color scales ...
                                                                                              ...
               Destination
                     select    items in scatterplot3 with $1                                              Reactive Layer @ Transformation
                                                                                            intersect
                      type     target      view        parameter
                                                                                                               Streaming                Streaming
                                                                                             subset           Parameters                 Results
                                                                                  link                       values : [ ... ]         values : [ ... ]
                              C. Coordination
                                                                                             merge
                 1                  1
        #1                                #2                      #3
                                                                                              filter
                      #1      #2                         3                     render
                                                                                               ...                  Transformation #1
                           2 intersect

                                                                   D. MCVs

                                                                                                                                               3
                                           1
                       1

                                                              before                                                                               after

Fig. 5. Nebula architecture and workflow. (A) Original Nebula specifications are segmented and parsed, where tokens are labeled in color, missing
fields are completed, and synonyms are replaced. (B) Views and data transformations are searched, and streaming data are located according to
the tokens in the specifications. (C) Streaming data are linked between views and data transformations to construct coordinations. (D) MCVs are
finally rendered and can receive users’ interactions.

that these synonyms are only for an intuitive manner to                   with $1 and $2” calls a built-in data transformation inter-
specify coordination and have no substantial difference. All              sect(set1, set2) with the parameters set1 = $1 and set2 = $2.
these synonyms will be parsed into the original interaction               Particularly, Nebula incorporates the “$” keyword to map
category at runtime, which also means that extending the                  the data from origin interactions via their order number. The
list is easy and inexpensive.                                             idea is borrowed from Shell, a concise scripting language
                                                                          in Unix/Linux systems that codes parameters with default
6.1.2   Transformation                                                    rules. Therefore, in this example, “$1” corresponds to the
                                                                          first interaction in origin, namely “select items in scatterplot1”.
The transformation specification consists of a three-tuple                Similarly, “$2” denotes the second interaction, namely “se-
structured template to handle the condition if data from                  lect items in scatterplot2”. Moreover, to alleviate the technical
origin and destination discord:                                           burden and produce a readable sentence, users need not
                                                                          specify parameters in Nebula (Fig. 5(A-2)), and the Nebula
htransf ormi → when htriggeri, hnamei with hparameteri                    parser will auto-complete the parameter specification (e.g.,
                                                                          “$1 and $2” in the above example).
The trigger field is optional and defines a conditional state-
ment when the data transformation would be executed (e.g.,
click a button). The name field registers the name of the                 6.1.3    Destination
data transformation in Nebula, such as intersection and k-
means. The parameters field specifies the data sources of the             The destination component describes the interactions trig-
transformation based on an ordered assignment rule, which                 gered by coordination and is defined in a four-tuple form:
are mainly from pre-loaded datasets, literal constants, and
interactions in origin. For example, in Fig. 5(A), “intersect             hdestinationi → htypei htargeti in hviewi with hparameteri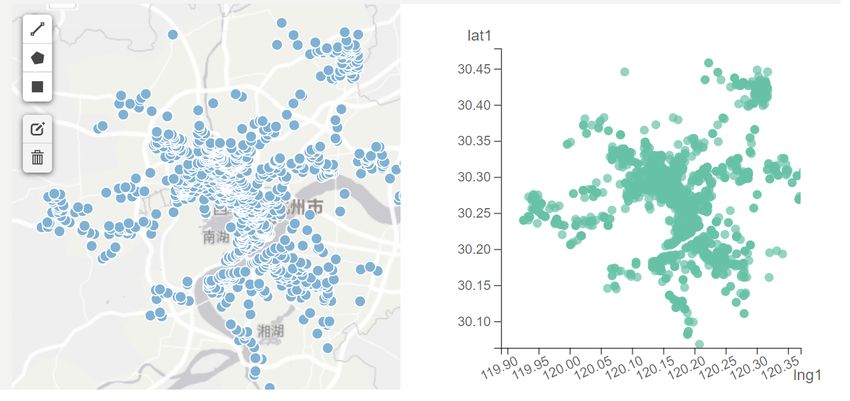
IEEE TRANSACTIONS ON VISUALIZATION AND COMPUTER GRAPHICS, VOL. XX, NO. X, XX 2021                                                    9

The type, target, and view fields are the same as those in            updating the encapsulated view. For example, streaming
origin. The parameter field is similar to transformation, which       data 1 in Fig. 5(B) represents the Select interaction. The items
specifies the parameter to trigger this interaction. Particu-         selected by users will be stored in the value of streaming
larly, users can use “$” plus order number to specify the             data 1. Conversely, modifying the value of streaming data
results of the previous component in parameters. The rules            1 will highlight the corresponding items in view as if
are that if data transformation exists, then “$” corresponds          they were selected. Such architecture allows the integra-
to the output of the data transformation; otherwise, it maps          tion of Nebula with other libraries easily by reusing their
the data from origin interactions. For example, in Fig. 5(A),         application programming interfaces (APIs). For example,
“$1” in destination refers to the output of the data transfor-        view.addDataListener in Vega-Lite can be used to mod-
mation intersect, which means that the intersected items will         ify the streaming data upon interactions, and view.data
be highlighted in scatterplot3. For convenience, “$1” is set          and view.runAsync help update the views upon changes
as the parameter by default.                                          in the streaming data. Reusing the existing APIs facilitates
                                                                      efficient adaption and provides compatibility with the views
6.1.4 Walkthrough                                                     from external toolkits. Similarly, the parameters and results
To demonstrate the cooperation of the three components                of data transformations can also be modeled as streaming
(i.e., origin, transformation, and destination), Fig. 5 presents      data to establish reactivity.
an example of a walkthrough to the entire process from                    Thereafter, coordinations can be described as the stream-
the grammar specification to the coordination workflow.               ing dataflow graphs constructed by parsing Nebula spec-
In this example, the points in scatterplot3 will be high-             ifications and connecting the streaming data in the re-
lighted if they fall within both selections of scatterplot1           active layers of different views and data transformations
and scatterplot2. First, to compose a complete coordina-              (Fig. 5(C)). The links between the streaming data propagate
tion specification, Nebula provides the keyword “then” to             data mutations, maintaining the synchronization of inter-
connect the three components (Fig. 5(A)). Then, Nebula                action responses between the views to establish coordina-
segments and parses this specification. Each token is labeled         tion. Moreover, these links enable data transformations to
in color, missing fields are auto-completed, and synonyms             directly process interaction data and control view rendering.
are replaced following Table 1. Specifically, the specification           Nebula users can conveniently create MCVs based on
“select items in scatterplot1 and scatterplot2” in origin is parsed   such architecture. First, users can author visualizations with
as two individual interaction specifications. The parameters          different libraries (e.g., D3 , Vega, and Vega-Lite) and arrange
of the data transformation intersect are completed following          these visualizations in a desired layout. Next, the reactive
the default rule. The parameter in destination is also auto-          layers that encapsulate the visualizations and data transfor-
completed, while the synonym Highlight is replaced by                 mations are created conveniently with the APIs of Nebula.
Select. As a result, an asymmetric two-to-one coordination            For the data transformations that are not programmed in
structure with a data transformation is constructed, which            JavaScript, Nebula provides a browser/server API to allow
will be rendered in subsequent steps (Fig. 5(B–D)).                   these data transformations to receive and send stream-
     In addition, to support rapid creation of symmetric              ing data, including parameters and results, asynchronously
coordination (Section 5.3), Nebula provides pronouns any              based on HTTP. Finally, users can specify coordinations with
and other as syntactic sugar referring to a set of views. For         the Nebula grammar and implement MCVs based on the
example, in Fig. 1, any refers to any scatterplot in the scatter-     encapsulated visualizations and data transformations.
plot matrix, while other refers to the remaining scatterplots.
Such coordination specification allows users to select points
in any scatterplot, and the corresponding points in other             7   P ROOF - OF - CONCEPT IMPLEMENTATION
scatterplots will be highlighted.                                     Nebula is an open-source toolkit implemented in JavaScript
                                                                      and is available at https://nebula-vis.github.io/. The toolkit
6.2   Architecture                                                    comprises three major parts: parser, integrator, and gener-
                                                                      ator. The parser implements Fig. 5(A) and can parse the
To coordinate the visualizations from external toolkits, Neb-
                                                                      Nebula specifications. The integrator implements Fig. 5(B)
ula combines the Model-View-ViewModel (MVVM) software
                                                                      and provides APIs to encapsulate reactive layers for views
architectural pattern and the streaming dataflow architec-
                                                                      and data transformations, leveraging their existing APIs.
ture [3], decoupling coordination construction from interac-
                                                                      Finally, the generator links streaming data in reactive layers
tive visualization design with reactive layers.
                                                                      and renders MCVs (Fig. 5(C) and (D)) based on the results
    A reactive layer (Fig. 5(B)) serves as a tailored view
                                                                      of the parser and the integrator.
model connecting a view or a data transformation with
the streaming data (as the models in MVVM), which can
be communicated with other views and data transforma-
                                                                      8   E VALUATION
tions. In the reactive layer that encapsulates a view, each
interaction is modeled as a streaming datum identified by             Nebula aims to balance expressiveness and usability to coor-
its type chosen from seven interaction categories and its             dinate visualizations. This section demonstrates the realiza-
target data field. When an interaction is received, the value         tion of the goal. To evaluate expressiveness, we showcase a
of the corresponding streaming datum will be modified.                variety of examples that cover our coordination framework.
Moreover, changing the values of a streaming datum is                 To assess usability, we analyze Nebula using the Cognitive
equivalent to triggering the corresponding interaction and            Dimensions of Notation framework [5].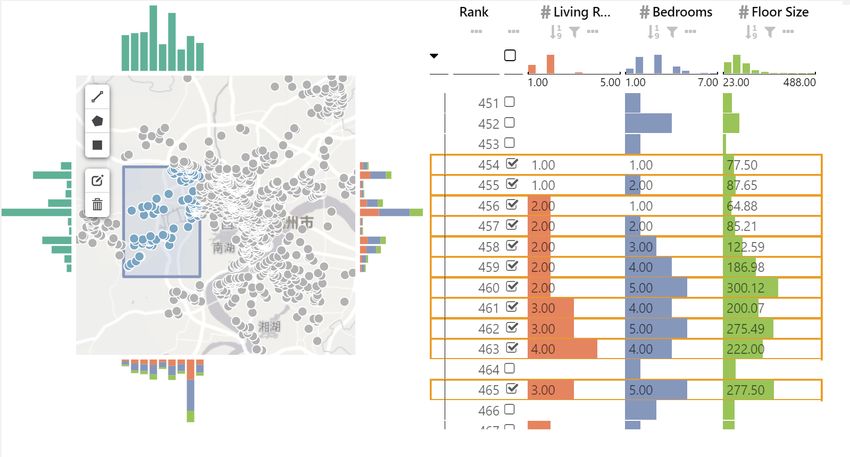
IEEE TRANSACTIONS ON VISUALIZATION AND COMPUTER GRAPHICS, VOL. XX, NO. X, XX 2021                                                                                  10

A                                                        B                                                       C

                                                                                 1                                                   1                   2
                       1

                                             before                                                     before                                               before

                                         2                                                         2

                                               after                                                    after                                                  after

      " 1 Select items in scatterplot1,                       " 1 Select items in scatterplot1,                      " 1 Select intervals in scatterplot1,
        2 then set dataset in scatterplot2."                    2 then filter items in scatterplot2."                  2 then navigate scales in scatterplot2."

Fig. 6. Examples of Select → ∗ coordinations in two scatterplots, where the selection of the first scatterplot will (A) modify the dataset, (B) be filtered
out from the dataset, and (C) cause the navigation to the area in the second scatterplot.

A                                                        B                                                       C

                   1                         2                                                                                   1
                                                                        1                           2
                                                                                                                                                        2

                                             before                                                     before                                               before

                                                   3

                                                                                                                                                        3

                                                 after                                                   after                                                 after

       " 1 Select items in scatterplot,                                                                               " 1 Navigate scales in map,
         2 then item2scales,
                                                             " 1 Navigate scales in map,                                2 then scales2items,
         3 then navigate scales in map."                       2 then navigate scales in scatterplot."                  3 then select items in scatterplot."

Fig. 7. Examples of Navigate-related coordinations in a scatterplot and a map. (A) An example of Select → Navigate coordination, where the
map will be navigated to the area according to the selected points in the scatterplot. (B) An example of Navigate → Navigate coordination, where
panning and zooming in the map will cause the corresponding panning and zooming in the scatterplot. (C) An example of Navigate → Select
coordination, where the points in the scatterplot will be highlighted if they fall in the area navigated in map.

8.1    Examples                                                                      handle complicated visual analytics tasks, we reproduce the
                                                                                     core module of SRVis [40], a real-world MCVs for multidi-
To demonstrate the expressiveness of Nebula, we present a                            mensional geospatial data (Fig. 11). We select SRVis for its
selected gallery of common and typical coordination exam-                            complexity (most of the coordinations involve at least three
ples based on our literature review.                                                 visualizations) and familiarity with the authors of this paper
    Figs. 6–10 cover all seven categories of interactions in                         (three authors participated in its design and development).
Nebula. Specifically, Fig. 6 presents the composition of Select                      The prototype comprises six visualizations: a map showing
with different interactions (Set, Filter, and Navigate) to han-                      the geospatial details, a LineUp [34] ranking multidimen-
dle various coordinating tasks. Fig. 7 illustrates a set of Navi-                    sional data, and four histograms around the map showing
gated-related coordinations. Figs. 8 and 9 showcase examples                         the multidimensional statistical distribution along the lati-
with Encode and Reconfigure, respectively. Moreover, Fig. 10                         tude and longitude. We specify five coordinations to mine
presents a many-to-one coordination structure, where the                             patterns between geospatial and multidimensional features.
data of four Set interactions serve as the parameters of a data                      Specifically, the points of interest selected in the map are
transformation, and the results of the data transformation                           fed to the datasets of the four histograms to discover their
are appended to a list view for further comparison and                               distributions and also highlighted in the LineUp to show
analysis. Fig. 1 shows a symmetric coordination example.                             their details of dimensions (Fig. 11(A)). In addition, the
    To demonstrate how multiple coordinations cooperate to                           x scales of the map, encoding the longitude of the data,
IEEE TRANSACTIONS ON VISUALIZATION AND COMPUTER GRAPHICS, VOL. XX, NO. X, XX 2021 11
A B
" 1 Encode size in scatterplot1, 2.53 6.59
2 then encode size in scatterplot2." 1 10 1 10
1
2
before after
Fig. 8. Example of Encode → Encode coordination, where modifying the value of the slider will change the point size in both scatterplots.
A B
1
" 1 Reconfigure order in lineup,
2 then reconfigure order in stacked-barchart."
2
2
before after
Fig. 9. Example of Reconfigure → Reconfigure coordination, where modifying the attribute order of the dataset in LineUp [34] by dragging and
dropping will also modify the stacking order of attributes in the stacked bar chart.
reduction clustering
PCA k-means 6 PCA + k-means
PCA 2 k-means 3
" 1 Set dataset in scatterplot1, TSNE DBSCAN
2 set value in select-reduction, LLE MeanShift
3 set value in select-clustering, parameters
4 set value in input-parameters, 6 PCA + DBSCAN
5 then when button clicked, reduction_cluster, {
"n_clusters": 4,
6 then append dataset in list-view."
"n_components": 2
} 4 6 PCA + MeanShift
run 5 5 5
Fig. 10. Example of Set → Append coordination, where the dataset visualized in the scatterplot will be clustered using different reduction and
clustering algorithms and various parameters to compare their performances. The results are appended in a list view, where each result is visualized
in a scatterplot. A button is set as the trigger to control the execution of the coordination.
are bound up with the top and the bottom histograms dependencies (the visibility of relationships), inspiring designers
(Fig. 11(B)), similar for the y scales (latitude) of the map with to consider the nature of notation from the perspective of
the left and the right histograms (Fig. 11(C)). Moreover, the cognitive psychology without evaluating the entire system.
visible points in this navigated area serve as the dataset of Below, we briefly discuss the performance of Nebula
the LineUp to present their details (Fig. 11(D)). Therefore, using a relevant subset (9/14) of the above cognitive dimen-
navigating the viewpoint in the map will update all other sions [5]. Due to the lack of visualization tools dedicated
views and synchronize their data accordingly (Fig. 11(B), to coordination, we do not directly compare Nebula with
(C), and (D)). Finally, to support a consistent analysis on other tools. Instead, we elaborate the distinctions between
data dimensions, reconfiguring the orders in the LineUp will the traditional mechanism of existing tools for constructing
update those in the stacked histograms (Fig. 11(E)). coordination (i.e., configuring interactions and composing
visualization building blocks) and the mechanism of Nebula
(i.e., composing seven categories of interactions). The rest of
8.2 Cognitive Dimensions of Notation the dimensions is beyond the goal of Nebula and will be
Based on our survey and framework, we design Nebula to considered in future work.
integrate coordination notations and specifications, consid- Closeness of mapping (closeness of representation to domain).
ering users’ mental model. To assess the design intuition Nebula is motivated by the need for a close mapping be-
and usability of Nebula, we conduct an analysis using the tween coordination and its specification. We analyze how
Cognitive Dimensions of Notation framework [5], which is authors describe the coordination and design the notations
a widely adopted method in the visualization community correspondingly. As such, the design allows users to easily
to evaluate toolkits and systems, such as Protovis [27], construct coordination in a similar way they describe coor-
Vega [32], PGoG [30], and Lyra 2 [24]. The framework dination. Using this grammar, users can focus on the coordi-
provides a heuristic inspection method with 14 cognitive nation design, including choosing interactions or adjusting
dimensions to assess the effectiveness of notation sys- data transformations, rather than getting lost in tedious
tems (e.g., programming languages and visual interfaces) configurations of basic visualization and interaction details.
from different perspectives. These dimensions describe the Hidden dependencies (important links between entities are
generic properties of notation by names, such as closeness not visible). Nebula provides the parameter fields in trans-
of mapping (closeness of representation to domain) and hidden formation and destination specifications that explicitly revealYou can also read