A Review of the Population and Conservation Status of British Mammals: Technical Summary - Natural England Joint Publication JP025
←
→
Page content transcription
If your browser does not render page correctly, please read the page content below

Natural England Joint Publication JP025

A Review of the Population
and Conservation Status
of British Mammals:
Technical Summary

First published June 2018

www.gov.uk/natural-england
Authors
Mathews F., The Mammal Society & University of Sussex

Kubasiewicz L. M., The Mammal Society

Gurnell J., Queen Mary University of London

Harrower C. A., Centre for Ecology and Hydrology

McDonald R. A., Environment and Sustainability Institute, University of Exeter

Shore R. F., NERC Centre for Ecology & Hydrology

Further information
Natural England evidence can be downloaded from our Access to Evidence Catalogue.
For more information about Natural England and our work see Gov.UK. For any queries
contact the Natural England Enquiry Service on 0300 060 3900 or e-mail
enquiries@naturalengland.org.uk

Copyright
This report is published by Natural England under the Open Government Licence - OGLv3.0 for public
sector information. You are encouraged to use, and reuse, information subject to certain conditions.
For details of the licence visit Copyright. Natural England photographs are only available for non-
commercial purposes. If any other information such as maps or data cannot be used commercially
this will be made clear within the report.
                                   ISBN 978-1-78354-485-1
                            © Natural England and other parties 2018
A Review of the Population and
         Conservation Status of British
                  Mammals:
              Technical Summary

         Mathews F.,1 Kubasiewicz L. M.,2 Gurnell J.,3 Harrower C. A.,4
                        McDonald R. A.,5 Shore R. F.6

       A report by the Mammal Society under contract to Natural
       England, Natural Resources Wales and Scottish Natural
                             Heritage

1
    The Mammal Society & University of Sussex, John Maynard Smith Building, Falmer, BN1 9QG.
2
    The Mammal Society, 18 St John’s Church Road, London, E9 6EJ.
3
    Queen Mary University of London, Mile End Road, London, E1 4NS.
4
    Centre for Ecology and Hydrology, MacLean Building, Crowmarsh Gifford, Wallingford, OX10 8BB.
5
 Environment and Sustainability Institute, University of Exeter, Penryn Campus, Penryn, Cornwall,
TR10 9FE.
6
 NERC Centre for Ecology & Hydrology, Lancaster Environment Centre, Library Avenue, Bailrigg,
Lancaster, LA1 4AP.

Author for correspondence: Fiona Mathews F.mathews@sussex.ac.uk; chair@themammalsociety.org

This publication should be cited as:
Mathews F, Kubasiewicz LM, Gurnell J, Harrower CA, McDonald RA, Shore RF. (2018) A
Review of the Population and Conservation Status of British Mammals: Technical Summary.
A report by the Mammal Society under contract to Natural England, Natural Resources
Wales and Scottish Natural Heritage. Natural England, Peterborough.
Executive summary
1.   We present the first comprehensive review of the status of British mammal populations
     for over 20 years. The population size, range size, temporal trends and future prospects
     of Britain’s 58 terrestrial mammals are assessed. Island races and feral mammals are
     excluded from the main review, but are considered in the appendix.

2.   Britain has 44 native species that arrived before the formation of the English Channel.
     Previously extinct in the wild, the beaver has been reintroduced into Scotland and
     England in the last decade. The wild boar, also previously extinct, has been the subject
     of several illegal releases over recent years: the provenance of current populations is
     unknown. There are 7 species that, although introduced by human activities, are
     considered naturalised and have formed part of Britain’s fauna since at least Roman
     times. The remaining 7 species are more recent introductions.

3.   The geographical ranges of 18 species have increased since 1995; 4 have declined;
     and 22 have remained stable. A lack of data prevented assessment of the remaining 14
     species.

4.   Population sizes have increased since 1995 in 15 species; 9 have declined; and 4 have
     remained stable. A lack of data prevented assessment of the remaining 30 species.

5.   All of the species recently introduced to Britain show an increase in geographical range
     except the brown rat, which is stable, and the American mink, where there are
     differences between countries. Additionally, all show an increase in population size
     except the brown rat which appears — on the basis of very poor data — to be stable,
     and the American mink which appears to be in decline. There are important data
     deficiencies for all introduced species that need to be addressed urgently.

6.   Among native and naturalised species where change could be assessed with
     reasonable confidence, there have been increases in the geographical range of the
     following animals:

        •   Otter, pine marten and polecat.
        •   Red, fallow and roe deer.
        •   Greater and lesser horseshoe bat.
        •   Beaver and wild boar (both of which have become established since the last
            review, following releases from unknown sources).
Population sizes have increased for the following species:

        •   Otter, pine marten, polecat and badger.
        •   Red and roe deer.
        •   Greater and lesser horseshoe bat.
        •   Beaver and wild boar.

7.   Among native and naturalised species where change could be assessed with
     reasonable confidence, there have been decreases in the range of the following
     species:

        •   Red squirrel.
        •   Black rat.
        •   Wildcat.
        •   Grey long-eared bat.

8.   Population sizes have declined for the following species:

        •   Hedgehog.
        •   Rabbit.
        •   Red squirrel.
        •   Hazel dormouse.
        •   Orkney vole.
        •   Water vole.
        •   Black rat.
        •   Wildcat.

9.   Formally approved Regional Red List assessments were conducted for native species in
     Great Britain according to the International Union for Conservation of Nature (IUCN)
     criteria. Approved assessments were also made for the Orkney vole, which is
     naturalised, because it is officially recognised as an island sub-species; and for the
     lesser white-toothed shrew because of uncertainty about whether it is naturalised or
     native. The assessments placed 26 species in the Least Concern category (meaning
     that the risk of extinction in the near future is low).Ten native species, plus the Orkney
     vole, were classified as Threatened (meaning that they face a high risk of extinction).
     Four native species, plus the lesser white-toothed shrew, were classified as Near
     Threatened (meaning that they were close to qualifying as Threatened, or are likely to
     qualify in the near future). Insufficient evidence was available to allow assessment of the
other 4 species.

10. All species under review lacked some of the data required for robust estimation of
    population size. The most common issue was that no information was available on the
    percentage of potentially suitable habitat within the range that was actually occupied. In
    these cases, 100% occupancy was assumed, which will usually have led to
    overestimated population sizes. For example, the Bechstein’s bat was assumed to be
    present in all deciduous woodland, and the red deer in all woodland, within their
    geographical range.

    Robust population density data were lacking for all bats, with the exception of the
    greater and the lesser horseshoe. There were insufficient data to permit population size
    estimation at all for the whiskered, Brandt’s and Alcathoe bats (cryptic species),
    barbastelle bat, Leisler’s bat, and the potentially migratory Nathusius’ pipistrelle bat.
    One other bat, the noctule, also had a score of zero for population estimate reliability.
    For this species, estimates could be computed, but they were based on very restricted
    data, resulting in correspondingly large confidence intervals.

    Reliability scores of zero were also assigned to the population estimates for the water
    shrew, lesser white-toothed shrew, harvest mouse, and weasel, and it was not possible
    to compute a population estimate at all for the Orkney vole. Overall, 40% of the non-bat
    species, including all of the shrews, had very poor reliability scores (
Contents
  Executive summary
  Contents
  Methods ............................................................................................................................... 1
       Overall approach ................................................................................................................. 1
       Literature search .................................................................................................................. 2
       Habitat data ........................................................................................................................ 2
       Species status ...................................................................................................................... 3
       Species’ distribution maps ..................................................................................................... 4
       Population size assessment .................................................................................................... 5
       Reliability assessment ........................................................................................................... 6
       Changes through time ........................................................................................................... 7
       Future prospects .................................................................................................................. 7
       Species-specific methods ....................................................................................................... 7

  ERINACEOMORPHA
     Hedgehog Erinaceus europaeus .............................................................................................. 8
  SORICOMORPHA
     European Mole Talpa europaea ............................................................................................... 9
     Common Shrew Sorex araneus ............................................................................................. 10
     Pygmy shrew Sorex minutus .................................................................................................. 11
     Water shrew Neomys fodiens ................................................................................................. 12
     Lesser white-toothed shrew Crocidura suaveolens .............................................................. 13
  LAGOMORPHA
     European rabbit Oryctolagus cuniculus ................................................................................. 14
     Brown hare Lepus europaeus ................................................................................................ 15
     Mountain hare Lepus timidus ................................................................................................. 16
  RODENTIA
     Red Squirrel Sciurus vulgaris ................................................................................................. 17
     Grey squirrel Sciurus carolinensis .......................................................................................... 18
     Eurasian beaver Castor fiber ................................................................................................. 19
     Hazel dormouse Muscardinus avellanarius ............................................................................ 20
     Edible dormouse Glis glis ...................................................................................................... 21
     Bank vole Myodes glareolus ................................................................................................... 22
     Field vole Microtus agrestis .................................................................................................... 23
     Orkney vole Microtus arvalis orcadensis ................................................................................ 24
     Water vole Arvicola amphibius ............................................................................................... 25
     Harvest mouse Micromys minutus ......................................................................................... 26
     Wood mouse Apodemus sylvaticus ........................................................................................ 27
     Yellow-necked mouse Apodemus flavicollis .......................................................................... 28
     House mouse Mus musculus ................................................................................................. 29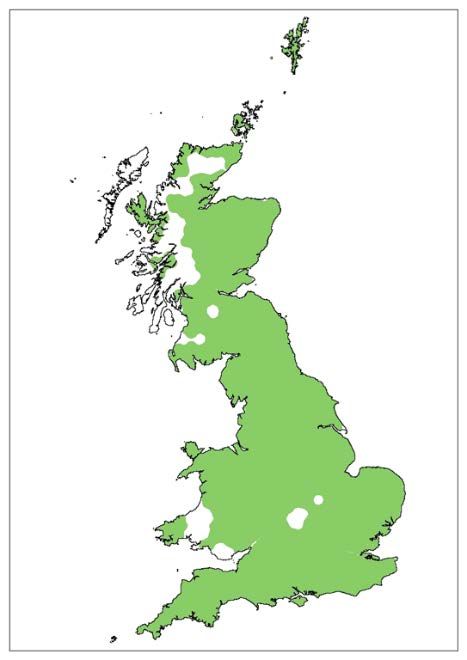
Brown rat Rattus norvegicus ..................................................................................................... 30
   Black rat Rattus rattus .............................................................................................................. 31
CARNIVORA
   Wildcat Felis silvetris .............................................................................................................. 32
   Red fox Vulpes vulpes ............................................................................................................ 33
   Badger Meles meles ............................................................................................................... 34
   Otter Lutra lutra ....................................................................................................................... 35
   Pine marten Martes martes .................................................................................................... 36
   Stoat Mustela erminea ............................................................................................................ 37
   Weasel Mustela nivalis ............................................................................................................ 38
   Polecat Mustela putorius ........................................................................................................ 39
   Mink Neovision vision ............................................................................................................. 40
ARTIODACTYLA
   Wild boar Sus scrofa .............................................................................................................. 41
   Red deer Cervus elaphus ....................................................................................................... 42
   Sika deer Cervus Nippon ........................................................................................................ 43
   Fallow deer Dama dama ........................................................................................................ 44
   Roe deer Capreolus capreolus ............................................................................................... 45
   Chinese water deer Hydropotes inermis ................................................................................ 46
   Reeves’ muntjac Muntiacus reevesi ....................................................................................... 47
CHIROPTERA
   Greater horseshoe bat Rhinolophus ferrumequinum ............................................................. 48
   Lesser horseshoe bat Rhinolophus hipposideros .................................................................. 49
   Alcathoe bat Myotis alcathoe ................................................................................................. 50
   Whiskered bat Myotis mystacinus .......................................................................................... 51
   Brandt’s bat Myotis brandtii .................................................................................................... 52
   Bechstein’s bat Myotis bechsteinii ......................................................................................... 53
   Daubenton’s bat Myotis daubentonii ...................................................................................... 54
   Greater mouse-eared bat Myotis myotis ................................................................................ 55
   Natterer’s bat Myotis nattereri ................................................................................................ 56
   Serotine bat Eptesicus serotinus ............................................................................................ 57
   Leisler’s bat Nyctalus leisleri .................................................................................................. 58
   Noctule bat Nyctalus noctula .................................................................................................. 59
   Common pipistrelle bat Pipistrellus pipistrellus ..................................................................... 60
   Soprano pipistrelle bat Pipistrellus pygmaeus ...................................................................... 61
   Nathusius’ pipistrelle bat Pipistrellus nathusii ....................................................................... 62
   Barbastelle bat Barbastella barbastellus ................................................................................ 63
   Brown long-eared bat Plecotus auritus ................................................................................. 64
   Grey long-eared bat Plecotus austriacus ............................................................................... 65

  Research priorities ..................................................................................................................................... 66
  References .................................................................................................................................................... 71

Methods
Overall approach
The objective of the review was to produce the most accurate assessment possible of
population size, geographical range, and conservation trends since 1995. The project
therefore drew on both published and unpublished literature that has appeared since that
date; or, where insufficient information was available, expert opinion.

The general approach for estimating population size was to multiply habitat-specific density
estimates by the extent of these habitats within the geographical range. Where multiple
estimates were available, the median of these values was used, and 95% confidence
intervals were created. Habitats were defined following the classifications in the Land Cover
Map 2007 (Morton et al., 2011), because this dataset provided the best estimates of habit
availability at a national scale. The Countryside Survey was used to derive information on
hedgerows (Scott, 2007, Carey et al., 2008), and the lengths of riparian habitats were
derived from the previous review (Harris et al., 1995). The general approach for estimating
population size could not be applied to most bats because densities in one habitat (e.g., built
environments) depend on the extent and configuration of other habitats (e.g., broadleaved
woodland, unimproved grassland, etc.). Therefore, estimates were made of roost density at
a landscape scale, and these were combined with estimates of roost size and geographical
range. The estimation of geographical range for all species benefited from the use of
biological records provided at finer resolution than those available on publicly-accessible
databases.

For many species, the assessments presented in this review are based on very limited data.
The mission of the Mammal Society is to support evidence-based decision making. This
report is therefore transparent about potential sources of error, and the data — range maps,
density estimates, etc. — on which the calculations are based are freely available. To
facilitate inter-species comparisons, a deliberate choice has been made to use standardised
methodology that could be widely applied. For example, for most species it was not possible
to distinguish records that represented established or breeding populations from occasional
records, and therefore no attempt was made to make this distinction.

Readers are encouraged to consider the caveats documented in the reports for each
species. The population sizes for each species are provided with confidence intervals (or
plausible intervals (PI) for bats) that give a measure of the precision of the estimate. Where
a species has a reliability score of
have included most of the population) the population size is placed within square brackets.
However, not all potential sources of variability are captured, so the estimates should
generally be considered as optimistic. Uncertainty in the size of the geographical range was
not considered. For some species, data were completely lacking for habitats known to be
used (for example, estimates for brown rats were based on dwellings and farms only,
because no evidence was available on riparian habitats, sewers etc.). Given that it was
impossible to know the extent to which these habitats contributed to the population size or
distribution, they are not included in the reliability scores.

Details of the methods used in each stage of the review are outlined below, and are
described in full in the Methods section of the main report.

Literature search
A literature search was conducted using the databases ISI Web of Knowledge and Google
Scholar. The search terms used included the common and taxonomic names as well as at
least one of the terms from the following lists: British, UK, England, Scotland, and Wales;
‘population density’, ‘population estimate’, ‘abundance’, ‘population size’, ‘survey’ or
‘census’. The collated publications were then screened for inclusion based on relevance,
and limited to publication dates between 1995 and 2015. Government and Non-
Governmental Organisation reports were sourced directly from the organisations.

The following details were recorded from each paper/report: estimate type (i.e. minimum
number alive, absolute population size/density); survey method; area or length (for linear
features) of the study site; habitat type; start date; time of year; and duration of study.

Habitat data
To quantify changes in habitat availability over time, data were taken from the 2007
Countryside Survey (CS2007). The area of each broad habitat class within the species’
range was extracted from the Land Cover Map 2007 (LCM2007) land-use layer using
ArcGIS (version 10.3). Further information on the correspondence between the LCM2007
data and the land cover data used in the previous report (Harris et al., 1995), together with
additional details on the classification of grassland habitats, is provided in the text of the
main report.

The total length of hedgerows in each country was taken from the CS2007 linear features
estimates. The proportion of hedgerows under management as part of an Agri-Environment
Scheme (AES), given its likely superiority in terms of habitat quality, was quantified for each
country using data supplied by Natural England (NE), Natural Resources Wales (NRW), and
Scottish Natural Heritage (SNH). AES hedgerows were assumed to be evenly distributed

                                                                                                 2
throughout each country, and the proportion of AES hedgerows was used to divide the total
length of hedgerows within each species distribution into lengths for non-AES and AES
hedgerows.
The total length of riparian habitats in each country were taken from Table 4 of the previous
review of British mammals by Harris et al. (1995). The length of riparian habitats within each
species’ distribution was calculated by multiplying the total length by the percentage of the
country included in the species’ distribution.
Species status
The conservation status of each species is presented as the global listing on the IUCN Red
List of Threatened Species, together with the Regional Red List status. Each species is
indicated as being native, non-native or naturalised. Species are considered naturalised if
they were introduced in or before the 12th century, whereas they are considered native if
they have been resident — without being dependent on human transportation — since the
formation of the English Channel about 8,000 years ago.
Under the IUCN Red List criteria, each species is allocated to one of the following
categories, relating to imminent risk of extinction:
Critically Endangered (CR).
Endangered (EN).
Vulnerable (VU).
Near Threatened (NT).
Least Concern (LC).
Data Deficient (DD).
The categories CR, EN and VU indicate an appreciable risk of extinction in the near future
(generally within the next decade, or 3 generations — whichever is longer), and are
collectively described as ‘Threatened’: CR indicates the highest level of extinction risk in the
wild, and EN and VU indicate progressively lower levels of risk. Near Threatened indicates
that the species is close to qualifying as Threatened, or is likely to qualify as such in the near
future.
The assessments of Regional Red List status for Great Britain have been formally approved
by the Inter-Agency IUCN Red Listing Group. Country-level assessments and those
conducted for non-native (naturalised) species followed the same IUCN Regional Red List
Criteria. Whilst there is flexibility within the guidelines to allow these assessments to be
made, there is no mechanism for these to be formally approved. Exceptions were made for
the Great Britain assessments of the Orkney vole and the lesser white-toothed shrew, on the
3grounds that the Orkney vole is officially recognised as an island sub-species; and there is
doubt over whether the lesser white-toothed shrew is naturalised or native. Country-level
assessments are therefore presented in square brackets in this report, and the assessments
for non-native (naturalised) species are reported separately by the Mammal Society (see
www.mammal.org.uk/science-research/population-review-red-list). Red List assessments
can be difficult to make for small geographical areas, particularly if the species has a
restricted range within a particular country but is mobile and mixes with neighbouring
populations. This should be borne in mind when interpreting the country-level classifications.
Where relevant, the national conservation status as assessed for Article 17 of the EU
Habitats Directive is also shown.
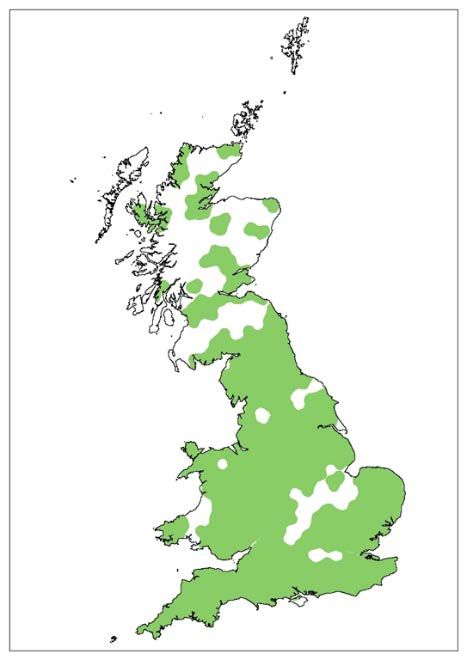
Species’ distribution maps
Presence data collected between 1995 and 2016 at 10km resolution or higher were gathered
for each species from the NBN gateway, local record centres, national and local monitoring
schemes, and iRecord. Only data that had been verified by the source organisation were
included in the distribution maps, with the exception that we also included data for species
that were highly unlikely to be misidentified (namely moles, rabbits, badgers, foxes, and
hedgehogs) from organisations whose primary objective was not to survey mammals.
Experts were consulted to ensure the maps for each species represented current
distributions as accurately as possible. They were presented with maps at a 10km
resolution, and asked to remove any squares that, they were certain, had not had a recorded
species sighting since 1995. Deletions were only accepted when two or more experts
agreed.
Smoothed distribution maps were created by fitting alpha hulls to the presence data for each
species using an alpha value of 20km, a process that excludes isolated datapoints (for full
details see Methods section of Main Report (Mathews et al., 2018)). An additional 10km
buffer was added to the final hull polygon to provide smoothing to the hull, and to ensure that
the hull covered all the grid squares recorded as positive in the original dataset rather than
intersecting them.
The use of this method means that the maps should be viewed with the following limitations
in mind:
• Areas that contain very isolated records may not have been included in the area of
distribution.
• Gaps may represent low recorder effort rather than true absences.
• The maps do not show population density.
4• All verified records, including occasional and transient individuals, are included, so
some areas may not represent an established breeding population. This is a particular
problem for more mobile species as ranges may be overestimated.
Population size assessment
To enable a standardised assessment of population density per habitat type, the habitat type
recorded in each study was matched to the most comparable broad habitat or linear feature.
For reasons of presentation, the denominators for density vary between taxa. Densities are
given per hectare for smaller taxa (rodents and soricomorphs), per 100m for linear features,
per square kilometre for more mobile taxa (bats, lagomorphs, carnivores, ungulates,
erinaceomorphs), and per 1km for linear features.
To calculate the total population size for each broad habitat, the median population density
per habitat type was multiplied by the availability of that habitat within the species’ range.
Confidence intervals (95%) for the median were calculated by percentile bootstrapping with
10,000 resamples, using the ‘boot’ package (Canty and Ripley, 2012) in R v3.2.2 (R Core
Team, 2015). For bats, a slightly different approach was required for most species because
habitat-specific densities are not meaningful for animals that use the landscape on a broad
scale. Instead, densities (bats km-2) were generally computed by multiplying the typical
maternity roost density in an average quality landscape by twice the typical number of adult
females per roost. Lower plausible limits (PLs) — which can be thought of as roughly
equivalent to lower 95% confidence intervals, though without the same statistical foundations
— were derived by multiplying the plausible maternity roost density for poor habitat by twice
the lowest plausible estimate of adult females per maternity roost in poor habitat. The upper
plausible limit was calculated similarly, but this time employing the highest plausible estimate
of bats per roost, proportion of females, and typical roost density in good habitat. Full details
are provided in each species account in the main report (Mathews et al., 2018).
Where possible, population sizes were adjusted to account for the percentage of occupied
habitat within the species’ range. Occupancy data were only included where studies used
standardised surveys and reported both presence and absence. Where percentage
occupancy data were lacking, 100% was assumed.
Specialists working with each species were surveyed to gather unpublished information and
expert opinions. They were provided with the median habitat-specific density estimates from
the literature, and were asked to provide alternative estimates (with reasoning) if they
disagreed the values given. For habitats where no data were available, the experts were
asked to provide estimates. The responses were used to derive a median density, and upper
and lower confidence interval, for each habitat and species combination. Where no data
5were found for a particular broad habitat in the 1995-2015 literature search, and experts
were also unable to an estimates, then the value previously used by Harris et al. (1995) was
applied.
The population estimates were derived by multiplying each habitat-specific density estimate
by the area of that habitat within the species’ geographical range.
Reliability assessment
For species where population density data are lacking, the population size can be strongly
influenced by a single density estimate if the estimate is particularly extreme, or if the habitat
to which it applies accounts for a high percentage of the total species’ distribution. To identify
which data have the strongest influence on population size for each species, we carried out
two assessments: first, we calculated the percentage of the total population found in each
habitat; then we identified which habitat-specific population sizes account for more than 25%
of the total population size. This information was used to assess whether a habitat was
particularly influential by virtue of its size or its density values.
We performed a sensitivity analysis by re-calculating population size with stepwise deletion
of individual density estimates from habitats which met the following conditions:
• The habitat contains >25% of the estimated population.
• Median population density is supported by fewer than 10 individual density estimates.
Where density estimates were found in the literature and also provided by experts, a
comparison was made between the population sizes calculated using the estimates from the
literature and a re-calculated estimate using median expert opinion values in place of those
from the literature. This comparison was made only under the following conditions:
• Confidence limits for median density estimates from the literature did not overlap with
the upper and lower ranges provided by experts.
• Fewer than 10 separate density estimates were obtained from the literature.
A reliability score has been calculated for each habitat containing more than 25% of the
species’ distribution, or accounting for more than 25% of the total population size. These
scores are based on the number of locations in which individual assessments of population
density were conducted, on the sample size (number of individual density estimates
contributing to the median), and on whether data on the percentage of occupied habitat were
available. A higher score indicates a more reliable estimate. The values across each of
these criteria were summed to give a score per habitat; and where more than one habitat
was assessed, the mean of the different scores is presented (the maximum value is 5). For
6bats, a slightly different scoring scheme was used — based on the availability of data on roost density, roost size and sex ratio — reflecting the different methods employed for calculating population density. The choice of values given to each component in the scoring systems, and the decision of how to combine these values, are to some extent arbitrary: the absolute value of the score therefore has no inherent meaning. In addition, the reliability scores do not give weight to the differing scientific quality or precision of the estimates provided in the original studies. Nevertheless, they can be used as a rough index for ranking reliability across different species, and are also helpful in highlighting data deficiencies. A value of 1 indicates very poor reliability, and 4 indicates very good reliability. The population estimate is shown in brackets where the reliability score was
Hedgehog Erinaceus europaeus

British population estimate
[522,000] (95%CI not available).
Reliability score = 2.

Conservation status
Native. IUCN Red List: GB: VU; England: [VU]; Scotland:
[VU]; Wales: [VU]; Global: LC.

Caveats
Population size estimate may be affected by the following
factors not included in the analysis:
• Recent density estimate data were available for
   improved grasslands and urban areas only.                   Range based on 1995-2016
• Population size is largely determined by the density         presence data. Areas with very
                                                               isolated records may not have
  estimates in unimproved grassland and broadleaved            been       included  in    the
  woodland. This is owing to their large areas within the      distribution — see main report
  range, and because their density estimates — derived         Methods section 2.5 for more
  from expert opinion in Harris et al. (1995) — were high      details.
  (40km-2 in each case; cf. 0.54km-2 for urban, and
  0.04km-2 for improved grassland).
• Percentage occupancy estimates for each habitat are based on limited data, and were
  not able to account for variability owing to region or habitat quality.
• More empirical data on population density and occupancy of hedgehogs is needed to
  improve confidence in the current population density and subsequent size estimates.

Changes through time
• Harris et al. (1995) estimated a British population size of 1,555,000. The current estimate
  is 66% lower. However, both estimates are extremely uncertain.
• Other reviews based on indices of relative abundance have estimated declines ranging
  from 1.25% to 40% over 10 years (Roos et al., 2012, Hof and Bright, 2016).
• Population size — Decline. Range — Stable.

Drivers of change
• Prey declines resulting from changes in agricultural practice and possibly pesticide use,
  although effects are not quantified.
• Anthropogenic influences such as vehicle collisions and loss of nesting habitat.
• Predation and possible competitive exclusion by badgers.

Future prospects
• Population status — Decline
• Range status — Stable
• Habitat status — Decline

                                                                                                8
European Mole Talpa europaea
British population estimate
[41,400,000] (95%CI not available).
Reliability score = 1.
Conservation status
Native. IUCN Red list: GB: LC; England: [LC];
Scotland: [LC]; Wales: [LC]; Global: LC.
Caveats
Population size estimate may be affected by the
following factors, which were not included in the
analysis:
• No percentage occupancy data were available, so Range based on 1995-2016
presence data. Areas with very
the population size is likely to be overestimated.
isolated records may not have
• 46% of the estimated population size for moles been included in the
was derived from improved grassland habitat, with distribution — see main report
a further 19% from arable and horticulture. These Methods section 2.5 for more
details.
habitats represent 38% and 33% of the species’
range, respectively. The density estimates are
based only on expert opinion (Harris et al., 1995).
Changes through time
• The density estimates used in the current analysis are taken from Harris et al. (1995), so
any differences are entirely owing to changes in the species’ distribution and land
classification. Accounting for probable temporal changes in the British landscape
generates a population size of 38,400,000, and a 23% increase in population size since
1995. However, it was not possible to assess whether the difference is significant.
• Mole signs are recorded in the British Trust for Ornithology (BTO) Breeding Bird Survey.
The number of 1km survey squares with signs of moles was 7% in 1995, 32% in 2003,
and 18% in 2015.
• Population size — Data deficient. Range — Stable.
Drivers of change
• Prey declines resulting from changes in agricultural practice and possibly pesticide use,
although effects are not quantified.
• Habitat quality — changes in land management, e.g., reduction in unimproved grassland
and removal/neglect of hedgerows.
Future prospects
• Population status — Stable
• Range status — Stable
• Habitat status — Stable/Decline
9Common Shrew Sorex araneus
British population estimate
[21,100,000] (95%CI = 6,520,000– 58,500,000).
Reliability score = 1.
Conservation status
Native. IUCN Red list: GB: LC; England: [LC];
Scotland: [LC]; Wales: [LC]; Global: LC.
Caveats
Population size estimate may be affected by the
following factors, which were not included in the
analysis:
Range based on 1995-2016
• No percentage occupancy data were available for presence data. Areas with very
most habitats, so the population size is isolated records may not have
overestimated. been included in the distribution
— see main report Methods
• Population density in improved grassland is low, section 2.5 for more details.
yet this habitat covers 48% of the species’ range.
This density estimate is based on the opinion of
one expert, so any uncertainty will have a major
impact on population size.
• Most of the estimated population is derived from
unimproved grassland (24%) and from bog habitats (32%). With the exception of
unimproved grassland, only sparse data on population density was available for any
habitat, and there was considerable within-habitat variability. Further data are therefore
urgently needed to increase confidence in the density estimates.
Changes through time
• Harris et al. (1995) estimated a British population size of 41,700,000. Inferences about
temporal trends are not possible because of the lack of robust data.
• Population size — Data deficient. Range — Stable (England, Wales); Decline (Scotland).
Drivers of change
• Prey declines resulting from changes in agricultural practice and possibly pesticide use,
although effects are not quantified.
Future prospects
• Population status — Stable/Decline
• Range status — Stable
• Habitat status — Decline
10Pygmy shrew Sorex minutus
British population estimate
[6,300,000] (95%CI = 999,000–38,900,000).
Reliability score = 0.5.
Conservation status
Native. IUCN Red list: GB: LC; England: [LC]; Scotland:
[LC]; Wales: [LC]; Global: LC.
Caveats
Population size estimate may be affected by the following
factors, which were not included in the analysis:
• No percentage occupancy data were available, so the Range based on 1995-2016
population size is overestimated. presence data. Areas with very
• All of the population density estimates, except those for isolated records may not have
been included in the
unimproved grassland, are based on the opinion of two
distribution — see main report
to four experts. Methods section 2.5 for more
• Gaps in the species’ distribution in England and Wales details.
are likely to result from a lack of survey effort, rather
than true absences. It is less clear whether larger gaps in Scotland represent true gaps in
distribution or are influenced by survey effort.
Changes through time
• Harris et al. (1995) estimated a British population size of 8,600,000, compared with the
current estimate of 6,300,000. Comparisons with the current review are difficult because
of changes in methodology.
• Impacts of general invertebrate declines and pesticide use are not quantified.
• Population size — Data deficient. Range — Stable (England, Wales); Decline (Scotland).
Drivers of change
• Prey declines resulting from changes in agricultural practice and possibly pesticide use,
although effects are not quantified.
Future prospects
• Population status — Stable/Decline
• Range status — Stable
• Habitat status —Decline
11Water shrew Neomys fodiens
British population estimate
[714,000] (95%CI = 237,000–1,942,000).
Reliability score = 0.
Conservation status
Native. IUCN Red list: GB: LC; England: [LC]; Scotland:
[LC]; Wales: [LC]; Global: LC.
Caveats
Population size estimate may be affected by the following
factors, which were not included in the analysis:
• The population size is derived from the ratio with the Range based on 1995-2016
common shrew. Common shrew population size is presence data. Areas with
uncertain, and ratios are likely to vary by habitat. very isolated records may not
have been included in the
• Gaps in the species’ distribution in England and Wales distribution — see main report
are likely to represent lack of survey effort, rather than Methods section 2.5 for more
true absences. Unclear whether larger gaps in Scotland details.
reflect true gaps in distribution or lack of survey effort.
• 56% of the population size for common shrews is derived from estimates for unimproved
grassland and bog: the reliability scores for these habitats were 2 and 0 respectively.
• The previous estimates of population size were not adjusted to account for the smaller
distribution of water shrews compared to common shrews (Harris et al., 1995) so
populations are likely to have been overestimated.
Changes through time
• Harris et al. (1995) estimated a British population size of 1,900,000 (or 1,500,000 if
comparable re-assessment methods are used). Cf. our current estimate of 714,000.
• Both the current and previous estimates for common shrews are uncertain, with few
density estimates to use as a basis. Therefore, a comparison of population size for water
shrews between the two time periods retains the same level of uncertainty.
• Population size — Data deficient. Range — Increase (England, Wales); Stable
(Scotland).
Drivers of change
• Bank clearance and modification may destroy burrows and alter water supplies.
• Prey declines resulting from changes in agricultural practice and possibly pesticide use,
although effects are not quantified
Future prospects
• Population status — Decline
• Range status — Stable
• Habitat status — Decline
12Lesser white-toothed shrew
Crocidura suaveolens
British population estimate
[14,000] (95%CI not available).
Reliability score = 0.
Conservation status
Naturalised (possibly native). IUCN Red list: GB: NT;
England: [NT]; Scotland: n/a; Wales: n/a; Global: LC.
Caveats
Population size estimate may be affected by the following Range based on 1995-2016
factors, which were not included in the analysis: presence data. Areas with
very isolated records may not
• No percentage occupancy data were available; the have been included in the
population size may therefore be overestimated. distribution — see main
report Methods section 2.5
• The density estimates are very out of date, and may for more details.
have altered following a reduction in predation pressure.
Changes through time
• Harris et al. (1995) estimated a British population size of 14,000. The current review uses
the same information on habitat availability and density, and it is therefore not possible to
infer any trends over time since the reports are subject to the same errors.
• Monitoring on St Agnes, Gugh and Bryher has been conducted since 2013 following rat
eradication. This has shown an increase in the proportion of occupied footprint tunnels on
St Agnes and Gugh. On Bryher, there was a rapid decline in 2014, and only a partial
recovery since then.
• Population size — Stable (England). Range — Stable (England).
Drivers of change
• Successful predator eradication initiatives.
Future prospects
• Population status — Stable
• Range status — Stable
• Habitat status — Stable
13European rabbit Oryctolagus cuniculus
British population estimate
[36,000,000] (95%CI not available).
Reliability score = 1.
Conservation status
Naturalised. IUCN Red list: GB: n/a; England: n/a;
Scotland: n/a; Wales: n/a; Global: NT.
Caveats
Population size estimate may be affected by the following
factors, which were not included in the analysis:
• No occupancy data were available; the population size
is therefore overestimated. Range based on 1995-2016
presence data. Areas with
• 42% of the population estimate is derived from arable very isolated records may not
habitats, despite showing a preference for improved have been included in the
grassland (Lush et al., 2014). Density estimate for arable distribution — see main report
land is taken from Harris et al. (1995). Methods section 2.5 for more
details.
• Density estimates for improved grassland are based on
small samples (Petrovan et al., 2011a), and values are low relative to other habitat types.
• Factors such as myxomatosis and rabbit haemorrhagic disease have severe local
impacts (Petrovan et al., 2011b), resulting in highly variable population densities both
within and between habitat types.
Changes through time
• Harris et al. (1995) estimated a British population size of 37,500,000. After accounting for
probable temporal changes in the landscape, a 9% decline is likely since 1995.
• The National Gamebag Census reports a 24% decline (95%CI = 45% decline to 4%
increase) in the number of rabbits culled between 1995 and 2014 in Britain. However, the
survey does not account for effort, so it may not represent a true decline in population
size. The BTO Breeding Bird Survey inferred a 48% decline (95%CI = 56%-33%)
between 1995 and 2012 in Britain.
• Population size — Decline. Range — Stable.
Drivers of change
• Disease — population recovery from disease epidemics (myxomatosis and rabbit
haemorrhagic disease).
• Human management — culling to limit impacts on agriculture, although culling effort may
have reduced owing to a lower demand for rabbit meat or fur.
Future prospects
• Population status – Decline
• Range status – Stable
• Habitat status – Decline
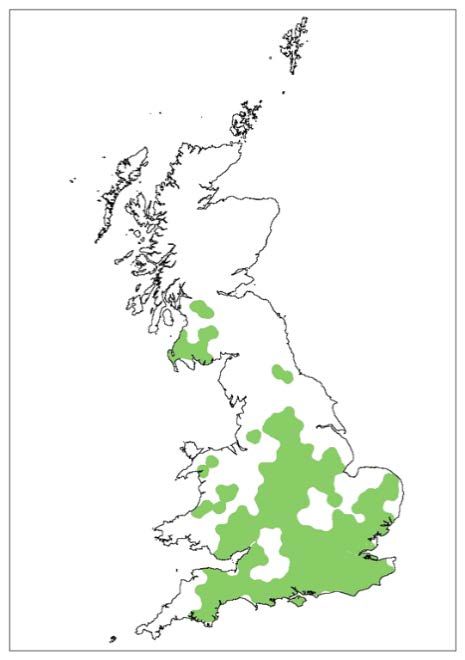
14Brown hare Lepus europaeus
British population estimate
579,000 (95%CI = 427,000–1,990,000).
Reliability score = 3.
Conservation status
Naturalised. IUCN Red list: GB: n/a; England: n/a;
Scotland: n/a; Wales: n/a; Global: LC.
Caveats
Population size estimate may be affected by the following
factors, which were not included in the analysis:
• Population size is adjusted to reflect the occupancy of Range based on 1995-2016
habitat, but there are geographical gradients in presence data. Areas with very
distribution that are not captured by the use of a single isolated records may not have
percentage occupancy figure. been included in the
distribution — see main report
Methods section 2.5 for more
Changes through time details.
• Harris et al. (1995) estimated a British population size of
817,000, which falls within the confidence limits of the
current estimate. However, comparisons between surveys are not reliable owing to
differences in methodology.
• The National Gamebag Census reports a 38% (95%CI = 3%-76%) increase in brown
hares culled in Britain between 1995 and 2009.
• Population size — Data deficient. Range — Stable.
Drivers of change
• Changes to agricultural practice and competition with livestock may reduce food and
shelter opportunities.
• Human management — suppression of the population during specified times of year by
culling.
• Climate change.
Future prospects
• Population status — Stable
• Range status — Stable
• Habitat status — Decline
15Mountain hare Lepus timidus
British population estimate
135,000 (95%CI = 81,000–526,000).
Reliability score = 2.
Conservation status
Native. IUCN Red list: GB: NT; England: n/a; Scotland:
[NT]; Wales: n/a; Global: LC.
Article 17 overall assessment 2013: UK: Favourable;
England: Favourable; Scotland: Favourable; Wales: n/a.
Caveats
Population size estimate may be affected by the following Range based on 1995-2016
factors, which were not included in the analysis: presence data. Areas with
• No percentage occupancy data were available, so the very isolated records may not
have been included in the
population size is overestimated.
distribution — see main report
• The population estimate is derived from dwarf shrub Methods section 2.5 for more
heath habitat only. details.
• The population density of mountain hares is highly variable under differing environmental
conditions. The densities used in this review were taken from moorland managed for
grouse, a habitat with particularly high densities that does not represent the range of
densities and will therefore have overestimated the population size. Densities are usually
30-69 km-2, but exceptionally can be >200 km-2 or more (Harris and Yalden, 2008).
Changes through time
• Harris et al. (1995) estimated a British population size of 350,500 (350,000 in Scotland
and 500 in England). A comparison with the current estimate is not meaningful owing to
differences in methodology.
• The National Gamebag Census reports a 40% (95%CI = 68%-20%) decline in numbers
culled between 1995 and 2009.
• Population size — Data deficient. Range — Increase (Scotland); Decline (England).
Drivers of change
• Altered land use and fragmentation.
• Human management — culling.
• Hybridisation with, and competitive exclusion by, brown hares.
Future prospects
• Population status — Decline
• Range status — Stable
• Habitat status — Decline
16Red Squirrel Sciurus vulgaris
British population estimate
287,000 (95%CI = 218,000–553,000).
Reliability score = 2.
Conservation status
Native. IUCN Red list: GB: EN; England: [EN]; Scotland:
[NT]; Wales: [EN]; Global: LC.
Caveats
Population size estimate may be affected by the following
factors, which were not included in the analysis:
• No percentage occupancy data are available, so the Range based on 2010-2016
population size is overestimated. presence data. Areas with very
isolated records may not be
• There may be some overestimation resulting from the
included in the distribution —
inclusion of extensive Sitka spruce plantations, which see main report Methods
support only very low densities of red squirrels. section 2.5 for more details. A
• Population estimates for England, Wales and southern gap in the distribution between
Scotland are likely to be too high owing to overlapping northern and southern parts of
the Scottish range is likely;
ranges of grey squirrels. range in Surrey does not
represent an established
Changes through time population.
• Harris et al. (1995) estimated a British population size of 61,000. Lack of occupancy data
means that comparison between this estimate and the current review is not informative.
• A marked decline in the distribution of red squirrels since 1995 (Gurnell et al., 2004).
• Population size — Decline. Range — Stable (Scotland); Decline (England, Wales).
Drivers of change
• Disease epidemics, including squirrelpox — transmitted by grey squirrels — and
adenovirus.
• Competition with grey squirrels for resources.
• Habitat quality deterioration, including increased proportion of unfavourable Sitka spruce
in plantations.
• Conservation measures, including control of grey squirrels.
Future prospects
• Population status — Decline
• Range status — Decline
• Habitat status — Stable
17Grey squirrel Sciurus carolinensis
British population estimate
2,700,000 (95%CI = 1,340,000–3,790,000).
Reliability score = 1.7.
Conservation status
Non-native. IUCN Red list: GB: n/a; England: n/a;
Scotland: n/a; Wales: n/a; Global: LC.
Caveats
Population size estimate may be affected by the
following factors, which were not included in the
analysis:
Range based on 2010-2016
• No percentage occupancy data are available, so presence data. Areas with very
population size is likely to be overestimated. isolated records may not have
been included in the
• Grey squirrel densities vary considerably from one
distribution — see main report
year to the next, depending on food availability. Methods section 2.5 for more
• An overestimation of population size may have details.
resulted from the inclusion in the analysis of
commercial conifer forest too young to hold grey
squirrels, as well as extensive Sitka spruce
plantations.
Changes through time
• Harris et al. (1995) estimated a British population size of 2,520,000. Lack of data on
percentage of occupied habitat makes a comparison with the current review inadvisable.
• Population size — Increase. Range — Increase (Scotland); Stable (England, Wales).
Drivers of change
• Range expansion.
• Local population suppression owing to culling.
Future prospects
• Population status — Increase
• Range status — Increase
• Habitat status — Stable
18Eurasian beaver Castor fiber
British Population estimate
168 (95%CI not available).
Reliability score = n/a.
Conservation status
Native. IUCN Red list: GB: EN; England: n/a;
Scotland: n/a; Wales: n/a; Global: EN.
Caveats
Population size estimate may be affected by the
following factors, which were not included in the
analysis:
Range based on 1995-2016
• Three areas of Britain currently have established presence data. Areas with very
free-living beaver populations. The numbers in isolated records may not have
each region were summed to derive a British been included in the
population estimate. However, there are anecdotal distribution — see main report
reports of additional individuals elsewhere that Methods section 2.5 for more
were not included. details.
• New surveys have recently been conducted in
Scotland, and revised population estimates will be
published shortly.
Changes through time
• Beaver populations were not assessed by Harris et al. (1995).
• Owing to their recent reintroduction, a detailed assessment of temporal trends has not yet
been made.
• Population size — Increase (England, Scotland). Range — Increase (England, Scotland).
Drivers of change
• Releases in specific locations.
• Conflicts with socioeconomic interests have led to localised persecution.
Future prospects
• Population status — Increase
• Range status — Increase
• Habitat status — Stable
19You can also read