Testing Functional Variation in Thermal Properties for Antarctic Mosses
←
→
Page content transcription
If your browser does not render page correctly, please read the page content below
Portland State University
PDXScholar

Dissertations and Theses                                                               Dissertations and Theses

1-1-2021

Testing Functional Variation in Thermal Properties
for Antarctic Mosses
Andrew Forrest Clements
Portland State University

Follow this and additional works at: https://pdxscholar.library.pdx.edu/open_access_etds

    Part of the Biology Commons
Let us know how access to this document benefits you.

Recommended Citation
Clements, Andrew Forrest, "Testing Functional Variation in Thermal Properties for Antarctic Mosses"
(2021). Dissertations and Theses. Paper 5721.
https://doi.org/10.15760/etd.7594

This Thesis is brought to you for free and open access. It has been accepted for inclusion in Dissertations and
Theses by an authorized administrator of PDXScholar. Please contact us if we can make this document more
accessible: pdxscholar@pdx.edu.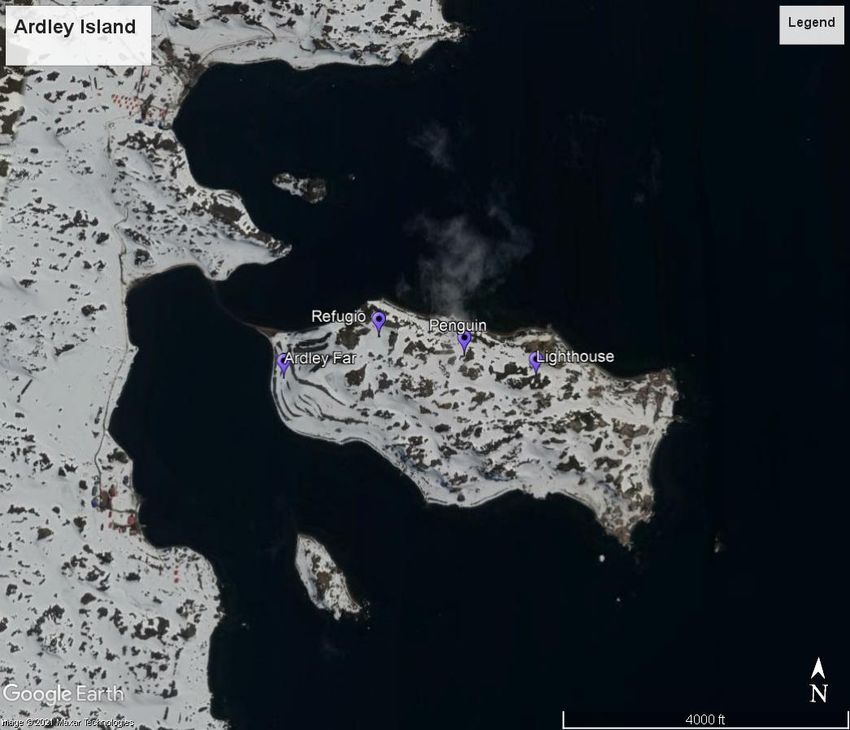
Testing Functional Variation in Thermal Properties

               for Antarctic Mosses

                        by

            Andrew Forrest Clements

  A thesis submitted in partial fulfillment of the
          requirements for the degree of

                Master of Science
                       in
                    Biology

               Thesis Committee:
             Sarah M. Eppley, Chair
               Todd N. Rosenstiel
               Mitchell B. Cruzan

            Portland State University
                      2021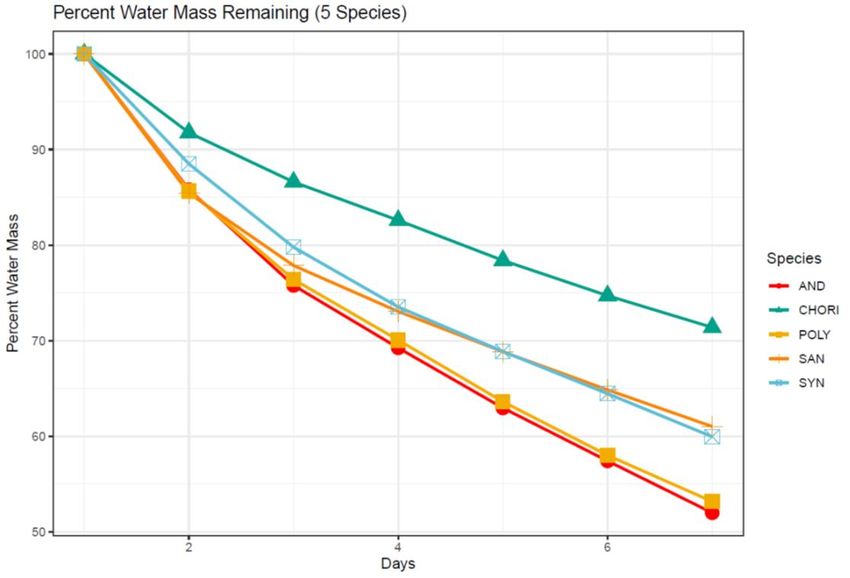
© 2021 Andrew Forrest Clements
ABSTRACT

As the maritime Antarctic ecosystem continues to warm, glacial retreat will further

expose subterranean permafrost to warmer conditions. One of the most visible changes

in the ecosystem is the colonization of the new ice-free areas by bryophytes, particularly

mosses. These bryophytes are having important effects on terrestrial thermal properties,

but little is known about differences among Antarctic moss species in their thermal

properties. Here, I measured the thermal conductivity, specific heat capacity, and the

water content of moss species on King George Island to understand the insulation ability

of Antarctic mosses, Polytrichastrum alpinum, Sanionia georgicouncinata,

Chorisodontium aciphyllum, Andreaea gainii, and Syntrichia filaris. I found that C.

aciphyllum consistently showed the highest thermal conductivity with little drop off as

plants dried over time. S. georgicouncinata and S. filaris both showed a mid-level

thermal conductivity with a greater drop off over time than C. aciphyllum, while P.

alpinum and A. gainii both had a significantly lower thermal conductivity. These data

mirror what was found in the percent water content remaining over time.

Morphologically, plants in low nitrogen sites were less thick and dense than in high

nitrogen sites, yet this resulted in higher rather than lower thermal conductivity. In low

nitrogen sites, I found that plants had higher thermal conductivity and lower overall

relative water content but retained that water longer. These data suggest that Antarctic

mosses fall into functional groups based largely on their canopy morphology and thermal

properties, and that elevated nitrogen has a significant enough effect on their canopy

morphology to impact their thermal properties and water content. This study investigates

                                              i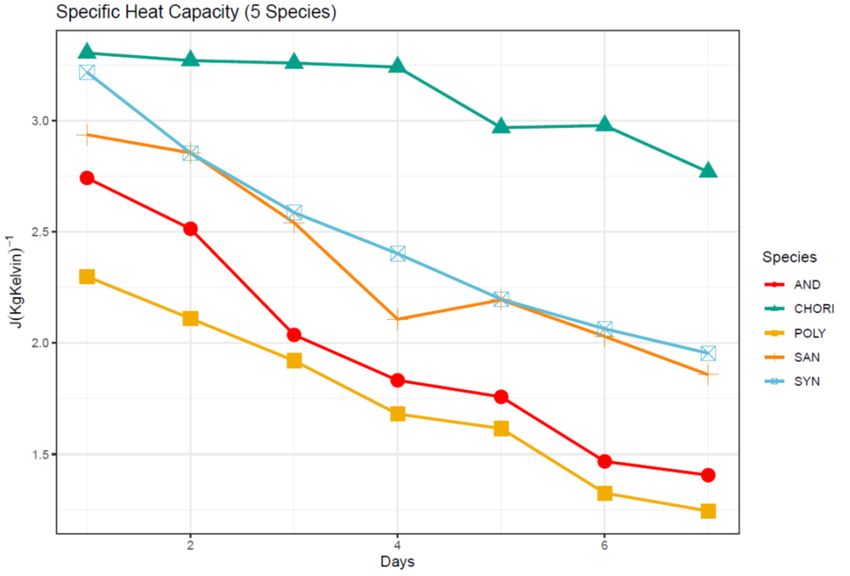
how species composition, functional grouping, and changing nutrient dynamics affect the

role bryophytes play in the temperature dynamics of the maritime Antarctic system. This

understanding will aid in making educated predictions regarding the future of the

permafrost layer and ecosystem structure under continued warming.

                                            ii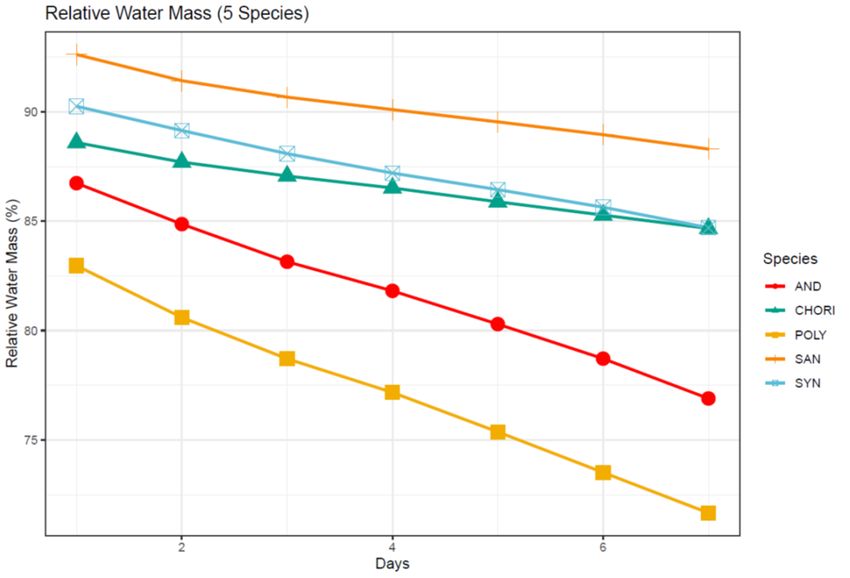
ACKNOWLEDGMENTS

       It is important that I express my gratitude and appreciation to those individuals

who have helped to make this research and my graduate education possible. I first want

to thank my advisors, Dr. Sarah Eppley and Dr. Todd Rosenstiel for their mentorship,

guidance, and patience throughout my graduate experience, and for breaking me into the

world of plant research in the first place. I also want to thank Dr. Mitchell Cruzan for his

help with developing and troubleshooting my experimental design. I have had the great

privilege to work with a multitude of wonderful colleagues over the last few years whom

I would like to acknowledge as well. Dr. Hannah Prather and Dr. Matthew Chmielewski

were instrumental in many aspects of my graduate progress, notably collecting the moss

samples along with Dr. Todd Rosenstiel for this project, as well as being prime examples

of researchers and teachers for me to follow. In addition, this research was completed

with assistance from Danlyn Brennan, Eve Spruell, and Sara Herrejon Chavez. I also

would like to thank my colleagues, Scott Kiel, Erin Davis, Stef Steele, Lillian Raley, Dr.

Timea Deakova, and Caitlin Maraist for their help and support throughout my graduate

journey. Finally, I want to thank my family for their unconditional encouragement,

caring words, and willingness to listen. Their emotional support, late night phone calls,

and unshakable optimism are things that I never want to take for granted.

       All sample collection in this research was completed in cooperation with Dr.

Angelica Casanova-Katny and the Chilean Antarctic Institute (INACH). This research

was made possible through funding from the National Science Foundation.

                                             iii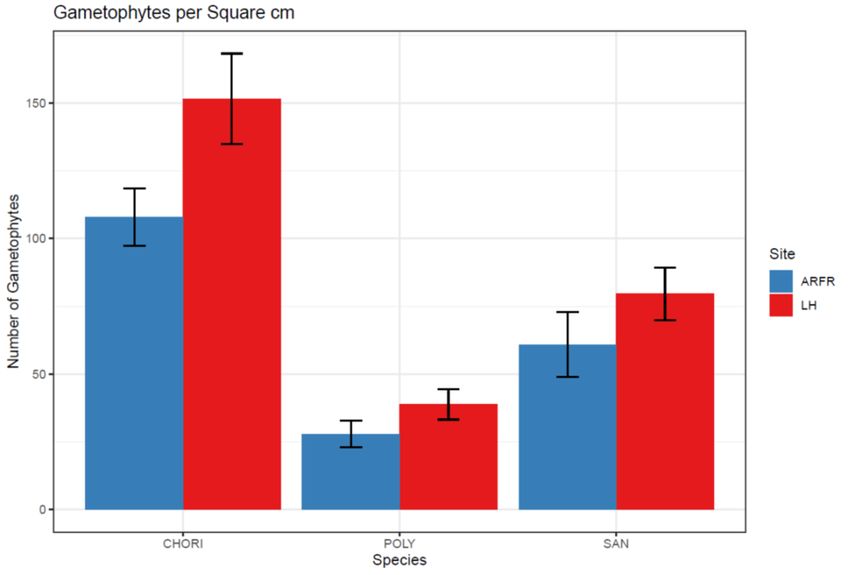
TABLE OF CONTENTS

Abstract ............................................................................................................................... i
Acknowledgements .......................................................................................................... iii
List of Figures .....................................................................................................................v
List of Abbreviations ....................................................................................................... vi

Introduction ........................................................................................................................1

Materials and Methods ......................................................................................................6
   Study System and Sample Collection ..............................................................................6
   Sample Preparation ........................................................................................................10
   Laboratory Measures of Thermal Properties and Water Content ..................................11
   Laboratory Measures of Canopy Morphology ...............................................................12
   Statistical Analysis .........................................................................................................14

Results ...............................................................................................................................16
   Water Content and Thermal Conductivity Across Five Moss Species ..........................16
   Quantifying Tissue Nitrogen Content ............................................................................17
   Water Content and Thermal Conductivity Across Two Sites and Three Moss Species 18
   Moss Canopy Morphology Across Two Sites and Three Species .................................20

Discussion..........................................................................................................................22
   Water Content and Thermal Conductivity .....................................................................24
   Nitrogen Availability......................................................................................................26
   Conclusion ......................................................................................................................30

Figures................................................................................................................................34

References ..........................................................................................................................48

                                                                   iv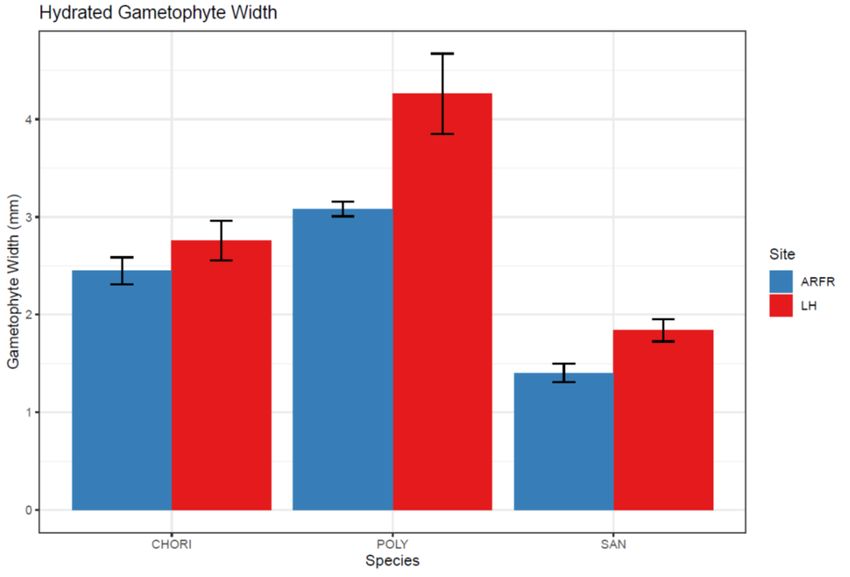
TABLE OF FIGURES

Figure 1: Map of the Fildes Peninsula, King George Island ............................................... 34
Figure 2: Map of Ardley Island ............................................................................................... 35
Figure 3: Percent water mass remaining (%) in the moss canopy over seven days for five
moss species from the Fildes Peninsula .................................................................................. 36
Figure 4: Relative water mass in the moss canopy (%) over seven days for five moss
species from the Fildes Peninsula ............................................................................................ 37
Figure 5: Thermal conductivity (W(m*K)-1) over seven days for five moss species from
the Fildes Peninsula ................................................................................................................... 38
Figure 6: Specific heat capacity (J(kg*K)-1) over seven days for five moss species from
the Fildes Peninsula ................................................................................................................... 39
Figure 7: Tissue nitrogen content (%) in mosses from four sites on Ardley Island ......... 40
Figure 8: Percent water mass remaining (%) in the moss canopy over seven days in two
sites with different nitrogen concentrations on Ardley Island ............................................. 41
Figure 9: Relative water mass in the moss canopy (%) over seven days in two sites with
different nitrogen concentrations on Ardley Island ............................................................... 42
Figure 10: Thermal conductivity (W(m*K)-1) over seven days in two sites with different
nitrogen concentrations on Ardley Island ............................................................................... 43
Figure 11: Specific heat capacity (J(kg*K)-1) over seven days in two sites with different
nitrogen concentrations on Ardley Island ............................................................................... 44
Figure 12: Hydrated gametophyte width (mm) in three moss species from two sites with
different nitrogen concentrations on Ardley Island ............................................................... 45
Figure 13: Moss canopy thickness (mm) in three moss species from two sites with
different nitrogen concentrations on Ardley Island ............................................................... 46
Figure 14: Gametophyte density (per cm2) in three moss species from two sites with
different nitrogen concentrations on Ardley Island ............................................................... 47

                                                                    v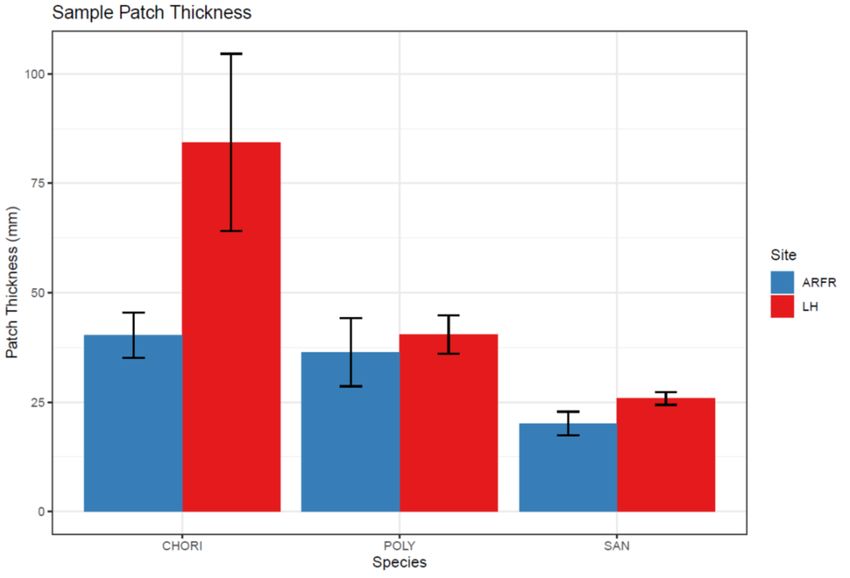
LIST OF ABBREVIATIONS

AF/ARFR     Ardley Far moss collection site
AND         Andreaea gainii
CHORI       Chorisodontium aciphyllum
KGI         King George Island
LH          Lighthouse moss collection site
PN          Penguin moss collection site
POLY        Polytrichastrum alpinum
RF          Refugio moss collection site
SAN         Sanionia georgicouncinata
SYN         Syntrichia filaris
WAP         Western Antarctic Peninsula

                                    vi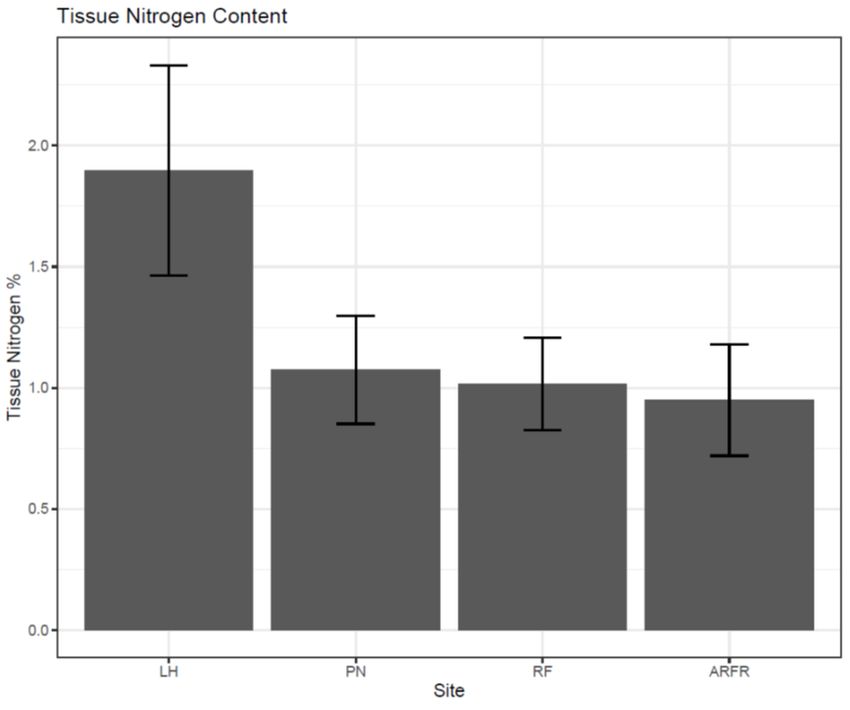
INTRODUCTION

       Global warming is affecting ecosystems across the planet (Arndt et al. 2013,

Nerem et al. 2018, Velicogna et al. 2020, De Frenne et al. 2021). While the effects are

being felt in nearly every system, the Western Antarctic Peninsula (WAP) and the Scotia

Arc have experienced greater than average warming and resulting environmental changes

(Bracegirdle et al., 2008; Bromwich et al., 2013; Green et al., 2015). Drastic glacial

recession (Cook et al., 2005; Vaughan & Doake, 1996) has led to rapid ecosystem shifts

exposing the substrate below and increasing the availability of ice-free areas for plant

colonization in these regions. Aside from two species of flowering plants (Rudolph

1965), lichens and bryophytes—specifically mosses and liverworts—are the dominant

plants of Antarctica and thus have been the primary colonizers of newly ice-free

Antarctic land (Favero-Longo et al. 2012, Olech and Słaby 2016). This greening is

fundamentally changing the ecosystem structure in terrestrial and maritime Antarctica

(Amesbury et al. 2017) not just in plant species composition, but in function as well

(Fountain et al. 2016, Prather et al. 2019). Although the specific details underlying the

ecosystem feedback effects of colonizer species have been well studied in arctic and

alpine glacial systems (Bardgett and Walker 2004, Cannone et al. 2008, Knelman et al.

2012, Castle et al. 2016) and studied to some degree in the Antarctic system (Strauss et

al. 2009, Boy et al. 2016), the implications of these feedbacks in the greening and rapidly

warming Antarctic system are poorly understood. Soil nitrogen concentration and

thermal changes following glacial retreat are notable examples of these systemic

feedbacks (Thomazini et al. 2015, Schmidt et al. 2016).

                                             1
As mosses and lichens colonize ice-free areas after glacial retreat, they begin to
alter the structure of these new habitats. Water content in the soil and plant canopy,
presence of chemical nutrients in the soil, and invertebrate fauna are significant factors in
this transformation (Eviner and Chapin III 2003, Bokhorst and Convey 2016), but the
greater ecosystem ramifications of this greening process are not yet clear. Bryophyte
species differ significantly in morphology and physiology (Hespanhol et al., 2014;
Proctor & Smirnoff, 2015), which affect traits such as nutrient availability and thermal
effects on the soil (Gavazov et al. 2010, Soudzilovskaia et al. 2013, Ball and Virginia
2014). These functional traits become valuable indicators for how changing bryophyte
biodiversity will affect the ecosystem function—i.e., how water is stored in the soil and
biotic layer (Beringer et al., 2001) and how the soil temperature is regulated (Gornall et
al., 2007). Soil temperature is a key factor in many ecosystem functions especially in
cold biomes (Chapin et al. 1995). Activities in soil microbes, such as bacteria and fungi,
as well as vascular plants are significantly limited by cold temperatures in the soil (Lloyd
and Taylor 1994, Wallenstein et al. 2009). The rapid warming in maritime Antarctica will
certainly affect the activity and function of these systems; however, the plant colonization
of soil post glacial retreat makes these effects difficult to predict. It has been shown that
plant cover, especially plant cover with more of a cushion-like morphology, reduces
diurnal temperature fluctuations in cold biomes, helping to stabilize these more
temperature sensitive systems (Kleier and Rundel 2009). In addition, bryophytes,
specifically mosses, are known to alter soil temperature enough to play a role in
controlling ecosystem functions (Gornall et al. 2007, Cannone and Guglielmin 2009,
Soudzilovskaia et al. 2013), although the role of vegetation in soil temperature dynamics
2in Antarctica is poorly understood. Temperature regulation of the soil by mosses could be
a vital trait for maintaining the permafrost found below ground in much of maritime
Antarctica (Porada et al. 2016). These large subterranean ice banks store massive
amounts of carbon compounds that have not yet decomposed (Lepane et al. 2018, Samui
et al. 2020). However, rapid melting of the snow and ice currently offering thermal
protection to these stores would accelerate this melting and decomposition, releasing this
carbon into the atmosphere perpetuating a positive feedback loop (Kleinen & Brovkin,
2018; Potapowicz et al., 2018).
Many studies have been conducted focused on the effects of warming on
Antarctic plants across the continent, often with contrary results among sites (Bokhorst et
al., 2007; Day et al., 2008; Kennedy, 1995; Shortlidge et al., 2017). With over 100 moss
species present in Antarctica, species-specific effects based on morphology are likely.
The morphological and physiology traits can vary greatly and allow the mosses to serve
diverse functions in their ecosystems (Rice et al. 2008, Fan et al. 2020, Laine et al. 2021).
These species-specific traits can affect the soil nutrient concentrations, thermal regulation
of the soil, and fluctuations in water regimes in their environments very differently
(Cornelissen et al., 2007). Although these species-specific effects on the ecosystem
functions have been recognized, the morphological, physiological, and functional traits of
the moss species driving these effects are still unclear (Smith et al., 2015; Turetsky et al.,
2012). In addition to the species-specific traits, abiotic factors in the environment, such
as the presence of elevated nitrogen levels, have been shown to cause changes in moss
morphology (Manninen et al. 2011). Since minute differences in species-specific moss
3morphologies can have profound effects on their ecosystem function, changes due to
elevated nitrogen could potentially also significantly affect these ecosystem traits,
specifically water holding capacity and thermal regulation of the soil (Rice et al. 2001, Li
et al. 2021). Understanding how differences in moss morphologies among species, as
well as variations within species, can impact the thermal and water regimes in maritime
Antarctica would be valuable for predicting ecosystem shifts post glacial retreat and
understanding the roles that colonizing mosses play in this unique and rapidly developing
ecosystem.
In this study, I tested the hypothesis that Antarctic moss species differ
significantly in their thermal properties and fall into different functional categories with
respect to these thermal properties. To test this hypothesis, I measured water holding
capacity, drying rate, thermal properties, and structural morphology in Antarctic moss
species of varying functional morphology. These traits were emphasized because of the
implications for permafrost insulation (Stoy et al. 2012) and because moss species in the
northern hemisphere have been found to differ significantly in many of these traits
(Soudzilovskaia et al. 2013). In addition, these traits were also contrasted between
mosses grown in high nitrogen conditions and low nitrogen conditions to determine
whether the morphological effects caused by elevated nitrogen were great enough to
impact their insulation ability and water dynamics.
This study was conducted on King George Island (KGI), in the South Shetland
Islands. This island has large amounts of ice-free land and a diverse flora. Although
climate change is a widespread issue in Antarctica, some of the most profound effects are
4being observed on KGI and on the near Western Antarctic Peninsula (Turner et al. 2014);
due to the extensive glacial retreat and melt-off of surface ice in these areas, they host the
greatest plant biodiversity in Antarctica (Ochyra et al. 2008). I conducted this study
examining thermal properties and their relationship to nitrogen availability on five
common moss species, Polytrichastrum alpinum, Sanionia georgicouncinata,
Chorisodontium aciphyllum, Andreaea gainii, and Syntrichia filaris from KGI.
Understanding the thermal properties of these dominant plant species in Antarctica can
help to determine which of these plant traits are the primary drivers of ecosystem changes
post glacial retreat and how they could potentially be used as predictors for vegetation
shifts in Antarctica due to ongoing warming (Pearson et al. 2013) in the same way
ecological feedbacks are often used to accurately predict the effects of widespread
climate change (Van Nes et al. 2015).
5MATERIALS AND METHODS
Study System and Sample Collections
This study was focused exclusively on King George Island (KGI), the largest of
the South Shetland Islands. Much of its ecology is maritime and it has a large amount of
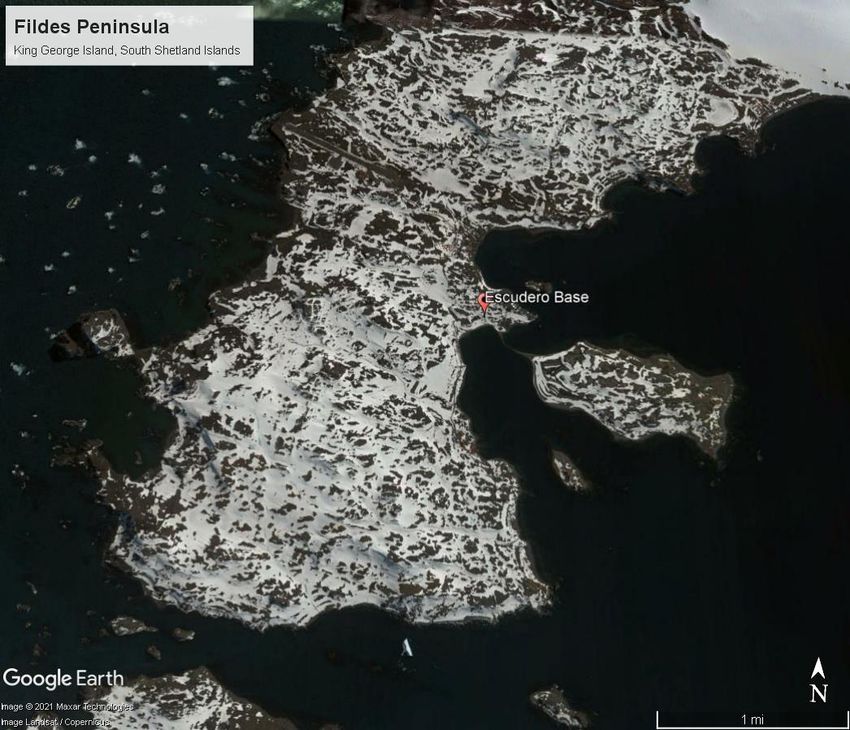
ice-free land around its coasts. My sampling sites are located largely on the Fildes
Peninsula and Ardley Island near the Chilean Escudero Base (62.201382°S,
58.962358°W) (Fig. 1). The area around this study site is near devoid of ground ice in the
summer and has many large moss cushions made up of multiple species. While KGI does
have a high biodiversity of mosses, the area around these sites is dominated by two moss
species, Polytrichastrum alpinum (Polytrichaceae) and Sanionia georgicouncinata
(Amblystegiaceae). Also, in the area at lesser frequency, are moss species
Chorisodontium aciphyllum (Dicranaceae), Andreaea gainii (Andreaeaceaea), and
Syntrichia filaris (Pottiaceaea). I focused my research on these five species of mosses on
KGI.
P. alpinum is a common moss in Antarctic and Southern Ocean regions with a
particularly broad distribution along the Western Antarctic Peninsula (WAP) and the
South Shetland Islands (Australian Antarctic Division 2021). It is commonly referred to
as a “turf moss” meaning it has a more upright structure that tends to collect soil and
other substrate material to form thick “turf-like” canopies (Shortlidge et al. 2017). P.
alpinum has long, robust, pointed leaves on upright gametophytes that spread widely
when hydrated (Putzke and Pereira 2001). This species maintains a substantial amount of
6open air within its canopy and is very efficient at draining. P. alpinum is generally dark
green to brown in color.
S. georgicouncinata is also among the most dominant moss species found on
KGI; together with P. alpinum, they comprise approximate 65% of the terrestrial
vegetation (Prather et al. 2019). Outside of KGI, however, the distribution is much
narrower, being restricted largely to the South Shetland Islands (Australian Antarctic
Division 2021). This species is commonly referred to as a “feather moss” indicating that
its falcate or “sickle-shaped” leaves are arranged in a more linear “frond-like” pattern on
gametophytes lay down and tangle together in a plicate arrangement (Putzke and Pereira
2001). The curled shape of the leaves causes them to retain moisture within the canopy.
Due to the flat structure of S. georgicouncinata, much of the canopy moisture is held in
close contact with the substrate. Canopies of S. georgicouncinata are yellow to light
green in color.
C. aciphyllum is a relatively common species along the WAP, and the South
Shetlands, including KGI (Australian Antarctic Division 2021). It has a particularly high
abundance on Ardley Island as well. C. aciphyllum can grow an extraordinarily tall
canopy reaching heights up to 3 m (Allison and Smith 1973, Smith 1981) over thousands
of years (Bjorck 1991). Due to the thickness of the canopy, these mosses tend to function
similarly to “turf-mosses” like P. alpinum, however, because of the dense arrangement of
the gametophyte shoots, the canopy does not collect as much turf forming substrate as P.
alpinum. The majority of the canopy is senescent with only a few millimeters of green
7photosynthetically active tissue at the tips of the canopy and the rest of the canopy
eventually become part of the permafrost (Cannone et al. 2017).
A. gainii is another common moss along the WAP and the South Shetland Islands,
including KGI (Shortlidge et al. 2017, Australian Antarctic Division 2021). It has been
observed to form both dense cushions as well as short turfs. Similar to P. alpinum, A.
gainii has pointed leaves arranged radially on upright stems that spread widely when
hydrated. However, the leaves of A. gainii are panduriforme in shape and are much
smaller. Because of the upright structure, A. gainii also maintains an appreciable amount
of empty space in the canopy allowing it to collect substrate like P. alpinum. Unlike the
rest of the mosses in this study, A. gainii is generally purplish-brown to black in color
(Putzke and Pereira 2001).
S. filaris also has a more restricted distribution but is found among the South
Shetland Islands and KGI (British Antarctic Survey 2021) The stems are generally very
short with small lanceolate leaves. They form dense cushions with little empty space in
the canopy for substrate collection (Putzke and Pereira 2001). They are not “feather-
mosses” but are more similar in morphology to S. georgicouncinata than the morphology
of more traditional “turf-mosses” such as P. alpinum. Canopies of S. filaris are generally
a light green to yellow color.
Moss samples used in this study were collected from (KGI) in February of 2016.
This location was chosen because of the abundance of terrestrial mosses and the
proximity to the Chilean Julio Escudero research base. The first sampling site was
located outside the Escudero research base (62.201382°S, 58.962358°W)(Fig. 1). At this
8site, the five species of moss with distinct morphologies were collected. Polytrichastrum
alpinum represented the “turf moss” functional group with more robust, upright ramets
and leaves, while Sanionia georgicouncinata represented the “feather moss” functional
group with longer more relaxed ramets and curled leaves. The last three species
collected, Syntrichia filaris, Andreaea gainii, and Chorisodontium aciphyllum had
morphologies that fell somewhere between the two functional groups. For each species,
five 2500cm2 sample locations were chosen and three replicate 2cm diameter cores as
well as one replicate 36cm2 patch were sampled from each plot; this resulted in a total of
fifteen cores and five 36cm2 patches for each species. For the replicate cores, core depth
was as such that the whole canopy and rhizoid structure was kept intact with as little soil
as possible. These cores were transferred to coin envelopes and oven dried at 40°C. For
the 36cm2 patches, samples were taken down to approximately the soil surface,
maintaining an intact canopy. The 36cm2 patches were transferred to individual paper
bags and oven dried at 40°C.
The second round of sampling came from four separate sites of varying distance
from the Gentoo penguin colony on the coast of Ardley Island east of the Fildes
Peninsula (Fig. 2). Because of their location with respect to the penguin colony, I
hypothesized that they may vary in available soil nitrogen concentrations. One site
referred to as Lighthouse (LH) (62.211461°S, 58.927219°W), because of the proximity to
a lighthouse near the penguin colony, served as the high soil nitrogen site since it was the
closest to the penguins and was the most affected by the nitrogen input from guano. Sites
referred to as Penguin (PN) (62.210692°S, 58.933364°W) and Refugio (RF)
9(62.210056°S, 58.940747°W) were second and third respectively in distance from the
penguin colony, and a final site, Ardley Far (AF) (62.211906°S, 58.948639°W),
represented the low soil nitrogen site, being the furthest from the penguin colony on the
opposite coast. All these sites were sampled in the same manner as the Escudero site,
however only three species were collected from these locations, Polytrichastrum
alpinum, Sanionia georgicouncinata, Chorisodontium aciphyllum. These species were
chosen as they were some of the most abundant species found on Ardley Island. In
addition, these species possess very different functional canopy morphologies
representative of different functional groups.
Five replicate cores of all three species from each of the Ardley Island collection
sites were sent to Cornell University for combustion analysis of tissue nitrogen.
Sample Preparation
To measure water content, drying rates, and thermal properties of the collected
moss samples, acrylic tubes 3cm tall and 2cm in diameter were constructed with a fine
vinyl coated fiberglass mesh affixed to one end of the tube to hold the moss cores and
facilitate drainage. Moss samples were then trimmed to the height of the tubes using a
straight razor blade. The moss canopy was prioritized when trimming; however, some
species of mosses with a shallower canopy, such as S. filaris, required a small amount of
rhizoid to be retained in order to fill the tubes. All trimmed material was returned to coin
envelopes. The trimmed samples were then carefully placed in the acrylic tubes with
10efforts made to disturb the canopy structure and density as little as possible. The tubes
and samples were weighed, and the dry mass of the trimmed cores was measured.
Laboratory Measurements of Thermal Properties and Water Content
To measure the thermal properties of the moss species with respect to their water
content, I saturated the mosses in the tubes and measured water content by mass and
thermal properties over time, as the moss dried. The mesh drain on each of the tubes was
plugged using a rubber barrier on the bottom of the tube. The tubes were then filled with
water, submerging as much of the moss samples as possible. The saturation process was
monitored for 30 minutes with water being added as needed to keep the tubes full. After 1
hour of saturating, the tubes were moved to a rack elevated 4cm above the counter in a
cold room at 4°C to simulate Antarctic temperatures without allowing the samples to
completely freeze. The samples were allowed to cool to temperature for 24 hours.
After the samples had cooled and saturated for 24 hours, the samples were drained
one at a time by removing the rubber barrier. Immediately after draining, the samples
were weighed and the thermal conductivity (W(m*K)-1), thermal diffusivity (mm*s-2),
and volumetric heat capacity (J(kg*K)-1) were measured while still in the cold room
using a KD2-Pro Thermal Properties Analyzer by Decagon Devices (accuracy ±10%).
The thermal properties analyzer operates using a two-pronged probe that is inserted into
the medium to be measured; in the case of this study, the moss canopy was measured
using the probe. Care was taken to ensure as much of the probe was covered by the moss
11canopy as possible to ensure accurate and consistent results. Each sample was measured
using the thermal properties analyzer three times to obtain a mean and account for any
small instrument error. The next sample was not drained until the measurements on the
prior sample were completed to ensure equal water saturation in each sample. The mass
and thermal properties measurements were repeated every day at the same time of day for
one week. At the end of one week, all the tubes were transferred to a drying oven at
45°C for three days to ensure no water was left in the samples. Another dry mass was
taken for each one of the samples so that the water mass at each day of the experiment
could be calculated. The water content was quantified in two ways. The first water
content measure was the percent water remaining ([water mass/initial water mass]*100).
This was simply the percentage of water left each day from total saturation on day one.
The next measure was water mass standardized to the core mass ([water mass/total mass
of core]*100). This measure accounts for the relative size of the sample core by
quantifying exactly how much of the total core mass was contributed by the water content
on each day of the experiment. These experimental methods were repeated with the
samples collected from Ardley Island.
Laboratory Measures of Canopy Morphology
To determine differences in moss canopy morphology between the high nitrogen
site (Lighthouse) and the low nitrogen site (Ardley Far), gametophyte width and canopy
thickness were measured in sample replicates from the previous experiment. These traits
were chosen because they had been shown to be phenotypically plastic with nitrogen
12addition (Deakova 2019). In addition, since I hypothesized that water content and thermal
properties would be directly linked to canopy density, I also measured the number of
gametophytes by canopy area. All three of the measurements were taken from 6 x 6cm
replicate moss patches from Ardley Island.
To quantify average gametophyte width, five gametophytes were selected at
random from a hydrated moss patch. The gametophytes were selected using a wire grid
and a random number generator. A digital caliper was used to measure the width of each
gametophyte at its widest point under three conditions. First, the gametophytes were
saturated individually by being submerged in spring water in a petri dish for an hour. The
petri dish was moved under a dissecting scope and the width was measured. Next, the
saturated gametophytes were removed from the water and lightly blotted dry to remove
surface water and the width was re-measured. Finally, the gametophytes were allowed to
dry completely, and the width was measured once more. It was then determined that the
width measurement on the gametophytes that had been hydrated and blotted dry was the
most appropriate width measurement to use in analysis as the gametophytes maintained a
more hydrated morphology with the leaves in a bloomed structure without being altered
by any water cohesion on the surface.
The canopy height measurements were also taken from the 4cm x 4cm replicate
moss patches using a digital caliper. Since the S. georgicouncinata and C. aciphyllum
sample patches did not have soil or rhizoid structures, the height was simply measured
from the bottom of the gametophytes to the top of the canopy. The thickness of the
sample patches was not perfectly uniform, so the average thickness of five randomly
13selected locations on the patch was used as the average canopy height. The structure of P.
alpinum has multiple layers of gametophytes mixed with rhizoids in an organic substrate
layer. As a result, the canopy height was measured from the bottom of the lowest visible
gametophyte in cross section at a specified location to the top of the canopy. Again,
these measurement locations were randomly selected five times to get the average canopy
height.
Lastly, the 6 x 6cm replicate patches were subsampled to measure the
gametophyte density within the canopy. The patches were rehydrated in petri dishes for
two hours and were then subsampled using a 13mm diameter brass cork borer. In the
rare occasion that the canopy was thicker than the length of the borer, a razor blade was
used to trim off the excess canopy at the bottom. The subsampled cores were then
deconstructed using forceps under a dissecting microscope while counting each
individual gametophyte within the canopy.
Statistical Analysis
In the first experiment with five moss species, I used two-way repeated-measures
ANOVA to determine the effect of time and species (Polytrichastrum alpinum, Sanionia
georgicouncinata, Chorisodontium aciphyllum, Andreaea gainii, and Syntrichia filaris)
on the water content and thermal properties of five species. The repeated-measures
ANOVA were used because the samples were remeasured daily for seven days to
determine the effect of time. The dataset met the assumptions of normality and the
14sphericity was tested using a Mauchly’s Test. A Greenhouse-Geisser sphericity
correction was applied to any factors found to be violating the sphericity assumption for
the repeated-measures ANOVA. To determine any statistical grouping among species, a
post hoc Tukey’s honest significant difference (HSD) test was performed on only the
final day of the experiment, excluding the factor of time from the post hoc analysis.
The second experiment, with three moss species-across two sites with different
nitrogen levels, three-way repeated-measures ANOVA were used to determine the effect
of time, species (Polytrichastrum alpinum, Sanionia georgicouncinata, and
Chorisodontium aciphyllum) and site (Lighthouse and Ardley Far) on the water content,
thermal conductivity, and specific heat capacity. Again, the dataset me the assumptions
of normality and a Mauchly’s test was used to test for sphericity. Any factors violating
the assumptions of sphericity were corrected using a Greenhouse-Geisser sphericity
correction. A post hoc test was also performed on the final day of this experiment using
a Tukey’s HSD test to determine any grouping within species.
Finally, a standard two-way ANOVA was used to determine the effect of site
(Lighthouse and Ardley Far) and species (Polytrichastrum alpinum, Sanionia
georgicouncinata, and Chorisodontium aciphyllum) on the hydrated gametophyte width,
moss canopy thickness, and moss shoot density. This dataset met the assumptions of
normality and equal variance for the two-way ANOVA. A post hoc Tukey’s HSD test
was used once more to determine any statistical grouping within species. All analyses
were conducted in R version 3.6.1 and JMP version 15.2.0.
15RESULTS
Water Content and Thermal Conductivity across Five Moss Species
The percent water content remaining (water mass/initial water mass) in the
sample cores over the course of the experiment was significantly different among species
(F = 17.326, P < 0.001, Fig. 3) with C. aciphyllum retaining the most water, S. filaris and
S. georgicouncinata both retaining a mid-level of water, and P. alpinum and A. gainii
retaining significantly less water. Over the seven-day span of the experiment there was a
significant downward trend in the percent water remaining within the sample cores for all
five experimental species (F = 14.621, P < 0.001, Fig. 3). This confirmed the fact that a
significant amount of water was being lost from the sample cores of all five species over
the experimental time frame. The effect of species across time was not found to be
significant (F = 0.882, P = 0.626).
The species difference in the rate of water loss was further emphasized when the
water content was standardized to the total mass of the saturated sample core (percent
water mass of the total saturated core mass). This standardized core water mass (water
mass/total mass of core) decreased significantly over the seven days (F = 14.621, P <
0.001, Fig. 4), although the ordering of the species differed from that of the percent water
remaining (compare Figs. 3 and 4). For this measure, S. georgicouncinata retained the
greatest mass of water relative to the total core mass, C. aciphyllum and S. filaris retained
a mid-level of water mass, and A. gainii and P. alpinum retained significantly less water
(Fig. 4). The standardized core water mass also decreased significantly over time (F =
14.621, P < 0.001, Fig. 4) much like the percent water remaining (compare Figs. 3 and 4).
16Again, the effect of species across time was not found to be significant (F = 0.696, P =
0.850).
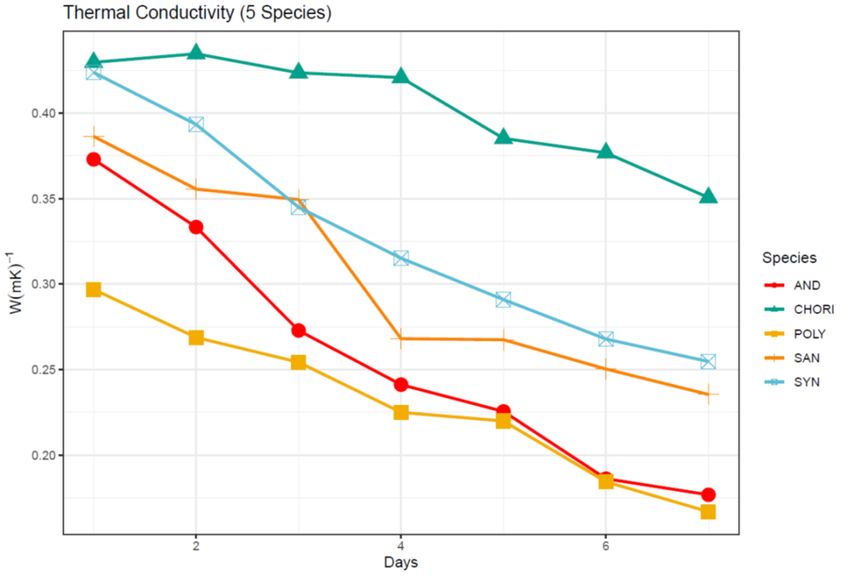
Across the five species there was a significant difference in thermal conductivity
(W/[m*K]) (F = 41.506, P0.001, Fig. 7). Since the remaining three sites were statistically similar in tissue nitrogen
content, Lighthouse (LH) was chosen as the “high nitrogen” site, and the site furthest
away, Ardley Far (AF), was chosen as the “low nitrogen” site. The remaining
intermediate sites were eliminated from the analysis.
Water Content and Thermal Conductivity across Two Sites and Three Moss Species
The percent water mass remaining in the sample cores over the course of the
experiment was shown to be significantly greater in the low nitrogen site than in the high
nitrogen site (F = 14.752, P < 0.001, Fig. 8). The effect of species here was again shown
to be significant (F = 13.798, P < 0.001) as was the effect of time (F = 99.990, P < 0.001,
Fig. 8) mirroring results from the five species experiment prior. In addition, the effect of
site by species on percent water mass remaining was significant (F = 7.955, P < 0.001)
indicating that the magnitude of the effect of site was significantly different between
species with C. aciphyllum showing the greatest difference between sites. The effects of
time by site (F = 1.118, P = 0.354), time by species (F = 0.676, P = 0.773), and time by
site by species (F = 0.325, P = 0.984) were not found to be significant.
Like with the percent water mass remaining, the standardized core water mass
was significantly different between sites (F = 78.669, P < 0.001, Fig. 9) but showed the
opposite results (compare Figs. 8 and 9); the percent water mass was significantly greater
in the high nitrogen site than in the low nitrogen site. The effect of species was also
found to be significant (F = 223.104, P < 0.001) as was the effect of time (F = 10.489, P
18< 0.001, Fig. 9) again mirroring the results of the five species experiment prior. Similar
to the percent water remaining, the effect of site by species was found to be significant
for the standardized core water mass (F = 13.739, P < 0.001) with P. alpinum this time
showing the greatest difference between sites. Again, the effects of time by site (F =
0.004, P = 1.00), time by species (F = 0.571, P = 0.863), and time by site by species (F =
0.112, P = 1.00) were not found to be significant.
When the thermal traits were compared between the two sites, the low nitrogen
site had a significantly greater thermal conductivity (F = 56.053, P < 0.001, Fig. 10) and
specific heat capacity (F = 45.578, P < 0.001, Fig. 11). The effect of species was shown
to be significant for both thermal conductivity (F = 59.540, P < 0.001) and specific heat
capacity (F = 59.564, P < 0.001) with C. aciphyllum showing both the greatest thermal
conductivity and specific heat capacity. Finally, the effect of time for both thermal
conductivity (F = 21.674, P < 0.001, Fig. 10) and specific heat capacity (F = 14.833, P <
0.001, Fig. 11) proved to be significant with both values decreasing over time. Time by
site (F = 1.185, P = 0.317), time by species (F = 0.386, P = 0.967), site by species (F =
0.957, P = 0.386), and time by site by species (F = 0.274, P = 0.992) were not shown to
be significant for thermal conductivity, nor were time by site (F = 0.905, P = 0.493), time
by species (F = 0.282, P = 0.991), site by species (F = 1.917, P = 0.150), and time by site
by species (F = 0.273, P = 0.993) found to be significant for specific heat capacity.
19Moss Canopy Morphology across Two Sites and Three Species
Elevated nitrogen content within the tissue of the three experimental species was
shown to have a significant impact on all three measured morphological canopy traits.
The hydrated gametophyte width (blotted width) in the high nitrogen site was shown to
be significantly greater than in the low nitrogen site (F = 30.822, P < 0.001, Fig. 12) for
all three species. There was also a strong species difference in all three measured
morphological traits. P. alpinum consistently exhibited the greatest hydrated
gametophyte width in both sites and S. georgicouncinata exhibited the smallest hydrated
gametophyte width (F = 96.886, P < 0.001, Fig. 12). In addition, the magnitude of the
difference in hydrated gametophyte width between sites was significantly greater in P.
alpinum than in the other two species (F = 4.989, P = 0.017).
The patch thickness was shown to be significantly greater in the high nitrogen site
as well (F = 10.316, P = 0.004, Fig. 13) with C. aciphyllum showing the greatest
individual species increase in patch thickness (F = 5.955, P = 0.009, Fig. 13). Both P.
alpinum and S. georgicouncinata showed increased patch thickness in the high nitrogen
site but in a lesser magnitude than that of C. aciphyllum. The patch thickness was
significantly different across species with C. aciphyllum showing the greatest patch
thickness, especially in the high nitrogen site, and S. georgicouncinata showing the
smallest patch thickness in both sites (F = 18.948, P < 0.001, Fig. 13).
Finally, all three species showed an increased gametophyte density in the high
nitrogen site (F = 14.982, P < 0.001, Fig. 14) although the effect of site by species was
not shown to be significant (F = 2.574, P = 0.101). The gametophyte density was
20significant among species (F = 80.247, P < 0.001, Fig. 14) with C. aciphyllum having the
greatest shoot density in both sites while P. alpinum had the lowest shoot density in both
sites.
21DISCUSSION
In this study, using moss cores sampled from King George Island (KGI) on the
Western Antarctic Peninsula, I measured the relative water content in the moss canopy
using mass, as well as the thermal conductivity and specific heat capacity to understand
the insulation ability of the mosses. I found that not only do different species of
Antarctic mosses have significantly different thermal conductivities, but they also fall
into functional groups with respect to their thermal conductivities. Chorisodontium
aciphyllum consistently had the greatest thermal conductivity and water retention,
Sanionia georgicouncinata and Syntrichia filaris both showed a mid-level thermal
conductivity, and Andreaea gainii and Polytrichastrum alpinum both had significantly
lower thermal conductivities (Fig. 5). In addition, I found that mosses with an elevated
tissue nitrogen had a greater canopy density (Figs. 12, 13, and 14) and relative water
mass (Fig. 9) but had lesser thermal conductivity (Fig. 10) and specific heat capacity
(Fig. 11).
Thermal conductivity is a measure of the ability of a material to transfer or
conduct heat from one side of the material to the other, while specific heat capacity
shows how much energy is required to change the temperature of a material directly
(Ruuska et al. 2017). These measurements, which are very common is assessing building
insulation, were also the most applicable for assessing thermal applications of moss
canopies in this study. For instance, a moss mat with a lower thermal conductivity would
be less efficient at transferring ambient temperature to the substrate below. Studies have
shown moss to be involved in temperature regulation in a variety of different systems. In
22the United Kingdom, songbird nests with a higher proportion of moss and feathers
incorporated into the nest structure had a strong positive correlation with insulatory
values (Deeming et al. 2020). In an experimental moss removal study in a Siberian
tundra ecosystem, both ground heat flux and evapotranspiration were shown to increase
in sites where moss had been removed suggesting a strong insulating effect (Blok et al.
2011). Since water is an excellent conductor of heat, I hypothesized that greater water
retention would lead to greater thermal conductivity and, therefore, a reduced ability to
insulate the substrate. First, these factors were measured across five species, a “feather
moss” Sanionia georgicouncinata, a “turf moss,” Polytrichastrum alpinum, and three
other mosses common near the study site, Chorisodontium aciphyllum, Andreaea gainii,
and Syntrichia filaris. This was done largely to assess differences in water holding
capacity and insulation ability among species of varying functional groups. It was
evident in this study that there were significant differences among moss species both in
their ability to hold water within their canopies (Figs. 3 and 4) and in their ability to
insulate heat (Figs. 5 and 6). This indicates that it is not enough to simply assume that
mosses will play a role in permafrost preservation without also discussing the species
composition of the site in question. With this knowledge, determining which moss
species will be the dominant ground cover in the region would give insight into the
temperature dynamics and permafrost vulnerability in the future. Below I discuss these
data in more detail and the potential role of nutrient limitation in influencing moss
thermal properties.
23Water Content and Thermal Conductivity
Both the thermal conductivity and the specific heat capacity were shown to be
significantly different across species with C. aciphyllum showing the greatest values for
both measures, and the remaining species arranging into clear functional groups (Figs. 5
and 6). This largely mirrors the results for the water content measures. Considering C.
aciphyllum has the greatest and most densely packed biomass in the canopy limiting free
airflow, I hypothesized that it would also be the most efficient at retaining water, which
then would lead to a high thermal conductivity due to the high thermal conductivity of
water; this dynamic has been observed in mosses in more temperate urban environments
(Rice et al. 2018). However, this result was dependent upon how the water content was
standardized. When the water content was standardized by the initial water mass (percent
water mass remaining), C. aciphyllum indeed retained the greatest water mass (Fig. 3),
but when the water content was standardized by the total saturated core mass including
biomass (relative water mass of the sample core), S. georgicouncinata showed the
greatest relative water content (Fig. 3). This is most likely due to the canopy structure of
the two mosses. C. aciphyllum, as previously stated, has a tall, dense canopy almost
entirely made up of senescent tissue. This makes for an excellent medium for water
absorption; however, the large amount of biomass contributing to the overall core mass
meant that the relative water content was lower. S. georgicouncinata, on the other hand,
is also very efficient at absorbing water in the canopy due to the high surface area and
tangled structure of the canopy but has comparatively low biomass and little senescent
tissue in the canopy leading to a greater overall relative water content. C. aciphyllum was
24also found to have both the greatest thermal conductivity and specific heat capacity (Figs.
5 and 6) reinforcing my hypothesis that a greater water retention leads to a higher
conductivity. Water also has a high specific heat capacity which is likely the cause of the
high specific heat capacity in the C. aciphyllum. The species grouping shown by Tukey’s
HSD test reinforces the concept of morphological functional groups influencing how
individual species interact with their environment. For thermal conductivity, specific
heat capacity, and both standardizations of water content, P. alpinum and A. gainii were
grouped together while S. georgicouncinata and S. filaris grouped together. P. alpinum
and A. gainii both fit the definition of a “turf moss” specifically in their upright
gametophyte structure, abundance of empty space within their canopies, and their
tendency to collect sediment (Putzke and Pereira 2001). S. georgicouncinata and S.
filaris have similar morphologies to each other and fit the definition of a “feather moss”
with a shorter stature, less empty space in the canopy and “frond like” gametophytes
(Putzke and Pereira 2001). This suggests, unsurprisingly, that the morphology of the
moss plays a strong role in the moss’ water holding capacity and ability to insulate,
further emphasizing the importance of considering species composition when assessing
moss communities in an ecosystem.
Plant functional groups are used widely to understand the role of species in the
community (Thomas et al. 2019). Vascular plants are often organized into functional
groups based on a variety of ecological factors, from plant life cycle (annual versus
perennial) and plant growth structure (graminoid versus forb) (Freund et al. 2021), to
nitrogen fixation (Davison et al. 2020). However, few studies have used functional traits
25to apply this organization to moss species, instead lumping most moss species together
with the majority of species specific moss research being done on Sphagnum species
(Ehrenfeld et al. 2005, O’Donnell et al. 2009). Studies that organize bryophyte
functional groups have largely focused on traits such as soil retention or nitrogen cycling
and are often extremely broad (Smith et al. 2015). These functional groups are useful for
drawing conclusions regarding roles that mosses might fill in an ecosystem beyond
simply their growth structure or nutrient feedbacks. Here, I show that bryophytes also
fall into functional groups with respect to their thermal properties as well. Understanding
the effect of mosses on the temperature dynamics of an ecosystem is valuable not only in
environments with a vulnerable permafrost layer, but also more broadly due to the
multitude of ecosystem functions that are temperature dependent, such as invertebrate
communities (Robinson et al. 2021) or temperature dependent seed germination (Roberts
1988). This study shows how mosses can be categorized not just by their morphologies
and nutrient functions, but also by their thermal properties and their water holding
capacity.
Nitrogen Availability
The effect of elevated tissue nitrogen was shown to be significant for the thermal
properties as well as both the percent water mass remaining in the canopy over time and
the relative water mass in the moss core. However, the direction of the effect was
conflicting between the two water content standardizations. On the final day of the
experiment, the mosses from the low nitrogen site had a significantly greater percentage
26of the initial saturated water mass remaining in the canopy (Fig. 8) but had a lower
overall relative amount of water in the canopy than the mosses from the high nitrogen site
(Fig. 9). This indicates that while the low nitrogen mosses retained more water than the
high nitrogen mosses, they held less water mass overall. Additionally, the thermal
conductivity and specific heat capacity were both significantly affected by elevated tissue
nitrogen with both values being higher in the low nitrogen mosses (Figs. 10 and 11).
This means that despite the increased amount of water in the high nitrogen mosses, the
low nitrogen mosses still conducted heat more efficiently suggesting that while the water
content plays an important role in the insulation abilities of moss canopies, the canopy
morphology and where the water is held within the canopy also have a large impact on
the insulation ability.
Nutrient loading, specifically with elevated nitrogen levels, can have a significant
effect on plant morphology, which has been demonstrated in a wide variety of climates
and ecosystems (Brunner and Brodbeck 2001, Quesada et al. 2012, van der Sande et al.
2018, Hofhansl et al. 2021). Acer mono seedlings treated with nitrogen fertilizer
exhibited greater plant height and root diameter in the cold monsoon climate of
Heilongjiang, China (Razaq et al. 2017), and a variety of Mediterranean Quercus species
showed increased dry biomass due to nitrogen fertilization (Sanz Pérez et al. 2007).
These effects have been observed in mosses as well with higher fresh weights and dry
weights being measured in shade grown Sphagnum capillifolium treated with nitrate
fertilizer (Manninen et al. 2011). Physiological and biochemical responses to elevated
nutrients could potentially be used to identify communities that will be better equipped to
27adapt to the changing environment due to global warming (Wasley et al. 2006). In this
study, all measured species (S. georgicouncinata, P. alpinum, and C. aciphyllum) showed
increased hydrated gametophyte width, canopy thickness, and shoot density in the high
nitrogen site (Figs. 12, 13, and 14), indicating a denser canopy structure and greater
overall biomass with elevated tissue nitrogen. This clearly shows that not only is the
tissue nitrogen concentration able to significantly affect the canopy morphology, but the
magnitude of the effect is enough to reflect in the water content and the thermal
properties.
I can propose several possibilities for why the mosses from the high nitrogen site
had a lower thermal conductivity and specific heat capacity than the mosses from the low
nitrogen site despite clearly having a denser canopy and greater relative water mass. The
differences in the canopy structure could potentially alter where the water is stored within
the sample core. The greater biomass in the high nitrogen mosses could potentially be
displacing the water, shifting it to the bottom of the core rather than being more evenly
dispersed within the upper canopy. This would mean that despite the increased water
mass, the heat is required to travel through more plant tissue to disperse, decreasing the
overall thermal conductivity. In addition, water can be held either within moss tissue or
in the moss canopy, and in our study species it is unknown what proportion of water is
held in these two locations, as the mosses dry. Water in these two locations are likely to
vary in how they affect evapotranspiration versus their impact on the canopy morphology
and insulation ability of the moss. Further experimentation in determining the
intracellular water content as compared to the external water content held within the
28canopy would certainly help to clarify these effects. Also, since mosses such as C.
aciphyllum and S. georgicouncinata can retain substantial water, they may potentially
alter the water content of the substrate below. If the majority of the available water is
being stored within the moss canopy, the mosses could likely be causing a drying affect
in the below ground system, essentially preventing moisture from reaching the soil layer.
If more water is being held closer to the surface of the substrate rather than draining
deeper, there would likely be significantly greater evapotranspiration within the canopy
contributing to an overall drying affect. These changes in water content of both above
ground moss canopies as well as the below ground system could have implications for
fungal and micro-invertebrate communities in the system. Moss dwelling micro-
invertebrates are often sensitive to changes in temperature and moisture content in their
habitat. Their abundance and species richness has been shown to be positively correlated
with nitrogen concentrations of mosses and other cryptogams in Antarctica (Bokhorst et
al. 2019). The changes in water content and insulation ability in mosses due to elevated
nitrogen could potentially be a significant factor in this relationship between invertebrate
abundance and nitrogen concentration.
Further analysis is needed regarding where water is stored within the moss canopy
in this system to determine the details of moss canopy water dynamics and how changes
in the canopy morphology would affect these dynamics. Additionally, measuring
chlorophyll content and chlorophyll florescence in both high and low nitrogen sites
would lend insight into changes in photosynthetic activity as well as relative stress levels
in the mosses that could affect water uptake and storage as well as canopy structure (Liu
29You can also read