On the role of soil water retention characteristic on aerobic microbial respiration - Biogeosciences
←
→
Page content transcription
If your browser does not render page correctly, please read the page content below
Biogeosciences, 16, 1187–1209, 2019
https://doi.org/10.5194/bg-16-1187-2019
© Author(s) 2019. This work is distributed under
the Creative Commons Attribution 4.0 License.

On the role of soil water retention characteristic on
aerobic microbial respiration
Teamrat A. Ghezzehei1 , Benjamin Sulman2 , Chelsea L. Arnold1 , Nathaniel A. Bogie1 , and Asmeret Asefaw Berhe1
1 School   of Natural Sciences, University of California, Merced, CA 95340, USA
2 Environmental   Sciences Division, Oak Ridge National Laboratory, Oak Ridge, TN 37830, USA

Correspondence: Teamrat A. Ghezzehei (taghezzehei@ucmerced.edu)

Received: 4 June 2018 – Discussion started: 28 June 2018
Revised: 30 December 2018 – Accepted: 21 January 2019 – Published: 21 March 2019

Abstract. Soil water status is one of the most important en-       crohabitats that influence the community structure and activ-
vironmental factors that control microbial activity and rate       ity of soil microbes (Tecon and Or, 2017) are far too small
of soil organic matter (SOM) decomposition. Its effect can         compared to the macroscopic measures of average soil water
be partitioned into effect of water energy status (water po-       status, such as volumetric water content, relative saturation,
tential) on cellular activity, effect of water volume on cel-      or water holding capacity. At pore and subpore scales, the
lular motility, and aqueous diffusion of substrate and nutri-      volume and connectivity of water pools and films are depen-
ents, as well as the effect of air content and gas-diffusion       dent on matric potential – a measure of the strength by which
pathways on concentration of dissolved oxygen. However,            water is held in pores and on surfaces. Matric potential de-
moisture functions widely used in SOM decomposition mod-           termines the thickness of water films (on very dry soils), cur-
els are often based on empirical functions rather than robust      vature of the capillary menisci, and the largest drained pore
physical foundations that account for these disparate impacts      throat. The relationship between the bulk soil water content
of soil water. The contributions of soil water content and wa-     and the corresponding volumetric-average matric potential
ter potential vary from soil to soil according to the soil water   – commonly referred to as soil water characteristic (SWC)
characteristic (SWC), which in turn is strongly dependent on       or water retention curve (WRC) – is a macroscopic measure
soil texture and structure. The overall goal of this study is to   of hydrologically relevant pore-size distribution and surface
introduce a physically based modeling framework of aerobic         area (Hillel, 1998). As such, it is also a reflection of soil tex-
microbial respiration that incorporates the role of SWC un-        ture, which controls surface area and pore-size distribution,
der arbitrary soil moisture status. The model was tested by        and structure, which controls total porosity and abundance of
comparing it with published datasets of SOM decomposition          intra- and interaggregate porosity. In addition, the interaction
under laboratory conditions.                                       of microbes with pore water is influenced by the concentra-
                                                                   tion of chemical species that can lower the osmotic potential.
                                                                      In process-oriented mathematical models of soil organic
                                                                   matter (SOM) dynamics (Coleman and Jenkinson, 1996; Par-
1   Introduction                                                   ton et al., 1998), sensitivity of SOM decomposition to soil
                                                                   moisture is often modeled in terms of functions that scale
Soil moisture is one of the primary physical factors that con-     the maximum decomposition rate as a function of volumetric
trol microbial activity (Harris, 1981). Short- and long-term       water content (Sulman et al., 2012). The optimal decompo-
temporal variations in soil moisture are strongly correlated       sition rate has been shown to peak at or near field capacity
with heterotrophic respiration rates (Carbone et al., 2011;        (defined interchangeably as matric potential of − 30 kPa or
Yuste et al., 2007). Therefore, the moisture–decomposition         water content after a saturated soil is drained for 24–48 h)
relationship is an important determinant of geographic distri-     with significant reductions in decomposition towards the wet
bution and climatic sensitivity of soil organic carbon (SOC)       and dry ends of the soil moisture range (Franzluebbers, 1999;
stocks (Moyano et al., 2013; Schmidt et al., 2011). The mi-

Published by Copernicus Publications on behalf of the European Geosciences Union.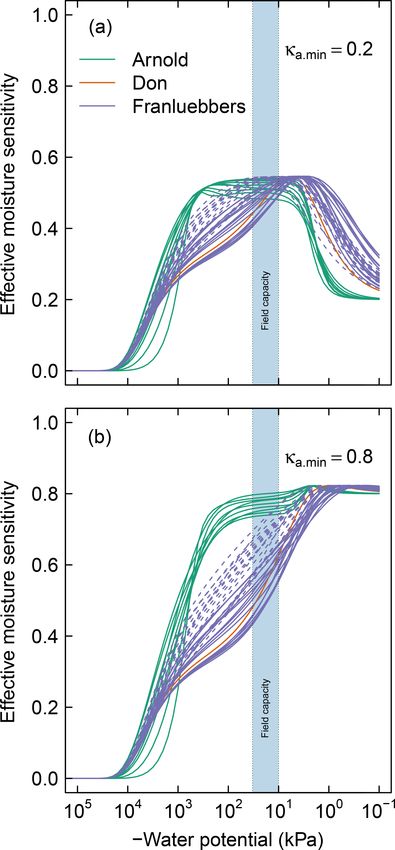
1188            T. A. Ghezzehei et al.: On the role of soil water retention characteristic on aerobic microbial respiration

Linn and Doran, 1984; Monard et al., 2012; Sierra et al.,            Unless empirical moisture sensitivity curves are calibrated
2017; Tecon and Or, 2017). Typically, such bell-shaped soil       individually for each soil, ignoring the independent contribu-
moisture sensitivity curves are described using dimension-        tions of water potential and water content on microbial activ-
less polynomial scalars that are calibrated against experimen-    ity is tantamount to discounting the role of soil texture and
tal data (Sulman et al., 2012; Wickland and Neff, 2007).          structure on soil moisture sensitivity curves. This drawback
   Skopp et al. (1990) proposed one of the earliest conceptual    is especially critical in land-surface models that might be ap-
models that attempted to provide mechanistic rationale for        plied across many different soil types. In long-term simula-
why decomposition of SOM exhibits a peak rate at a certain        tions of land-surface processes, the feedback of changes in
water content in terms of balance between substrate diffu-        SOM stocks on soil aggregation and structure – hence SOM
sion and gas diffusion. The model describes aerobic respira-      decomposition rate – may not be accurately captured if the
tory activity as a process limited by gaseous diffusion and/or    effects of water content and water potential are lumped to-
aqueous diffusion, at the wet and dry ranges of the soil mois-    gether. It is also an important limitation in modeling SOM
ture spectrum, respectively,                                      dynamics in soils that undergo drastic structural change over
                                                                 short period of time, e.g., via tillage or slaking of dry aggre-
             γ DN (θ ) ,
P = min                                                    (1)    gates during rapid rewetting.
             (1 − γ ) DO (θ ) ,
                                                                     The objective of this study was to provide a modeling
where P is an index of decay rate, γ is the relative weight       framework that allows integration of SWC in SOM dynam-
(importance) of aqueous diffusion of nutrients, and DN and        ics modeling. We introduce a conceptual and mathematical
DO are water content (θ ) dependent effective diffusion co-       model of SOM dynamics that accounts for the independent
efficients of nutrients and oxygen, respectively. This model,     roles of matric potential, dissolved oxygen, and substrate ac-
which results in an inverted V-shaped curve, has sufficient       cessibility. For simplicity, we limit our analysis and illustra-
flexibility to capture results from lab incubation experiments.   tion of the model to a single pool of SOM under isothermal
Beyond bulk organic matter (OM) dynamics, this model for-         conditions. However, the framework can be readily expanded
mulation was shown to capture how nitrification rate of tex-      to multiple pools and the dynamic thermal regime.
turally contrasting soils correlates with gas diffusivity under
high water content (Schjønning et al., 2003, 2011). Further-
more, the model has been able to capture observed increases       2   Materials and methods
in decomposition rate with water content (hence aqueous dif-
fusion; Franzluebbers, 1999; Linn and Doran, 1984; Miller et      Process-based SOM dynamics models provide a conceptual
al., 2005; Thomsen et al., 1999).                                 basis for quantitatively describing the biophysical interac-
   However, the direct influence of water potential (sum of       tions within the soil system that determine the fate of SOM.
matric and osmotic potentials) on microbial activity and de-      However, the model parameters that represent soil and SOM
composition rate has not been widely adopted in SOM dy-           properties and biophysical factors are difficult to determine a
namics models (Moyano et al., 2013, 2012). In aqueous me-         priori. Thus, these parameters must be extracted from experi-
dia, microorganisms can react to increasing osmotic stress        mental data via inverse modeling (fitting). Whether the fitted
(low osmotic potential) by accumulating electrolytes and          parameters retain their physical significance when the mod-
small organic solutes that counter the water potential gradient   els are applied to contexts and scales that are not represented
across their membranes (Wood, 2011). The resulting high in-       in the experimental data is a major challenge for most predic-
tracellular osmotic potential inhibits production and activity    tive modeling applications (Finsterle and Persoff, 1997). The
of enzymes in bacteria (Csonka, 1989; Skujins and McLaren,        pitfalls in this regard include strong correlation between fit-
1967) as well as fungi (Grajek and Gervais, 1987; Kredics         ted parameters and overfitting of experimental data (fitting of
et al., 2000). Thus, enzymatic activity, community compo-         random errors at the expense of retaining the ability to gener-
sition, and overall activity of bacteria and fungi inhabiting     alize). These pitfalls can be partially avoided by reducing the
unsaturated soils are significantly impacted by both concen-      number of tuneable free parameters and/or determining some
tration of dissolved solutes (osmotic potential) and reduced      of the parameters independently of the experimental data that
water content (matric potential) (Chowdhury et al., 2011a, b;     are to be fitted.
Manzoni and Katul, 2014; Stark and Firestone, 1995; Tecon            The overall goal of the model proposed in this study is to
and Or, 2017). It is important to note that soil drying con-      incorporate the role of SWC in modeling of SOM dynam-
centrates solutes in pore water, further reducing osmotic po-     ics under arbitrary soil moisture status. To achieve this goal
tential (changing towards larger negative values). However,       in a robust and generalizable manner, we chose to represent
because water content and matric potential are strongly cor-      SOM dynamics using a simple single-pool first-order kinet-
related through the SWC, their effects on microbial respira-      ics. This model relies on only two parameters: the size of the
tion and decomposition of SOM are often lumped together           active SOM pool and a constant decay rate. The effect of soil
or considered interchangeable (Moyano et al., 2012, 2018;         water status and SWC are incorporated into these parameters
Sierra et al., 2017; Yan et al., 2018).                           by relying on well-established relations of multiphase flow

Biogeosciences, 16, 1187–1209, 2019                                                    www.biogeosciences.net/16/1187/2019/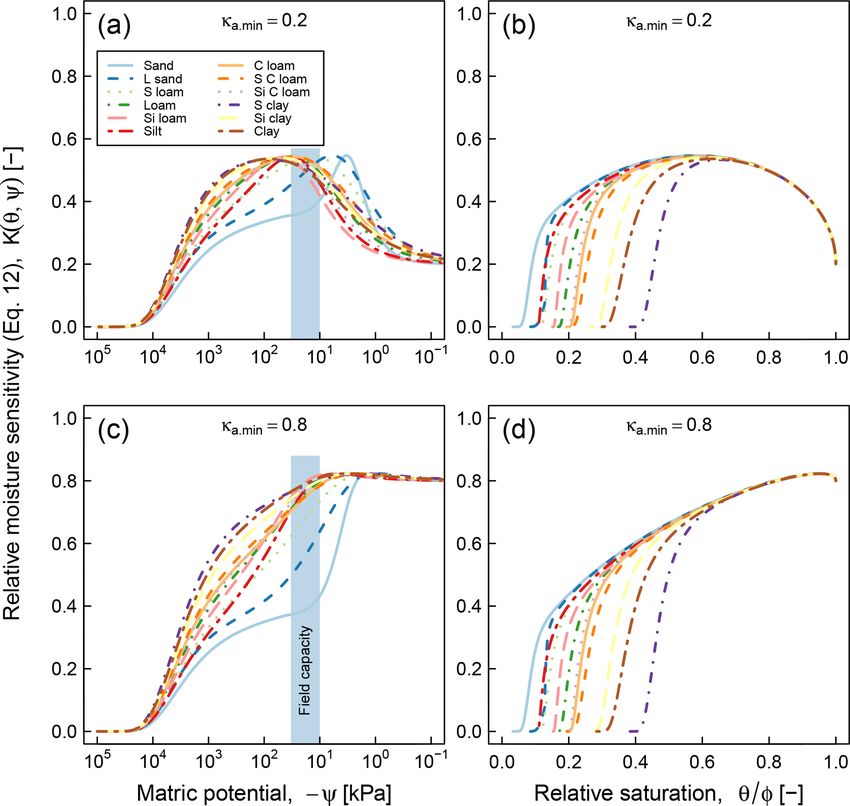
T. A. Ghezzehei et al.: On the role of soil water retention characteristic on aerobic microbial respiration                        1189

and transport concepts and independently fitted SWC curves.
This was done without adding new free parameters that are
tuned to fit observed SOM decomposition data.

2.1   Soil water characteristic (SWC)

Soil water characteristic is a constitutive relationship be-
tween the soil volumetric water content and matric poten-
tial. It embodies the pore-size distribution and as such is a
quantitative representation of soil texture and structure. This
soil-specific relationship determines macroscopic and micro-
scopic water content distributions and indirectly influences
flow of water, transport of dissolved constituents, and gas
fluxes. It also has a strong bearing on the activity of soil mi-
croorganisms and plant roots. The wet end of SWC readily
responds to changes in soil structure (e.g., tillage and com-
paction, root and macro fauna activity, freezing and thawing,
drying and rewetting; Aravena et al., 2013; Ghezzehei, 2000;
Or et al., 2000; Ruiz et al., 2015).                                Figure 1. Schematic comparison of unimodal vs. bimodal
   SWC is typically represented by a monotonic sigmoid              soil water characteristic (SWC) curves, represented using van
function, the most common being van Genuchten’s (van                Genuchten (1980) and Durner (1994) models, respectively. Shaded
Genuchten, 1980) equation                                           regions are distribution functions of effective pore-throat diameter.
                                                                    Scales on top show the thickness of adsorbed film and pore-throat
                  −m
2 = 1 + (αψ)n          ,                                     (2)    diameter corresponding to the water potentials.

where 2 = (θ − θr ) / (θS − θr ) is the effective water satura-
                                                                    SWC of soils that exhibit a bimodal pore-size distribution can
tion; θ , θr , and θS are volumetric water content, residual
                                                                    be described by sums of two van Genuchten curves (Durner,
water content, and saturated water content, respectively; ψ
                                                                    1994):
(kPa) is matric potential; α −1 (kPa) is a parameter that in-
dicates the matric potential at which the water retention                 2
                                                                          X                       −mi
curve exhibits the steepest slope; and n (1 < n < ∞) and            2=          wi 1 + (αi ψ)ni          ,                           (4)
m = 1 − 1/n are shape parameters that reflect the spread of               i=1

the SWC function. Matric potential can be related to an ef-         where w1 + w2 = 1 represents the relative weights of the
fective pore-throat diameter using the Young–Laplace law as         inter- and intra-aggregate pore populations. In Fig. 1, Eq. (4)
D ≈ 4σ/ψ, where σ (N m−1 ) is surface tension of pore wa-           is illustrated by the solid red line. The corresponding bimodal
ter. Therefore, the SWC function (Eq. 2) can be rewritten in        pore-size density function is shown as a red-shaded curve.
terms of the pore-throat diameter as                                The bimodal curve was used only for soils that exhibited a
       n −m                                                     rapid drop in water content with the application of low suc-
        D0                                                          tion, which is a characteristic feature of structured soils.
F = 1+          ,                                            (3)
        D                                                              It is important to note that water retention is dominated by
                                                                    capillary attraction at the wet end of the SWC curve, approx-
where F = θ/θS represents the relative saturation or cumula-        imately ψ > −10−2 kPa and D > 1 µm, while adsorption of
tive pore-size distribution. Equation (3) is a reinterpretation     the thin water film on mineral surfaces dominates in the dry
of SWC as cumulative pore-size distribution and D0 ≈ 4ασ            range (Or and Tuller, 1999). Thus, soil texture is the most
is the mode of the pore-throat diameter distribution. In Fig. 1,    important determinant at the dry end of SWC while struc-
Eqs. (2) and (3) are illustrated by the solid blue line. The cor-   ture and water-stable aggregation dominate in the wet end.
responding pore-size density function f = dF /dD is shown           The latter is strongly influenced by the amount and nature of
as the blue-shaded bell-shaped curve. The pore-throat diame-        SOM and readily responds to changes in SOM content.
ter scale is shown on the top axis of Fig. 1. This form of SWC
is a good approximation for soils with a unimodal pore-size         2.2   SOM dynamics modeling
distribution.
   However, soils with a significant level of aggregation,          The conceptual basis for our model is that soil organic matter
clumping, and/or biopores exhibit multimodal pore-size dis-         is comprised of a single pool characterized by a first-order
tributions, e.g., with fine intra-aggregate pores and coarse in-    rate of decomposition
teraggregate pores. Such soils can be represented by sum-           dC
mation of two or more unimodal pore-size distributions. The            = −κC,                                                        (5)
                                                                    dt

www.biogeosciences.net/16/1187/2019/                                                         Biogeosciences, 16, 1187–1209, 2019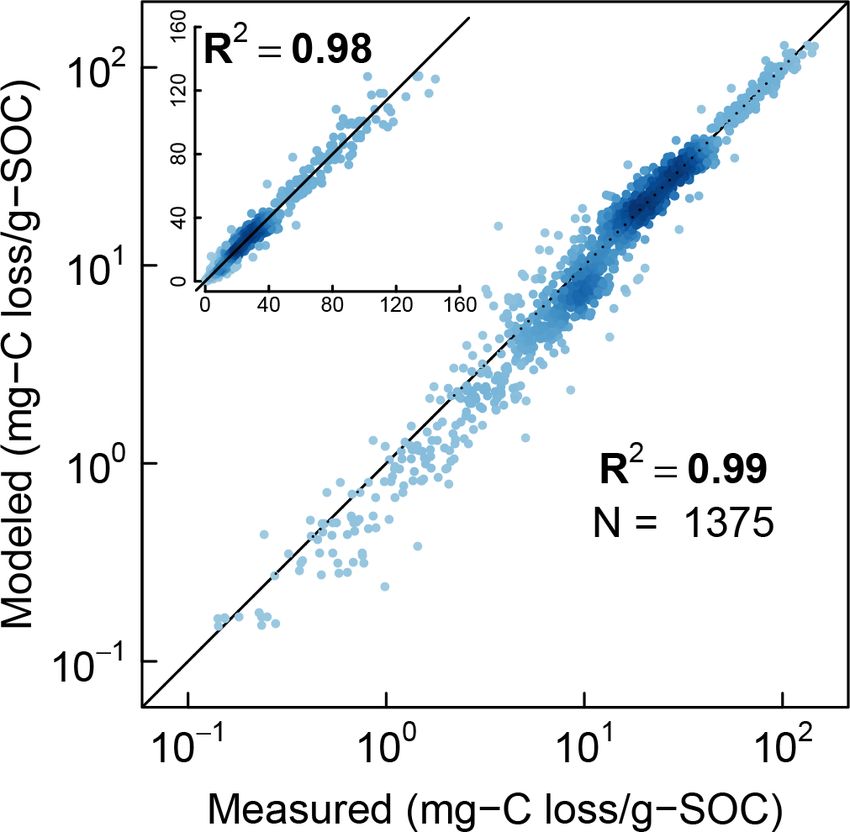
1190            T. A. Ghezzehei et al.: On the role of soil water retention characteristic on aerobic microbial respiration

where C (mg-C / g-SOC0 ) is the active C pool remaining           water content or matric potential. However, consistent with
at any given time, expressed as a fraction of the total ini-      the model of Skopp et al. (1990), relative gas diffusivity was
tial SOC, and the rate constant κ (day−1 ) is a measure of        a good predictor of nitrification.
SOM decomposition largely driven by living decomposers.              Based on the above observations, we propose to expand
Therefore, we consider it to be a composite parameter that        the decomposition rate κ into the product of multiple inter-
accounts for the abundance of decomposer population as well       acting components that represent biophysical factors,
as the activity of an average decomposer. Both of these fac-             Y
                                                                  κ = κo κi ,                                                 (6)
tors are impacted when soil moisture level changes. Chowd-
                                                                          i
hury et al. (2011b) observed that the abundance of active de-
composers declines while maintaining the same level of av-        where κi are dimensionless constants representing the bio-
erage activity as water potential dropped from ψ = 0 kPa to       physical factors. Here we focus on two such factors, namely
ψ = −2000 kPa. Organisms subjected to low total water po-         matric potential (κψ ) and availability of dissolved O2 (κa ).
tential exhibit reduced population growth as substantial pro-     The parameter κo (day−1 ) is an intrinsic (maximum) rate
portion of their energy intake is routed towards osmoregu-        constant and represents the lumped effect of all the remain-
lation (Harris, 1981; Watson, 1970). Upon further drying,         ing unresolved biophysical factors such as temperature, pH,
however, the population remained constant, but the activity       soil mineralogy, OM composition, and nutrient availability.
declined sharply (Chowdhury et al., 2011a, b). Previously,        In principle, Eq. (5) can be expanded to accommodate as
Stark and Firestone (1995) used two independent techniques        many variables as needed. This general formulation has been
to evaluate (a) the relative importance of water potential on     used to represent the effects of various enzyme activities and
cytoplasmic dehydration and (b) the role of water content         temperature (Sierra et al., 2017).
diffusional limitations in controlling soil microbial activity.
                                                                  2.2.1   Effect of matric potential
They used nitrifying (ammonium oxidizing) bacteria as a
model system, in which nitrification rate was considered a        Here we propose an exponential equation to describe the de-
surrogate for microbial activity. In the first experiment, they   pendence of soil microbial activity on water potential,
used well-mixed soil slurries, in which NH4 was maintained
at high concentrations and osmotic potential was regulated        κψ = eλψ ,                                                   (7)
by the addition of K2 SO4 . In a companion experiment, they       where λ (kPa−1 ) is a factor that represents the dependence
incubated moist soils at a wide range of matric potential         of respiration rate on matric potential. Note that κψ ≤ 1 be-
and kept N level elevated by the addition of NH3 gas. In          cause matric potential cannot be positive (ψ ≤ 0). This trend
the former experiment, the nitrification rate declined expo-      is assumed to account for the decline in population of de-
nentially with reduction in water potential of the slurries (0    composers as well as reduced per capita activity at very
to ∼ −4000 kPa). The latter experiment exhibited a steeper        low water potentials. The model fits well the trend of nitri-
decline of nitrification across the same range of total wa-       fication in slurries observed by Stark and Firestone (1995)
ter potential as the first experiment, demonstrating that dif-    (λ = 5.8 × 10⁻⁴ kPa−1 ) and the survival probability of fungi
fusional limitation exacerbates the cytoplasmic-dehydration       in the absence of diffusion limitation observed by Tres-
effect of lower total water potential. Similarly, Tresner and     ner and Hayes (1971) (λ = 7.58 × 10⁻⁵ kPa−1 ). Here we
Hayes (1971) showed that in the absence of diffusion lim-         utilize the geometric mean of these two coefficients (λ =
itation the survival probability of fungi declines with water     2.1 × 10⁻⁴ kPa−1 ) to account for the fact that both bacteria
potential. Therefore, we treat the effects of (a) reduced dif-    and fungi are involved in soil respiration and that nitrifica-
fusion (which depends on water content) on accessibility of       tion is more sensitive to resource limitation than respiration
SOC (Davidson et al., 2012) and (b) reduced matric potential      (Schjønning et al., 2003; Scott et al., 1996). A comparison
on cytoplasmic dehydration as distinct interacting factors.       between the proposed trend and the dimensionless nitrifica-
   Another moisture-related factor that impacts the rate con-     tion data of Stark and Firestone (1995) is shown in Fig. 2c.
stant of decomposition by aerobic processes is availability       The steepest decline in effective microbial activity occurs in
of dissolved O2 in pore water. Because diffusion of aqueous       the range −104 ≤ ψ ≤ −102 kPa. Note that although the pri-
O2 is 4 orders of magnitude slower than that of gaseous O2 ,      mary state variable in Eq. (7) is matric potential, it is tacitly
gas diffusivity is the primary factor that indicates O2 lim-      assumed that the equation also accounts for the decrease in
itation in SOM dynamics (Skopp et al., 1990). Schjønning          osmotic potential that accompanies concentration of solutes
et al. (2003) compared the nitrification rate of cores sam-       in drying soils (Chowdhury et al., 2011b).
pled from three soils of contrasting textures and equilibrated
at seven matric potential levels, −0.015 to 1.5 kPa, near the     2.2.2   Effect of dissolved oxygen
wet end of the moisture spectrum. They observed nitrifica-
tion rates increased in all soils as water content was reduced    Following Skopp et al. (1990), we assume the relative de-
from saturation, and then decreased with further decline in       pendence of SOM decomposition on dissolved O2 can be ex-
water content. The initial increase was not correlated with       plained by the relative gas-phase diffusivity, which in turn is

Biogeosciences, 16, 1187–1209, 2019                                                    www.biogeosciences.net/16/1187/2019/
T. A. Ghezzehei et al.: On the role of soil water retention characteristic on aerobic microbial respiration 1191
Figure 2. Relative contributions of (a) air diffusion on access to O2 , (b) aqueous diffusion limitation on substrate access, (c) limiting effect
of water potential on microbial activity, and (d) the combined effect of the three factors for a soil characterized by a unimodal SWC curve
shown in Fig. 1.
inversely correlated with tortuosity of the gas phase, The parameter κa.min represents the minimum relative SOM
decomposition rate when the soil is fully saturated and the O2
Dg 1 supply rate is at its lowest. A value of κa.min ≈ 1 implies that
κa = ∝ , (8)
Dg, 0 τa no O2 limitation would occur even when the local supply rate
is at its lowest. One possible cause for such a phenomenon
where Dg, 0 and Dg are diffusivities in open air and soil, re-
could be inherently low O2 demand because of other lim-
spectively, and τa is tortuosity of the gas phase. Here we use
iting factors (e.g., lack of essential nutrients or presence of
the well-known parameter free Bruggeman expression for
inhibiting factors). It is also reasonable to expect high values
tortuosity τ = a −1/2 , where a = φ − θ is the air-filled poros-
of κa.min for well-aerated conditions (e.g., shallow soil depth
ity (Pisani, 2011). However, this model does not account for
or small samples), in which gaseous O2 replenishment oc-
the distance from the air-exposed soil surface. In lab incuba-
curs readily. In contrast, when the inherent respiration rate is
tion studies, short cores and/or cores with large exposed sur-
high (e.g., substrate and essential nutrients are abundant and
faces do not exhibit significant O2 limitation as the average
minimal inhibiting factors exist) or the rate of replenishment
diffusion distance is short. Conversely, in field conditions,
is slow (e.g., deep within soil profile), the value of κa.min is
O2 availability becomes increasingly limiting with depth as
expected to approach zero. Further controlled experiments
transport length increases and cumulative O2 consumption
are needed to better constrain how this parameter varies with
increases (Angert et al., 2015). Therefore, we add a correc-
depth or the inherent O2 demand of soils. The effect of κa.min
tion term that accounts for these variations,
on the overall trend of the relative decomposition rate is il-
φ − θ 1/2
lustrated in Fig. 2a.
κa = κa.min + (1 − κa.min ) . (9)
φ
www.biogeosciences.net/16/1187/2019/ Biogeosciences, 16, 1187–1209, 20191192 T. A. Ghezzehei et al.: On the role of soil water retention characteristic on aerobic microbial respiration
2.2.3 Effect of water content on substrate accessibility (Eq. 9), and accessibility of SOM (Eq. 10),
Water content also determines substrate accessibility to de- K(θ, ψ) =
composer microorganisms, thereby influencing the rate of ! 1/2
φ − θ 1/2
λψ θ
SOM decomposition. Aqueous-phase diffusivity of soluble e κa.min + (1 − κa.min ) . (12)
φ φ
substrates becomes increasingly limited as liquid-phase con-
nectivity is reduced and transport distance increases (Mol-
Moisture sensitivity calculated using a typical unimodal
drup et al., 2004; Skopp et al., 1990). We assume the frac-
SWC is illustrated in Fig. 2d. Note that a closed-form so-
tion of the active SOC pool that is accessible to decomposers
lution for the integral in Eq. (11) exists only at steady water
scales with relative aqueous diffusivity. Therefore, the acces-
content and water potential status, leading to a simple closed-
sible fraction of the SOC pool is proportional to the liquid-
form solution,
phase tortuosity. Here, we use the Bruggeman expression for
tortuosity, C (t) = C0 e−κo K(θ, ψ) t . (13)
CA Dw 1
1/2
θ These solutions have only two free parameters, which are not
= ∝ = , (10) dependent on water content: initial fraction of the active pool
C Dw, 0 τw φ
C0 and the maximum decay rate κo . Water content and ma-
tric potential are linked via the appropriate SWC equation
where CA stands for the fraction of the active pool of SOC (Eq. 2 or 3). Variations in SOM decomposition between dif-
that is accessible to decomposers at the ambient moisture ferent water content levels are explained by independently
level (Fig. 2b), Dw, 0 and Dw are diffusivities in free wa- determined SWC. It is important to note here that charac-
ter and soil, respectively, and τw is tortuosity of the liquid terization of SWC has become more accessible in the past
phase. Similar concepts have been successfully used to de- decade with the introduction of apparatus that rely on evapo-
scribe diffusion limitation on substrate accessibility indepen- ration rather than regulated pressure (Schindler et al., 2010).
dently from biogeochemical reaction rates (Tang and Riley, Moreover, pedotransfer functions that predict SWC param-
2013; Yan et al., 2016; Manzoni et al., 2016). Equation (10) eters from routinely measured soil properties (e.g., texture,
implies that the active pool is accessible in its entirety when bulk density, and SOM) are becoming increasingly more re-
soil pores are saturated with water. Additionally, it is pos- liable (Zhang and Schaap, 2017)
sible to experience a reduction of the absolute quantity of For comparison with incubation experiments, cumulative
substrate in aqueous phase solution as the increased concen- CO2 −C evolution can be evaluated by subtracting the dy-
tration of dissolved substrates induces sorption (complexa- namic SOC content (Eq. 10 or 11) from the initial active
tion with mineral surfaces; Šimůnek et al., 2016). This latter stock.
effect, which requires inclusion of reactivity of the mineral
surfaces, is not incorporated into this study but can be read- CCO2 (t) = C0 − C(t), (14)
ily added if the requisite properties of the solid phase and
SOM are known. where CCO2 stands for the cumulative evolved C expressed
as a fraction of the initial SOC.
2.2.4 Integrated model 2.3 Data for model testing
The SOM dynamics under arbitrary fluctuation of soil water Testing the validity of the model in simulating SOM dynam-
status (i.e., θ (t) and ψ(t)) can be described by rearranging ics requires cumulative CO2 −C evolution data from incuba-
Eq. (5), subject to initial active pool of SOC, C (t = 0) = C0 , tion experiments conducted at multiple constant water con-
as tent levels as well as knowledge of concurrent water content
and matric potential values. We obtained laboratory incuba-
Zt
tion data that meet these requirements, comprising 31 soils,
C (t) = C0 exp −κo K(θ (τ ), ψ(τ ))dτ , (11) from four published sources. These soils span a wide range
of textural classes, SOM concentrations, and soil structural
0
states. Three of the studies were from experiments conducted
at a steady wetness level and one is from a study involving
where τ is a dummy variable of integration and drying and episodic rewetting. A summary of the datasets
K(θ (t), ψ(t)) is the moisture sensitivity function (which used is given in Table 1. The datasets used are described
varies with time for the nonsteady moisture regime). An briefly below. The fact that none of the datasets include fully
expression for K is derived by combining modifiers that saturated soil is recognized as a drawback in the present state
represent effects of matric potential (Eq. 7), O2 diffusion model validation.
Biogeosciences, 16, 1187–1209, 2019 www.biogeosciences.net/16/1187/2019/T. A. Ghezzehei et al.: On the role of soil water retention characteristic on aerobic microbial respiration 1193
Table 1. Description of datasets used for model evaluation.
Study Arnold Don Franzluebbers Miller
Number of soil types 9 1 15 × 2 1
Water content levels 5 5 8 4
CO2 efflux measurements 11 767 3 1
Incubation duration (days) 395 31 24 110
Incubation temperature (◦ C) 20 21 25 lab
SWC type bimodal unimodal unimodal bimodal
Arnold et al. (2015). They incubated soils from high- and semiarid environments. Sandy clay loam soil sam-
elevation meadows in the Sierra Nevada, California, at ples collected from the Sequoia National Park, with a
five different water potentials (−10 to −400 kPa) and C concentration of 2.3 % were incubated in centrifuge
measured the CO2 efflux 11 times over 395 days. Soil tubes. The tubes were wetted to 60 % water holding ca-
samples were collected from three distinct hydrologic pacity (WHC) and then allowed to dry by evaporation
regions within the meadow area (wet, intermediate, and until they were due for rewetting treatment. WHC was
dry) at three depths. The wet meadow soils were classi- defined as the gravimetric water content of saturated
fied as a fibrous peat in the surface layer, but the inter- soil allowed to drain for 6 h. Four- and 2-week rewet-
mediate and dry locations had mineral soils with high ting intervals were tested over a 16-week incubation
organic matter content. SWC data were collected on period. Daily CO2 efflux and water content (expressed
separate samples using a pressure-plate apparatus. All in terms of WHC) were provided. The corresponding
the SWC data were fitted with the bimodal SWC model matric potential values were inferred from a unimodal
of Durner (1994) because they exhibited the character- SWC curve (van Genuchten, 1980) representative for
istic rapid decrease in water content at low suction. The the textural class (Schaap et al., 2001).
best-fit SWC curves were used to estimate the water
content levels of each treatment. 2.4 Fitting of model to data
Franzluebbers (1999). They collected samples from The first step of fitting the model to experimental data in-
the surface (0–10 cm) of 15 variably eroded soils of volves calculating the concurrent water content and matric
the Madison-Cecil-Pacolet, near Farmington, Georgia. potential levels at all times as described above. For each of
Samples were packed into bottles at two bulk density the unique soil types considered, the cumulative CO2 ef-
levels: naturally settled and lightly compressed. The re- flux data from all the different water content levels were
sulting 30 distinct soils were incubated at eight water fitted together by optimizing the initial fraction of the ac-
content levels and CO2 efflux was measured three times tive pool C0 and the maximum decay rate κo , using a non-
over an incubation period of 24 days. Matric potentials linear Levenberg–Marquardt algorithm implemented in the
of the samples were measured at the end of the incuba- minpack package (Elzhov et al., 2016) of R (R Core Team,
tion experiment by the filter-paper method. A digitized 2017). For all the soils used in this study, we tested two val-
version of this dataset was published as supplemental ues of the parameter that represents O2 limitation in saturated
material by Moyano et al. (2012). soils (κa.min = 0.2 and 0.8). The data–model comparisons re-
A. Don (Moyano et al., 2012). Additionally, a previously ported use κa.min = 0.2, which corresponds to 90 % O2 in the
unpublished dataset by Axel Don, that included a 32- single aggregate level model of Ebrahimi and Or (2016). The
day incubation of one soil at five water content levels relationships between κa.min and soil depth, soil type, and
was obtained from the supplemental dataset published sample size (for lab experiments) need further investigation.
by Moyano et al. (2012). CO2 efflux data were pro-
vided hourly. Matric potential values were inferred from
a unimodal SWC curve (van Genuchten, 1980) that was 3 Results
estimated using the pedotransfer function ROSETTA
(Schaap et al., 2001). Simultaneously measured water content and matric poten-
tial data from the studies of Arnold et al. (2015) and Fran-
Miller et al. (2005): they performed a laboratory in- zluebbers (1999), along with the best-fit bimodal and uni-
cubation to evaluate the impact of short-term fluctua- modal SWC curves, are reported in Figs. 3 and 4, respec-
tions in soil moisture on long-term carbon and nitrogen tively. The best SWC parameters of all the soils used in
dynamics. The study was designed to mimic seasonal this study are reported in Table A1. The SOM-rich meadow
wetting of dry soils that is characteristic to many arid soils of Arnold et al. (2015) were developed in a cold
www.biogeosciences.net/16/1187/2019/ Biogeosciences, 16, 1187–1209, 20191194 T. A. Ghezzehei et al.: On the role of soil water retention characteristic on aerobic microbial respiration
lower porosity than their naturally settled counterparts across
all textures investigated. The water content decreased con-
tinuously as the matric potential was lowered progressively.
However, the compressed soils needed lower matric poten-
tial to drain to the same level of wetness. This indicates that
compression caused the pores to shrink across most of the
pore-size distribution.
In the proposed model, sensitivity of SOM decomposition
to soil moisture dynamics is explained in its entirety by the
SWC, which directly dictates air content, water content, and
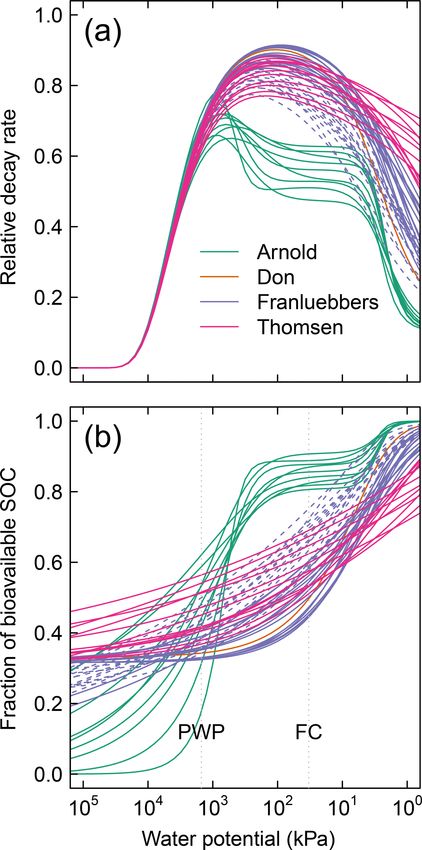
matric potential. Moisture sensitivity curves of all soils cal-
culated using Eq. (11) are depicted in Fig. 5. The difference
between the soils with unimodal and bimodal SWC curves
is mostly reflected in the water potential range for peak de-
composition. In addition, compaction results in a shift of the
moisture sensitivity curves to the dry end, which is a reflec-
tion of reduced mean pore size.
Temporal CO2 evolution data for a subset of SOM-rich
meadow soils (0–10 cm; Arnold et al., 2015) are compared
with best-fit model simulations in Fig. 6. We assumed com-
paction does not alter the optimal decay rate and active pool.
Thus, the datasets from the naturally settled and compacted
samples were fitted with common parameters. As indicated
above, only the initial fraction of the active pool C0 and the
optimal decomposition rate κo were optimized for each of
the soils. The complete set of best-fit plots and fitted param-
eters are given Fig. A2. For the mineral soils of Franzlueb-
bers (1999), the final SOC loss during a 24-day incubation is
compared with model fits in Fig. 7. The corresponding tem-
poral CO2 evolution data and best-fit model simulations for
all the mineral soils are depicted in Fig. A3. Bulk density
levels of individual samples of the same soil that were in-
cubated at different levels of matric potential were not con-
sistent. Bulk densities of individual samples are indicated
Figure 3. Water retention characteristics of meadow soils (Arnold
within each subpanel in Fig. A3. Due to the variation in bulk
et al., 2014) that were used to derive the relative effect of water densities, the differences between compacted and naturally
potential on overall mineralization rate. settled samples were not consistent across the matric poten-
tial spectrum. Therefore, in fitting SWC curves to the soil wa-
ter content and matric potential, intersample heterogeneities
were not accounted for. The mismatch between measured
high-altitude environment where estimated annual input of and simulated CO2 evolution includes this discrepancy. Tem-
SOM far exceeds decomposition. In these soils, SOM con- poral CO2 evolution data and best-fit model simulations for
tent and porosity decrease with depth in all three hydrologic all the mineral soil of Don (Moyano et al., 2012) are depicted
regimes. SOM and porosity across the three sites are ranked in Fig. A4. The best-fit model parameters for all the soils are
as wet > intermediate > dry. All the meadow soils studied provided in Table A1.
exhibit two distinct pore-size classes representing (a) large The best-fit optimal decay rates for all the steady-
pores between decomposing fibers of organic matter (in the moisture experiments are plotted against (Fig. 8a) SOC and
surface peats) and between aggregates (in the subsoils) and (Fig. 8b) the initial active fraction of SOC (C0 ), and incu-
(b) finer pores between processed SOM and mineral frac- bation period in Fig. 8. The overall SOC decomposition rate
tions. The macropores of these soils drain when subjected (log(κo )) was negatively correlated with both log(SOC) and
to low suction (approx. −5 kPa). However, the soils remain log(C0 ). These correlations suggest that, in the long run, ac-
fairly wet until they are subjected to matric potentials lower cumulation of high SOC leaves behind C that recycles at an
than approx. −300 kPa. increasingly slower rate. Furthermore, comparison of Fig. 8a
The mineral soils, in contrast, exhibited unimodal SWC and b suggests that soils with higher SOC are also likely to
(Franzluebbers, 1999). The compressed samples had slightly have a higher proportion in the active pool (C0 ). However,
Biogeosciences, 16, 1187–1209, 2019 www.biogeosciences.net/16/1187/2019/T. A. Ghezzehei et al.: On the role of soil water retention characteristic on aerobic microbial respiration 1195 Figure 4. Soil moisture characteristics of soils analyzed by Franzluebers (1999); symbols are measured values and lines are van Genuchten model fits. The best-fit n parameters are shown. Soils at natural (triangle symbol and dashed line) and compacted (circle and solid lines) states were studied. these interpretations should be taken with caution consider- Finally, the measured CO2 evolution data from all the three ing the duration of the incubation experiments of Franzlueb- studies (1375 data points representing 40 different soils) are bers (1999) and Don (unpublished data cited in Moyano et compared with the model fits in logarithmic scale and lin- al., 2012) were much shorter than that of Arnold et al. (2015; ear scale (inset) in Fig. 9. The color intensity of the points 24 and 31 days vs. 395 days, respectively). reflects the density of data points. Overall, the model is in www.biogeosciences.net/16/1187/2019/ Biogeosciences, 16, 1187–1209, 2019
1196              T. A. Ghezzehei et al.: On the role of soil water retention characteristic on aerobic microbial respiration

                                                                         at the initial measurement period, which is assumed to re-
                                                                         flect a significant intersample difference. Therefore, a second
                                                                         model fit was conducted by treating the two intervals sepa-
                                                                         rately (Fig. 10c). The efflux of CO2 immediately after rewet-
                                                                         ting was consistently much higher than subsequent readings
                                                                         at comparable wetness level. This effect of drying and rewet-
                                                                         ting, the Birch (1958) effect, is not accounted for in the pro-
                                                                         posed model.

                                                                         4   Discussion

                                                                         In the remainder of the discussions, soil matric potential is
                                                                         considered the primary independent state variable, while wa-
                                                                         ter content and decomposition modifiers are all functions that
                                                                         depend on water potential. For all the soils investigated, the
                                                                         peak decomposition rate was approximately 60 % (Fig. 5)
                                                                         of the optimal rate that would occur if aqueous diffusion,
                                                                         gaseous diffusion, and water potential were not limiting.
                                                                         Thus, in soils where one or more of these factors are limiting
                                                                         across the spectrum of possible moisture range, SOM decom-
                                                                         position occurs under a suboptimal rate. The individual con-
                                                                         tributions of these limiting factors are shown in Fig. A1. The
                                                                         effect of water potential is assumed to be due to matric poten-
                                                                         tial only. This assumption ignores an increase in solute con-
                                                                         centration during drying and associated decrease in matric
                                                                         potential. The limiting effects of aqueous and gaseous diffu-
                                                                         sion directly depend on water content and porosity, therefore
                                                                         depending on SWC.
                                                                            Soils with a broad range of pore-size distribution drain in-
                                                                         crementally over a wide range of matric potential, thus main-
                                                                         taining a broad range of favorable moisture status. This is
                                                                         clearly demonstrated in the contrast between the moisture
                                                                         sensitivity of the meadow soils and the rest of the soils.
Figure 5. Effective soil moisture sensitivity functions for all soils.   Most of the meadow soils show peak decomposition be-
These curves were calculated as illustrated in Fig. 2 using κa.min =     tween −1000 and −10 kPa, with a rapid drop in decompo-
0.8 (a) and κa.min = 0.2 (b). The dashed lines of the Franzluebbers      sition when approaching saturated conditions. Recall that the
soils denote compressed samples. The shaded region (−300 ≤ ψ −           minimum effective rate for saturated soils varies with κa.min ,
100) denotes the typical range of field capacity.                        which reflects distance from the soil surface (see Fig. 2a).
                                                                         The value of this parameter is likely to be lower in field con-
                                                                         ditions than for experimental cores. The rest of the mineral
excellent agreement with experimental observations across                soils exhibit peak decomposition over a narrow range of ma-
the full range of measured data.                                         tric potential. The peak for the latter generally occurs at a
   Comparisons of CO2 evolution data of Miller et al. (2005)             moisture level wetter than field capacity. Compression of the
under drying and rapid-wetting conditions with model sim-                mineral soils studied by Franzluebbers (1999) lowered the
ulations are shown in Fig. 10. The fluctuation in the CO2                matric potential at which peak rate occurs. This is to be ex-
evolution rate is explained by the dynamics of water con-                pected as compression reduces the pore sizes, thereby de-
tent (Fig. 10a) and matric potential. Because a closed-form              creasing the matric potential needed to drain the pores.
solution does not exist for arbitrary fluctuations of soil mois-            Application of the proposed model requires availability of
ture, the integral in Eq. (10) was evaluated numerically. Two            water retention characteristic, which may pose a practical
sets of model fits were performed. In the first, data from the           limitation in cases when water retention data cannot be read-
2- and 4-week rewetting intervals were fitted together using             ily acquired. Availability of only a handful of datasets that we
one set of initial fraction of the active pool C0 and the op-            could use for testing the proposed model, despite the fact that
timal decomposition rate κo (Fig. 10b). However, as shown                decomposition experiments at varying moisture statuses have
in Fig. 10, the two intervals started with a distinct difference         been done numerous times, is clear evidence of this chal-

Biogeosciences, 16, 1187–1209, 2019                                                           www.biogeosciences.net/16/1187/2019/
T. A. Ghezzehei et al.: On the role of soil water retention characteristic on aerobic microbial respiration 1197 Figure 6. Evolution of CO2 during a 395-day incubation of soils collected from SOM-rich meadow soils (Arnold et al., 2015) over a wide range of water potentials. Data from only 0–10 cm depth are shown; other depths are provided in the Appendix. Soils from three hydrologic regimes are shown in the three rows: W is wet (top row), I is intermediate (middle row), and D is dry (bottom row). The columns represent equilibrium matric potential conditions. lenge. As a stopgap measure, it is possible to use pedotransfer and aggregation, are not accounted for in these moisture sen- functions to infer SWC parameters based on routinely mea- sitivity curves. sured soil characteristics such as texture, bulk density, and It is informative to compare the above results with data- organic matter content (Vereecken et al., 1989; Schaap et al., driven (statistical) moisture sensitivity functions derived by 2011; Van Looy et al., 2017). The application of pedotrans- Moyano et al. (2012; see their Fig. 3). In both models, the fer functions in predicting moisture sensitivity (Eq. 12) is il- matric potential at peak relative respiration decreases (be- lustrated in Fig. 11. The SWC parameters of each class were comes more negative) with increasing clay content (degree generated by the ROSETTA pedotransfer model, using class- of textural fineness). However, the models differ in their average sand, silt, clay, and SOM content as well as bulk prediction of the range of matric potential at which respi- density in the model database (Schaap et al., 2011). As in ration remains elevated. Our model shows a distinct peak Fig. 5, two values of the parameter κa.min (0.2, and 0.8) were of respiration over a very narrow range for the two coars- tested and the results are reported as functions of matric po- est textures (sand and loam sand), whereas the curves pre- tential and relative moisture saturation. These curves clearly dicted by Moyano et al. (2012) have a similar overall pat- show textural effects on SOC dynamics. The coarse-textured tern across the entire range of clay content analyzed. The soils (sand and loamy sand) exhibit optimal respiration rates most remarkable difference appears in the moisture sensi- over a narrow range of matric potential that exceeds field ca- tivity functions expressed as functions of relative saturation. pacity, whereas fine-textured soils (sandy clay, silt clay, and The model of Moyano et al. (2012) predicts that respiration clay) exhibit a broader matric potential range of optimal res- decreases nearly linearly until the soils are completely dry piration rate, which is on the order of −1000 to −100 kPa. (saturation = 0). Whereas our model suggests that respira- In terms of effective saturation, the parameter κa.min plays tion ceases when the saturation drops to residual moisture the most significant role in determining the optimal satura- content. The prediction is based on the fact that in very dry tion level. At κa.min = 0.2, the value that was used for testing soils, the matric potential decreases very rapidly with very the model against respiration data, the optimal effective satu- small decrease in water content. Therefore, the prediction of ration is approximately equal to 0.6. Other factors related to our model in the dry end appears sound. Another distinc- soil texture and structure, including mineralogy, surface area, tion between the two models is related to the role of SOM www.biogeosciences.net/16/1187/2019/ Biogeosciences, 16, 1187–1209, 2019
1198            T. A. Ghezzehei et al.: On the role of soil water retention characteristic on aerobic microbial respiration

Figure 7. Comparison of total SOC loss during a 24-day incubation of 15 soils analyzed by Franzluebers (1999) (at naturally settled and
compressed states); symbols are measured values and lines are model simulations using van Genuchten SWC curves and decomposition
parameters, C0 and κo , fitted individually to each of the 15 soil types.

in moisture sensitivity. Although our model does not directly         primary variable that confounds our ability to predict how
incorporate the effect of SOM in moisture sensitivity, the ef-        soils in all climate zones will respond to perturbations, both
fect of SOM or SWC would also be reflected as a variation             human-induced or naturally caused (Wieder et al., 2017).
in moisture sensitivity with change in SOM. In contrast, the          This model provides one approach to bridging that gap (Kle-
model of Moyano et al. (2012) predicts no effect of SOM               ber, 2010; Schmidt et al., 2011). The model has been ap-
moisture sensitivity function.                                        plied to a wide range of soil types highlighting the critical
                                                                      but underrepresented role that soil structure and water play.
                                                                      Results shown in Fig. 5 suggest that peat and organic soils
5   Summary and conclusions                                           (Arnold et al., 2015), once drained below a threshold, are
                                                                      prone to rapid loss of SOC over a wide range of water po-
Knowledge of controls on soil C dynamics has improved in              tential, as their bimodal pore-size distribution allows them
recent years and the focus has switched from predominantly            to retain sufficient moisture to promote microbial activity.
molecular level controls on SOM decomposition/stability to            The effect of warming on increasing microbial activity and
a broader recognition that environmental and physical condi-          rapid C loss from cold high-altitude and high-latitude envi-
tions are more important controls on persistence of SOM.              ronments has received considerable attention in recent years
While the influence of temperature on SOM decomposi-                  (Wieder et al., 2017). SOM in these regions has been pro-
tion has received considerable attention, water remains the

Biogeosciences, 16, 1187–1209, 2019                                                        www.biogeosciences.net/16/1187/2019/
T. A. Ghezzehei et al.: On the role of soil water retention characteristic on aerobic microbial respiration 1199
Figure 8. Relationships between fitted overall decomposition rate
κo with (a) the total SOC and (b) the fitted active fraction of SOC
C0 .
Figure 10. Model evaluation by comparison with experiment of
Miller et al. (2005) under drying and rapid-wetting conditions (2-
and 4-week intervals): (a) observed dynamics of water holding ca-
pacity; (b) comparison of measured CO2 efflux with model pre-
diction assuming identical optimal decomposition rate κo for both
wetting intervals; and (c) same as above but with different κo pa-
rameters for the two wetting intervals.
suggests that disturbance of aggregated soils initially pro-
motes rapid mineralization by widening the pore-size distri-
bution. This mechanism is in addition to the oft-credited lib-
eration of SOM protected inside soil aggregates. However,
Figure 9. Comparison of model simulations with measured cumula-
tive CO2 evolution data from all incubation studies at steady-water
with repeated wetting–drying cycles, the soil structure is re-
content. stored to its pre-tillage state by slaking of aggregates or re-
consolidation by capillary forces (Ghezzehei and Or, 2000;
Liu et al., 2014; Or et al., 2000). Therefore rapid loss of C in
tected in part by anoxic conditions. The model proposed here tilled soils is likely to be short-lived. If true, this self-limiting
suggests these soils are prone to accelerated loss of SOM due phenomenon is likely to have had a beneficial effect in pre-
to the extended water potential range for peak decomposi- industrial agriculture, when crop nutrition was derived by re-
tion afforded to them by virtue of their pore structure. This cycling of SOM. High demand for nutrients during the early
hypothesis has yet to be tested (Ise et al., 2008). season is matched by rapid mineralization, while a slowdown
The above observations also show the importance of dy- later in the season protects SOM for subsequent seasons. To
namics of the physical structure of soils (e.g., tillage or slak- address these effects of soil structure dynamics, it is impor-
ing) in regulating SOM dynamics. For example, this model tant to incorporate the effect of soil structure in SWC.
www.biogeosciences.net/16/1187/2019/ Biogeosciences, 16, 1187–1209, 20191200 T. A. Ghezzehei et al.: On the role of soil water retention characteristic on aerobic microbial respiration
Figure 11. Textural effect on moisture sensitivity.
The assumptions underlying the proposed model need to between biogeochemical cycling and soil hydrology over a
be tested and evaluated for a wide range of soil environments. wide range of temporal and spatial scales.
It is likely that sensitivity to water potential varies across
soil types and the specific microbial communities. There-
fore, variations in the slope of the water potential sensitiv- Data availability. All of the datasets used in this study
ity curve λ across soil types and environments need to be and the R codes used to analyze the data and pro-
evaluated. Contribution of salinity to total water potential is duce the figures included in this paper are available at
not accounted for here. Provided that total solute concentra- (https://doi.org/10.6084/m9.figshare.7749332.v1, Ghezzehei
et al., 2019).
tion remains constant, it is possible to estimate the dissolved
fraction and its osmotic potential using sorption–desorption
isotherms. However, in soils that regularly receive consider-
able salt inputs (e.g., saline irrigation water, fertilizers, atmo-
spheric depositions), complete solute balance consideration
is necessary.
In summary, the proposed model opens a new way of inter-
rogating the effect of soil structure, structural dynamics, and
hydrologic processes on SOM dynamics. It is a valuable tool
that can support the formulation of testable and quantitative
hypotheses. With proper calibration and testing, this model
has the potential to fill the gap of the much needed coupling
Biogeosciences, 16, 1187–1209, 2019 www.biogeosciences.net/16/1187/2019/T. A. Ghezzehei et al.: On the role of soil water retention characteristic on aerobic microbial respiration 1201
Appendix A
Table A1. Best-fit water retention curve and SOM dynamics model parameters.
Texture Decomposition Porosity van Genuchten Durner
SOC
Soil source and ID
sand silt clay κo C0 θr θS α n α1 n1 α2 n2 w
(g/g) (−) (−) (−) (yr−1 ) C0 (−) (−) (yr−1 ) (−) (kPa−1 ) (−) (kPa−1 ) (−) (−)
Arnold D.B 0.025 0.650 0.260 0.090 0.005 0.132 0 0.603 NA NA 0.004 1.330 0.413 5.000 0.282
Arnold D.M 0.033 0.650 0.270 0.060 0.009 0.125 0 0.614 NA NA 0.002 2.556 0.397 3.194 0.231
Arnold D.T 0.057 0.670 0.280 0.050 0.010 0.135 0 0.779 NA NA 0.003 1.660 0.376 4.557 0.344
Arnold I.B 0.023 0.610 0.320 0.070 0.003 0.189 0 0.695 NA NA 0.003 1.974 0.395 3.684 0.265
Arnold I.M 0.032 0.640 0.310 0.050 0.004 0.156 0 0.709 NA NA 0.005 1.490 0.338 4.629 0.227
Arnold I.T 0.104 0.710 0.230 0.060 0.011 0.145 0 0.817 NA NA 0.007 1.301 0.386 4.176 0.300
Arnold W.B 0.103 0.730 0.250 0.050 0.001 0.237 0 0.866 NA NA 0.003 1.753 0.391 3.545 0.173
Arnold W.M 0.126 0.640 0.320 0.040 0.001 0.500 0 0.859 NA NA 0.002 3.896 0.404 2.735 0.214
Arnold W.T 0.335 NA NA NA 0.006 0.144 0 0.886 NA NA 0.003 1.800 0.381 4.056 0.327
Don NA 0.011 0.807 0.103 0.090 0.146 0.064 0.050 0.407 0.351 1.763 NA NA NA NA NA
Franz. Comp. F_1 0.014 0.820 0.090 0.090 0.174 0.031 0.036 0.458 0.616 1.398 NA NA NA NA NA
Franz. Comp. F_2 0.015 0.760 0.120 0.120 0.150 0.034 0.048 0.480 0.315 1.523 NA NA NA NA NA
Franz. Comp. F_3 0.020 0.660 0.165 0.175 0.173 0.027 0.000 0.518 0.726 1.236 NA NA NA NA NA
Franz. Comp. F_4 0.011 0.710 0.100 0.190 0.211 0.038 0.020 0.439 0.226 1.336 NA NA NA NA NA
Franz. Comp. F_5 0.013 0.570 0.170 0.260 0.153 0.039 0.000 0.509 0.409 1.216 NA NA NA NA NA
Franz. Comp. F_6 0.014 0.775 0.125 0.100 0.152 0.041 0.035 0.480 0.565 1.415 NA NA NA NA NA
Franz. Comp. F_7 0.021 0.670 0.170 0.160 0.159 0.024 0.000 0.522 0.855 1.249 NA NA NA NA NA
Franz. Comp. F_8 0.029 0.510 0.275 0.215 0.156 0.020 0.000 0.570 0.770 1.223 NA NA NA NA NA
Franz. Comp. F_9 0.017 0.540 0.205 0.255 0.134 0.035 0.000 0.522 0.612 1.221 NA NA NA NA NA
Franz. Comp. F_10 0.012 0.610 0.145 0.245 0.124 0.039 0.017 0.479 0.486 1.320 NA NA NA NA NA
Franz. Comp. F_11 0.014 0.780 0.110 0.110 0.158 0.036 0.024 0.496 0.743 1.375 NA NA NA NA NA
Franz. Comp. F_12 0.015 0.725 0.125 0.150 0.161 0.038 0.018 0.506 0.698 1.307 NA NA NA NA NA
Franz. Comp. F_13 0.016 0.615 0.175 0.210 0.163 0.035 0.000 0.528 0.808 1.234 NA NA NA NA NA
Franz. Comp. F_14 0.019 0.535 0.220 0.245 0.179 0.031 0.000 0.547 1.015 1.233 NA NA NA NA NA
Franz. Comp. F_15 0.016 0.490 0.180 0.330 0.135 0.042 0.000 0.567 0.912 1.204 NA NA NA NA NA
Franz. Nat. F_1 0.014 0.820 0.090 0.090 0.174 0.031 0.052 0.458 0.527 1.694 NA NA NA NA NA
Franz. Nat. F_2 0.015 0.760 0.120 0.120 0.150 0.034 0.055 0.480 0.435 1.756 NA NA NA NA NA
Franz. Nat. F_3 0.020 0.660 0.165 0.175 0.173 0.027 0.059 0.518 1.365 1.374 NA NA NA NA NA
Franz. Nat. F_4 0.011 0.710 0.100 0.190 0.211 0.038 0.053 0.439 0.623 1.504 NA NA NA NA NA
Franz. Nat. F_5 0.013 0.570 0.170 0.260 0.153 0.039 0.046 0.509 1.318 1.310 NA NA NA NA NA
Franz. Nat. F_6 0.014 0.775 0.125 0.100 0.152 0.041 0.055 0.480 0.536 1.772 NA NA NA NA NA
Franz. Nat. F_7 0.021 0.670 0.170 0.160 0.159 0.024 0.059 0.522 0.834 1.479 NA NA NA NA NA
Franz. Nat. F_8 0.029 0.510 0.275 0.215 0.156 0.020 0.000 0.570 1.843 1.262 NA NA NA NA NA
Franz. Nat. F_9 0.017 0.540 0.205 0.255 0.134 0.035 0.000 0.522 2.141 1.237 NA NA NA NA NA
Franz. Nat. F_10 0.012 0.610 0.145 0.245 0.124 0.039 0.057 0.479 0.664 1.701 NA NA NA NA NA
Franz. Nat. F_11 0.014 0.780 0.110 0.110 0.158 0.036 0.056 0.496 0.662 1.709 NA NA NA NA NA
Franz. Nat. F_12 0.015 0.725 0.125 0.150 0.161 0.038 0.058 0.506 0.751 1.655 NA NA NA NA NA
Franz. Nat. F_13 0.016 0.615 0.175 0.210 0.163 0.035 0.059 0.528 0.829 1.499 NA NA NA NA NA
Franz. Nat. F_14 0.019 0.535 0.220 0.245 0.179 0.031 0.062 0.547 1.198 1.485 NA NA NA NA NA
Franz. Nat. F_15 0.016 0.490 0.180 0.330 0.135 0.042 0.063 0.567 1.886 1.358 NA NA NA NA NA
www.biogeosciences.net/16/1187/2019/ Biogeosciences, 16, 1187–1209, 2019You can also read