Brent Inclusive Growth Strategy (IGS): Infrastructure 2019-2040 - Brent Council
←
→
Page content transcription
If your browser does not render page correctly, please read the page content below
Brent Inclusive Growth
   Strategy (IGS):
    Infrastructure

      2019-2040

                         183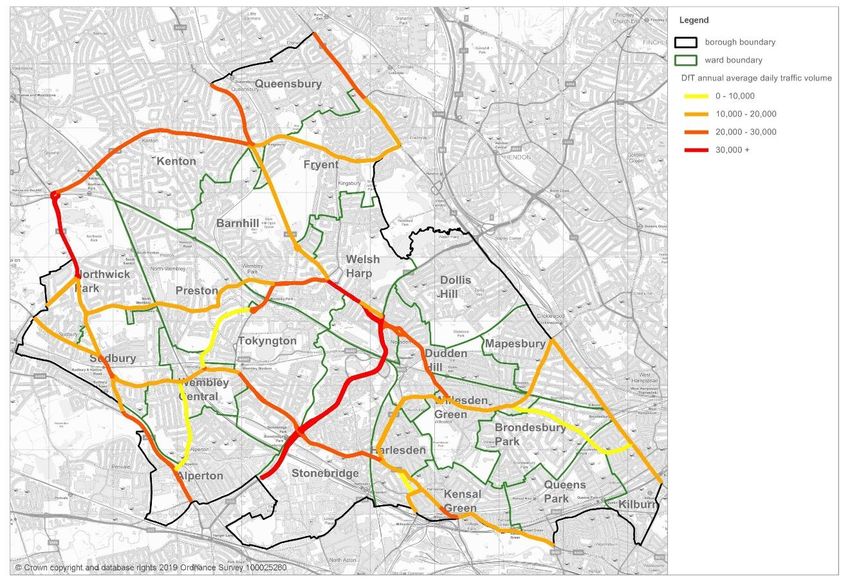
Contents

Executive Summary .......................................................................................................... 185
Introduction ....................................................................................................................... 187
Baseline ............................................................................................................................ 189
   Transport ....................................................................................................................... 189
   Digital ............................................................................................................................ 204
   Water............................................................................................................................. 207
   Energy ........................................................................................................................... 213
Key Trends ....................................................................................................................... 216
   Trend 1. Increased Demand for Public Transport .......................................................... 216
   Trend 2. Increased Cycling and Walking Transport Modes ............................................ 228
   Trend 3. Transportation Technology for Motorised Vehicles .......................................... 231
   Trend 4. Increased Technological Requirements ........................................................... 235
   Trend 5. SMART Infrastructure ...................................................................................... 236
   Trend 6. Growing Water Demand .................................................................................. 236
   Trend 7. Increased Demand for Sustainable Energy Sources ....................................... 240
Responses ........................................................................................................................ 242
References ....................................................................................................................... 244

                                                                                                                                     184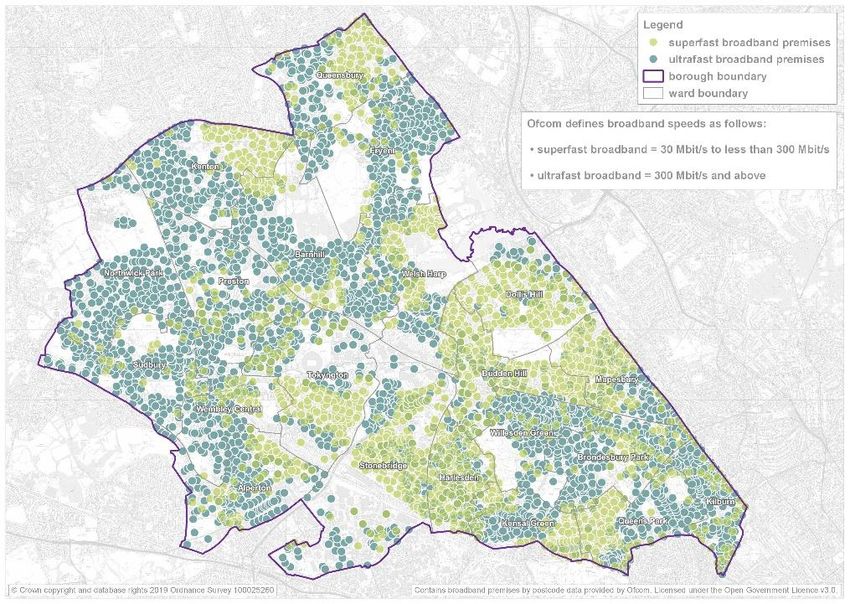
Executive Summary
The next twenty years will bring significant changes to Brent in response to population growth
and climate change pressures. In order to accommodate growth, meet environmental
requirements, and align with national and local policies in London, Brent must consider the
current capacity of existing infrastructure, projected future demands and future policy
changes.
The infrastructure chapter of the Inclusive Growth Strategy (IGS) analyses four main
sub-themes that will shape future considerations in the borough. Current areas of stress and
deficiencies are considered together with the provision of infrastructure capacity related to
transport, digital, water, energy and land available to increase future housing and employment
density. These sub-themes are analysed in the ongoing report, considering the current
situation in Brent and London; its economic and population growth projections; technological
changes; environmental requirements and future policy directions at national and local level.
Consideration includes Brent’s minimum target to deliver 1,525 new homes a year, which has
now almost doubled in the Draft New London Plan to 2,915 new homes a year.
Baseline
Headline findings from base analysis of infrastructure provision in Brent include:
Brent is an Outer London Borough which is well-connected to Central London, but is poorly
connected to other Outer London Boroughs, and to London Heathrow Airport, despite
relatively close geographic proximity.
Public Transport Accessibility Levels (PTAL) are higher in identified growth areas,
although Church End and Alperton have some lower PTAL areas. The northern part of the
borough has an overall lower PTAL.
Proposed transport projects such a Crossrail spur from Old Oak Common to stop at
Wembley Central station and the West Coast Mainline, and the West London Orbital Line,
with stops at Staples Corner, Neasden and Harlesden, would improve business and labour
links, accessibility and demand for housing and commercial uses, and improve PTAL and
reduce reliance in motorised vehicles.
There are 92,100 cars registered in Brent with an average 0.7 cars per household.
7% of Brent’s principle road network length was in poor condition in 2018.
Compared with Outer London, Brent has the largest percentage of daily trips by public
transport, and one of the lowest for motorised vehicles. However, 45% of daily trips in the
borough are by car or motorcycle, increasing management pressure of parking spaces,
congestion and pollution.
Only 1% of Brent’s commuters preferred transport mode is by bicycle. 12,600 trips are
realised in Brent by cycling. Although TfL identified currently Brent’s residents could realise
more than 300,000 trips by cycling.
There are 688 plug-in electric vehicles registered in Brent, 0.6% of the total cars, vans and
motorbikes licensed in the borough.
Around 13% of the Electric Vehicle Charging Points (EVCP) in London are provided in
Brent, however almost 17% of EVCP have technical problems.
Brent has the third highest broadband accessibility amongst the West London Partnership
boroughs and one of the best in London, though there are some “not-spots” where
connectivity is still poor, including Church End and Park Royal. Ultrafast broadband
connections are limited or null in most of the borough
Since 2013 water usage in London is classified with a demand “seriously stressed”
designation and Thames Water indicate demand is reaching current available supply.
185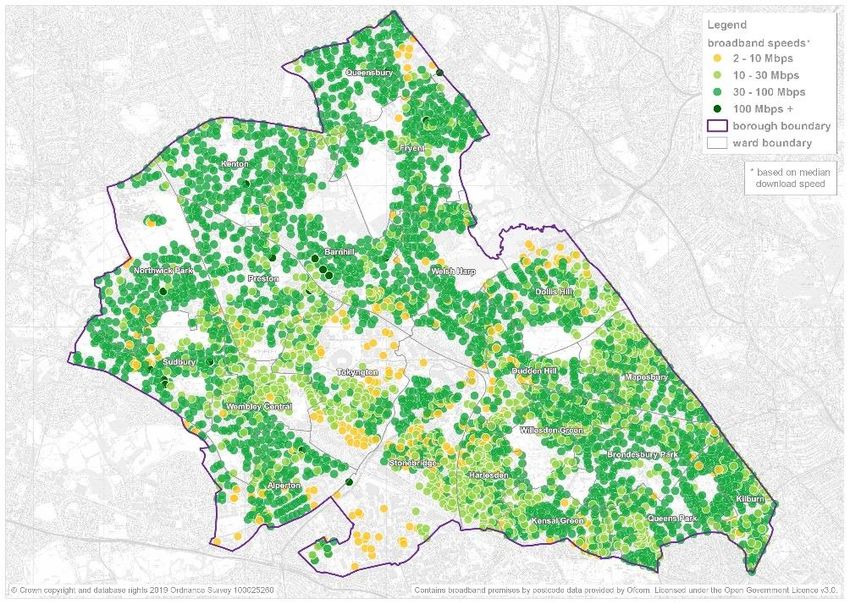
Thames Water Corporation data indicates current domestic water consumption is above
target levels for new properties, and Brent is also identified as one of the boroughs in
London with serious problems of sewer flooding and pollution.
Over half of energy consumption is in the domestic sector. Brent Council is committed to
promote sustainable energy and increased energy efficiencies in the borough, although
there is not enough information about current sustainable energy supplied.
Trends
Assessing and planning to meet future infrastructure demands requires analysis of key trends
that will shape the future of the UK and London, and resultantly impact Brent’s citizens. These
trends inform the Responses section of the infrastructure chapter, outlining policy options that
can accommodate the infrastructure needs of the growing population and ensure that
necessary infrastructure will be provided in Brent to 2040. In the context of the demographic,
economic and environmental changes, the IGS identifies the key infrastructure aspects that
will affect urban growth in Brent as:
1. Increased demand for public transport
2. Increased cycle and walking transport modes
3. Transportation technology for motorised vehicles
4. Increased technological requirements
5. SMART Infrastructure
6. Growing water demand
7. Increased demand for sustainable energy sources
Responses
This report concludes with proposals that Brent Council could take forward to address the
challenges and seize the opportunities in order to provide infrastructure according to the
environmental, economic and health requirements of Brent’s growing population, aligned with
national and local policies in London.
Modal shift away from motorised vehicle use is fundamental. Brent should continue to lobby
for better links into HS2, Crossrail and Thameslink networks, and the West London Orbital
Railway. In parallel, infrastructure is needed to support and encourage active transport modes
– including untapped potential for cycling in the borough – and dialogue increased with TfL
and the Mayor through Healthy Streets for London, to improve cycling, walking and bus
infrastructure, attract local investment into Brent, and develop already-identified potential new
routes and pathways.
Brent has a digital strategy to make Brent a digital place and promote digital inclusion amongst
its population. Digital requirements should be embedded within planning policy and
regeneration strategies, and private partnerships agreed to rollout of 4G, 5G and
superfast/ultrafast broadband. Brent should build on its current pilot of SMART infrastructure
to monitor air quality and parking, and embrace the role big data can play in understanding
population needs and asset management in an urban environment.
Brent supports Thames Water’s plans to provide major new water infrastructure, rollout
metering and water efficiency measures, and reduce leaks. Locally, Brent should raise
awareness of the need for water efficiency, including options to retrofit existing buildings, use
planning policy to secure blue infrastructure and mitigate flood risk, enforce planning and
building control regulations for new development, including use of Sustainable Urban
Drainage Systems (SuDS) and green roofs, and require water management plans for larger
strategic regeneration schemes.
186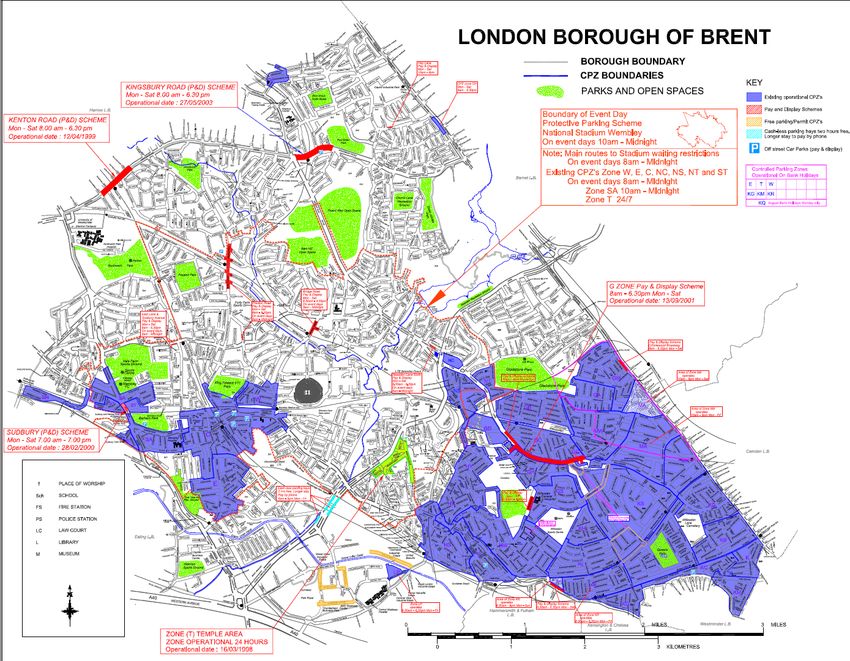
Introduction

Physical and digital infrastructure in Brent is required to underpin minimum projected
population and business growth in the area, maintain the wellbeing of the population, and
enhance the competitiveness and attractiveness of the borough as a place for its residents,
business and entrepreneurs. Infrastructure provision will strengthen Brent’s relations with
Outer London and the West London partnership.

Special focus is required on current areas of stress and deficiencies in infrastructure capacity
related to transport, digital, water, energy and land available to accommodate future housing
and employment densities. These sub-themes are analysed within the context of the economic
and population growth projections, environmental impacts, technological changes and future
policy directions and national and local level in Brent and London. This includes Brent’s target
to deliver a minimum 1,525 new homes a year, which has almost doubled in the Draft London
Plan to 2,915 new homes a year, and the target to convert London to a Zero Carbon city by
2050.

Infrastructure in Brent is analysed with focus on areas that are seeing an increase in
residential, commercial and mixed use development, and that have potential to accommodate
future growth. Identified growth areas in Brent include Wembley, Alperton, Church End, Burnt
Oak/Colindale and South Kilburn, as well as Old Oak and Park Royal. Emerging growth areas
identified in the Local Plan preferred options include Northwick Park, Neasden Station and
Staples Corner.

The Old Oak Park Royal Development Corporation (OPDC) was founded on 1st April 2015.
The OPDC acts as the planning authority for Old Oak and Park Royal, located within Brent,
Hammersmith & Fulham and Ealing. The Old Oak and Park Royal opportunity area will have
a significant impact on infrastructure demands for Brent, as a result of plans for around 14,000
new homes and 37,000 new jobs for the area. Large scale infrastructure projects such as
Crossrail and the new High Speed 2 station in Old Oak Common will help shape London’s
future. Although this regeneration project is managed by the OPDC, the IGS analyses
probable constraints on Brent’s boundaries due to expected increase demand for transport,
water, energy and digital infrastructure. The investment opportunity that OPDC could bring to
Brent is also great, including the potential link to the West Coast Mainline (WCML) at Wembley
Central station, and the more general political and developer attention that OPDC is attracting
to the area.

The expansion plan for Heathrow is analysed due to the positive economic benefits that could
flow to Park Royal, increasing business links and improving international access. This project
will require significant new infrastructure to relieve pressure on the public transport network,
with an expected increase in public transport demand of more than 250%.

The Wembley area is one of the Mayor’s Opportunity Areas for growth with a target for 11,500
new homes and 11,000 jobs to be delivered over the next 15 years, and is analysed due to
transformational changes in density that will increase the demand for infrastructure capacity
in terms of water, energy, digital connectivity and public transport. Particularly for transport,
this report includes the potential development for Crossrail WCML Link station at Wembley
Central.

                                                                                             187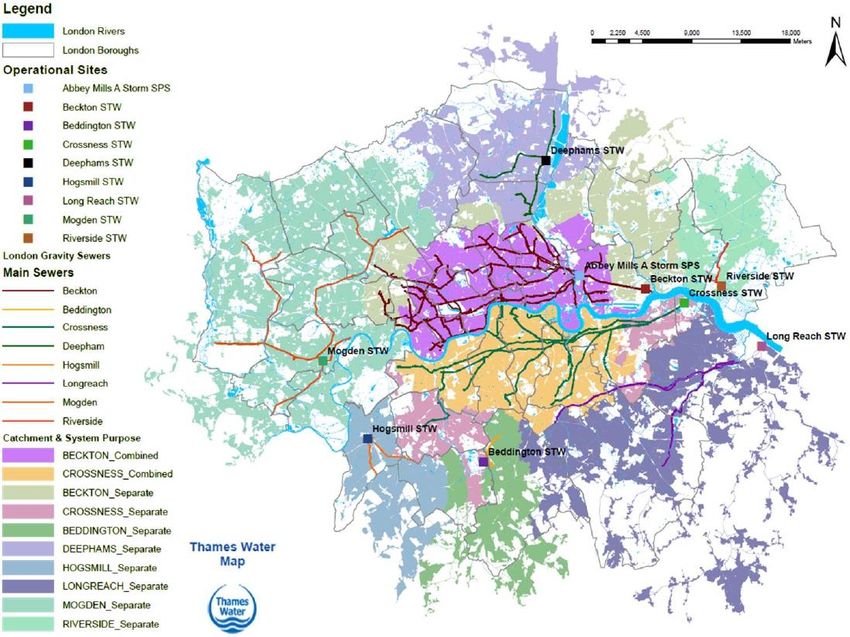
This report is divided into three sections, analysing the main infrastructure capacity and
demand pressures currently in Brent, with particular attention to the “growth” areas previously
mentioned.
The first section describes the current baseline information, considering the most up to
date information and data available for infrastructure in London and Brent. This section
also includes an analysis of Brent compared with Outer London.
The second section includes trends that may affect the specific sub-themes according to
planning policy changes, technological improvements, environmental targets and
population and economic growth.
The third section briefly suggests some policy responses to the challenges and
opportunities presented in this report, for measures that could meet future infrastructure
requirements and reduce capacity deficiencies.
188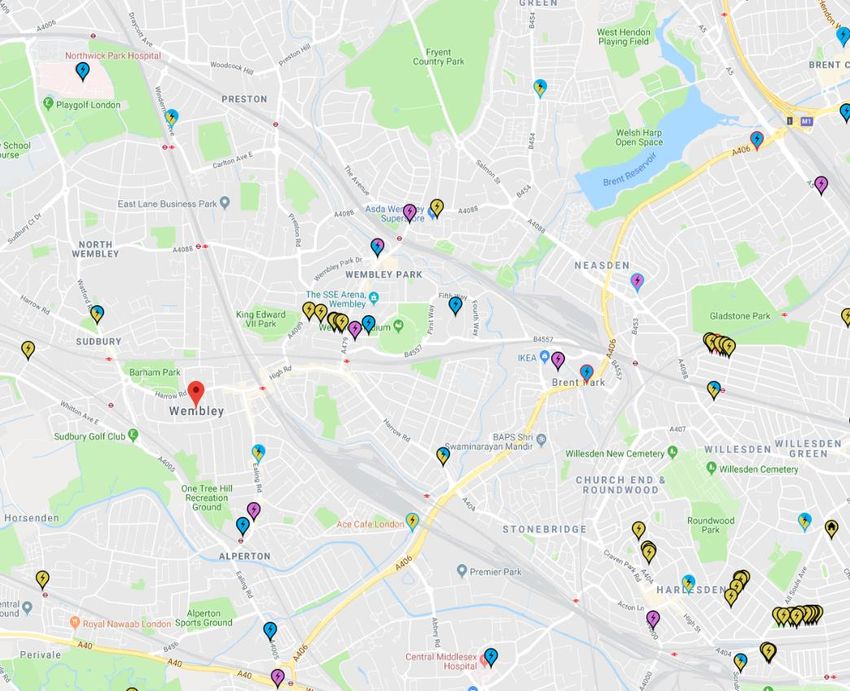
Baseline
Transport

Provision of adequate transport infrastructure that considers anticipated levels of population
and employment growth is essential in order to reduce environmental impacts, delays to
private, business and public transport, and resultant decreases in wellbeing and productivity
levels. In London and Brent the main aims for transport infrastructure are to reduce congestion
and encourage the use of sustainable modes of transport.

Road Network

Brent is well-connected by road to central and other parts of West London. Average vehicle
delays are lower in Outer London than Inner or Central London, although heavy road transport
and pockets of localised congestion continue to put pressure upon parts of the borough and
network. Traffic congestion is especially concentrated in central wards and along the North
Circular Road. High levels of congestion reduce the quality of life of Brent residents and have
a negative effect on economic growth. The map below shows daily traffic flow, where red
indicates the most congested roads (Figure 132).

             Figure 132: Annual Average Daily Traffic Volume All motor vehicles

                                       Source: Ordnance Survey

To reduce congestion in Brent it is important to encourage alternative sources of transport,
and provide adequate road network maintenance. Brent has recently improved the condition
of its highway assets, which is important for freight services that rely on this network and
serve a number of industrial estates located in Brent. In 2013 around 40% of main roads
were in poor condition, but this dropped to 21.6% in 2016, and only 7% in 2018. Brent still

                                                                                           189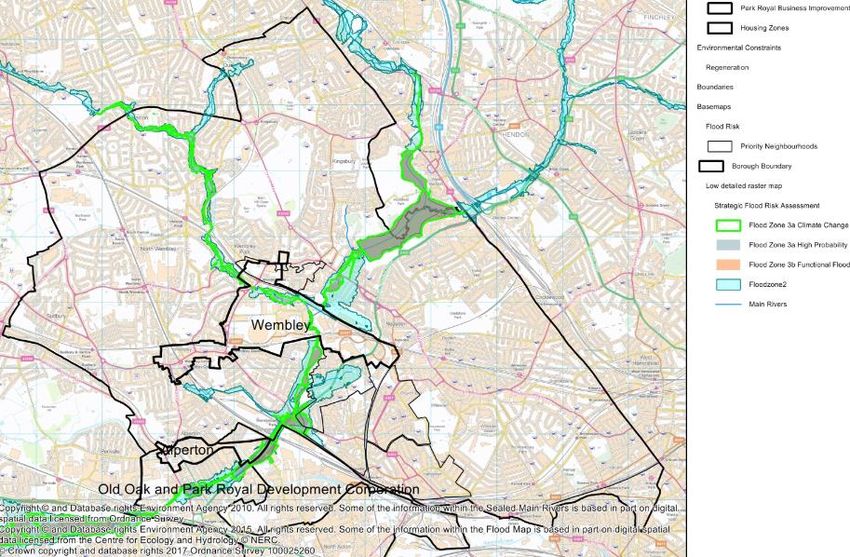
however has a higher percentage of road network in poor condition compared with some
London boroughs. (Figure 133). 304

                   Figure 133: Highway Asset Condition – % of principal road network which requires
                                               maintenance 2017/18.

                   9.0
                   8.0
                   7.0
      Percentage

                   6.0
                   5.0
                   4.0
                   3.0
                   2.0
                   1.0
                   0.0

                             Barking and…
                         Kensington and…
                          Hammersmith…

                          Kingston upon…

                         Richmond upon…
                                 Camden

                                   Barnet

                                     Brent

                                  Harrow
                                Havering
                                Haringey

                              Southwark
                                Newham

                                   Enfield
                            Westminster

                                 Bromley
                                Croydon

                               Redbridge

                                   Sutton
                                Hackney

                                Islington

                                    Bexley

                         Waltham Forest
                          City of London

                                Lambeth

                              Greenwich

                               Hillingdon
                               Hounslow

                                  Merton
                               Lewisham

                         Tower Hamlets
                            Wandsworth

                                    Ealing
                                          Source: Department for Transport statistics (2019)

Cars

In London, the increasing use of private cars and reduction of road space are the main causes
of congestion, a problem that costs £4 billion a year to the UK economy. In 2012 air pollution
had a total cost of up to £2.7 billion, impacting UK productivity305. Strategic solutions are
needed to reduce traffic and congestion, improve sustainable modes of transport, and provide
alternatives to motorised vehicles, in order to reduce these significant costs to the economy.
In 2017, there were 2.6m cars registered in London, 73% of which were registered in Outer
London and 3.4% registered in Brent. Brent has the 12th highest cars registered out of the
Outer London boroughs (Figure 134)306 however this number has increased considerably
between 2012 and 2016 and fallen slightly since then (Figure 135).

304
    TfL (2017) Travel in London 9 & TfL (2017) Borough Local Implementation Plan (LIP) performance indicators. Department for
Transport statistics (2019)
305
    DEFRA & DT (2017) UK plan for tackling roadside nitrogen dioxide.
306
    DFT (2018) Number of Licensed Vehicles 2017.

                                                                                                                       190
Figure 134: Cars registered 2018 Outer London (000s)

          160.0
          140.0
          120.0
          100.0
           80.0
           60.0
           40.0
           20.0
            0.0

                            Source: Department for Transport Statistics Vehicle Licensing Statistics 2019.

                          Figure 135: Number of Licensed Cars Registered in Brent

                     94

                     93

                     92

                     91

                     90

                     89

                     88

                     87

                     86

                     85

                     84
                             2012        2013        2014        2015         2016        2017        2018
                            Source: Department for Transport Statistics Vehicle Licensing Statistics 2019.

Compared with Outer London, Brent has the largest percentage of daily trips by public
transport (Rail, Underground, Bus), and one of the lowest for motorised vehicles. From 565
daily trips realized in the borough, 45% are made by private motorised vehicles, 20% by bus,
32% walking and only 1% cycling (Figure 136).307 In comparison to London as a whole, a lower
proportion of trips are by car (35%) and by walking (25%)..308

307
    TfL (2017) Travel in London 9 supplementary information & TfL (2017) Borough Local Implementation Plan (LIP)
performance indicators.
308
    TfL (2018) Travel in London Report 11

                                                                                                                   191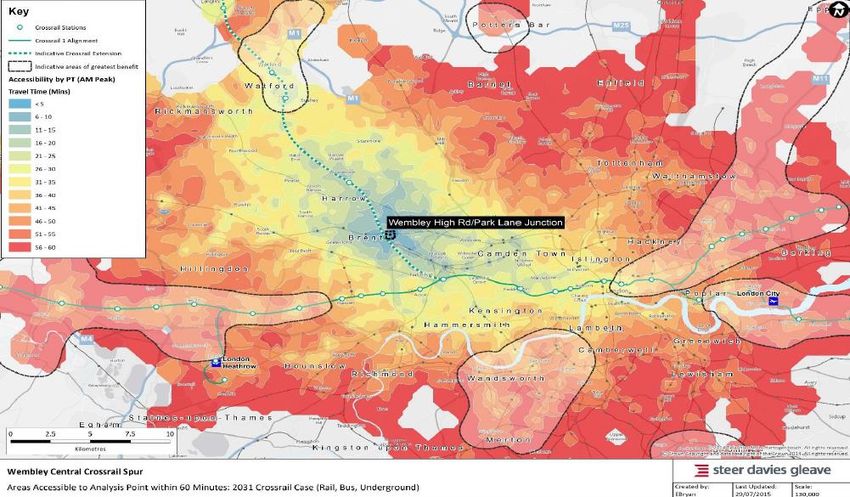
Figure 136: Modal Split 2017

                                                                  32%

                                45%

                                                                              1%
                                                           20%

                                          1%
                                                 2%

                               Walk     Cycle     Bus     Rail    Taxi    Car

                               Source: Brent Local Implementation plan 2018

Public Transport

Car dependency can be reduced when people are offered efficient public transport
alternatives. Although London’s transport network is controlled and financed by Transport for
London (TfL), the Council can seek to manage the location of new developments. In Brent,
identified growth tend to have the highest Public Transport Accessibility Level (PTAL) levels,
particularly around Wembley and in the southern part of the borough. Burnt Oak/Colindale
also has good PTAL around 3, as does Church End and Alperton, although these latter two
areas have some areas with lower PTAL around 2 and 1 (Figure 137).

                                                                                          192
Figure 137: Brent´s PTAL 2015
Source: Ordnance Survey
Brent is one of the Outer London Boroughs with higher accessibility by public transport (Figure
138). Brent is well connected to Central London, however is poorly connected to Outer London
Boroughs, and to London Heathrow Airport, despite relatively close geographic proximity.
Brent is therefore seen to have strong radial public transport links to Central London, but much
weaker local orbital ones to the other West London boroughs. The proposed West London
Orbital line therefore offers great potential to address these weaker orbital links. Brent is
currently connected with the West and Outer London only through orbital road routes such as
the A406 (North Circular Road), A4006 (Kingsbury Road) and A417 (Sudbury Court Drive),
and improved bus routes and frequency would also help strengthen orbital transport links
(Figure 139).
193Figure 138: Public Transport Travel Time to the Central Activities Zone, 2015
Source: GLA (2018) Mayor’s Transport Strategy
Figure 139: Central and West London underground and line connections map
Source: TfL(2014) London connections map
Public transport in Brent includes:
58 bus routes, 7 of which are night buses.
25 Underground stations, with currently only 3 stations with step free access at Wembley
Park, Kingsbury, and Kilburn (and step free access now planned for Park Royal). Brent
194has direct access to Jubilee, Piccadilly, Metropolitan and Bakerloo Underground lines.
Jubilee line with night service during weekends.
3 Overground stations with access to Euston-Watford Junction and Richmond/Clapham
Junction Overground routes.
4 National Rail stations offering direct links to Marylebone and out-lying destinations such
as Birmingham/High Wycombe.
According to recent TfL analysis, an important proportion of residents in Brent could switch
journeys currently made by car to journeys by foot, bicycle or by public transport, particularly
for short trips (Figure 140)309.
Figure 140: Volume of car trips that could be made by walking, cycling and public transport
Source: GLA (2018) Mayor´s Transport Strategy.
309
TfL (2017) Transport Classification of Londoners and GLA (2017) Mayor´s Transport Strategy.
195Cycling
Cycling in London has grown significantly over the past 15 years. There are now more than
670,000 cycle trips a day in London, an increase of over 130% since 2000. However, car
dependency is higher in Outer London when compared with Inner London, and the numbers
of trips by bike are lower (Figure 141)310. Although, there are some boroughs such as
Richmond upon Thames with cycle levels above 7%, in Brent only 1% of trips are realised by
this mode.311
Figure 141: Car ownership rates by borough of residence. Average number of cars per
household, car mode shares and active travel mode share compared, 2013/14-2015/16.
Source: TfL (2017) Travel in London 9 supplementary information.
Londoners make 8.17 million daily trips by motorised modes that could instead be made by
bike. Current National and Local policies encourage cycle trips, rather than use of motorised
vehicles. TfL recently evaluated cycle behaviour in the city to identify opportunities to increase
the rates of cycling. TfL indicate that in Brent only 12,600 trips were realised by cycle, though
cycling has potential to realise almost 300,000 trips by bike. Compared with Outer London,
Brent is the borough with the 6th highest potential to increase its daily cycle-able trips (Figure
142).
310
TfL (2017) Travel in London 9 supplementary information & TfL (2017) Borough Local Implementation Plan (LIP)
performance indicators.
311
TfL (2017) Borough Local Implementation Plan (LIP) performance indicators & London Datastore (2014) Travel to Work by
Bicycle. Brent Local Implementation plan 2018
196Figure 142: Potentially cyclable trips by borough of residence
Source: TfL (2017) Analysis of cycling potential 2016
Public transport is a preferred alternative to discourage the use of private cars, however as
TfL control investment, Local Authorities have little control over improving infrastructure.
Instead Local Authorities can focus on improving and promoting green transport models in
areas with lower PTAL levels and for short trip distances. The case map below analyses areas
with PTAL between 0 and 2 within Kenton with the potential to develop walking and bicycle
trips (Figure 143).
197Figure 143: Kenton TIM 2019
Source: TfL (2019) WebCAT
Brent provides some cycle parking facilities located close to public transport and cycle
pathways, as well as some cycle pathways (Figure 144)312
312
Brent (2017) Brent your guide to Cycling in Brent.
198Figure 144: Brent Cycle Map
Source: Brent (2017) Brent your guide to Cycling in Brent.
Survey data indicates the most frequent reason that discourages people from cycling in
London is concern about road safety and the probability of having a collision313. Recent TfL
analysis of walking and cycling infrastructure, shows Wembley, Cricklewood and Willesden
Junction are located within areas with the 20% poorest safety records in London, based on
the total number of collisions involving people walking or cycling (Figure 145). Similarly, on
this analysis, TfL identified Wembley and Cricklewood in the top percentage of areas with
higher growing population and employment in London, highlighting the importance to
increase current levels of safety to encourage the use of green modes of transport. 314
Figure 145: Walking and cycling safety in London
Source: TfL (2017) Strategic Cycling Analysis.
313
Brent (2016) Brent Cycle Strategy 2016-2021
314
TfL (2017) Strategic Cycling Analysis: identifying future cycling demand in London.
199Electric Vehicles
Since 2011, the UK government has implemented a programme to improve air quality
generated by motorised vehicles, promoting the use of clean technologies such as charging
stations for Ultra Low Emissions Vehicles (ULEV). This program includes infrastructure for
buses, vans and cars that are electric or hybrid.
Brent has the 10th highest number of plug-in vehicles in London with 688 registered at the end
of 2018 (Figure 146) which has increased by 679% since 2011 and makes up 0.6% of the total
number of vehicles registered in Brent (Figure 147).
Figure 146: Plug-in vehicles registered in London 2018
1,800
1,600
1,400
1,200
1,000
800
600
400
200
0
Kensington and…
Hammersmith…
Kingston upon…
Richmond upon…
Barking and…
Westminster
Haringey
Islington
Bromley
City of London
Ealing
Lambeth
Bexley
Hackney
Merton
Hillingdon
Redbridge
Waltham Forest
Camden
Greenwich
Hounslow
Croydon
Enfield
Harrow
Lewisham
Tower Hamlets
Newham
Southwark
Sutton
Wandsworth
Barnet
Brent
Havering
Source: DfT (2019) Vehicle licensing statistics
Figure 147: Plug-in vehicles licensed registered in Brent
800 688
600
431
400 318
186
200 106
58 55 65
0
2011 2012 2013 2014 2015 2016 2017 2018
Source: DfT (2019) Vehicle licensing statistics
In 2017, Brent Council installed 33 charging points for electric cars in 24 locations. According
to the online platform EVCPs zap-map, Brent has 13% of the connectors available in Greater
London. 74 charging points in 13 locations mainly in supermarket areas, such as Morrisons
and Costco circled in purple in the map below (Figure 148). Of the current EVCPs, 19% are
out of service or have performance issues reported, including the five stations located at
Wembley Stadium.315
315
Zap-Map (2018) Consulted 8 January 2018
200Figure 148: Electric Vehicle Charging Point (EVCP) Locations
Source: Zap-Map (2019)
i
SLOW FAST RAPID SUPER
HYDROGEN TOTAL
3kW 7 kW 50kw 120kw
Available to use 8 52 60
Reported issue 1 1
Out of service 4 7 2 13
TOTAL 12 60 2 74
Source: Zap-Map (2018) Consulted January 2018
Charging points at Brent can provide full daily charge for 265 to 469 EV users316. This capacity
and charging time associated with EVCP depends on the power level associated in Brent as
is shown in Figure 149:
3kW provide a full charge between 7 and 8 hours and is most suited for overnight charging
at or near home or work. With capacity for 1 or 2 users in a 24 hour.
7kW typical full charge electric vehicles in 3-4 hours, meaning that 3 or 4 users a day could
fully charge.
50kW a higher power rapid charging option ideal to charge EV quickly, provide full charge
between 30 and 40 minutes, allowing between 36 and 48 users per day317.
Figure 149: Power Level EVCP in Brent
3kW 7kW 50kW
Subtotal 12 60 2
% Total EVCP 16% 81% 3%
Source: Zap-Map (2018) Consulted 8 January 2018
316
Scenario considering all the 74 EVCP at Brent available to use.
317
TfL (2017) Electric vehicle charging infrastructure: Location guidance for London.
201In addition to the charging stations, there are 6 off-street parking spaces provided exclusively
for electric vehicles. There are also 47 off-street parking spaces provided for electric vehicles
in Brent Civic Centre, available as general parking when not in use for vehicle charging.
Electric vehicle parking is very limited in comparison with the infrastructure and off-street
parking spaces for standard motorised vehicles (Figure 150).318
Figure 150: Brent´s off-street parking spaces
Normal Car 650
Electric Vehicles 53
Source: Brent (2018) Parking Annual Report 2017-2018
Funding and securing electrical connections is one of the biggest barriers to maintaining and
installing new EVCPs.319 Investment requirements depend on the type of charging point and
location320:
Public on-street EVCPs cost in the region around £6k - £10k for installation and equipment.
Private off-street EVCPs, costs are generally between £0 – £2.5k for installation and
equipment.
Cost of electricity averages £1.80 per charge (60 miles) for a standard domestic rate.
Parking
Demand for parking is high in Brent. Although the Council has introduced a number of parking
control measures, due to current levels of car traffic and with limited space available, the
pressure to manage kerb space is noticeable.
Parking management is delivered in partnership with Serco, a private company that provides
services such as off-street parking enforcement; CCTV for public space and traffic
enforcement; vehicle removal; pay and display machine maintenance and cash collection; and
provision of parking IT and back office services. On-street parking spaces are managed
through 40 Controlled Parking Zones (CPZs) across Brent (Figure 151). With operation times
specific to location, 33,000 parking spaces are provided serving 56,000 households.
318
Brent (2016) Parking Strategy 2015.
319
Brent (2016) Cabinet Report form the Strategic Director Regeneration and Environment.
320
RGP (2017) Electric Vehicle Charging Points.
202Figure 151: Controlled Parking Zones
Source: Brent (2018) Parking Annual Report 2017-2018
Overall, CPZs are designed to prevent commuters from parking in residential streets, and to
encourage them to instead use pay and display facilities or use alternative means of transport.
A recent parking consultation expressed views to extend current CPZs and loading
restrictions, interventions that are currently considered by the Council for implementation
mainly in areas with high level of public transport accessibility. 321
Parking permits are issued in CPZs according to the type of user. Permit price goes up with
1) higher emissions, 2) additional permits per household. Priced parking, particularly in CPZs
and areas with good public transport, is designed to discourage car use and remove
disincentives to use public transport. The 35% drop in visitor parking permits between 2016
and 2018 (Figure 152) is considered a result of the parking service introducing new visitor
parking charges in all Controlled Parking Zone (CPZ) areas 29th November 2016 in an
effort to reduce excess demand for parking spaces.322
321
Brent (2017) Parking Annual Report 2016-2017.
322
Brent (2018) Parking Annual Report 2017-2018
203Figure 152: Brent Parking permits in CPZ
Permits Issued 2014/15 2015/16 2016/17 2017/18
Resident Permit 34,427 31,132 31,098 33,450
Visitor Parking 411,000 451,000 420,000 272,000
Business Permits 627 589 691 788
All Other Permits 5,164 5,140 5,095 -
Source: Brent (2018) Parking Annual Report 2017-2018
Digital
Accessibility to technology is a crucial influence in people’s lives; connectivity drives
productivity and innovation. In order to realise the benefits of technology in Brent, it is
important to ensure access to digital infrastructure that meets the requirements of residents
and businesses located in the borough. Digital capacity includes broadband connections,
speeds, Wi-Fi public hotspots, and self-service terminals.
The Universal Service Obligation (USO) introduced in 1984 has as its aim to ensure that basic
fixed line telecom services be made available at an affordable price to all UK customers. This
basic line considers broadband technology below 10Mbps: technology that is still limited, to
cover the basic needs of business and entrepreneurs working in a global environment.
In London, the development of optical fibre has considerably increased broadband speeds
above the USO minimum, allowing more places to be connected with access to superfast
(above 30Mbps) and ultrafast (above 100Mbps) broadband. However, there are places in
London that still have poor digital connectivity, a situation that limits city economic productivity,
international competitiveness and new investment.
London ranked 30 amongst 63 surveyed cities in 2016, with 77.4% of properties in general
covered by ultrafast broadband, above the national average of 51.4%, but below cities with a
lesser number of residents and business (Figure 153)323.
Figure 153: Percentage of premises covered by ultrafast broadband (>100 Mbps) at the end of
2016.
100 93.31 92.93 91.77 91.06 90.84 89.82 89.79 89.53 89.43 88.66
77.4
80
60 51.36
40
20
0
Source: Thinkbroadband.com and Centre for Cities in London Assembly (2017) Regeneration Committee: Digital Connectivity Report.
In July 2018, Central Government set a goal of delivering full-fibre to 15 million premises by
2025 with delivery to all premises by 2033324. Full-fibre broadband coverage in the UK has
risen since to around 7% of premises in Spring 2019, an increase of over 300,000 premises,
an increase of 4% since 2017.This increase mainly reflects the commercial roll-out of Fibre to
the Property (FTTP) by BT Plc, Virgin Media and KCOM and a range of other providers
including Hyperoptic, CityFibre and Gigaclear325.
323
London Assembly (2017) Regeneration Committee: Digital Connectivity Report.
324
Ofcom (2018) Connected Nations
325
Ofcom (2019) Connected Nations Update
204IT operators in UK have completed implementing a major 4G rollout programme and the
coverage of these higher-speed data services has increased significantly, with geographic
coverage from all operators. The launch of 4G voice call services by EE and Three has had
a beneficial effect on their voice network coverage, in particular by improving indoor coverage.
In 2018, the Government had achieved its goal of 95% superfast broadband coverage for
homes and businesses in the UK with the support of BT Plc. In Brent, broadband capacity
significantly improved over 2016 and 2017 as a result of £50m BT Plc investment to deploy
fibre broadband in the borough326. BT Plc investment increased connection speeds, widening
accessibility to broadband over 30Mbps from 92.8% to 99% of hotspots. After this investment,
Brent reached the third highest broadband accessibility amongst the West London Partnership
(Figure 154) and one of the best in London (Figure 155).
Figure 154: BT Superfast Broadband access (>30Mbps) 2015/2017 across West London
Partnership
105 Percentage of BT Openreach superfast Broadband
Mar-15 Mar-17
100
95
90
85
80
Barnet Brent Ealing H&F Harrow Hillingdon Hounslow
Source: Broadband SE16 (2016)
Figure 155: Percentage of BT Superfast Broadband in London (March 2017)
105
100
95
90
85
80
75
Source: Broadband SE16 (2016)
Although this investment increased the competitiveness of Brent among other boroughs, there
are ‘not-spots’ where connectivity is still poor, shown as red dots on the map below. Areas
with low connectivity include “growth” areas expected to accommodate new housing and
employment such as Wembley, Burnt Oak/Colindale and OPDC, where requirements for
faster broadband could be higher than in other parts of the borough (Figure 156).
326
Brent & Kilburn Times (2015).
205Figure 156: Broadband speeds by postcode in Brent 2016
Source: Ordinance Survey.
Ultrafast broadband connections are limited or null in most of the borough. The map below
includes future investments in ultrafast broadband technology (>100 Mbps), and show ultrafast
coverage only in the areas of Wembley and Alperton. Important hubs of employment such as
Park Royal are not included (Figure 157).
Figure 157: Ultrafast Broadband Premises in Brent 2016.
Source: Ordinance Survey.
SMART City strategies integrate big data understanding, physical infrastructure and digital
infrastructure. SMART Cities aim to solve cities challenges, create a better environment for
the future, and deliver resources efficiencies and better capital asset management. Brent
Council’s Digital Strategy seeks to align with the London SMART Cities agenda, and plans for
206digital infrastructure for the borough from 2017-2022. The strategy aims to improve access to
information and services to ensure digital inclusion for all Brent’s residents and businesses.
All Council services are currently accessible online, and 61% of Brent households have an
account. Digital access in Brent still has deficiencies however, such as: limited free Wi-Fi spots
(Figure 158), and broadband speeds that limit business development (Figure 156).327
Figure 158: Public Wi-Fi in Brent.
Source: Ordinance Survey.
Water
Thames Water Corporation is the main authority in charge of public water supply and waste
water treatment in London. In Outer London, there are mainly separate systems that bring
rainwater into local tributary rivers, and foul water to sewage treatment works (Figure 159).
327
Brent (2017) Digital Strategy 2017-2020.
207Figure 159: Combined and separated sewer systems.
Brent
Source: GLA (2016) London Sustainable Drainage Action Plan.
Brent’s population is served by three sewage works: Beckton, Mogden and Deephams that
treat water from the Thames and River Lee; and this sewage infrastructure also serves other
boroughs (Figure 160).
Figure 160: London´s sewage treatment works for selected boroughs including Brent.
Sewage Water Catchment Population Consente
treatmen course served d flow*
t works (000s) (m3/d)
Beckton Thames Barking & Dagenham, Brent, Camden, 1,420,000 3,300
Tideway City of Westminster, City of London,
Ealing, Hackney, Hammersmith &
Fulham, Haringey. Islington, Kensington
and Chelsea, Newham, Redbridge,
Tower Hamlets, Waltham Forest
Mogden Upper Barnet, Brent, Ealing, Harrow, Hillingdon, 690,000 1,860
Thames Hounslow, Richmond Upon Thames, and
Tideway parts of Berkshire, Buckinghamshire and
Hertfordshire
Deepha River Lee Barnet, Brent, Enfield, Haringey, 443,000 852
ms via Waltham Forest and parts of Essex and
Salmon Hertfordshire
Brook
Source: GLA (2011) Securing London´s Water Future: The Mayor´s Water Strategy.
London’s water supply is in deficit, with the deficit growing from 7.6M Iitres per day (l/d) in
2016-17 to 40.1Ml/d in 2017-18. Over 2017-18, London’s annual water consumption per capita
208was 120.8 l/d for households in measured (metered) areas, and 159.4 l/d for households in
(unmetered) unmeasured areas.328 Thames Water indicates that London’s overall water
supply capacity is below consumptions patterns. Growth in demand from an increasing
population, and falling available supply due to climate changes, changes in bulk supply and
increased third party abstraction from the River Thames, means the gap is predicted to widen
if no action is taken, with insufficient water to meet London’s needs.
Figure 161: Thames Water, Water Deficit Prediction (Ml/d) 2016-2100 under dry year average.
Source: Thames Water Revised Draft Water Resources Management Plan 2019
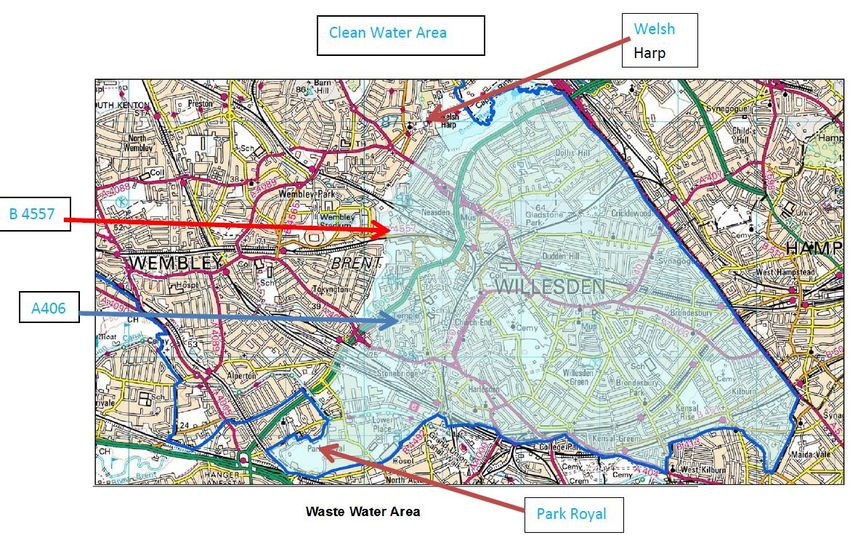
At a local level, Thames Waters are able to provide some limited detail on water demand
and consumption in the District Meter Area which covers half of Brent south and east of the
River Brent and Welsh Harp Reservoir.329
328
Thames Water (2017 & 2018) Environment Agency Annual Review 2016-17 and 2017-18
329
Thames Water (2018 & 2019) Environmental Information Request Responses 12/091 and 19/20/014
209Figure 162: District Meter Area in LB Brent
Source: Thames Water (2018) Environmental Information Request Response 12/091
Taking latest data for 2016-17 and 2017-18 provided by Thames Water below, household
water consumption per capita is noted to be higher than the Thames Water 125 l/d standard330
or the London Plan331 105 l/d standard set for new domestic properties. Assuming an LB Brent
average household size of 2.8 persons as per Census 2011, latest data indicates daily annual
water consumption per capita fell from 152 l/d to 139l/d for households in the LB Brent District
Meter Area between 2016-17 and 2017-18. Over the same period 2016-17 and 2017-18 the
number of domestic properties metered in the area rose from 28% to 47% and this increase
in metering is considered the main driver for the fall in water consumption. Clear variance is
observed between daily water consumption per capita at both the London and Brent levels,
with water consumption 30% higher at 156 l/d in unmeasured (unmetered), compared to 120
l/d in measured (metered), domestic properties in Brent over 2017-18.332
330
CLG / DEFRA (2007) Water Efficiency in New Buildings
331
Mayor of London (2016) London Plan : Chapter Five : London’s Response to Climate Change
332
Thames Water (2018 & 2019) Environmental Information Request Responses 12/091 and 19/20/014
210Figure 163: Household and Commercial Water Consumption 2016-17 & 2017-18
Source: Thames Water (2018 & 2019) Environmental Information Request Responses 12/091 and 19/20/014
The Environment Agency classified the water usage in London for 2013 as “seriously stressed”
and demand will remain as such into the 2050s. This classification means that more than 20%
of the population served by Thames Water is using water from areas classed as under serious
stress by limited capacity.333
Thames Water have responded by implementing various measures to maintain water
resources, including the “Thames Water’s metering” programme of water efficiency and
leakage detection. This programme started in 2015, reducing water usage by 2.5 million litres
per day, and was rolled out in Brent at the beginning of 2017.
In terms of infrastructure, in 2010 Thames Water opened the UK’s first large desalination plant
at Beckton, which serves 150 million litres of drinking water daily to the population in North
London, including one small part of Brent. Thames Water highlights the importance of
implementing more initiatives to reinforce water supply, particularly in times of drought, and
mentioned in its last strategy report that it is evaluating some other technical options for
London, but does not specify any future investment in Brent.334 Current water infrastructure
lies under most streets, which are subject to large-scale and widespread excavations.
London has two main water reservoirs used to provide potable water to the population. In the
last 10 years the capacity of those reservoirs has been above 80%. In the Lower Thames
Group that satisfies water demand for Brent, capacity has been above 85% (Figure 164). This
is not enough to provide water resources to London’s population, and more efficient use of the
resource is required. Thames Water aim to improve the capacity and reliability of major
treatment water works and deliver 100% compliance with drinking water quality standards.335
333
Environment Agency (2013) Water stressed areas: 2013 classification.
334
Thames Water (2017) WRMP19 Resource Options
335
Corporate Thames Water (2013) Our long-term strategy 2015-2040.
211Figure 164: London Water Reservoir capacity level %
100
95
90
85
80
75
2007 2008 2009 2010 2011 2012 2013 2014 2015 2016 2017 2018 2019
Lower Lee Group Lower Thames Group
Source: Data London, Dataset London Reservoir Levels.
Since 1974, there has been no major increase in London’s strategic reservoir storage facilities.
The last project built was the Queen Mother Reservoir in West London. In addition to the
constraints on water supply, Thames Water must deal with widespread problems of pollution
and flush impacts that severely impact on water quality. One of the main causes is that the
drainage system is separate (Figure 160) and as a result, it is more complex and expensive
to increase the capacity of London’s stressed drainage systems. Brent falls within an area of
serious water stress that could generate future water shortages.
Concurrent to the water shortage issues explained, some areas in Brent have a high risk of
surface water and sewer flooding. In 2016, Thames Water Corporation identified serious
problems of sewer flooding and pollution in Brent.336
Particular attention must be paid to the sewage requirements in the Tokyngton and Harlesden
wards, due to flood zone classifications, and Housing Zone areas and priority neighbourhood
designations. Current sewage infrastructure, including sustainable drainage technologies,
must be developed to support proposed growth and new development in these areas.
336
Corporate Thames Water (2016) Brent and Harrow.
212Figure 165: Brent Flood Zones
Source: Ordinance Survey.
Energy
Energy capacity in London is reaching the limit to satisfy the minimum requirements to
maintain a working city. With 94% of energy supplied from sources outside the city, the GLA
are analysing and promoting different measures to provide alternatives, and encourage
energy efficiencies, particularly in buildings and transport.337
In Brent more than half of the energy used is in people’s homes. In spite of a growing
population, domestic energy consumption has steadily declined since 2005 (Figure 166).338
Figure 166: Energy Consumption in Brent
3,000.0
2,500.0
2,000.0
1,500.0
1,000.0
500.0
-
2005 2006 2007 2008 2009 2010 2011 2012 2013 2014 2015 2016
Industry & Commercial Domestic Transport
Source: BEIS (2019) Total final energy consumption at regional and local authority level.
337
GLA (2017) London Environment Strategy. Draft for public consultation.
338
BEIS (2017) Total final energy consumption at regional and local authority level.
213According to the latest data available from the Department for Business, Energy & Industrial
Strategy (BEIS), Brent was the 7th largest consumer of domestic energy in London (Figure
167).339 This underlines the pressure for the borough to develop infrastructure for sustainable
energy provision, and align with the Mayor’s zero carbon objective by 2050.
Figure 167: Domestic Energy Consumption by borough in 2016
3,000.0
2,500.0
2,000.0
1,500.0
1,000.0
500.0
- Hammersmith and…
Barnet
Harrow
Southwark
Camden
Havering
Sutton
Croydon
Enfield
Bromley
Bexley
Islington
Waltham Forest
Westminster
Barking and Dagenham
City of London
Greenwich
Haringey
Kingston upon Thames
Redbridge
Ealing
Hillingdon
Merton
Richmond upon Thames
Hounslow
Tower Hamlets
Wandsworth
Kensington and Chelsea
Brent
Newham
Hackney
Lambeth
Lewisham
Source: BEIS (2019) Total final energy consumption at regional and local authority level.
Most of Brent’s energy is consumed from burning fossil fuels. Natural gas accounted for 47.8%
of energy use in 2016; while electricity represented 31.3% and petroleum products 20.3%.340
Natural gas is mainly used to heat spaces and water for domestic consumers. Electricity is
mainly used for commercial and industrial users, and petroleum used for road transport.
To understand current and future energy infrastructure requirements in Brent, besides
analysis of energy consumption patterns, it is important to consider the environmental impact
of demand. In London, electricity consumption accounts for almost half of total CO2 emissions,
while gas use contributes 30% of total emissions. National and local policy is to decarbonise
energy, with generation from renewable sources, retrofitting of existing buildings and
regulations to ensure new developments satisfy emissions limits.
Since 2007 Brent Council has implemented a Carbon Management Programme (CMP) which
aims to reduce Council-generated emissions by 15%, by reducing energy used by Council
assets. This programme has included introducing street lampposts with LED technology and
implementing energy efficiency systems on Council buildings. In 2017/2018 the Council had
exceeded its 4 year 15% target reductions in CO2, achieving 15.6% savings341.
Brent has solar photovoltaic technology (PV) on some public buildings and schools, although
there is no specific information about how much energy is produced from these assets, nor
the amount of PV infrastructure on private buildings.
The Council is currently analysing further implementation of PV Solar panels and mapping
potential areas to install sustainable energy plant. The Council is also planning to implement
district Energy networks is some growth areas and regeneration schemes which would supply
thermal energy to buildings and businesses from central energy centres by moving water
339
BEIS (2019) Total final energy consumption at regional and local authority level.
340
BEIS (2019) Total final energy consumption at regional and local authority level.
341
Carbon Management Programme (CMP) CO2 Emissions Report 2017/18
214through a network of underground pipes. This technology will allow to business and
households to use local waste-heat and low carbon fuels rather than generate their own heat
or cooling onsite through burning fossil fuels.
Initiatives to bring more efficiency to domestic energy consumption include the “Big London
Energy Switch” programme, a collective switching scheme working since 2013 over 20 London
Boroughs. The scheme works by bringing together a large group of residential consumers to
secure better deals from energy suppliers in an auction process through increased collective
bargaining power. Since the scheme began in Brent, over 2,600 households have signed up,
with savings on energy bills over £200 a year for those residents that have switched suppliers
in the last five auctions.342
342
Brent (2017) Big London Energy Switch.
215Key Trends
The GLA projects London´s population and economy will continue growing. Growth will mean
changes in economic activities, demographics and lifestyles that will impact future
infrastructure requirements. Brent´s population is projected to increase 17% between 2019
and 2040 to reach 400,000 people. The Draft London Plan (2017) sets a new target of 29,150
additional homes to be delivered in Brent over the period 2019/20 to 2028/29, an average of
2,915 per annum343.344 These growth projections should be considered in line with the main
trends and changes anticipated in relation to infrastructure across London and in Brent.
Trend 1. Increased Demand for Public Transport
Brent’s population growth will increase demand for an efficient transport system that connects
housing, jobs and cultural facilities. Achieving an efficient transport network is one of the
Mayor´s priorities to create the conditions for London´s global economy to flourish. Efficient
transport aligns with the London Environment Strategy, which encourages the use of public
transport and green modes of transportation, with the aim to reduce carbon emissions in the
city.
In London, some parts of the city have been predominantly planned around the car, making
an inefficient use of road space relative to the number of people that could be moved by
sustainable transport modes. Buses can move 70 people in the same amount of space taken
up by about three cars. Many trips that people make by car, which they may not want to make
by foot or bike, can be switched to the bus. These measures could free up street space and
reduce the dominance of motor vehicles that negatively impact the street environment.
Outer London is more dependent on the car than Inner London. In Brent, 40% of commuters
use cars and motor vehicles. Current infrastructure support for car use has contributed to an
increase in poor public health as result of pollution, congestion and dangerous places to walk
and cycle. Tube, rail and bus services can, however, be overcrowded and sometimes
unreliable and indirect, meaning there is no appealing alternative to car use for many people.
In London it is expected population growth will generate more than 5 million additional trips
each day by 2041. The GLA expect that without further investments from TfL, 71% of travel
on London Underground and 65% of travel on National Rail in the morning peak will be in
crowded conditions. In order to reduce these problems, the Major´s aim is to improve the
transport system as well as improve green infrastructure such that by 2041 80% of Londoners’
trips would be on foot, by cycle or by using public transport (Figure 168).
343
GLA (2017) Draft London Plan
344
GLA (2015) Statistics. Expected employment growth in Brent 2017-2036
216Figure 168: Mode share 2015 and 2041 expected.
Source: GLA (2017) Mayor´s Transport Strategy.
Given projected growth in population and jobs in Brent, it is essential to consider current and
future transport infrastructure for rail, bus, cycling and walking, in order to reduce private
vehicle dependency, and create places that people of all backgrounds and incomes can enjoy
living in. Without new investment, transport routes will become increasingly overcrowded, air
quality will worsen and streets and public places will become ever-more dominated by motor
traffic.
Consultation undertaken when drawing up Brent´s Transport Strategy indicated citizens main
concerns surround accessibility within the borough, air quality, congestion and road safety,
and proposed increases in walking and cycling and public transport accessibility345 .
In London, employment growth will generate an increase in travel by all rail modes of more
than 50% by 2041 (Figure 169). As a result of investment in some of the major strategic
projects under development by TfL to support this employment growth, transport connections
will be improved in specific areas including some within Brent.
345
Brent (2016) Long Term Transport Strategy 2015-2035.
217Figure 169: Proposed rail and tube capacity increases, 2015-2041 morning peak hour.
Source: GLA (2018) Mayor´s Transport Strategy.
The GLA aim to provide a projected 70% increase in rail and tube capacity serving 1.5 million
new homes by 2050. Future improvements for Brent could include:
Thameslink extension in Colindale and Cricklewood that will connect with Crossrail;
Crossrail Old Oak Common Station in Hammersmith and Fulham that will increase
connectivity in the south of Brent and the area of Park Royal.
Crossrail spur from Old Oak Common to stop at Wembley Central station and the West
Coast Mainline
West London Orbital Rail that will improved the connection with Outer London with stops
considered in Neasden and Harlesden.
Planned new transport capacity and improvements in West London includes growth areas
such as Park Royal and Wembley, which will receive direct benefits, and improve connections
with both Outer and Central London (Figure 170 & 171).
218Figure 170: Transport connections West London
Source: OPDC (2017) Local Plan Revised Draft
Figure 171: Potential and improved Orbital Rail Links in Inner and Outer London
Source: GLA (2018) Mayor´s Transport Strategy
219Old Oak and Park Royal
The new Crossrail Elizabeth Line 1 due to open in 2020, will increase network connectivity
close to Brent, however at the same time raise congestion challenges. The Elizabeth Line
station at Old Oak Common will be the only place where High Speed Two (HS2) connects with
Crossrail (Figure 172). The station will have capacity for 250,000 passengers a day and is set
to become the most connected place in the UK. It will be 8 minutes from Heathrow, 10 minutes
from the West End, and 38 minutes from Birmingham.
Figure 172: Map of Elizabeth Line
Source: GLA (2018) Mayor´s Transport Strategy.
HS2 will increase the connectivity of London and reduce travel times to Birmingham,
Manchester and Leeds. The first phase will have two stations in London. Old Oak Common
station will be located in Old Oak & Park Royal in the borough of Hammersmith and Fulham,
close to the Brent borough boundary. Old Oak Common will be a strategic station that
increases connectivity in West London to and from the West End, the City and Canary Wharf,
and westwards to Heathrow through Crossrail.346 Strategic rail connectivity will therefore be
increased close to Brent, but this will also create challenges to avoid and mitigate increased
road congested close to the station (Figure 173).
346
High Speed Two (HS2) limited (2017) Interactive map.
220Figure 173: HS2 Connections
Source: GLA (2018) Mayor´s Transport Strategy
GLA expect the regeneration of Old Oak & Park Royal to develop a new mini-city at a scale
not seen since Canary Wharf. Around 37,000 jobs and 14,000 new homes are possible at the
650-hectare site in what is the UK’s largest regeneration scheme.
The transport improvements in Old Oak Common will increase opportunities for Brent, notably
with an extension in the London Overground line, particularly towards Brent Cross. New
infrastructure will also include bus route extensions and cycle lanes, some of which will benefit
Brent directly (Figure 174).
221You can also read