Responses of soil water storage and crop water use efficiency to changing climatic conditions: a lysimeter-based space-for-time approach
←
→
Page content transcription
If your browser does not render page correctly, please read the page content below
Hydrol. Earth Syst. Sci., 24, 1211–1225, 2020
https://doi.org/10.5194/hess-24-1211-2020
© Author(s) 2020. This work is distributed under
the Creative Commons Attribution 4.0 License.

Responses of soil water storage and crop water use efficiency to
changing climatic conditions: a lysimeter-based
space-for-time approach
Jannis Groh1,2 , Jan Vanderborght2 , Thomas Pütz2 , Hans-Jörg Vogel3 , Ralf Gründling3 , Holger Rupp3 ,
Mehdi Rahmati4 , Michael Sommer5,6 , Harry Vereecken2 , and Horst H. Gerke1
1 Working   Group “Hydropedology”, Research Area 1 “Landscape Functioning”, Leibniz Centre for Agricultural Landscape
Research (ZALF), Müncheberg, 15374, Germany
2 IBG-3: Agrosphere, Institute of Bio- and Geoscience, Forschungszentrum Jülich GmbH, Jülich, 52425, Germany
3 Department of Soil System Science, Helmholtz-Centre for Environmental Research – UFZ, Halle (Saale), 06120, Germany
4 Department of Soil Science and Engineering, Faculty of Agriculture, University of Maragheh, Maragheh, Iran
5 Working Group “Landscape Pedology”, Research Area 1 “Landscape Functioning”, Leibniz Centre for Agricultural

Landscape Research (ZALF), Müncheberg, 15374, Germany
6 Institute of Environmental Science and Geography, University of Potsdam, Potsdam, 14476, Germany

Correspondence: Jannis Groh (j.groh@fz-juelich.de, groh@zalf.de)

Received: 12 August 2019 – Discussion started: 27 August 2019
Revised: 10 January 2020 – Accepted: 2 February 2020 – Published: 13 March 2020

Abstract. Future crop production will be affected by cli-          decrease of the SWS for soils with a finer texture was ob-
matic changes. In several regions, the projected changes in        served after a longer drought period under a drier climate.
total rainfall and seasonal rainfall patterns will lead to lower   The reduced SWS after the drought remained until the end
soil water storage (SWS), which in turn affects crop water         of the observation period which demonstrates carry-over of
uptake, crop yield, water use efficiency (WUE), grain qual-        drought from one growing season to another and the over-
ity and groundwater recharge. Effects of climate change on         all long-term effects of single drought events. In the rel-
those variables depend on the soil properties and were often       atively drier climate, water flow at the soil profile bottom
estimated based on model simulations. The objective of this        showed a small net upward flux over the entire monitor-
study was to investigate the response of key variables in four     ing period as compared to downward fluxes (groundwater
different soils and for two different climates in Germany with     recharge) or drainage in the relatively wetter climate and
a different aridity index (AI): 1.09 for the wetter (range: 0.82   larger recharge rates in the coarser- as compared to finer-
to 1.29) and 1.57 for the drier (range: 1.19 to 1.77) climate.     textured soils. The large variability of recharge from year to
This is done by using high-precision weighable lysimeters.         year and the long-lasting effects of drought periods on the
According to a “space-for-time” (SFT) concept, intact soil         SWS imply that long-term monitoring of soil water balance
monoliths that were moved to sites with contrasting climatic       components is necessary to obtain representative estimates.
conditions have been monitored from April 2011 until De-           Results confirmed a more efficient crop water use under less-
cember 2017.                                                       plant-available soil moisture conditions. Long-term effects of
   Evapotranspiration (ET) was lower for the same soil un-         changing climatic conditions on the SWS and ecosystem pro-
der the relatively drier climate, whereas crop yield was sig-      ductivity should be considered when trying to develop adap-
nificantly higher, without affecting grain quality. Especially     tation strategies in the agricultural sector.
“non-productive” water losses (evapotranspiration out of the
main growing period) were lower, which led to a more ef-
ficient crop water use in the drier climate. A characteristic

Published by Copernicus Publications on behalf of the European Geosciences Union.
1212                                           J. Groh et al.: Responses of soil water storage and crop water use efficiency

1   Introduction                                                  water demand, limiting ET due to water stress and reducing
                                                                  the SWS, could in turn lead to a decrease in crop yield (Zhao
The amount of water stored within the root zone of the soil       et al., 2016, 2017). Thus investigating the response of crop
and the vadose zone is a central and characteristic com-          water balance components and yield to climate change is im-
ponent of terrestrial ecosystems. Soil water storage (SWS)        portant to develop suitable adaptation and mitigation strate-
is important for provisioning (e.g. crop production, water        gies (Albert et al., 2017; Rogers et al., 2017).
balance and plant-available nutrients) as well as regulating         Previous studies reported estimates of crop water balance
and supporting ecosystem services (e.g. water, nutrients, cli-    components and crop yield mostly based on either manip-
mate, flood and drought; Adhikari and Hartemink, 2016;            ulative experiments or observational studies to predict the
Vereecken et al., 2016). The SWS capacity (SWSC) de-              ecological response of crops to climate change (Yuan et al.,
pends on soil texture, organic-matter content, bulk density       2017). Wu et al. (2015) showed that the inter-annual variation
and soil structure and is related to the effective field ca-      of the SWS at northern middle and high latitudes increased
pacity, which can be derived from the soil water retention        under a warmer climate with higher values during the wetter
function (Vereecken et al., 2010). Knowledge of magnitude         and lower values of the SWS during the drier season. In this
and temporal variation of the SWS is essential for under-         case, the frequency of water logging events or soil crack for-
standing ecological and hydrological processes and manag-         mation will increase and probably alter soil properties such
ing ecosystems (Cao et al., 2018). Climate change will mod-       as macroporosity and the SWSC and thus affect vadose zone
ify the temporal availability of soil water, increase the fre-    hydrology at different scales (Robinson et al., 2016; Hirmas
quency and duration of droughts, affecting the quantity and       et al., 2018). Robinson et al. (2016) showed for a manip-
quality of aquifer recharge, and might affect crop produc-        ulative long-term experiment that intense summer droughts
tion. Thus future ecosystem productivity (e.g. crop yield) is     altered the soil water retention characteristic and lowered the
expected to respond to changes in weather (short-term) and        SWSC.
climate (long-term) because it will alter the crop water bal-        Nevertheless, current knowledge of changes of the SWS
ance components, such as the SWS, evapotranspiration (ET)         are still limited mostly to the analysis of soil moisture obser-
and drainage (Yang et al., 2016). How to produce more crop        vations related to restricted soil volumes and soil moisture
yield with less water is a major challenge in agriculture be-     ranges (Mei et al., 2019; Yost et al., 2019). As an alternative
cause (i) water is a limiting factor for crop production in       method, weighable lysimeters allow for the direct observa-
many regions of the world and (ii) predictions of future cli-     tion of the SWS by monitoring the temporal changes of the
mate indicate an increasing water limitation for crop produc-     total soil mass in mostly cylindrical containers. However, the
tion caused by reduced rainfall and changing seasonal rain-       use of weighable lysimeters was often limited in the past to
fall distribution (Lobell and Gourdji, 2012).                     the quantitative determination of the water balance compo-
   Several studies have been conducted to investigate the im-     nents of precipitation (P ), evapotranspiration and subsurface
pact of global climate change on crop water balance com-          inflow (Qin ) and outflow (Qout ; e.g. drainage); the change
ponents (Sebastiá, 2007; Wu et al., 2015) and crop or grain       of the SWS was obtained as residual of the water balance
yield (Ewert et al., 2002; Zhao et al., 2016; Schauberger et      components (e.g. Herbrich et al., 2017; Groh et al., 2018b).
al., 2017; Asseng et al., 2019). Understanding the impact of      This approach accumulated all possible errors introduced by
weather signals on agricultural productivity is of crucial im-    other components into the SWS, causing a relatively low
portance for managing future crop production, since varia-        precision. The direct derivation of the SWS from lysimeter
tions in weather conditions could explain much of the yield       mass changes could provide a new perspective on the use of
variability (Frieler et al., 2017). Temperature rise and chang-   lysimeter data as an additional model calibration variable and
ing seasonal rainfall patterns could alter the probability of     for lysimeters that are large enough to fully capture the com-
droughts and affect freshwater resources (Gudmundsson and         plete soil profile with the relevant soil horizons and intact soil
Seneviratne, 2016; Gudmundsson et al., 2017). Negative im-        structures to be representative for the pedon scale.
pacts of rising temperature on the yield of major crops at the       The water use efficiency (WUE) links the carbon and wa-
global scale (Asseng et al., 2014; Zhao et al., 2017) are high-   ter exchange between vegetated soil and the atmosphere (Niu
lighting the potential vulnerability of agricultural productiv-   et al., 2011). Several definitions have been used to describe
ity to climate change. Schauberger et al. (2017) showed a         the WUE at the leaf or ecosystem level (for more details see
consistent negative response of US crops under rainfed con-       Zhou et al., 2017). At the ecosystem level, the WUE, de-
ditions being mainly related to water stress induced by higher    fined as the ratio between grain yield or total biomass and
temperatures. In addition to the direct effects of a temper-      the water lost to the atmosphere by ET (Fan et al., 2018), is
ature rise, an elevated atmospheric CO2 concentration and         one possible way to quantify the impact of changes in envi-
changes in rainfall amounts on crop yield (Ewert et al., 2002;    ronmental conditions and of management decisions (e.g. ir-
Asseng et al., 2014; Gammans et al., 2017; Scheelbeek et al.,     rigation) on agricultural productivity. The use of ET instead
2018), the higher temperatures could affect crop yields indi-     of transpiration (T ) only for calculating the WUE represents
rectly. Indirect effects caused by increasing the atmospheric     water use efficiency at the ecosystem rather than leaf level

Hydrol. Earth Syst. Sci., 24, 1211–1225, 2020                                   www.hydrol-earth-syst-sci.net/24/1211/2020/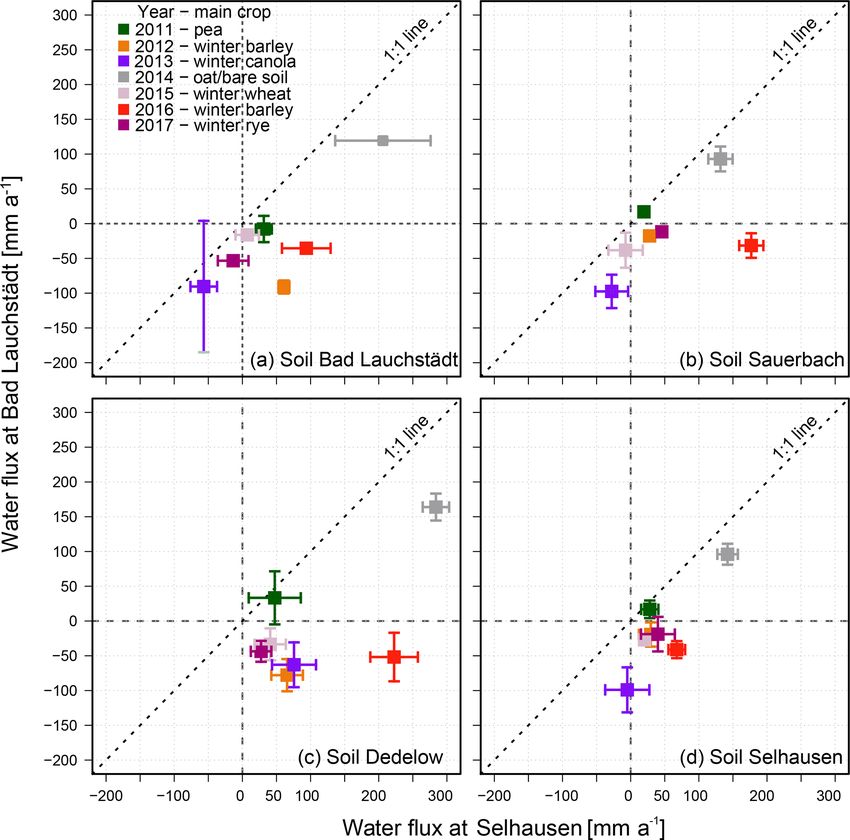
J. Groh et al.: Responses of soil water storage and crop water use efficiency                                               1213

because it accounts for evaporation (E), which is also de-         et al., 2016). It represents basically a crossed soil type and
pendent on crop-specific development and soil management.          climate experimental setup that could allow for quantifying
The WUE provides insights in to better managing and un-            changes in the soil water balance and the crop production as
derstanding the productivity and ecological functioning of         a response to imposed variations in climatic conditions. Re-
agricultural ecosystems (Zhang et al., 2015). The prevailing       sults from this experimental setup can primarily be used to
general hypothesis for the WUE is that plant productivity in-      evaluate models that predict changes in response to possible
creases with increasing water use (ET; Hatfield and Dold,          future climatic conditions.
2019), which implies that WUE efficiency is a linear func-            Our objectives were (i) to develop an approach to obtain
tion of the water used by a crop to produce grain yield or the     time series of changes in the SWS directly from lysimeter
total aboveground biomass. But several studies have shown          data, (ii) to determine the other soil water balance compo-
that crop WUE was negatively correlated with annual rain-          nents (P , ET, inflow and drainage) of soils each exposed to
fall and that plants achieved their maximum crop WUE un-           two different climates, (iii) to compare the dynamics of net
der less-favourable soil water availability (Zhang et al., 2010;   flux (inflow and drainage) and the SWS for the same soils in
Ponce-Campos et al., 2013; Xiao et al., 2013; Zhang et al.,        relatively dry and wet climates, and (iv) to test the hypothe-
2015). The last statement might imply that plants are able to      sis that the WUE of crops remains constant under changing
adapt their water use during drought conditions by improving       climatic conditions in these crossed soil type and climate ex-
their WUE or that there are simply fewer non-productive wa-        periments. The analysis was based on lysimeter data from
ter losses by evaporation. Nevertheless, temperature above         April 2011 until December 2017.
a certain threshold (extremely high temperature) especially
during the reproductive period (Gourdji et al., 2013) or due
to drought and heat stress reduce yield. However, such in-         2     Material and methods
vestigations are often focused on one specific environmen-
tal variable (e.g. P or temperature) in manipulation experi-       2.1    Site descriptions
ments. This basically ignores joint effects of several climate
variables on the crop WUE in climate impact research stud-         The study was conducted at the experimental field sites
ies. The impact of altered climatic conditions on different        Selhausen (50◦ 520 700 N, 6◦ 260 5800 E; Se) and Bad Lauch-
agricultural ecosystems within manipulative experiments has        städt (51◦ 230 3700 N, 11◦ 520 4100 E; BL), which are part
not been thoroughly studied yet, due to problems to either         of the Eifel/Lower Rhine Valley and the Harz/Central
realistically manipulate the climatic conditions at a specific     German Lowland Observatory of TERENO in Germany
site or to move an intact soil to another site with contrasting    (Wollschläger et al., 2016; Bogena et al., 2018), respectively.
climatic conditions.                                               The TERENO-SOILCan lysimeter network was established
   Here, we hypothesize that the WUE will not increase for         at several experimental stations across a rainfall and tem-
drier climate because a change in plant productivity will si-      perature gradient. Local excavated lysimeters (i.e. intact soil
multaneously alter the water use (ET) and thus describe the        monoliths) were transferred between the stations to subject
WUE as a linear function between both variables. In addi-          them to different climate regimes so as to generate a crossed
tion we wanted to test if observed lysimeter mass changes          soil–climate setup according to the space-for-time substitu-
can be used to monitor the long-term change of the SWS,            tion approach. It should be noted that we did not follow the
which might be in addition to water flux observation a use-        SFT substitution as used in ecological (e.g. Pickett, 1989;
ful dataset for the calibration of vadose-zone models. We          Blois et al., 2013; Wogan and Wang, 2018) or hydrologi-
used observations from a German soil–climate crossed facto-        cal (e.g. Scanlon et al., 2005; Troch et al., 2013) studies.
rial experiment (TERrestrial ENvironmental Observatories;          Typically such SFT studies assume that spatial and tempo-
TERENO-SOILCan; Pütz et al., 2016). The lysimeter net-             ral variations are equivalent (Pickett, 1989). By translocat-
work of TERENO-SOILCan has been initiated to assess ef-            ing soils from one test site to another while keeping some
fects of climatic changes on arable and grassland soil ecosys-     of the lysimeters at their original site, we actually account
tems including the water balance components (ET, SWS and           for unsuspected effects from the past. In this way we elimi-
net drainage) and crop characteristics including yield, yield      nate effects caused by past local events such as disturbances,
quality and the WUE. As part of this project, arable-land          pedogenesis or site management. This is in contrast to the
lysimeters filled with four different soils were transferred       standard SFT approach. The spatial transfer of intact soil
within and between TERENO observatories (space-for-time            monoliths in the lysimeters followed an assumed direction of
– SFT; see details in Pütz et al., 2016) to expose soils from      climatic changes of increased temperature and precipitation.
originals sites to other climatic conditions. The space-for-       For this study, we considered all arable-land lysimeters at the
time approach means that soils are translocated in space in-       central sites Bad Lauchstädt and Selhausen of the TERENO-
stead of waiting at the same location for changes in climatic      SOILCan lysimeter network. Each central experimental site
conditions in time. The concept was initially intended to eval-    contains three replicates of soils from different locations:
uate the impact of climate on agricultural ecosystems (Pütz        Bad Lauchstädt (Haplic Chernozems; loess), Dedelow (Dd;

www.hydrol-earth-syst-sci.net/24/1211/2020/                                     Hydrol. Earth Syst. Sci., 24, 1211–1225, 2020
1214                                              J. Groh et al.: Responses of soil water storage and crop water use efficiency

Calcic Luvisols and Haplic Luvisols; glacial till), Sauerbach        2.2   Soil water storage
(Sb; Colluvic Regosols; colluvial deposits) and Selhausen
(Haplic Luvisols, loess). This allows for the investigation of       Monthly changes in the SWS (1SWS) were calculated from
the response of the corresponding soil type under different          lysimeter observations as
climates. The transfer of soils between the research stations
imitates a change in climatic conditions and compares for            1SWS = 1W + 1Lyscor ,                                        (1)
identical soils the effects of different climatic conditions on
                                                                     where 1W is the monthly lysimeter mass change and
crop yield and soil water fluxes with those at the original lo-
                                                                     1Lyscor corresponds to mass changes by maintenance, har-
cation. By transferring lysimeters between stations, the “cli-
                                                                     vesting, or other disturbances that occur accidently (e.g. er-
matic shift” is abrupt such that we are not able to follow the
                                                                     roneous load cells) or naturally (e.g. animals). The variable
gradual changes of the soil ecosystem over time as suggested
                                                                     1W was directly obtained by analysing lysimeter mass data
in standard SFT approaches. Instead, crop yield and fluxes
                                                                     (average value: 00:00 to 02:00). defined as
for the same soil under different climatic conditions are com-
pared. Further information on soil texture and the transfer of
                                                                     1W = Wi+1 − Wi ,                                             (2)
soil monoliths from the TERENO observatories to the cen-
tral sites can be taken from Tables S1 to S2 (see Supplement).       where W is the lysimeter mass at the beginning of month i.
The transferred eroded Luvisol soil monoliths from Dedelow           The variable 1Lyscor was determined from monthly changes
have a varying soil depth to the clay illuviation horizon (Bt )      of lysimeter mass during maintenance work. Less than 0.6 %
and to the marly, illitic glacial till (C horizon). They represent   of 1SWS values could not be calculated, because lysimeter
part of the erosion gradient typically observed in agricultural      mass data at the beginning of the corresponding month were
landscapes of hummocky ground moraines (Sommer et al.,               missing. A linear regression model obtained for the entire
2008; Rieckh et al., 2012; Herbrich et al., 2017). Detailed          time series between 1SWS of the soils was used for interpo-
information about the lysimeter design and general experi-           lation to fill the gaps. This was first based on 1SWS from
mental setup of TERENO-SOILCan can be found in Pütz et               surrounding lysimeters of the same soil type, and if these
al. (2016). The climatic conditions of the central sites from        were not available, then the average values of 1SWS ob-
1 January 2012 to 31 December 2017 (complete years) are              tained from all available lysimeters at the respective station
shown in Fig. 1 according to Walter and Lieth (1967). Al-            were used.
though the patterns in average monthly temperature values
are relatively similar at both sites (Fig. 1), a more pronounced     2.3   Crop water use efficiency, grain yield and yield
amplitude of the temperature variations over the year could                quality
be found in Bad Lauchstädt (representing a more continen-
tal climate) as compared to the more temperate and humid             In total 12 arable-land lysimeters (three replicates of four soil
climate (sub-oceanic or sub-Atlantic) in Selhausen (Fig. 1).         types) with a surface area of 1 m2 and a depth of 1.5 m were
The average annual grass reference evapotranspiration (ET0 )         embedded within larger fields at the respective central ex-
calculated with the FAO-56 (Food and Agriculture Organiza-           perimental site at Selhausen (250 m2 ) and Bad Lauchstädt
tion of the United Nations) Penman–Monteith method (Allen            (720 m2 ). The same crops were grown, and identical tillage
et al., 2006) is slightly higher at Bad Lauchstädt (710 mm)          and crop management procedures were carried out at both
than at Selhausen (694 mm). Larger differences are shown in          sites and in the field around the lysimeters. The lysimeters
the annual rainfall and the rainfall distribution over the year      were cultivated with peas (Pisum sativum L.; cultivar: Mas-
(Fig. 1). The lower annual P in Bad Lauchstädt (458 mm)              cara), winter barley (Hordeum vulgare L.; cultivar: Lomerit),
than in Selhausen (644 mm) corresponds to a higher aridity           winter canola (Brassica napus L.; cultivar: Adriana), oat
index (AI = ET0 P −1 ; see data repository) of 1.57 for Bad          (Avena sativa L.; cultivar: Max G), winter wheat (Triticum
Lauchstädt than for Selhausen (1.09). The rainfall distribu-         aestivum L.; cultivar: Glaucus), winter barley (Hordeum vul-
tion over the year was more uniform in Selhausen, whereas            gare L.; cultivar: Antonella) and winter rye (Secale cereal L.;
the probability of relatively dry periods in spring (April)          cultivar: SU Santini), whereas the applications of seasonal
and late summer (September) was higher in Bad Lauchstädt.            plant protection, crop growth regulators and nitrogen fertil-
Thus, the climatic conditions at the SOILCan experimental            izer (see Table S3) have been adapted to the conditions of
sites can be defined as drier for Bad Lauchstädt and wetter          local farmers at the respective experimental site. Dry mass of
at Selhausen, which corresponds well to long-term weather            the yield and plant residual matter were gravimetrically de-
station data, from stations at (Nord; German weather service)        termined with a precision balance (Selhausen: EMS 6K0.1,
and at Forschungszentrum Jülich (see Fig. 1c and d).                 KERN, Balingen-Frommern, Germany; Bad Lauchstädt: LC
                                                                     6200 D, Sartorius, Göttingen, Germany) after drying at 75 ◦ C
                                                                     for 24 h (Bad Lauchstädt) and at 60 ◦ C for > 24 h (Selhausen;
                                                                     until reaching a constant weight). The determination of the
                                                                     total nitrogen of the dry yield and plant residual material was

Hydrol. Earth Syst. Sci., 24, 1211–1225, 2020                                      www.hydrol-earth-syst-sci.net/24/1211/2020/
J. Groh et al.: Responses of soil water storage and crop water use efficiency                                                      1215

Figure 1. Climate diagrams according to Walter and Lieth (1967) for Bad Lauchstädt (a) and Selhausen (b) for 2012 to 2017 and Bernburg
(Saale) (Nord) (c) and Forschungszentrum Jülich (d) for 1981 to 2017. Data were obtained from the SOILCan weather stations at Selhausen
and a climate station at Bad Lauchstädt above sea level. The long-term weather data were taken from the weather stations of the Deutscher
Wetterdienst (Germany’s national meteorological service) at Bernburg (Saale) (Nord) and the Forschungszentrum Jülich. The blue bars at
the bottom of subplot (a, c, d)) indicate months where frost is likely to occur.

obtained with an elementary analyser (vario EL cube, ele-              monthly soil water sampling volume. P was measured
mentar, Langenselbold, Germany).                                       with a tipping bucket rain gauge (15189, LAMBRECHT
  Equation (3) was used to calculate the crop WUE                      meteo, Göttingen, Germany) at Bad Lauchstädt (experi-
(kg m−3 ).                                                             mental station Bad Lauchstädt) and with a weighing rain
         Y                                                             gauge (Ott Pluvio2 L, Ott, Kempten, Germany) at Selhausen
WUE =       ,                                                 (3)      (Se_BDK_ 002). Data of the latter station are available at
         ET                                                            the TERENO data portal (Kunkel et al., 2013). The Ott rain
where Y is the grain yield (kg m−2 ) and ET (m3 m−2 ) is the           gauge was installed in April 2013; data before April 2013
measure of the consumed water during the growing season                were estimated by linear regression models and P data from
of the corresponding crop (Katerji et al., 2008). The growing          surrounding climate stations of the TERENO data portal
periods of the crops were defined as the time between sow-             (station names: SE_BDK_002; RU_BCK_003; RU_K_001;
ing and harvest (see Table S3). The required ET during the             ME_BCK_001), which can be used to interpolate between
growing season was estimated based on the monthly water                the given data points. We used the R software (R-Core-
balance equation and observed precipitation in millimetres             Team, 2016) and the function lm of the package stats (R-
per month as                                                           Core-Team, 2016) to set up linear regressions. The coeffi-
                                                                       cient of determination (R 2 ) was used to determine the good-
ET = P − 1SWS − Qnet − 1Lysvol ,                              (4)      ness of fit of the linear regression. A stepwise gap-filling ap-
where Qnet is the monthly sum of net water flux across                 proach was used to gap-fill missing P data after April 2013,
the lysimeter bottom (Qnet > 0: drainage; Qnet < 0: capil-             which consisted of an analysis of data from other meteoro-
lary rise) and 1Lysvol is mass change determined from                  logical stations that were operating and missing values were

www.hydrol-earth-syst-sci.net/24/1211/2020/                                          Hydrol. Earth Syst. Sci., 24, 1211–1225, 2020
1216 J. Groh et al.: Responses of soil water storage and crop water use efficiency
filled based on the observation which had the highest R 2 . Bad Lauchstädt, the aridity index (AI = ET0 P −1 ) of 2.7 for
Monthly Qnet values were obtained from mass changes of March–July 2015 was larger as compared to the average AI
the leachate from the lysimeters, collected with a weighable value of 2.0 calculated for all March and July periods be-
reservoir tank. The lysimeter bottom-boundary pressure head tween 2012 and 2017. Also the value of the AI for Selhausen
condition was imposed by a pumping mechanism, which en- was with 2.0 slightly larger as compared to the average AI
abled either outflow or inflow according to differences in value of 1.6 for all March–July periods. The SWS depletion
pressure head values at 1.4 m depth between the lysimeter in 2015 was larger at both sites for soils from Bad Lauch-
and surrounding field soil. This control of the bottom bound- städt (Fig. 2b) and Sauerbach (Fig. 2d) as compared to that
ary allowed for imitating the upward and downward water of the other two soils from Dedelow (Fig. 2f) and Selhausen
fluxes and representing ET processes in lysimeters (Groh (Fig. 2h). The Sb and BL soils were strongly desiccated by
et al., 2016) more realistically and comparable to the intact the winter wheat crop in 2015, which can be seen from ET
soil profile. More technical details can be found in Pütz et June 2015 for BL and Sb of about 125–175 mm month−1
al. (2016). Missing data in the time series of Qnet were filled (Fig. 2a and c) was larger than for Dd and Se soils of about
for small gaps of about 1 min by linear interpolation and for 100–125 mm month−1 (Fig. 2e and g) even for the soils ex-
gaps between > 1 and 10 min by using a moving average with posed to the drier climate in Bad Lauchstädt. For the BL
a window width of 30 min. Larger gaps in the time series (Fig. 2b) and Sb (Fig. 2d) soils, the amount of rainfall after
were filled by average water flux values from other lysime- the growing season of 327 mm (August 2015–April 2016) in
ters of the same soil type. Nearly 5 % of monthly ET val- Bad Lauchstädt was not sufficient to compensate for ET and
ues were found not plausible perhaps due to water loss by drainage such that the soil profile did not return to a SWS
leaking during periods with water-saturated conditions at the capacity (i.e. typical spring moisture) at the end of the winter
lysimeter bottom. These conditions occurred mainly in win- period characterized by a value close to 0 of the cumulative
ter, when monthly ET fluxes were in general relatively low 1SWS. The soil moisture deficit from 2015 was carried over
as compared to summer conditions so that potential error to the growing seasons of 2016 and even of 2017. For the Dd
was low and easily detectable. A linear regression based on and Se soils (Fig. 2f and h), the SWS deficit during the 2015
either single or average ET values from other non-affected growing season under the climate of Bad Lauchstädt was less
lysimeters with similar soils were used for interpolation to and the amount of precipitation after the growing season was
fill the gaps. Detailed information on the monthly water bal- sufficient for the soils to return to a typical SWS value, al-
ance data and missing data can be taken from the TERENO though this value was reached later and not before the next
data portal (see section Data availability). spring. The AI of 1.77 at BL in 2015 (January–December)
was considerably higher than the average AI for the 5-year
period at BL (1.57). For the same year 2015, the AI was 1.13
3 Results and discussion at Se and thus only slightly higher than the 5-year average
AI value of 1.09. For all soils in Se (blue lines in Fig. 2b, d, f
3.1 Soil water storage change and h), the amount of precipitation after the growing season
of 501 mm for 2015 (August 2015–April 2016) was sufficient
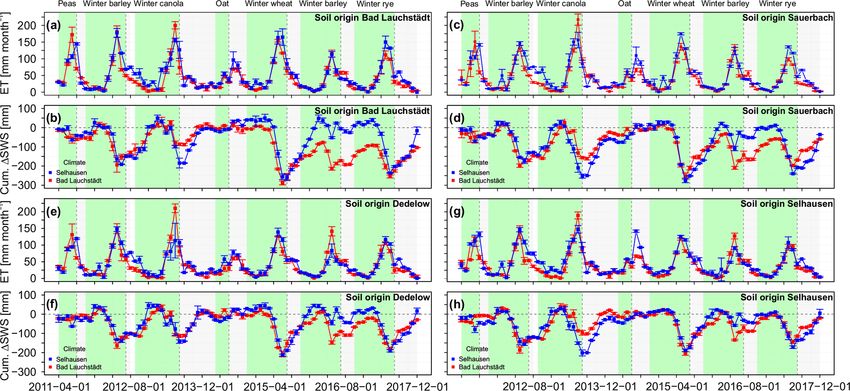
For the observation period (April 2011–January 2018), evap- for the lysimeters to return to their “typical” SWS value at the
otranspiration and cumulative soil water storage change end of the winter. These results indicate soil-type-dependent
(1SWS) differed at both stations, Selhausen and Bad Lauch- changes in the SWS during drought periods. The annual
städt, in the amount and temporal development between carry-over of soil moisture deficits demonstrates the vulnera-
transferred soils and those from the original site (Fig. 2). The bility towards drought risks even for finer-textured soils, de-
variability in terms of the standard deviation of 1SWS and spite having an overall larger SWSC than coarser-textured
ET of the three replicate soils was small and ranged across soils. This might be related to a higher infiltration capacity
the different soils for 1SWS between 4.3 and 7.4 mm and of the coarser-textured soil, which allows for a more-rapid
for ET between 3.7 and 5.5 mm. This clearly demonstrates recharge. The infiltration capacity is dependent on the con-
that the differences in 1SWS and ET between the same soils ductivity at the soil surface. Silting and cracking, which more
at original and new locations are larger than their scatter often occur at the soil surface of fine-textured soils, affects
(Fig. 2). This suggests that uncertainty in the calculation of the macropore structure (destruction of soil aggregates) and
water fluxes were in general smaller than effects of transfer- changes the infiltration. However, no surface runoff was ob-
ring soils between the test sites. Larger deviations in 1SWS served during the observation period, and qualitative obser-
between origin and transferred soils were visible for the crop vations on cracking were made during the harvest time, but
winter canola after the date of harvest in summer 2013 (soils the soil surface has been modified by tillage, and the topsoil
from BL, Sb and Se; Fig. 2b, d, h) and winter barley for 2016 organic-matter content and the plant roots are counteracting
(all soils). The largest depletions of the SWS during the en- silting and cracking. This suggests that the annual carry-over
tire observation period could be observed for all soils dur- of soil moisture deficits was not related to a different infiltra-
ing the spring–summer period (March and July) in 2015. At tion capacity of the soil. The observed stronger depletion of
Hydrol. Earth Syst. Sci., 24, 1211–1225, 2020 www.hydrol-earth-syst-sci.net/24/1211/2020/J. Groh et al.: Responses of soil water storage and crop water use efficiency 1217
soil water corresponds with soil drying reports from larger- for the soils at BL after 2015 indicate that soil water satura-
scale observations on the occurrence of a severe drought dur- tion and dynamics is limited throughout the soil profile.
ing the summer of 2015, where effects of the drought have The annual net water fluxes (QAnet ) at the bottom (in
been observed from a climatological (Ionita et al., 2017) and 1.5 m) of the same soils under the dry and wet climates are
hydrological (Laaha et al., 2017) perspective. The carry-over compared in the form of scatterplots (Fig. 4). The scatter-
of soil moisture deficits to the time after the drought at the lo- plots clearly show that fluxes were in general directed up-
cal scale in Bad Lauchstädt agrees well with the results from ward (i.e. negative values of QAnet for soils under a dry cli-
Laaha et al. (2017), which showed for several stations in Eu- mate in BL; positive values of QAnet , i.e. drainage) were only
rope that soil water storage (catchment scale) at the end of observed for 2011 and 2014 (Fig. 4). The larger values of
the study period (November 2015) has not totally recovered QAnet for 2014 could be due to the lower ET after an earlier
from the summer drought in 2015. harvesting of the oat crop and a longer bare soil period with-
Furthermore, changing climatic conditions and a more fre- out crop transpiration. The coarser-textured soils from Dede-
quent occurrence of drought could alter the SWSC because low showed the largest range of QAnet values (from −78 to
of the increasingly unavailable pore spaces due to differ- +164 mm) at the site with a relatively dry climate (BL) dur-
ent sources, including physical processes, e.g. swelling and ing the observation period of 2011–2017. This range could
shrinking (te Brake et al., 2013; Herbrich and Gerke, 2017), be explained by variation in soil water storage capacities be-
biological processes, e.g. vegetation-induced soil desiccation tween Dd soils, which depended on the thickness of the up-
that enhanced soil cracking (Robinson et al., 2016), and bio- per soil horizons that were modified by soil erosion (Her-
chemical processes, e.g. enhanced organic-matter mineral- brich et al., 2017). The long-term average values of QAnet
ization, due to increasing oxidation of the organic horizons for all soils in the dry climate were negative and varied only
during dry periods (Robinson et al., 2016), which will con- in a small range (from −18 to −28 mm; see Supplement Ta-
sequently result in a degradation of organic soil structure or ble S2). Long-term negative groundwater recharge is only
change in the soil wettability (Ellerbrock et al., 2005). possible at sites where groundwater can be replenished, for
instance, by lateral subsurface water flow. Whether the QAnet
3.2 Net drainage flux under the BL climate will continue to be negative for all
soils would require a longer time series. Nevertheless, a low
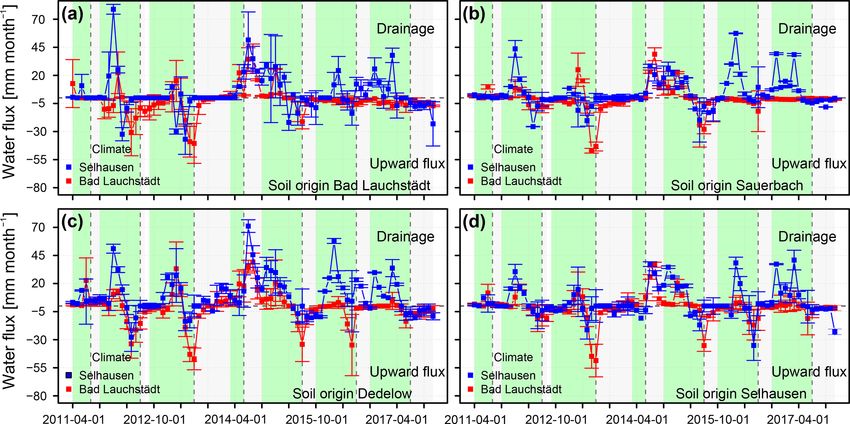
The water fluxes across the suction rake system at the lysime- and even negative groundwater recharge has not only an im-
ter bottom in 1.5 m depth were cumulated to monthly net pact on the groundwater quantity, but it will also affect the
drainage fluxes (QMnet ). The time series of QMnet for all groundwater quality. In the case of a small net recharge, the
soils at Se, the site with a relatively wet climate, were in concentrations of solutes from agricultural fertilizers, pesti-
general directed downward during the winter months and cides, and those of dissolved minerals and salts in the water-
upward (capillary rise) during spring and summer (Fig. 3). filled soil pores will become relatively high, and soil water
However, the magnitude of monthly fluxes QMnet differed movement still remains negligibly small. Thus under con-
between the soil types (e.g. soils in Se for 2012 or 2013; see ditions of relatively small leaching rates, solutes including
Fig. 3); QMnet for lysimeters with the coarser-textured soils plant nutrients will largely be retained within the soil’s root
from Dd (Fig. 3c) was mostly larger (e.g. drainage during zone. Soils and soil horizons may accumulate carbonates un-
bare fallow 2014) than for that with the finer-textured soils der long-term conditions of net negative leaching (e.g. BL
from BL (Fig. 3a), Sb (Fig. 3b) and Se (Fig. 3d). For the soil with Haplic Chernozems) or if leaching is small such that
same soils under the relatively dry climate in BL, time se- the carbonates from the topsoil horizons precipitate already
ries of QMnet were rather similar, with the largest values of in the subsoil within the 1.5 m soil monoliths like in the Ccv
upward fluxes for the soil from Dd (Fig. 3c). The magnitude (C – parent material horizon; c – secondary carbonates; v –
of QMnet for soils under the BL climate was mostly smaller weathered) horizons in Dd subsoil of Calcic Luvisols (see
for drainage and larger for upward-directed fluxes as com- soil profile descriptions in Herbrich and Gerke, 2017) and
pared to the QMnet values for the soils under the wet climate eventually salt.
in Selhausen. QAnet values under a relatively wet climate (in Se) were
The QMnet time series (Fig. 3) demonstrate that weather for all soils positive, indicating in general downward-directed
conditions in 2015 impacted the soil water fluxes in the drainage fluxes (Fig. 4). The long-term average QAnet val-
following years: under the dry climate in BL, hardly any ues ranged between 49 to 119 mm (see Table S2), depending
drainage was observed for all soils after 2015. This indicates on the soil type. The QAnet value was larger for the coarser-
that the soils remained so dry during the winter period that textured soil from Dd (Fig. 4c) as compared to the other soils.
downward water percolation or groundwater drainage was For 2013 (winter canola crop), the QAnet fluxes were negative
limited. The lack of water recharge during winter also af- for all finer-textured soils (i.e. Bad Lauchstädt, Sauerbach
fected the upward-directed QMnet flux rates in the following and Selhausen; Fig. 4a, b, d), which might be related to the
years, which generally decreased after 2015, especially for deeper-reaching root system of the crop canola (Breuer et al.,
soils from BL and Sb. The nearly unchanged QMnet values 2003) and a consequently larger plant water uptake in com-
www.hydrol-earth-syst-sci.net/24/1211/2020/ Hydrol. Earth Syst. Sci., 24, 1211–1225, 20201218 J. Groh et al.: Responses of soil water storage and crop water use efficiency Figure 2. Monthly evapotranspiration (ET) and cumulative monthly changes in soil water storage (1SWS) from April 2011 until Jan- uary 2018 at the lysimeter stations in Selhausen and in Bad Lauchstädt for soils from Bad Lauchstädt (a, b), Sauerbach (c, d), Dedelow (e, f) and Selhausen (g, h); mean values (dots) and standard deviations (error bars) are from three individual lysimeter monoliths of each soil. The background colour corresponds with the cropping periods at the TERENO-SOILCan lysimeters: bare soil (white) and crops (green). Dates are given in the figure in the YYYY-MM-DD format. Figure 3. Monthly net water fluxes across the lysimeter bottom in 1.5 m soil depth from April 2011 until January 2018 at the stations Selhausen and Bad Lauchstädt for soils from (a) Bad Lauchstädt, (b) Sauerbach, (c) Dedelow and (d) Selhausen; mean values (dots) and standard deviations (error bars) are shown. Positive values are defined as drainage, and negative values are defined as upward-directed water flux from capillary rise. Error bars indicate the variability of storage changes between individual lysimeters of each soil group. The background colour corresponds to different crops lysimeter cover types: bare soil (white) and different crops (green). Dates are given in the figure in the YYYY-MM-DD format. Hydrol. Earth Syst. Sci., 24, 1211–1225, 2020 www.hydrol-earth-syst-sci.net/24/1211/2020/
J. Groh et al.: Responses of soil water storage and crop water use efficiency 1219
by the coefficient of variation (CV), for values of which be-
low 28 %, except for peas, which showed for all soils a high
value, for winter canola grown on finer-textured soils in Se
(BL, Se see Table S4) and for winter barley (Dd and Sb in
2012, Sb in 2016) cropped at Se. For winter canola this might
be related to a higher loss of rapeseed during manual har-
vesting, natural pod shattering, cleaning and threshing (Al-
izadeh et al., 2007; Kuai et al., 2015). The CV value of the
observed yield variability between each soil type corresponds
to values reported between 5 % and 27 % by Joernsgaard and
Halmoe (2003) and Wallor et al. (2018). The yield of win-
ter wheat (7.8 t ha−1 ; see Table S4) for the soil from BL at
BL agreed well with observations on yields from a long-term
fertilization experiment at the BL site (Merbach and Schulz,
2013), which demonstrates the high yield potential of the soil
from BL.
The scatterplot of the total biomass (Fig. 5b) shows that
most crops produced relatively similar amounts of total
aboveground biomass at both sites, with the exception of
winter barley in the years 2012 and 2016. The crops could
probably use comparable amounts of solar radiation dur-
Figure 4. Comparison of net fluxes for the same soils at two sites: ing the observation period (average annual radiation from
annual observed net soil water flux at 1.5 m soil depth of soils from 2011 to 2017, obtained from the weather stations; BL:
(a) Bad Lauchstädt, (b) Sauerbach, (c) Dedelow and (d) Selhausen 1181.4 kWh m−2 and Se: 1180 kWh m−2 ). Despite a similar
under a dry climate (Bad Lauchstädt) and wet climate (Selhausen) amount of radiation received by the crops, the harvest index,
for the years between 2011 and 2017; average values (symbols) and
which is defined as the ratio of yield to the total biomass,
standard deviations (error bars) for observations are from the same
soil.
was found to be larger under a dry climate than under a wet
climate (Fig. 5c). This means that crops under a dry climate
were more productive with respect to crop yield than under
parison to other crops. Upward-directed QAnet values were a wet climate. The crop ET (i.e. ET related to the vegetation
observed during the year 2017 for the soils from Bad Lauch- period) was larger under the wet than under the dry climate
städt under the winter rye crop (Fig. 4a) and during 2015 for (Fig. 5d), and the corresponding crop water use efficiency
the soils from Sauerbach under winter wheat (Fig. 4b). was larger at the site with the relatively dry (BL) as com-
pared to the wet (Se) climate (Fig. 5e). These results demon-
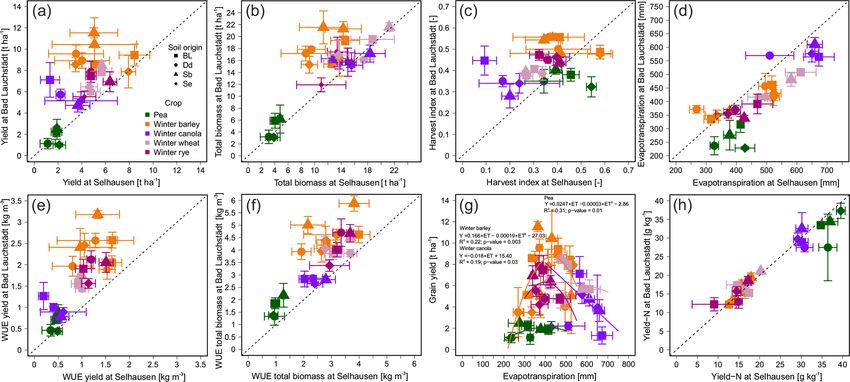
3.3 Crop yield and water use efficiency strated that plants were more efficient to produce yield at a
site with a suboptimal water supply. The present results are
The grain yields were in general larger for a dry climate at in line with earlier findings from Zhang et al. (2015), who
Bad Lauchstädt than for a wet climate at Selhausen, except showed that the WUE reached a maximum under warm and
for the peas (Fig. 5a). The pea crop had in comparison to the dry and a stable minimum under warm wet climatic condi-
other cereal crops a relatively short vegetation period and de- tions. Also when the WUE was calculated based on the to-
pends more on conditions during germination in early spring tal aboveground biomass, a higher WUE was observed for
than on differences in climatic conditions in late spring and the corresponding crop under a dry than under a wet climate
summer. For the other crops the spread of fungal pathogens (Fig. 5f), which demonstrated that climatic conditions were
under a more humid climate (Talley et al., 2002; Agam and not only beneficial for the grain yield but also for that of the
Berliner, 2006) and frequent occurrence of dew formation straw. However, differences in fertilizer application (see Ta-
(Xiao et al., 2009; Groh et al., 2018a; Brunke et al., 2019; ble S3) with a lower nitrate application in the wet site could
Groh et al., 2019) could explain the generally lower yield of be another reason for the differences in yield and biomass
grain crops for soils under a wet climate in Selhausen. How- production.
ever, appropriate crop management with one to three applica- The lower WUE under a wet climate might be related to
tions of fungicides during the growing season (see Table S3), higher soil evaporation and plant canopy interception evapo-
except for pea crop in 2011 (BL and Se) and winter rye in ration. Kunrath et al. (2018) found for the crop tall fescue that
2017 (Se), should have prevented the spread of fungal dis- limiting nitrogen supply conditions negatively affected WUE
eases and their impact on crop yield such that other reasons values by a reduced leaf area index, leaf photosynthesis and
have to be considered. The yield varied for most crops among radiation efficiency, which hence increased the ratio of soil
the soil replicates at a certain site, which can be described evaporation to transpiration. Thus, we further compared the
www.hydrol-earth-syst-sci.net/24/1211/2020/ Hydrol. Earth Syst. Sci., 24, 1211–1225, 20201220 J. Groh et al.: Responses of soil water storage and crop water use efficiency Figure 5. Comparison of parameters related to annual crop yield and ET for the same soils from Bad Lauchstädt, Dedelow, Sauerbach and Selhausen (three lysimeters each origin) at the two sites with a relatively dry (Bad Lauchstädt) and wet climate (Selhausen); average values (symbols) and standard deviations (error bars) between observations are from the same soils for (a) observed yield, (b) total biomass, (c) harvest index, (d) evapotranspiration, (e) water use efficiency (WUE) from yield, (f) the WUE from total biomass and (h) nitrogen (N) content in the grain yield as well as (g) the relationship between grain yield and evapotranspiration of all soils and crops during the years 2011–2017. ET during periods when ET was either transpiration (ETT ) or to confirm the assumed quadratic productivity function for evaporation (ETE ) dominated. The transpiration-dominated these crops. period was defined from the beginning of April, which cor- Grain yield quality in terms of the nitrogen content of responds well with the temporal increase of the monthly ET, the grains is an additional important variable to character- until the time when plants reached the growth stage of ripen- ize the quality of legume and cereal crops (Kemanian et al., ing/maturity of their fruit or seeds about a month before har- 2007). The scatterplot of the nitrogen content in the yield vest (see Table S3). The rest of the vegetation period was de- compares results from the same soils in the dry and wet cli- fined as the evaporation-dominated period. Evaporation was mate (Fig. 5h). The comparison showed no effect of climatic considered to be non-productive water use. The cumulative conditions or of the fertilization on the crop grain quality. values of ET, ETT and ETE during the observation period are Larger deviations from the 1 : 1 line were only visible for shown in Table 1. The differences for ETE between all soils the soils from Dedelow and the crop pea under a dry climate in the dry and wet climate from 359 to 576 mm was larger and for soils from Bad Lauchstädt and crop winter rye un- than the differences for ETT (range: −72 to 199 mm). Espe- der a wet climate (Fig. 5h). Nuttall et al. (2017) remarked cially the higher rate of soil evaporation (ETE ) at Selhausen that heat stress during the time of flowering and higher tem- contributed to the lower WUE under wet climate. peratures during the post-anthesis period of crops impact The relationship between yield and ET was reported to grain-size and milling yield. The impact of rising tempera- correspond with the productivity function of crops (grain tures and increasing CO2 concentrations in the atmosphere yield vs. ET) and often assumed to be linear (Tolk and How- on yield quality could affect the nutritional quality and end ell, 2009; Wichelns, 2014). However, for our present data, a use value (Asseng et al., 2019). The grain yield quality was quadratic productivity function (Fan et al., 2018) of the win- reported to be influenced mainly by genetics, crop manage- ter barley and pea crops (Fig. 5g) rather than a linear one ment and environmental conditions (Nuttall et al., 2017). could explain the observed larger WUE of soils under a dry Since in the present study, the crop management was sim- climate at Bad Lauchstädt. The crop winter canola could be ilar, and the same cultivars were used, the altered climatic best described by a linear productivity function with a neg- conditions seemed not to affect the quality of the yield in our ative slope (Fig. 5g). The other crops, winter rye and winter crossed soil–climate experiment. wheat, could be described by neither a linear nor a quadratic function. Longer time series with more crop yield observa- tions under different climatic conditions would be necessary Hydrol. Earth Syst. Sci., 24, 1211–1225, 2020 www.hydrol-earth-syst-sci.net/24/1211/2020/
J. Groh et al.: Responses of soil water storage and crop water use efficiency                                                        1221
                                                                                      P
Table 1. Average values (of three
                              P lysimeters each) of cumulative
                                                       P          evapotranspiration ( ET) for the whole observation period (2011–2017)
and cumulative transpiration ( ETT ) and evaporation ( ETE ) for periods dominated by evaporation (E) or transpiration (T) for soils from
Bad Lauchstädt (BL), Sauerbach (Sb), Dedelow (Dd) and Selhausen (Se) under a dry climate at BL and a wet climate at Se.     PThe ETT values
were defined from the beginning of the vegetation period (April) until ripening/maturity of the fruit or seeds; the data for ETE comprised
thePvalues from
            P rest of thePseason. The differences of the cumulative values for the same soils between the sites BL and Se are denoted by
1 ET, 1 ETE and 1 ETT .

                        Location             Se        BL        Se        BL         Se       BL         Se       BL
                         Soil               BL         BL        Sb        Sb        Dd        Dd         Se        Se
                   P
                   PET          (mm)     4090.1 3490.8       4121.0 3406.8       3593.9 3316.7        3985.0 3323.0
                   PETE         (mm)     2102.5 1616.9       2110.3 1595.1       1941.7 1593.1        2228.2 1668.0
                     ETT
                     P          (mm)     1987.5 1873.9       2010.7 1811.7       1652.1 1723.7        1756.8 1655.0
                   1 PET        (mm)          599.3               714.2               277.1                661.9
                   1 PETE       (mm)          485.7               515.2               348.7                560.2
                   1 ETT        (mm)          113.6               199.0               -71.5                101.8

4   Conclusion                                                          opment and a higher crop water use efficiency demonstrated
                                                                        that less plant available soil water did not go along with a
                                                                        decline of grain yield, because plants used the available soil
Lysimeter data from a Germany-wide lysimeter network                    water resources under such conditions more efficiently (e.g.
(TERENO-SOILCan), where intact soil monoliths were                      by reduced soil evaporation). Results revealed in contrast
moved to sites with contrasting climatic conditions, were               to our hypothesis of a linear productivity function for some
used to analyse effects of soil and climate on agricultural             crops a quadratic productivity function and thus showed that
ecosystems in a soil–climate crossed factorial design. In the           plants can maximize their grain yield under an intermediate
wet climate, there was a net drainage which was larger for the          ET range in rainfed agriculture. However, longer time series
coarser- than for the finer-textured soils. In the dry climate, a       are necessary to confirm the latter hypothesis of a quadratic
small negative net drainage (upward flux) was obtained when             productivity function of the corresponding crop. Our results
observing the long-term average for the whole period 2011–              suggest that despite the higher grain yield (quantity), climatic
2017. In the wet climate, drainage dominated for all soils.             conditions seemed not to affect the quality of the yield, which
When looking at shorter periods, negative values of monthly             might reflect a positive effect of the regional drier climatic
net fluxes were observed during the summer months at both               conditions for crop production. The results of this study so
sites.                                                                  far confirmed that typical soil water balance components,
   During winter months, the soil water storage returned to             crop water use and especially the soil water storage dynam-
a typical value, and drainage occurred when this value was              ics undergo a substantial change when exposed to different
reached. In the dry climate, this critical SWS was not reached          climatic conditions.
in two soils after the growing season of 2015 in which the                 The result further suggests that:
SWS was strongly depleted. The resulting insufficient refill-
ing of the soil water storage capacity after a drought suggests           1. A new approach based on lysimeter mass data can en-
that the precipitation during the following winter months was                able the long-term monitoring of SWS changes at the
not sufficient to refill the soil so that no drainage took place.            pedon scale.
This lack of drainage had consequences for the upward wa-                 2. SWS dynamics were vulnerable to droughts and led to
ter fluxes in the following growing seasons. Future studies                  an insufficient refilling of the soil water storage capac-
about the impact of climate change, which in general are ex-                 ity.
pected to increase the frequency and duration of droughts, on
agro-ecosystem water balances and crop development should                 3. Crossed soil–climate experiments are useful to deter-
consider the long-lasting impact of droughts on the soil water               mine the impact of changing climatic conditions on the
balance and soil water fluxes that are carried over to follow-               ecosystem water balances.
ing years. Results indicate that direct observation on the SWS
                                                                          4. Crop water use efficiencies increased with reduced wa-
will become increasingly important in environmental climate
                                                                             ter supply.
change studies, where changing climatic conditions could af-
fect the SWSC. Longer-term monitoring data are needed to                The results herald the need to account for potential changes
observe effects of impacts on soil properties.                          in soil water storage and plant reactions due to changes in
   Crops were more productive in terms of grain yield and               climatic conditions and variability when trying to develop
used less water under drier climatic conditions. Plant devel-           adaptation strategies in the agricultural sector.

www.hydrol-earth-syst-sci.net/24/1211/2020/                                           Hydrol. Earth Syst. Sci., 24, 1211–1225, 2020
1222 J. Groh et al.: Responses of soil water storage and crop water use efficiency
Data availability. All data for the specific lysimeter and weather Albert, M., Nagel, R.-V., Nuske, R. S., Sutmöller, J., and Spell-
station (raw data) can be freely obtained from the TERENO mann, H.: Tree Species Selection in the Face of Drought
data portal (https://teodoor.icg.kfa-juelich.de/ddp/index.jsp (last ac- Risk – Uncertainty in Forest Planning, Forests, 8, 1–25,
cess: 4 March 2020; Kunkel et al., 2013), lysimeter station https://doi.org/10.3390/f8100363, 2017.
Bad Lauchstädt and Selhausen: SE_Y_03 and SE_Y_04). Cli- Alizadeh, M. R., Bagheri, I., and Payman, M. H.: Evaluation of a
mate data for the experimental station Bad Lauchstädt can be Rice Reaper Used for Rapeseed Harvesting, American-Eurasian
acquired upon request from Ralf Gründling. The processed data J. Agric. & Environ. Sci., 2, 388–394, 2007.
to support the findings of this study can be acquired also from Allen, R. G., Pruitt, W. O., Wright, J. L., Howell, T. A., Ventura,
the TERENO data portal (https://hdl.handle.net/20.500.11952/butt. F., Snyder, R., Itenfisu, D., Steduto, P., Berengena, J., Yrisarry,
metadata.handle/00000010; Groh, 2019). J. B., Smith, M., Pereira, L. S., Raes, D., Perrier, A., Alves, I.,
Walter, I., and Elliott, R.: A recommendation on standardized
surface resistance for hourly calculation of reference ETo by the
Supplement. The supplement related to this article is available on- FAO56 Penman-Monteith method, Agr. Water Manage., 81, 1–
line at: https://doi.org/10.5194/hess-24-1211-2020-supplement. 22, https://doi.org/10.1016/j.agwat.2005.03.007, 2006.
Asseng, S., Ewert, F., Martre, P., Rötter, R. P., Lobell, D. B., Cam-
marano, D., Kimball, B. A., Ottman, M. J., Wall, G. W., White,
Author contributions. TP conceived the experiments. JG, JV, HHG J. W., Reynolds, M. P., Alderman, P. D., Prasad, P. V. V., Aggar-
and TP had the idea and designed the study. JG and RG provided wal, P. K., Anothai, J., Basso, B., Biernath, C., Challinor, A. J.,
the data for the corresponding lysimeter stations. JG performed the De Sanctis, G., Doltra, J., Fereres, E., Garcia-Vila, M., Gayler,
data analysis and wrote the paper with equal contributions from all S., Hoogenboom, G., Hunt, L. A., Izaurralde, R. C., Jabloun,
co-authors. M., Jones, C. D., Kersebaum, K. C., Koehler, A. K., Müller, C.,
Naresh Kumar, S., Nendel, C., O’Leary, G., Olesen, J. E., Palo-
suo, T., Priesack, E., Eyshi Rezaei, E., Ruane, A. C., Semenov,
M. A., Shcherbak, I., Stöckle, C., Stratonovitch, P., Streck, T.,
Competing interests. The authors declare that they have no conflict
Supit, I., Tao, F., Thorburn, P. J., Waha, K., Wang, E., Wal-
of interest.
lach, D., Wolf, J., Zhao, Z., and Zhu, Y.: Rising temperatures
reduce global wheat production, Nat. Clim. Change, 5, 143–147,
https://doi.org/10.1038/nclimate2470, 2014.
Acknowledgements. We acknowledge the support of TERENO and Asseng, S., Martre, P., Maiorano, A., Rötter, R. P., O’Leary, G. J.,
SOILCan, which were funded by the Helmholtz Association (HGF) Fitzgerald, G. J., Girousse, C., Motzo, R., Giunta, F., Babar, M.
and the Federal Ministry of Education and Research (BMBF). We A., Reynolds, M. P., Kheir, A. M. S., Thorburn, P. J., Waha,
thank the colleagues at the corresponding lysimeter station for their K., Ruane, A. C., Aggarwal, P. K., Ahmed, M., Balkovič, J.,
kind support: Sylvia Schmögner, Petra Petersohn and Ines Mer- Basso, B., Biernath, C., Bindi, M., Cammarano, D., Challinor,
bach (Bad Lauchstädt); Jörg Haase (Dedelow); and Werner Küp- A. J., De Sanctis, G., Dumont, B., Eyshi Rezaei, E., Fereres,
per, Ferdinand Engels, Philipp Meulendick, Rainer Harms and Le- E., Ferrise, R., Garcia-Vila, M., Gayler, S., Gao, Y., Horan,
ander Fürst (Selhausen). Thanks also go to Gernot Verch (Dedelow- H., Hoogenboom, G., Izaurralde, R. C., Jabloun, M., Jones, C.
ZALF) for helpful discussions and constructive comments. We ac- D., Kassie, B. T., Kersebaum, K.-C., Klein, C., Koehler, A.-
knowledge the comments from the editor, Markus Weiler, and two K., Liu, B., Minoli, S., Montesino San Martin, M., Müller, C.,
anonymous reviewers that helped to improve this paper. Naresh Kumar, S., Nendel, C., Olesen, J. E., Palosuo, T., Porter,
J. R., Priesack, E., Ripoche, D., Semenov, M. A., Stöckle, C.,
Stratonovitch, P., Streck, T., Supit, I., Tao, F., Van der Velde, M.,
Financial support. The publication of this article was funded by the Wallach, D., Wang, E., Webber, H., Wolf, J., Xiao, L., Zhang,
Open Access Fund of the Leibniz Association. Z., Zhao, Z., Zhu, Y., and Ewert, F.: Climate change impact and
adaptation for wheat protein, Glob. Change Biol., 25, 155–173,
https://doi.org/10.1111/gcb.14481, 2019.
Review statement. This paper was edited by Markus Weiler and re- Blois, J. L., Williams, J. W., Fitzpatrick, M. C., Jackson, S. T., and
viewed by two anonymous referees. Ferrier, S.: Space can substitute for time in predicting climate-
change effects on biodiversity, P. Natl. Acad. Sci. USA, 110,
9374–9379, https://doi.org/10.1073/pnas.1220228110, 2013.
Bogena, H. R., Montzka, C., Huisman, J. A., Graf, A., Schmidt,
M., Stockinger, M., von Hebel, C., Hendricks-Franssen, H.
References J., van der Kruk, J., Tappe, W., Lücke, A., Baatz, R., Bol,
R., Groh, J., Pütz, T., Jakobi, J., Kunkel, R., Sorg, J., and
Adhikari, K. and Hartemink, A. E.: Linking soils to ecosys- Vereecken, H.: The TERENO-Rur Hydrological Observatory: A
tem services – A global review, Geoderma, 262, 101–111, Multiscale Multi-Compartment Research Platform for the Ad-
https://doi.org/10.1016/j.geoderma.2015.08.009, 2016. vancement of Hydrological Science, Vadose Zone J., 17, 1–22,
Agam, N. and Berliner, P. R.: Dew formation and water vapor ad- https://doi.org/10.2136/vzj2018.03.0055, 2018.
sorption in semi-arid environments – A review, J. Arid Environ.,
65, 572–590, https://doi.org/10.1016/j.jaridenv.2005.09.004,
2006.
Hydrol. Earth Syst. Sci., 24, 1211–1225, 2020 www.hydrol-earth-syst-sci.net/24/1211/2020/You can also read