Honeybee colonies compensate for pesticide induced effects on royal jelly composition and brood survival with increased brood production - Nature
←
→
Page content transcription
If your browser does not render page correctly, please read the page content below
www.nature.com/scientificreports
OPEN Honeybee colonies compensate
for pesticide‑induced effects
on royal jelly composition
and brood survival with increased
brood production
Matthias Schott1,2, Maximilian Sandmann3, James E. Cresswell4, Matthias A. Becher5,
Gerrit Eichner6, Dominique Tobias Brandt7, Rayko Halitschke8, Stephanie Krueger9,
Gertrud Morlock9, Rolf‑Alexander Düring10, Andreas Vilcinskas1, Marina Doris Meixner3,
Ralph Büchler3 & Annely Brandt3*
Sublethal doses of pesticides affect individual honeybees, but colony-level effects are less well
understood and it is unclear how the two levels integrate. We studied the effect of the neonicotinoid
pesticide clothianidin at field realistic concentrations on small colonies. We found that exposure
to clothianidin affected worker jelly production of individual workers and created a strong dose-
dependent increase in mortality of individual larvae, but strikingly the population size of capped
brood remained stable. Thus, hives exhibited short-term resilience. Using a demographic matrix
model, we found that the basis of resilience in dosed colonies was a substantive increase in brood
initiation rate to compensate for increased brood mortality. However, computer simulation of full size
colonies revealed that the increase in brood initiation led to severe reductions in colony reproduction
(swarming) and long-term survival. This experiment reveals social regulatory mechanisms on colony-
level that enable honeybees to partly compensate for effects on individual level.
Bees provide vital pollination services to crops and wild plants and thus play a key role in global food security
and the maintenance of biodiversity1,2. However, the number of managed honeybees and wild bees has declined
over the last few decades in North America3–5 and Europe5,6. The substantial environmental impact on honeybee
colonies is thought to be driven mainly by pathogens and p arasites7, but the quality and diversity of the pollen
diet8–10 as well as exposure to pesticides5,11 may also affect bee health and survival. In particular, the widespread
use of neonicotinoids is considered a major threat to bee h ealth5,12–17. Neonicotinoid insecticides are among the
most important crop protection chemicals and they are widely used in seed dressings and spray applications13,14,18.
Neonicotinoids are neurotoxins that act as nicotinic acetylcholine receptor agonists to disrupt neuronal cho-
linergic signal transduction, leading to abnormal behavior in target pests, or immobility and death at higher
doses13,19,20. Non-target insects such as bees also come into contact with these systemic insecticides via pollen,
nectar or guttation droplets. Insecticide residues are carried back to the colony by forager bees and remain stored
in beebread or honey until they are fed to larvae, workers, drones, or the q ueen7,21,22.
Honeybees are highly eusocial insects, with labor division and intensive brood care, where adult members
of a colony care cooperatively for the young23. As nurse bees, young workers produce brood food (worker jelly)
1
Institute of Insect Biotechnology, Justus-Liebig-University Giessen, Giessen, Germany. 2Animal Ecology I, University
of Bayreuth, Universitaetsstr. 30, 95447 Bayreuth, Germany. 3LLH Bee Institute, Erlenstr. 9, 35274 Kirchhain,
Germany. 4Biosciences, University of Exeter, Exeter EX4 4PS, UK. 5Environment and Sustainability Institute,
Biosciences, University of Exeter, Penryn Campus, Penryn TR10 9FE, Cornwall, UK. 6Mathematical Institute,
Justus-Liebig University of Giessen, Giessen, Germany. 7Institute of Pharmacology, Biochemical‑Pharmacological
Centre (BPC), University of Marburg, Karl‑von‑Frisch‑Str. 1, 35032 Marburg, Germany. 8Department of
Molecular Ecology, Max Planck Institute for Chemical Ecology, Hans Knöll Str. 8, 07745 Jena, Germany. 9Chair
of Food Science, Institute of Nutritional Science, Justus Liebig University Giessen, Heinrich‑Buff‑Ring 26‑32,
35392 Giessen, Germany. 10Institute of Soil Science and Soil Conservation, Justus-Liebig-University of Giessen,
Heinrich‑Buff‑Ring 58, 35392 Giessen, Germany. *email: annely.brandt@llh.hessen.de
Scientific Reports | (2021) 11:62 | https://doi.org/10.1038/s41598-020-79660-w 1
Vol.:(0123456789)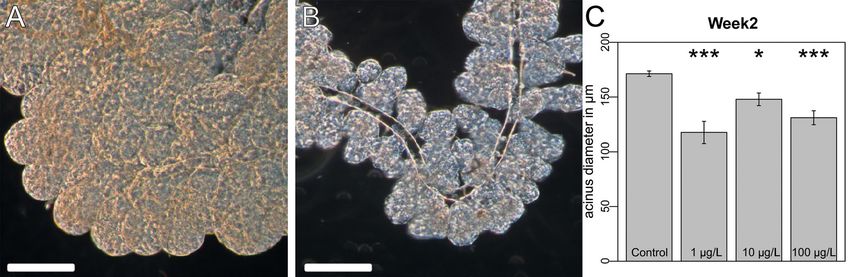
www.nature.com/scientificreports/
Figure 1. Hypopharyngeal gland size in age-defined worker bees. Age-defined worker bees, which were placed
in the colonies and recovered in week 2 (12 days after hatching), were analyzed for the acini size of the HPG.
(A) HPG of a control worker bee. (B) HPG of a worker bee from a colony exposed to 100 µg/L clothianidin
(bar = 100 µm). (C) Clothianidin exposure reduced the acinus diameter of HPGs. Control individuals had larger
acini than workers exposed to clothianidin (control, n = 31; 1 µg/L, n = 22; 10 µg/L, n = 22; 100 µg/L, n = 23).
Mixed-effects ANOVA, (P = 0.0120; post hoc Dunnett contrasts, control vs. 1 µg/L, P < 0.001; control vs. 10 µg/L,
P = 0.0345; control vesus 100 µg/L, P = 0.0027). Raw data and technical details of the analysis are presented in the
supplementary statistical report, “Hypopharyngeal gland size” section.
in the hypopharyngeal gland (HPG). The development of this gland begins soon after hatching, and the lobes of
the gland (acini) reach their maximum size and weight when the workers are 8–12 days old24,25. Several chemical
compounds reduce the size of the HPG in nurse bees: neonicotinoid insecticides, the varroazide coumaphos, the
insect growth regulator fenoxycarb, and the fungicide captan26–29. The effect of neonicotinoids on brood mortality
is a matter of discussion. Laboratory survival tests show that artificially-reared larvae can consume neonicotinoids
in quantities larger than would ever be encountered in the field without direct lethal effects30. However, a reduced
number of brood cell has been observed in some field s tudies11, which may indicate that neonicotinoids affect
brood mortality indirectly, for example due to insufficient brood care by nurse bees affected by the pesticides.
Recently, Siefert et al.31 were able to demonstrate by automated long-term behavioral observations that exposure
to neonicotinoids indeed reduces the number and duration of feeding visits of worker larvae. Numerous studies
have demonstrated that neonicotinoids affect the behavioral or physiological traits of individual honeybees21,32–35.
However, the assessment of the impact on colony growth and survival has been divergent, ranging from negative
impact36–39 to no impact39–43, sometimes even in the same study38. We therefore investigated this phenomenon
using small nucleus colonies rather than full-sized standard colonies, thus reducing the number of individuals
substantially. This allowed us to study the sublethal effects of the neonicotinoid clothianidin at the physiological
level in individual larvae and nurse bees and also to determine its impact on brood development of an entire
colony. Using a demographic modeling approach, we tested for compensatory mechanisms at the colony level
and extrapolated the results from small nucleus colonies to full-sized colonies using the agent-based honeybee
model BEEHAVE44.
Results
The experimental scheme, climate recordings, clothianidin levels in the spiked feeding solutions, clothianidin
residues in worker bees, protein content and antimicrobial activity of worker jelly and the statistical report are
presented in the supplementary data (SFigs 1–4).
Hypopharyngeal gland size. After spending 12 days in the experimental colonies, age-defined workers
of the control hives had significantly larger acini than those of colonies exposed to clothianidin (Fig. 1A–C;
Mixed-effects ANOVA P = 0.01199, post hoc Dunnett contrasts: control vs. 1 µg/L: P < 0.001; control vs. 10 µg/L:
P = 0.03447; control vs. 100 µg/L P = 0.00269). The mean diameters of the acini were 171.22 µm (SEM = 2.24,
n = 30) for the controls, 129.66 µm (SEM = 8.60, n = 16) in the 1 µg/L group, 147.92 µm (SEM = 5.79, n = 22) in
the 10 µg/L group, and 131.06 µm (SEM = 6.39, n = 23) in the 100 µg/L group.
In addition, we measured the acinus diameter of randomly chosen worker bees of undefined age during week
7. The mean diameters of the acini were 144.36 µm (SEM = 4.43, n = 28) for the controls, 133.59 µm (SEM = 7.61,
n = 22) in the 1 µg/L group, 138.04 µm (SEM = 5.02, n = 22) in the 10 µg/L group, and 109.39 µm (SEM = 4.83,
n = 29) in the 100 µg/L group. Workers in the control hives had significantly larger acini than those exposed
to 100 µg/l clothianidin (mixed-effects ANOVA P = 0.01379; post hoc Dunnett contrasts: control vs. 100 µg/L:
P = 0.000699). By utilization of Hive.ID as random effect in the mixed effect model (see statistics in attachment),
we acknowledge that hives can have an influence on gland size. This random effect accounted for a possible hive
effect on gland size. In this way, each hive got its own baseline so that we were able to analyze the effect of treat-
ment without the effect of the colony diversity.
Scientific Reports | (2021) 11:62 | https://doi.org/10.1038/s41598-020-79660-w 2
Vol:.(1234567890)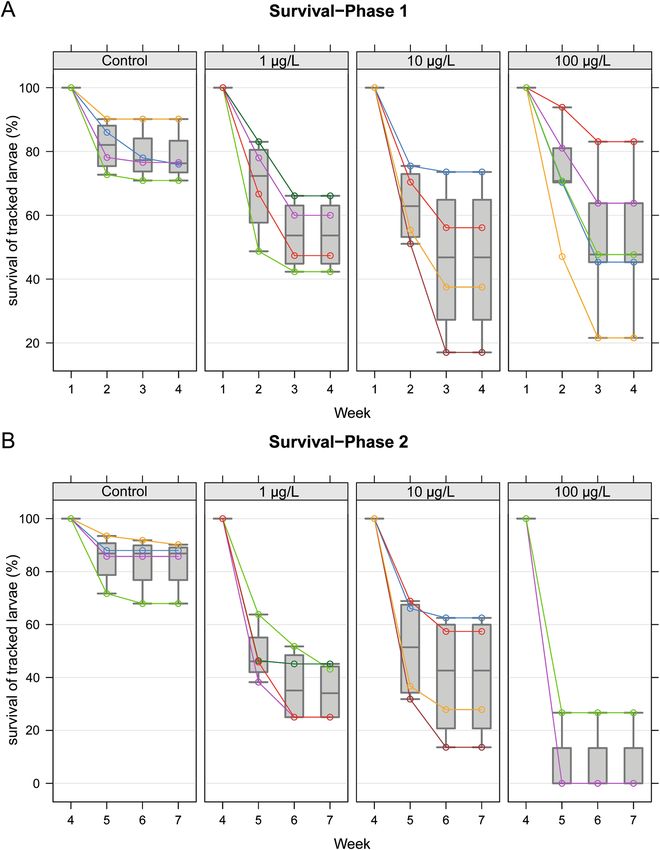
www.nature.com/scientificreports/
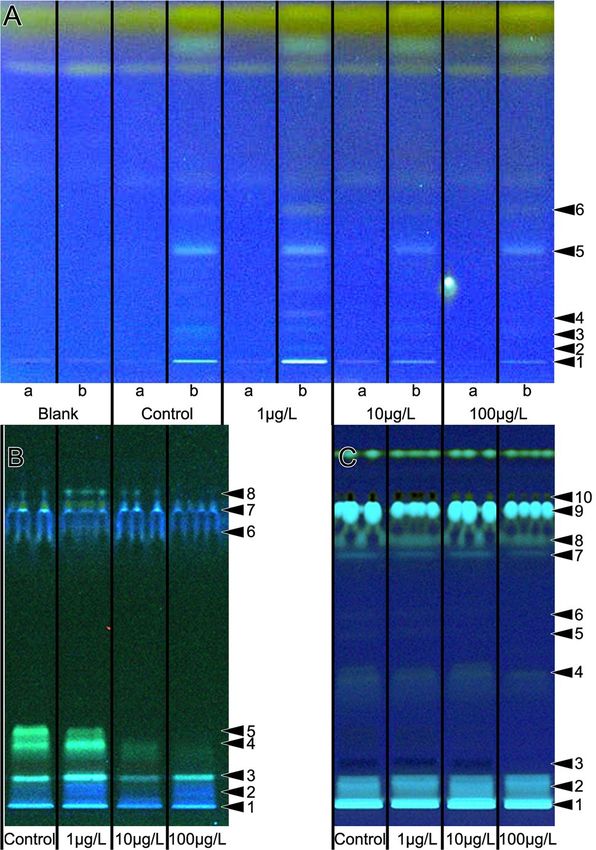
Figure 2. Lipid profiles of worker jelly samples (A) and larvae (B, C) from week 3. Samples of worker jelly
(A) were taken using absorptive filter strips (Sugi strips), extracted with n-hexane and separated by HPTLC.
Each Sugi strip was halved: one half without the sample (track a) and the other with absorbed sample (track
b). A fresh Sugi strip from the same batch as the strips used in the experiment cut in two equal halves served
as the blank. The lanes are labeled to show the dose of clothianidin treatments (control = no clothianidin). The
analysis of larvae is shown before (B) and after derivatisation (C). For worker jelly, the declining quantity of
substances was observed for the lipid profiling (UV 366 nm after derivatization). The latter also was evident for
the larvae. Numbers on the right side indicate differences, see SFig 3B, F and H.
HPTLC analysis of worker jelly and larvae. The lipid composition of worker jelly during weeks 3 and
7 was analyzed using non-targeted High-performance thin-layer chromatography (HPTLC). Semi-quantitative
differences in the lipid composition were observed in the 10 and 100 µg/L clothianidin treatment groups com-
pared to the control colonies in week 3. Our robust non target screening HPTLC analysis indicated a reduction
of lipids (Fig. 2A) and in antimicrobial activity against the luminescent A. fischeri bacteria (SFig 3)45. The lipid
profiles of larvae also indicated differences between the treatment groups during week 3 (Fig. 2B,C). The blank
Sugi strips as well as the part of the Sugi test strip that had not contacted the sample showed no lipid signals. The
results of the combined, orthogonal physicochemical analysis and activity-based detection of HPTLC-separated
compounds suggest a decline in antimicrobial activity corresponding to the decline in the amount of lipids in
the worker jelly. The lipid profiles of larvae also showed semi-quantitative differences between the different treat-
ment groups during week 3 (Fig. 2B,C). The profiling of larval liposoluble components showed a similar decline
in the concentration of several compounds in colonies treated with 10 and 100 µg/L clothianidin compared to
untreated control larvae. The total amount of protein in the worker jelly did not differ between the treatment
groups (SFig. 4).
Brood survival. To assess whether clothianidin exposure affected brood survival, we traced the develop-
ment of individual, newly-hatched larvae. At the beginning of the experiment (brood survival phase A, weeks
1–4) as shown in Fig. 3A, an average of 78% of the tracked larvae in control colonies developed normally to
capped brood and the cells were empty within the expected time frame (SD 8.2%, for a total of 230 larvae in week
1 in n = 4 hives), which was considered as survival of the larvae. In contrast, an average of only 54% of the larvae
in the 1 µg/L treatment group survived (SD 11%, for a total of 244 larvae in week 1 in n = 4 hives). In colonies
exposed to 10 µg/L clothianidin, only 46% of the larvae survived (SD 24%, for a total of 248 larvae in week 1 in
n = 4 hives) of the monitored larvae survived. In the 100 µg/L treatment group, only 52% of the larvae survived
(SD 23%, for a total of 303 larvae in week 1 in n = 5 hives). Clothianidin exposure significantly affected the brood
Scientific Reports | (2021) 11:62 | https://doi.org/10.1038/s41598-020-79660-w 3
Vol.:(0123456789)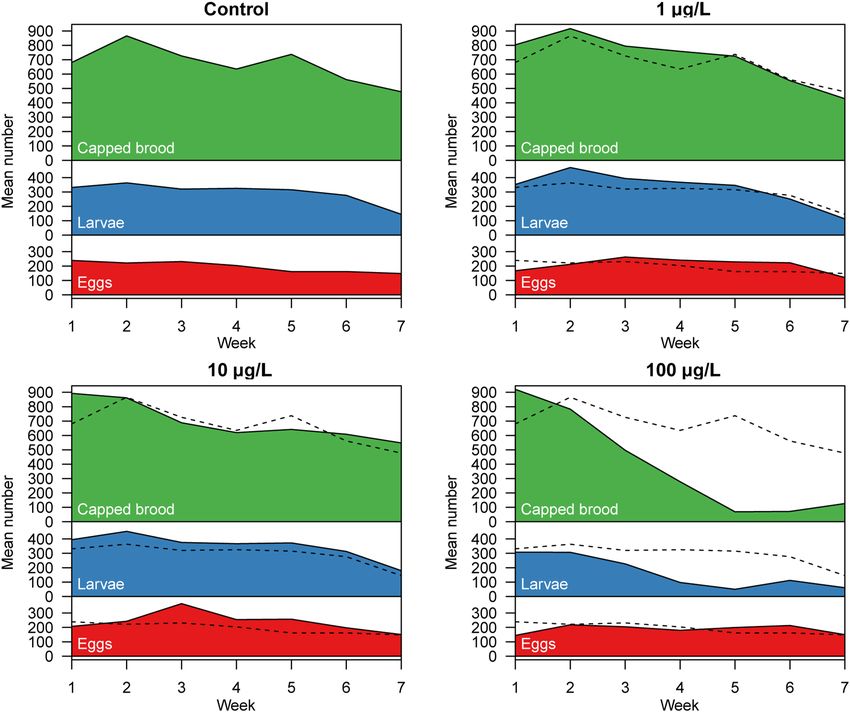
www.nature.com/scientificreports/

                                           Figure 3.  Survival of individually tracked larvae. Individually marked brood cells were tracked from the first
                                           larval stage (day 4–5 after egg laying) to emergence. (A) The percentage of brood surviving from week 1 to week
                                           4 (survival phase A). Colonies exposed to clothianidin showed a reduced brood survival. Clothianidin exposure
                                           significantly affects brood survival (exposure-by-time interaction in mixed-effects ANOVA, P = 0.0293). One-
                                           sided tests for post hoc Dunnett contrasts yielded no significant P values in week 2, but in week 3 all clothianidin
                                           treatments showed significant differences (control vs. 1 µg/L, P = 0.0414; control vs. 10 µg/L, P = 0.0241; control
                                           vs. 100 µg/L, P = 0.0418). (B) The percentage of brood surviving from week 4 to week 7 (survival phase B).
                                           Clothianidin exposure reduced the number of surviving brood (exposure-by-time interaction in mixed effects
                                           ANOVA, P = 0.03776). One-sided tests for post hoc Dunnett contrasts in weeks 5 and 6: each clothianidin
                                           treatment has a significantly lower brood survival than the control group (P < 0.0001 in all cases). Technical
                                           details of the analysis are provided in the supplementary statistical report, “Brood survival” section.

                                           survival time (exposure-by-time interaction in mixed-effects ANOVA, P = 0.02929; one-sided tests for post hoc
                                           Dunnett contrasts in weeks 2 and 3). In week 2, none of the clothianidin treatments reduced brood survival
                                           significantly, but in week 3 each clothianidin treatment had a significant effect (control vs. 1 µg/L, P = 0.0414;
                                           control vs. 10 µg/L, P = 0.0241; control vs. 100 µg/L, P = 0.0418).
                                               In brood survival phase B (weeks 4–7) as shown in Fig. 3B, the average brood survival was 82.9% (SD = 10.2%,
                                           for a total of 260 larvae in week 4 in n = 4 hives) in the control group, 34.6% (SD = 11.1%, for a total of 280 larvae
                                           in week 4 in n = 4 hives) in the 1 µg/L treatment group, and 40.3% (SD = 23.5%, for a total of 218 larvae in week

          Scientific Reports |   (2021) 11:62 |                 https://doi.org/10.1038/s41598-020-79660-w                                                     4

Vol:.(1234567890)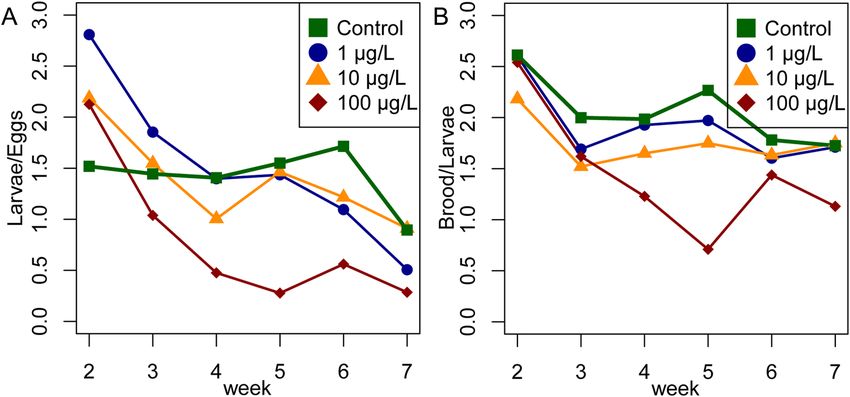
www.nature.com/scientificreports/

                                 Figure 4.  Brood quantification. Every week, the mean number of eggs (red), larvae (blue), and pupae (green)
                                 was determined for every colony over a period of 7 weeks. The black dashed line depicts the mean values of
                                 the control. In colonies exposed to lower or medium concentrations of clothianidin, the mean number of eggs,
                                 larvae or capped brood were similar or tended to exceed the numbers of the control group. The trends for
                                 the eggs, larvae, and capped brood cells all differed significantly between the treatment groups (main effects
                                 of quadratic time and their interaction with treatment in linear mixed-effects models, P < 0.001 in all cases).
                                 Pairwise comparisons showed that the temporal profiles of eggs differed significantly from the control for all
                                 clothianidin doses (P < 0.03 in all cases), and that for larvae and capped brood cells only the 100 µg/L group
                                 differed significantly from the control. Weeks 6 and 7 were already in September, thus a seasonally related drop
                                 in brood nest size was observed at the end of the experiment. Raw data and technical details of the analysis are
                                 provided in the supplementary statistical report, “HPTLC analysis of worker jelly and larvae” section.

                                 4 in n = 4 hives) in the 10 µg/L treatment group. In all colonies exposed to 100 µg/L clothianidin, fewer than 50
                                 larvae were present by week 4 (11–34 larvae per colony, with an average number of larvae of 19.25). The aver-
                                 age brood survival was 6.7% (SD = 13.3%, for a total of 77 larvae in week 4 in n = 4 hives) in the 100 µg/L group.
                                 Clothianidin exposure significantly affected brood survival over time (exposure-by-time interaction in mixed-
                                 effects ANOVA, P = 0.03776; one-sided tests for post hoc Dunnett contrasts in weeks 5 and 6 in each clothianidin
                                 treatment group revealed a significantly lower brood survival compared to the control group P < 0.0001 in all
                                 tests). For the detailed analysis, see the supplementary statistical report.

                                 Brood quantification. To achieve the total quantification of brood cells of a colony, all cells containing
                                 eggs, larvae, and pupae were counted at all sampling time points for each colony (Fig. 4). Detailed results and
                                 analysis are provided in the supplementary statistical report. The temporal profiles for the mean numbers of eggs
                                 differed significantly between the treatment groups (main effect of quadratic time and its interaction with treat-
                                 ment in a linear mixed-effects model, P
www.nature.com/scientificreports/
Clothianidin Lt observed h
Control 300 56
1 µg/L 300 88
10 µg/L 300 98
100 µg/L 300 107
Table 1. Modeling of demographic compensation. In order to maintain a stable larval population ( Lt
observed), colonies exposed to clothianidin would need to hatch more larvae per week than controls (h
denotes the number of eggs that hatch into larvae each week).
Figure 5. Ratio between developmental stages. (A) The ratio of the number of larvae/eggs. The eggs in week
2 become the larvae of week 3, so the number of larvae is shifted by 1 week. The ratio of controls is stable
throughout the experiment (mean = 1.5) until week 7, where a seasonally related drop in brood activity was
observed. (B) The ratio of capped brood/larvae (number of capped brood shifted by 1 week) was stable in the
controls (mean = 2.06), and the 1 µg/L (mean = 1.92) and 10 µg/L (mean = 1.7) groups, but dropped in the 100
µ/L treatment group in weeks 4 and 6 (mean = 1.44).
that the random hive effect was non-significant, P < 0.0001). However, when comparing the parabolic temporal
profiles of larvae in the treatment groups with the control, we found that only the profile of the 100 µg/L treat-
ment group differed significantly from the control in terms of the (local) slope during week 3 and the (global)
curvature (P < 0.014 in both cases).
The temporal profiles of the mean numbers of capped brood cells also differed significantly between the
treatment groups (main effect of quadratic time and its interaction with treatment in a linear fixed-effects
model, given that the random hive effect was non-significant, P = 0.00035). And as for the larvae, comparing the
parabolic profiles of capped brood cells in the treatment groups with the control, we found that only the profile
of the 100 µg/L group differed significantly from the control in terms of the (local) slope during week 3 and the
(global) curvature (P < 0.01 in both cases).
Demographic compensation. The demographic model was used to estimate the number of new larvae
that must hatch each week in order to maintain a stable number of larvae given the survivorship schedule of
larvae week by week. In order to maintain a stable larval population, the colonies dosed with 1 µg/L clothianidin
needed to hatch 1.57-fold more larvae per week than untreated controls, and this increased to 1.75-fold and
1.91-fold in the colonies dosed with 10 and 100 µg/L clothianidin, respectively (Table 1). In the control colonies,
a relatively stable ratio between the brood stages was maintained throughout the experiment. The median ratio
of the number of larvae to the number of eggs was 1.57, but this declined to 1.48, 1.38 and 0.60 in the colo-
nies dosed with 1, 10 and 100 µg/L clothianidin, respectively (Fig. 5A). The colonies exposed to clothianidin
had to produce more eggs to maintain a stable number of larvae. The larvae-to-eggs ratio temporal profile dif-
fered significantly between the treatment groups (treatment-by-time interaction in a linear mixed-effects model,
P = 0.0076). Pairwise comparisons of the treatment groups with the control revealed significant differences in the
temporal profiles for the 1 and 100 µg/L treatment groups (P < 0.016 in both cases). The analysis was carried out
by omitting an extreme outlier in week 2 in one hive of the 10 µg/L group.
The average ratio of the number of capped brood cells to the number of larvae (from the previous week,
for weeks 2–7) was 2.03 (median) but was consistently slightly lower in the colonies exposed to clothianidin at
doses of 1 µg/L (median = 1.92) or 10 µg/L (mean = 1.71) throughout the experiment (Fig. 5B). In the 100 µg/L
Scientific Reports | (2021) 11:62 | https://doi.org/10.1038/s41598-020-79660-w 6
Vol:.(1234567890)www.nature.com/scientificreports/
Clothianidin Brood survival experiments Brood survival model ProteinNurses Modifier_Exposed
control 0.8 0.92 ± 0.14 1
1 µg/L 0.4 0.38 ± 0.16 0.82
10 µg/L 0.2 0.20 ± 0.12 0.77
100 µg/L 0.0 0.02 ± 0.03 0
Table 2. Simulation of mating nucleus colonies in BEEHAVE. Modification of the factor
ProteinNursesModifier_Exposed in BEEHAVE simulations resulted in brood survival rates similar to
experimental data obtained in field experiments. The factor ProteinNursesModifier_Exposed reduces the
protein content of the jelly fed to the larvae (ProteinFactorNurses) in the model. A wide range of values for
ProteinNursesModifier_Exposed was tested, and the best fits are shown based on a comparison of modeled and
experimental brood survival.
treatment group, the median ratio was 1.28, but the profile was biphasic, with a median ratio of 1.58 up to the
end of week 4, falling sharply to 0.17 in week 5. Nevertheless, there was no significant difference in the temporal
profiles of the capped brood-to-larvae ratio between the treatment groups. Detailed results and analysis are
provided in the supplementary statistical report.
BEEHAVE simulations. To estimate the impact of our findings on colony development in standard-sized
hives we applied two BEEHAVE simulations. To mimic the situation of the experimental nucleus colonies in
BEEHAVE (simulation A), we tested a wide range of values for ProteinNursesModifier_Exposed, which repre-
sents the protein content of jelly fed to the larvae. The best fits are shown in Table 2 based on a comparison of
modeled and experimental brood survival. The output of these simulations was the average brood survival when
comparing brood cohort sizes at ages of 19 versus 3 days. The modeled brood survival was then compared to
the results of the experimental brood survival to determine the values for ProteinNursesModifier_Exposed that
represent the tested concentrations of clothianidin.
To estimate the potential impact of clothianidin exposure on standard-sized colonies (simulation B), we ran
BEEHAVE under default settings but reduced the protein content of the jelly (ProteinFactorNurses). The degree
to which the protein was depleted during exposure was defined by ProteinNursesModifier_Exposed, with values
set according to the results of the previous set of simulations (Table 2). Swarming was either prevented or allowed
(following the colony remaining in the hive). Colony sizes at the end of the year decreased with increasing
concentrations of clothianidin, particularly when swarming was prevented (Fig. 6). No swarms at all formed at
the highest clothianidin concentration. For the lower clothianidin concentrations, each colony released a single
swarm during the first year, whereas the control colonies produced on average 1.2 (± 0.41) swarms in the first year.
At the end of the first year, one of the control colonies died after producing two swarms, but all other colo-
nies survived (n = 30). When we extended the simulations over 3 years, two colonies in the 100 µg/L treatment
group died after the second year and another nine died at the end of the third year (regardless of whether or not
swarming was allowed, as these colonies did not swarm at all). No other colonies died after years two or three.
The mean colony sizes after 3 years (without swarming) were 11,335.3 worker bees (control, SD = 1,209.9), 9,951.4
(1 µg/L, SD = 943.5), 9,225.6 (10 µg/L, SD = 1,116.6), and 3,097.1 (100 µg/L, SD = 2,427.8).
Discussion
Brood care is fundamental to the maintenance of a honeybee colony and lies at the heart of its social
interactions25,46. We dissected the brood care activity of a colony by measuring the HPG size of individual nurse
bees, by chemical analysis of worker jelly and larval composition, by tracking the survival of individual larvae,
and by monitoring the overall brood production of the colony precisely. By this means, we established small
nucleus colonies as convenient pesticide testing systems, allowing us to investigate the key aspects of social inter-
actions and the manner in which colonies compensate for external stressors. The experimental setup covered a
range of field-realistic exposure levels to the neonicotinoid clothianidin, which reaches mean levels of 9.4 µg/kg
(maximum 41.2 µg/kg, mean prevalence 11%) in pollen and 1.9 µg/kg (maximum 10.1 µg/kg, mean prevalence
17%) in honey47. In the field, a colony is likely to be exposed to such concentrations for a shorter time than our
chronic exposure scenario, where colonies received clothianidin over a period of 7 weeks.
Our HPG measurements revealed that age-defined workers in all colonies exposed to clothianidin had sig-
nificantly smaller acini than untreated controls. Indeed, we found a non-linear dose–response relationship of
clothianidin on acini size. Non-linear dose–response relationships of toxins have been reported before and have
been also described for neonicotinoids36,37. Smaller HPGs could lead to malnutrition, because young larvae
and the queen feed exclusively on worker jelly and older larvae receive worker jelly in a suspension with honey
and pollen25. Neonicotinoids are known to reduce the size of the HPG in individual nurse b ees28–30 and also to
reduce the levels of acetylcholine in their worker j elly30. We also found that the lipid composition of the worker
jelly and larvae changed when colonies were exposed to clothianidin. Accordingly, the expression of larval genes
involved in lipid and carbohydrate metabolism, and the lipid composition of larvae, was also shown to change
when honeybee colonies were exposed to field-realistic concentrations of imidacloprid48. We found that neither
concentration nor composition of protein in worker jelly was affected by clothianidin. However, the method we
used is only sensitive enough to detect substantial changes in protein composition, and more sensitive methods
such as mass spectrometry would be required to measure more subtle alterations. Only the highest concentration
Scientific Reports | (2021) 11:62 | https://doi.org/10.1038/s41598-020-79660-w 7
Vol.:(0123456789)www.nature.com/scientificreports/
Figure 6. Colony sizes decline with increasing concentrations of clothianidin in simulated full-sized colonies.
To estimate the potential impact of clothianidin exposure on standard-sized colonies, a BEEHAVE simulation
was conducted under default settings but with less protein in the jelly (ProteinFactorNurses) as defined by
ProteinNursesModifier_Exposed, with values set according to the results of the previous set of simulations
(Table 246). Colony sizes (mean number of worker bees) at the end of the year decreased with increasing
concentrations of clothianidin, particularly when swarming was prevented (dark grey). When swarming was
allowed (light grey), the control group produced 1.2 swarms in the first year. For the 1 and 10 µg/L treatment
groups, each colony released a single swarm during the first year. No swarms at all were produced in the
100 µg/L group.
of clothianidin we tested (100 µg/L) caused a general decrease in protein levels on the SDS-PAGE gel, although
there was no significant difference in the quantity of total extracted protein. This may indicate that high con-
centrations of clothianidin stimulate the activity of proteases in worker jelly. Alternatively, the general decrease
of protein levels in the SDS PAGE in the 100 µg/L group could also be due to high molecular weight aggregates
that are unable to enter the gel. In conclusion, even though the total protein concentration in worker royal jelly
appeared to be unaffected by clothianidin exposure, there may be an impact on the overall amount of brood food
produced by individual nurse bees, and this should be examined in future experiments.
rones49, young workers and even f oragers50. The capacity
Jelly is not only fed to larvae and queens but also to d
for pollen digestion enables nurse bees to exploit pollen nutrients efficiently and distribute the protein-rich food
to other members of the colony, which take on more specialized tasks such as reproduction and f oraging50. As
well as the observed negative impact on brood survival a deficiency of nurse bees could indirectly affect adult
workers and drones by reducing the amount of high-quality worker jelly available as food51. Given the key role
of nurse bees in the provision of nutrition not only to the brood and queen but also all other members of the
hive, there is an urgent need to study how pesticides affect their eusocial interactions.
Workers can regulate the egg-laying rate of a queen by controlling the quantity and quality of the food pro-
vided to the queen by nurse b ees52. The undernourishment of a queen can inhibit egg laying and thus reduce the
growth and survival of a colony. However, we found that the number of eggs in the colony differed little between
the treatment groups, although there was a trend for higher egg numbers in colonies exposed to clothianidin.
Given the 7-day intervals between assessments and the 3-day developmental period of an egg, we cannot be sure
that the egg-laying rate of the queen was not affected.
The effect of neonicotinoids on brood mortality is controversial. Laboratory survival tests show that arti-
ficially reared larvae can consume large quantities of neonicotinoids (more than they would encounter under
realistic field conditions) without direct lethal effects30. However, a reduction of the number of brood cell has
been observed in some field s tudies11,29,31 which suggests that neonicotinoids may have an indirect impact on
brood mortality, for example by preventing exposed nurse bees from completing their nurturing tasks effectively.
In the experimental colonies, we observed an absolute reduction in the number of brood cells only in the
group exposed to highest clothianidin concentration (100 µg/L). The effect was first observed after 3 weeks of
exposure. In the second phase of the experiment, the number of larvae or capped brood cells declined even
further. By week 4, no larvae at all were observed in 60% of the colonies, and in the remainder only very young
larvae were present (developmental stage 4–5 after egg laying). The stronger effect on brood cell numbers from
week 3 onwards may reflect the dilution of the active ingredient in the first few weeks of the experiment, given
the relatively large initial food stores of honey and beebread and the freedom of the bees to forage. As brood
Scientific Reports | (2021) 11:62 | https://doi.org/10.1038/s41598-020-79660-w 8
Vol:.(1234567890)www.nature.com/scientificreports/
jelly production is very much dependent on pollen intake by the nurse bees, this might have contributed to a
dilution of the effect in the first weeks of the experiment. In our experimental setting, the active nurse bees in
the second phase of the experiment were exposed to clothianidin during their entire development and adult
life, potentially having a substantial impact on their behavior. In the European Union, a honeybee brood test is
required for the risk assessment of pesticides according to OECD guideline 75. Like our brood survival assess-
ment, this test tracks the individual fate of a brood cell and determines the brood survival rate51. However, only
one brood cycle directly after pesticide exposure is mandatory for the OECD test, whereas our data show that
negative effects can be more severe in the second brood cycle.
The decreased brood survival in the clothianidin exposed colonies could either be a direct result of clothiani-
din on the brood that ends up in the food jelly, or an indirect effect related to brood care, e.g. on HPG function
or brood care behavior of the nurse bees. We did not test the clothianidin concentration in the worker jelly.
However, in laboratory studies, Böhme et al.54 exposed nurse bees with pesticides via a pollen and honey mixture.
Subsequently, only small concentrations of these chemicals were detected in the jelly produced by these bees.
The concentration varies with the pesticide and ranges between 0.001 (pyraclostrobin) to 0.016% (thiacloprid)
of the active ingredient in royal jelly compared to the spiked food ingested by the bee. These results suggest that
only low concentrations are delivered to queen larvae via royal j elly54. The number of pesticides and the amount
of each pesticide in worker jelly increased with larval age up to 0.1478%. This correlates with the increasing
amount of contaminated pollen that is added to the jelly of older worker l arvae54. In our study we only spiked the
sugar solution with clothianidin, the bees were allowed to collect non-contaminated pollen. This is an artificial
situation; systemic pesticides like clothianidin are usually present in nectar and pollen of treated p lant18. Thus,
the effect on brood survival might have been even stronger, if also the pollen would have contained clothianidin.
In the small nucleus colonies, brood survival was reduced even by field-realistic concentrations of clothianidin
(1 or 10 µg/L), particularly in the second phase of the experiment, where the survival of individually tracked
larvae was 40% or lower. Concurrently, the absolute numbers of larvae and pupae in the exposed colonies were
close to normal levels, and in some weeks even higher than in the untreated controls. This clearly shows that the
colonies compensated for the increase in mortality by producing more brood. Indeed, the colonies in the 1 µg/L
treatment group needed to produce 1.57-fold more larvae than the control group to maintain a stable population,
and this demand increased at higher concentrations of clothianidin. The contrast between the low survival rate
of the larvae and pupae yet the near normal absolute brood numbers under field-realistic exposure conditions
provides evidence of a remarkable additional brood-rearing effort in the colonies exposed to the pesticide, allow-
ing them to compensate for the negative effects of clothianidin on brood survival.
The overall costs for the colony of this compensatory brood activity are difficult to assess. First, we should
consider the number of eggs produced by the queen. Only fertilized eggs develop into worker bees, so colony
growth and survival depends on the ability of the queen to produce fertilized eggs. The lifetime performance
of a queen is limited by the number of sperm she receives on her nuptial flights and stores in her spermatheca.
In our experimental setting, a queen will never reach the limits of her egg-laying capacity, but in a full-sized
colony a queen might approach her reproductive limits earlier than normal and would need to be replaced by
the colony or the beekeeper. Premature queen supersedure and shorter queen lifespans are important drivers
of honeybee colony mortality7,11,37,38,53,54. The accelerated egg-laying we observed to compensate for increased
brood mortality might contribute to that problem. Second, to estimate the energetic costs of losing and replacing
brood for the colony, we must consider that most of the larvae and pupae that eventually die are consumed by
the workers, thus the nutrients are recycled and not completely lost to the colony. Third, it is difficult to judge
the effect of the reduced brood-rearing capacity on the life traits of individual worker bees. This phenomenon
can extend the lifespan of workers55, but more workers may get involved in brood-rearing tasks to compensate
for the more limited capacity of nurse bees to produce worker jelly. We do not know how the disruption of this
complex interaction affects overall colony fitness. As eusocial insects, honeybees depend on task specialization,
which is precisely adjusted to the needs of the colony. The increase in brood mortality and the inability of nurse
bees to produce sufficient worker jelly could easily interfere with this delicate balance with a serious impact on
colony fitness.
Because our experiments involved nucleus colonies, it is unclear to what extent the observed effects of clo-
thianidin exposure can be extrapolated to full-sized colonies. We estimated the impact on colony development
in standard hives using the honeybee model B EEHAVE44,56, which simulates colony dynamics and agent-based
foraging in realistic landscapes. The model was assessed by the European Food Safety Authority (EFSA), which
concluded it would be a good starting point to model the impact of pesticides and other stressors on honeybee
colonies57,58. Although BEEHAVE does not explicitly incorporate pesticides, it can be used to address their effects
on the behavior and mortality of bees i ndirectly59,60. Accordingly, exposure in our simulations was not depend-
ent on the foraging activities of the bees but was imposed by impairing the ability of in-hive bees to feed larvae
due to the production of lower amounts of high-quality worker jelly. We observed strong effects on swarming
and colony survival when we simulated clothianidin concentrations of 100 µg/L. Lower concentrations of clo-
thianidin, closer to field-realistic doses, had little impact on overwintering colony sizes and no effect on colony
survival, agreeing with previous findings reported by Cutler and c olleagues61. Although such colonies might
appear strong and healthy, we found that clothianidin had a strong negative effect on the number of swarms
produced, particularly at high doses. This effect was not considered by Cutler and colleagues61 but was reported
by Sandrock and coworkers for clothianidin and thiamethoxam11. Less frequent swarming would lower the
resilience of bee populations in response to other stressors and make them more vulnerable to colony losses due
to factors such as climate, weather, diseases or forage gaps.
The sublethal effects of neonicotinoid exposure on individual honey bees have been confirmed, but the impact
on the performance and survival of colonies remains controversial38. Nevertheless, colony-level performance is of
primary interest in managed honeybees because lower performance and higher rates of colony loss directly affect
Scientific Reports | (2021) 11:62 | https://doi.org/10.1038/s41598-020-79660-w 9
Vol.:(0123456789)www.nature.com/scientificreports/
beekeepers and pollination services. The inability to substantiate the sublethal effects of pesticides and reliably
detect them in field trials40,41 may reflect two major problems, which are discussed in turn below.
First, higher-tier field trials for the risk assessment of pesticides often lack statistical power as a result of the
relatively low sampling size (colony number). Only well-resourced enterprises such as the agrochemical industry
have the means to commission large-scale higher-tier field experiments. The outcome of these experiments is
in most cases confidential and the data are not available for scientific or public evaluation. However, with our
small nucleus colony approach, it is easy to scale up the number of colonies to achieve sufficient statistical power
and to perform field trials at a fraction of the cost of semi-field/field trials with full-sized colonies, thus allowing
independent research without industry funding.
Second, the ability of colonies to compensate for the impact of pesticides adds a layer of complexity to
investigations looking for the sublethal effects of pesticides. A colony is a functionally organized cooperative
group in which the tasks and activity levels of each individual are flexible and rapidly adjusted according to the
group’s needs62. The large number of interacting individuals allows the colony to adaptively reallocate work and
resources to compensate for potential negative effects on individuals. This plasticity enables the colony to react
adaptively to environmental stressors, masking the effects on individuals. Indeed, the ability of a honeybee
colony to withstand or recover quickly from disturbances is known as resilience, which is an intrinsic property
of many complex systems. However, events leading to loss of resilience in complex systems are rarely predict-
able and are often irreversible63. In honeybee colonies, this point arrives when the compensatory capacity of
the colony reaches its limits, triggering the sudden breakdown of a seemingly healthy colony, especially when
multiple stressors act together.
As a super-organism, a honeybee colony can compensate for many stressors due to the presence of many
individuals and the complex social interactions among t hem55. With our small nucleus colony approach, we
reduced the number of bees but maintained the social coherence of the colony64, allowing us to investigate the
compensatory capacity of the colony in detail. This sensitive model system allows the assessment of single or
multiple stressors on the compensatory capacity of the colony, and will help to close the knowledge gap between
laboratory cage experiments and field trials with full-sized colonies. This will facilitate not only scientific inves-
tigations, but also the regulatory testing for new pesticides.
Methods
Clothianidin exposure in field experiments. The experimental bee yard was situated in a subur-
ban area in Kirchhain (Germany) with sufficient natural pollen sources in late summer, where the honeybees
were allowed to forage freely. The field experiment took place with 20 Apis mellifera carnica colonies in Kirch-
hainer mating nuclei (25.5 × 19.8 × 17 cm), established with sister queens (A. m. carnica breeding line, mother:
17:27:20:11) mated on an island mating station (Norderney) and 180 g of worker bees each. We tried to reduce
the variance between colonies by using young sister queens from an island mating station. Furthermore, we used
small hives to minimize food competition so that we were able to set up the colonies within a rather small area of
20 by 20 m. In detail, the worker bees originated from four healthy colonies of the institute, located at an apiary
of the institute. In order to get a homogenous composition, worker bees of brood combs and honeycombs of two
colonies were shaken into a box and mixed thoroughly, before they were uniformly distributed into 10 mating
nuclei. This procedure was repeated to fill 20 mating nuclei. Subsequently, the mating boxes were placed in a cool
room (12 °C) for three day, to acclimatize, before they were transported to the island mating station Norderney.
The queens started to lay eggs at June 25, 2014. The clothianidin exposure started at July 28. Thus, the colonies
containing freshly mated, egg-laying queens were allowed to establish and build up an intact brood nest for four
weeks. Two days before clothianidin exposure (sampling day 0, S0; SFig. 1), the colony strength was assessed and
the treatment groups were randomly assigned to the hives such that differences between treatment groups were
minimized with respect to the strength of their colonies. Every week, from July 30 to September 10, each colony
received 400 mL of Apiinvert (Südzucker AG, Mannheim, Germany) sugar syrup (39% w/v fructose, 31% w/v
saccharose and 30% w/v glucose) spiked with clothianidin (1, 10 or 100 µg/L). Control colonies received sugar
syrup containing the same concentration of the solvent (water) as the clothianidin-treated groups. The syrup was
fed in zip-look bags placed inside the food chamber containing a climbing aid. After 1 week, the leftovers were
removed and weighed to record food consumption. For all four experimental groups, the analyzed clothinidin
levels were close to the target concentrations (Suppl. Table 1). Environmental data were recorded during the
study period using a USB data logger (EL-USB-2, Lascar Electronics Ltd., temperature accuracy ± 0.5 °C, relative
humidity accuracy ± 3%) located under the colonies.
Sampling. During weeks 3 and 7, random samples of worker bees, larvae and worker jelly were taken from
each colony. In detail, 20 randomly chosen worker bees located on a brood comb and five larvae (larval stage:
day 7 or 8 after egg laying) were immediately frozen for chemical analysis. To collect worker jelly, extra thick
blotting paper (Protean, Xi size; Bio-Rad, Hercules, CA, USA) was cut into strips, cleaned in pure ethanol and
acetone (Carl Roth, Karlsruhe, Germany) and dried in a heating cabinet at 80 °C. Each strip was inserted into
five brood cells containing a small larva (developmental day 4–5) to suck up the worker jelly and the strips were
immediately frozen.
To document brood development, each side of each comb was photographed within an empty hive box
transformed into a photo box containing a digital camera (Canon PowerShot A1000 IS, Tokyo, Japan) and a
ring-flash (Aputure Amaran AHL-C60 LED, Shenzhen, China). Brood documentation took place every week.
The colonies were sampled starting with the control and then from the lowest to highest concentration of clo-
thianidin to minimize the risk of carryover.
Scientific Reports | (2021) 11:62 | https://doi.org/10.1038/s41598-020-79660-w 10
Vol:.(1234567890)www.nature.com/scientificreports/
HPG size measurements. To obtain worker bees of a defined age, single frames of late-stage capped brood
(Binder, Tuttlingen, Germany) were brought to the laboratory and incubated in the dark at 32 °C, with humid-
ity provided by open water jars. The frames with worker brood were collected from two full-sized colonies,
which were regularly inspected for symptoms of disease and tested for Chronic bee paralysis virus, Deformed
wing virus, Acute bee paralysis virus, and Sac brood v irus65. Newly-emerged bees (≤ 24 h) were collected, color
marked, and transferred to the experimental colonies on July 28 (15 marked bees per colony). During the sec-
ond week of exposure, the marked bees (Suppl. Table 2) were removed from the colonies after 12 days in the
hive and immobilized on ice. The HPGs were dissected in ice-cold phosphate-buffered saline (PBS, pH 7.4).
The specimens were fixed in formaldehyde (4% in PBS, Carl Roth), rinsed three times in PBS, and mounted in
Aquapolymount (Polysciences, Eppelheim, Germany). Three pictures of each gland (only one gland per bee)
were photographed at 400x magnification using a phase contrast/fluorescence microscope (Leica DMIL, Leica
camera DFC 420C) and LAS v4.4 image-capturing software (Leica Microsystems, Wetzlar, Germany). To meas-
ure the size of each gland, the diameters of 30 acini per bee were measured using ImageJ v1.49o (http://rsb.info.
nih.gov/ij/index.html).
High‑performance thin‑layer chromatography. HPTLC was chosen as sensitive analytical method
in order to detect qualitative and semi-quantitative differences in the composition of brood food and larvae of
dosed hives. Individual larvae (one per colony) differing in their weights (200–500 mg/larva) were solely macer-
ated and extracted in 1 mL n-hexane (> 99% pure, Rotisolv, Carl Roth) in an ultrasonic bath for 1 min and then
vortexed for 1 min. For the analysis of worker jelly (from three cells per colony), adsorptive filter strips (Sugi
strips, Kettenbach, Eschenburg, Germany) were cut in half and one part was dipped in brood combs until maxi-
mal absorption of the material, whereas the other strip was used as background control strip, and both strips
were extracted as above. The supernatants of larvae and worker jelly were transferred to a fresh vial 1000 μL
isopropylacetate/methanol (3/2, v/v). After maceration for 1 min, the mix was vortexed for 1 min and the super-
natant was transferred to another vial. Between extractions, the samples were cooled on ice and stored at –20 °C.
The isopropylacetate/methanol extracts (20 µL/band for worker jelly and 7 µL/band for larvae) were sprayed
onto the silica gel 60 F
254 HPTLC plate (Merck, Darmstadt, Germany) using an Automatic TLC Sampler 4. The
plate of worker jelly was developed with a mobile phase consisting of chloroform/methanol/water/ammonia
(30/17/2/1, v/v/v/v, all Carl Roth66 and the plate of larvae with an 8-step gradient development based on metha-
nol, chloroform, toluene and n-hexane66,67. After drying in a stream of cold air for 2 min, the plate images were
documented at UV 366 nm using the TLC Visualizer. For derivatisation, the chromatogram was dipped into the
primuline solution (100 mg primuline in 200 mL acetone/water, 4/1 v/v, Sigma-Aldrich, Steinheim, Germany)
at an immersion speed of 2.5 cm/s and an immersion time of 1 s, dried and derivatised as before. The data were
processed using winCATS version 1.4.2.8121 (all instrumentation from CAMAG).
The bacterium Aliivibrio fischeri (NRRL-B11177, strain 7151), obtained from the German Collection of
Microorganisms and Cell Cultures (DSMZ, Leibniz Institute, Berlin, Germany), was used to assess a non-targeted,
broad range of effective substances within the worker jelly. HPTLC plates were developed as described above,
neutralized and immersed in a bacterial suspension, prepared according to DIN EN ISO 11,348–1 8 45 at an
immersion speed of 3 cm/s and an immersion time of 2 s. The bioluminescence of the wet bioautogram was
recorded in an interval of 3 min over 30 min using the BioLuminizer (CAMAG).
Brood assessment. The free extension of the open source program ImageJ, Fiji (http://fiji.sc/Fiji) was used
to count all cells with eggs, larvae, or sealed brood, for every colony on every sampling day. The photos of a single
comb from different sampling days were aligned in the program and all brood cells were counted. Because the
colonies had no wax foundations, some cells on the edges of these naturally-built combs were at an unfavorable
angle. Therefore, most but presumably not all cells with brood were visible in the photos. This uncertainty was
similar in all hives. To estimate the brood survival, we first tracked the development of individual eggs, but found
a high mortality rate even in control colonies. Therefore, we tracked the development of individual larvae (day
4–5 after egg laying) over 4 weeks (= sampling weeks). Brood survival was estimated for two periods during the
experiment (weeks 1–4 and 3–7).
Modeling of demographic compensation. The aim of the model was to estimate the number of new
larvae that must hatch each week in order to maintain a stable number of larvae up to 7 weeks of age given the
survivorship schedule of larvae week by week. Let h denote the number of eggs that hatch into larvae each week,
and let the probability that any individual larva dies in each successive week be mi, where i takes values in the set
{1, 2, …, 7} to indicate each of seven successive weeks, after which we assume that surviving larvae pupate. We
used a demographic matrix model68 to describe the state of the population of larvae each week as follows. Let lx
denote the number of larvae in the colony that are aged x weeks post-hatching and let mx denote their per capita
weekly mortality rate. The population of larvae is distributed into seven age classes and we also assign a class to
queens, which give rise to larvae by producing eggs. Using the Lefcovitch matrix approach, the larval population
of a colony can thus be viewed as a state vector nt whose week-by-week change is the product of a matrix A and
the population state vector nt, as shown in Eq. (1):
Scientific Reports | (2021) 11:62 | https://doi.org/10.1038/s41598-020-79660-w 11
Vol.:(0123456789)www.nature.com/scientificreports/
0 0 0 ... 0 h l1
(1 − m1 ) 0 0 ... 0 0 l 2
0 (1 − m2 ) 0 ... 0 0 l 3
(1)
Ant = .. .. .. .. .. ..
.
. . . . . . ..
0 0 0 . . . (1 − m7 ) 0 l
7
0 0 0 ... 0 1 Q
The lowermost element of nt is the number of queens (Q) which is here set to Q = 1 for all models, and the
total number of larvae in the colony at any time is Lt = x l x . Given the observed mortality schedule (mx), we
used the model to solve for the value of h that produces a stable value for Lt, as shown in Eq. (2):
Ant = nt (2)
We determined the mortality schedule by observing the survivorship of a larval cohort. For example, if a
cohort of St larvae was originally marked at time t and, of these, St+1 survived until the following week, the per
capita weekly mortality rate would be estimated as shown in Eq. (3):
St+1
mt = 1 − (3)
St
BEEHAVE simulations. To predict the impact of clothianidin on colony development in standard hives
we used BEEHAVE, a honeybee model that simulates colony dynamics and agent-based foraging in realistic
landscapes44(http://beehave-model.net/). Although BEEHAVE does not explicitly allow the incorporation of
pesticides, the effect of pesticides on behavior and mortality can nevertheless be a ddressed59,60. BEEHAVE simu-
lates the development of a single honeybee colony, starting with 10,000 foragers on January 1. Colony dynamics
are based on a daily egg laying rate, with the developmental stages eggs, larvae, pupae, and adults (in drones)
or in-hive workers and foragers (in workers). The brood needs to be tended by in-hive bees, and the larvae
additionally need to be fed with nectar and pollen. Foragers can scout for new food sources or collect nectar
and pollen from sources already known. Successful foragers can recruit nestmates to the food source. Mortality
rates depend on the developmental stage and the time spent on foraging. The colony dies if it either runs out of
honey or if the colony size falls below 4000 bees at the end of the year. Swarming may take place when the brood
nest grows to more than 17,000 bees before July 18. Under default conditions, two food sources are present at
distances of 500 or 1,500 m. Daily foraging conditions are based on weather data from Rothamsted, UK.
We ran two sets of simulations: (A) We first set up BEEHAVE to mimic our experimental nucleus colonies.
We then determined how the protein content of the jelly produced by nurses (ProteinFactorNurses) had to be
modified to replicate the larval mortality we observed in our empirical data. (B) We then set up BEEHAVE under
default conditions but modified ProteinFactorNurses according to the results from the previous simulations to
assess the impact of clothianidin exposure under more realistic conditions.
To mimic the experimental nucleus colonies (simulation A), the maximum honey store (MAX_HONEY_
STORE_kg) was reduced to 0.77 kg and the maximum size of the brood nest (MAX_BROODCELLS) was reduced
to 250. Furthermore, HoneyIdeal was set to ‘true’, so that even though the honey store was small it was filled every
day, reflecting the feeding of the experimental bees. In contrast, PollenIdeal was set to ‘false’, because the experi-
mental colonies still had to forage for pollen. On day 209 (July 28), we set the number of pupae to 100 and the
number of workers to 650, similar to the experimental colony sizes. During the exposure to clothianidin between
days 211 (July 30) and 253 (September 10), the protein content of the jelly fed to the larvae (ProteinFactorNurses)
was modified by the new variable ProteinNursesModifier_Exposed. We tested for ProteinNursesModifier_Exposed
values from 0.6 to 1 in steps of 0.01. The main output of the simulation was the survival of the brood, calculated
from the brood cohort sizes aged 19 days divided by the sizes of these cohorts when they were 3 days old. We
calculated the mean brood survival over 30 replicates, using the last 10 cohorts only (i.e. those reaching the age
of 19 days between September 1 and 10). Those parameter values for ProteinNursesModifier_Exposed resulting in
brood survival most similar to the experimental brood survival were then chosen to represent the clothianidin
concentrations of 100, 10 and 1 µg/L.
To assess the impact of clothianidin on standard colonies under more realistic conditions (simulation B), we
ran BEEHAVE under default settings but reduced the protein content of the jelly (ProteinFactorNurses) during
times of exposure. We assumed that colonies would be exposed when rapeseed plants are flowering, defined
in the model as the period between days 95 (April 5) and 130 (May 10). ProteinNursesModifier_Exposed values
representing the tested concentrations of clothianidin were derived from the previous set of simulations, and
for the control we set ProteinNursesModifier_Exposed to 1 (i.e. no effect of clothianidin). Swarming was either
prevented or allowed, in which case the simulation followed the colony remaining in the hive.
Statistical methods. Statistical analysis was carried out using R v3.4.269, including the add-on packages
lme470 for linear mixed-effects models, pbkrtest71 for testing fixed effects in mixed-effects models, parallel69 to
increase computational power, RLRsim72 for testing random effects in mixed-effects model, multcomp73 for mul-
tiple comparisons, and lattice74 for various graphical displays. We used linear mixed-effects models for one- and
two-factorial analysis of variance (ANOVA) or regressions as indicated and where necessary. In those models,
the colonies were modeled as random effects to reflect the (longitudinal) grouping structure in the data. For the
analysis of larval survival, we used a logarithmic transformation of the proportion of surviving larvae. When
testing fixed effects in mixed-effects models, we used the Kenward-Roger method (and double-checked the
Scientific Reports | (2021) 11:62 | https://doi.org/10.1038/s41598-020-79660-w 12
Vol:.(1234567890)You can also read