LOCAL AREA PROFILE April 2020 - Updated Quarterly last updated June 2020 - Norwich City Council
←
→
Page content transcription
If your browser does not render page correctly, please read the page content below
LOCAL AREA PROFILE
                   April 2020

Updated Quarterly last updated June 2020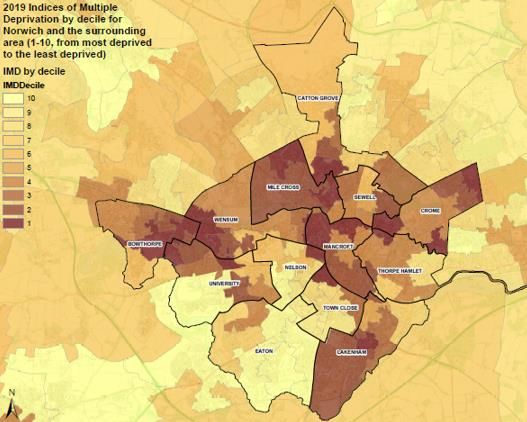
Back to contents page

                                           Contents
                                                                                  Page
Section
                                                                                 Number
   1      Introduction                                                             2
   2      Gambling participation and problem gambling                              3
   3      Risk Factors
            a) Problem gamblers who are seeking treatment                          5
            b) Substance and or alcohol abuse or misuse                            6
            c) Youth                                                               8
            d) Poor mental health                                                  10
            e) Financial difficulties and debt                                     14
             f) Education, skills and training attainment                          20
            g) Unemployment                                                        21
            h) Homelessness                                                        23
             i) Ethnic groups                                                      24
             j) Crime and disorder                                                 26
            k) Immigrant population                                                27
             l) Late Night Activity Zone                                           28
   4      Summary                                                                  29
   5      Appendices
           Appendix 1 Local area profile mapping tool                             30
           Appendix 2 Map of Norwich City Council electoral wards                 32
           Appendix 3 Profile summary table                                       33
           Appendix 4 List of educational establishments                          34
           Appendix 5 Businesses and organisations that indicate an area where    35
           there is financial hardship
           Appendix 6 Homelessness services                                       35
           Appendix 7 Organisations that provide financial support                36
           Appendix 8 Sexual Entertainment Venue Licences                         37
           Appendix 9 Sex Shop Licences                                           37
           Appendix 10 Gambling Licences                                          37
           Appendix 11 Premises Licences                                          38
           Appendix 12 Norwich CCG GP Practices                                   55
           Appendix 13 List of source links                                       56

                                           Page 1 of 61
Back to contents page

1.       Introduction

“Licensing statements, backed up by local area profiles, provide an opportunity for
authorities to set out how gambling will be regulated in their areas, and their expectations of
operators. They can be used to identify areas where the risk of harm from gambling may be
greater due to the particular characteristics of an area and how these risks can be
mitigated”.1

Whilst there is no mandatory requirement to have a local area profile,2 there are a number
of benefits:

     •    it enables Norwich City Council as a licensing authority to better serve their local
          community, by reflecting the community and the risks within it
     •    the local area profile will help to inform operators of specific risks that will need to
          address in their risk assessment which will form a part of any new licence
          application, or an application to vary a licence
     •    it gives operators clarity as to the relevant factors and risks Norwich City Council
          takes into account when decision making
     •    it will lead to improved licence applications, with the operator already incorporating
          controls and measures to mitigate risk in their application
     •    it enables Norwich City Council to make robust but fair evidence based decisions
     •    it encourages a proactive approach to risk that is likely to result in reduced
          compliance and enforcement action.
There is increasing awareness about harmful gambling and its impact on families and local
communities, as well as the individuals directly harmed by it. The following characteristics
were identified in research sponsored by the Local Government Association (LGA)3 4 as
indicating vulnerability to gambling related harm.

     •    Problem gamblers who are seeking treatment
     •    Substance and or alcohol abuse/misuse
     •    Youth

1
 Local Government Association (2018). Gambling regulation Councillor handbook (England and Wales)
updated guidance 2018 [online]. Available from https://www.local.gov.uk/gambling-regulation-councillor-
handbook-england-and-wales [Accessed 2 June 2020].

2
 Gambling Commission (2020). Guidance to licensing authorities [online]. Available from
http://www.gamblingcommission.gov.uk/for-licensing-authorities/GLA/Guidance-to-licensing-
authorities.aspx [Accessed 2 June 2020].
3
 Geofutures (2015). Exploring area-based vulnerability to gambling-related harm: Who is vulnerable?
[online]. Available from https://www.westminster.gov.uk/gambling-research [Accessed 2 June 2020].
4
 Geofutures (2016). Exploring area-based vulnerability to gambling-related harm: Developing the gambling-
related harm risk index [online]. Available from https://www.westminster.gov.uk/gambling-research
[Accessed 2 June 2020].

                                             Page 2 of 61
Back to contents page
• Poor mental health
• Financial difficulties/debt
• Low IQ
• Unemployment
• Ethnic groups
• Homelessness.
• Immigrant population
This local area profile will use these categories to identify different parts of the local area
where there are greater or specific risks of gambling related harm.
This document will reference data from a number of published sources which can assist
local gambling operators prepare their local assessments.
This profile should be read in conjunction with the licensed premises register and gambling
local area profile mapping tool available on the Norwich City Council website see Appendix
1 for a key to the metrics available on the map.
The profile is also intended to assist Norwich City Council and potential applicants when
considering applications for sex establishments across the city. To that end it should be
read in conjunction with the City Councils Policy on Sex Establishments.
2. Gambling participation and problem gambling
The Gambling Commission, commissions a standalone telephone survey conducted by
Populus. The 2019 – 2020 data collection took place in June 2019, September 2019,
December 2019 and March 2020. The survey asked 4,003 respondents aged 16+ about
their gambling participation in the past four weeks. Data for the March 2020 wave was
collected between 5th and 19th March 2020, prior to the Coronavirus Lockdown.
The year to March 20205 found that overall, gambling participation has remained stable
compared to the year to March 2019 with 46.7% of respondents having participated in at
least one form of gambling in the past four weeks. This compares with 46.3% in the year to
March 2019.
Over half of gamblers 52.1% gamble at least once a week in the year to March 2020, up
from 51.7% in 2019.
The National Lottery draws remain the most popular gambling activity, followed by other
lotteries and scratch cards.
Football and horseracing are the most popular betting activities and 21.1% of all
respondents have gambled online in the past four weeks a 1.4% increase on 2019.
5Gambling Commission (2020). Survey data on gambling participation - April 2020 [online]. Available from
https://www.gamblingcommission.gov.uk/news-action-and-statistics/Statistics-and-research/Levels-of-
participation-and-problem-gambling/Research-library.aspx [Accessed 3 June 2020].
Page 3 of 61Back to contents page
The Gambling Commission also publishes in February a more detailed annual report6 into
gambling participation. This survey measures behaviour, awareness and attitudes to
gambling. The 2019 survey found excluding those who only bet on the National Lottery the
age group 25-34 had the highest participation level in gambling at 40%.
Figure 1 below taken from the Gambling Commission (2020), Gambling participation in
2019: behaviour, awareness and attitudes Annual report6 shows the gambling participation
by participants in the survey over the last five years by gender and age.
Figure 1. Past four weeks gambling participation by gender and age, excluding
National Lottery participation
Data source: Gambling Commission (2020), Gambling participation in 2019: behaviour,
awareness and attitudes Annual report 6
Problem gambling is defined as behaviour related to gambling which causes harm to the
gambler and those around them. This may include family, friends and others who know
them or care for them.
The Gambling participation in 2019 report6 includes data on the prevalence of problem,
moderate-risk and low-risk gambling. This data is taken from the NHS Digital Health Survey
for England 20187, due to its use of the full PGSI (Problem Gambling Severity Index) and
DSM-IV diagnostic screening tools.
6
Gambling Commission (2020). Gambling participation in 2019: behaviour, awareness and attitudes Annual
report [online]. Available from https://www.gamblingcommission.gov.uk/news-action-and-
statistics/Statistics-and-research/Levels-of-participation-and-problem-gambling/Research-library.aspx
[Accessed 3 June 2020].
7
NHS Digital (2019). Health Survey for England 2018 [online]. Available from https://digital.nhs.uk/data-and-
information/publications/statistical/health-survey-for-england/2018 [Accessed 3 June 2020].
Page 4 of 61Back to contents page
The PGSI scores identify in 2018, 0.4% of adults as problem gamblers and 3.6% as low or
moderate risk gamblers. The year to March 2020 survey5 reports 0.6% of adult respondents
as problem gamblers and 4.2% as low or moderate risk gamblers. The 2018 PGSI scores
identify 6.3% of men as problem or at-risk gamblers which is substantially higher than
women at 1.5%. The year to March 2020 survey5 identifies 6.6% of men as problem or at-
risk gamblers and 2.7% of women. These figures show an increase in problem gambling
over past two years.
The proportion of problem or at-risk gamblers decreases with age from between 10.2% in
those aged 16 to 24 to 1.6% of those aged 75+ taken from year to March survey 2020 5.
3. Risk factors
The following characteristics or risk factors were identified in research sponsored by the
Local Government Association (LGA)8 9 as indicating vulnerability to gambling related harm.
Wherever possible data has been extracted at ward level to aid risk assessment.
a) Problem gamblers who are seeking treatment
Locations listed below are places where people with gambling problems will be visiting to
meet for support with problem gambling and hence ‘pull’ this potentially vulnerable group to
this location. These places can also be located on the Norwich City Council licensed
premises register and gambling local area profile mapping tool.
Gamblers Anonymous
Gamblers Anonymous10 has a main meeting at
• Mary Magdalene Church, Silver Road, Norwich NR3 4TF in Sewell electoral ward
These meetings are where compulsive gamblers sit together and help each other through
the difficulties of compulsive gambling. They are not professionally facilitated.
GamCare
GamCare and Breakeven11 their counselling partner are the leading national provider of
free information, advice and support for anyone affected by problem gambling. They offer
8
Geofutures (2015). Exploring area-based vulnerability to gambling-related harm: Who is vulnerable?
[online]. Available from
http://transact.westminster.gov.uk/docstores/publications_store/licensing/final_phase1_exploring_area-
based_vulnerability_and_gambling_related_harm_report_v2.pdf [Accessed 3 June 2020].
9
Geofutures (2016). Exploring area-based vulnerability to gambling-related harm: Developing the gambling-
related harm risk index [online]. Available from https://www.westminster.gov.uk/gambling-research
[Accessed 3 June 2020].
10
Gamblers Anonymous (2020). Find a meeting [online]. Available at
https://www.gamblersanonymous.org.uk/geocoding-search?postcode=nr3+4tr. [Accessed 3 June 2020].
11
Breakeven, (2020), Our Offices [online]. Available from
http://www.breakeven.org.uk/Locations.aspx?VenueID=31 [Accessed 3 June 2020].
Page 5 of 61Back to contents page
free treatment to those who gamble and those adversely affected by the gambling of a
family member or friend (provided by experienced counsellors who are trained specialists
working with problem gambling. Breakeven Norwich are based at
• Charing Cross Centre, 17-19 St John Maddermarket, Norwich NR2 1DN in Mancroft
electoral ward.
b) Substance and or alcohol abuse or misuse
The Gambling Commission in its guidance to Local Authorities12 identifies the following
people as being vulnerable and needing protection
“people who gamble more than they want to, people who gamble beyond their means and
people who may not be able to make informed or balanced decisions about gambling due
to, for example, mental health, a learning disability or substance misuse relating to alcohol
or drugs.”
Locations listed below are places where people with substance abuse or misuse problems
will be visiting to meet for support with problem gambling and hence ‘pull’ this potentially
vulnerable group to this location. These places can also be located on the Norwich City
Council licensed premises register and gambling local area profile mapping tool.
The list includes drug and alcohol treatment and recovery centres, clinics within GP
surgeries, needle exchanges, and accommodation for persons who require treatment for
substance misuse.
The major data source is FRANK13 a key lever in delivering the government drug strategy,
to reduce demand, by preventing people from taking drugs (including alcohol) in the first
place. The following services are listed on the FRANK website for Norwich.
• Vulnerable Adults Service, Under 1 Roof, Westwick Street, Norwich NR2 4SZ in
Mancroft electoral ward.
Vulnerable Adults Service, provides healthcare services for people who find it difficult to
visit mainstream GP services. The service is provided for people who are homeless, or
those at risk of being homeless, sex workers, prisoners and ex-offenders, substance
misusers, travellers and asylum seekers. Showers are available, as is advice on mental
health or substance misuse, needle exchange and referrals to specialist services.
• Hebron House, 12 Stanley Avenue, Thorpe Hamlet, Norwich, NR7 0BE in Thorpe
Hamlet electoral ward.
12
Gambling Commission (2015). Guidance to licensing authorities 5th edition [online]. Available from
http://www.gamblingcommission.gov.uk/for-licensing-authorities/GLA/Guidance-to-licensing-
authorities.aspx [Accessed 3 June 2020].
13
FRANK (2020). Find support near you [online]. Available from https://www.talktofrank.com/get-help/find-
support-near-you [Accessed 3 June 2020].
Page 6 of 61Back to contents page
Hebron House is a safe, nurturing and intensively supportive community environment in
which to rehabilitate from drug and alcohol dependency and the life-dominating problems
that serious substance misuse can cause.
• The Matthew Project - Unity, Unit 8, 83-87 Pottergate, Norwich NR2 1DZ in Mancroft
electoral ward.
The Unity service is a multi-agency team of drug and alcohol workers providing universal,
targeted and specialist interventions for young people under 19 across Norfolk. The team
also provide advice and support to parents and carers, young people whose family
members use substances and professionals working with young people. Services include,
harm reduction, needle exchange and access to residential substance misuse treatment.
• CGL Norfolk-Norwich, Adobe House, 5 Barton Way, Norwich NR1 1DL in Thorpe
Hamlet electoral ward.
CGL, Norfolk Alcohol and Drug Behaviour Change Service is a free and confidential service
for adults (including offenders), families, and carers and affected others.
A further data source is Narcotics Anonymous14 this group use the therapeutic value of
addicts working with each other to achieve recovery; they hold meetings in the following
locations. During the Covid-19 pandemic many of these groups have been suspended or
moved online refer to website for details.
• Various AA groups, St Mark's Church Hall, Hall Rd, NR1 3HL, Lakenham electoral ward
• Men's Shed, 43-51 Pitt Street, Norwich NR3 1DE in Mancroft electoral ward.
• Next Steps - Matthew Project, , 70-80 Oak St, NR3 3AQ, Mancroft electoral ward
• Norwich Primary Purpose, Friends Meeting House, Pottergate, Upper Goat Lane., NR2
1EW, Mancroft electoral ward
• Soul Survivors Group, Baptist Church, Duke Street, Norwich NR3 3AP in Mancroft
electoral ward
• The WEekend Group, Quakers Meeting House, Norwich NR2 1EW in Mancroft
electoral ward.
• Various AA groups, Norwich Central Baptist Church, Duke St, NR3 3AP, Mancroft
electoral ward
• "Women Can Heal" Group, Baptist Church, Silver Road, Norwich NR3 4TE in Sewell
electoral ward
14
Narcotics Anonymous (2020). Meetings search [online]. Available from https://ukna.org/meetings/search
[Accessed 3 June 2020].
Page 7 of 61Back to contents page
• Norfolk Alcohol and Drug Behaviour Change Service15, Adobe House, 5 Barton Way,
Norwich NR1 1DL in Thorpe Hamlet electoral ward
A further data source is Alcoholics Anonymous (AA)16. AA is a non-allied self-supporting
fellowship of men and women who share their experience, strength and hope with each
other that they may solve their common problem and help others to recover from
alcoholism. They hold regular meetings in locations already mentioned above and in
addition the following locations in Norwich.
• Norwich Newcomers , CGL, Adobe House, 5 Barton Way, City Office Park, NR1 1DL,
Thorpe Hamlet electoral ward
• Norwich Back to Basics, St Alban's Hall, Grove Walk, NR1 2QF, Town Close electoral
ward
• Step Meeting Group, Methodist Church, Chapelfield Road, Norwich NR2 1SD in Town
Close electoral ward.
Norfolk Alcohol and Drug Behaviour Change Service offers help with breaking free from
harmful patterns of behaviour. In addition, to support with drug and alcohol-related issues,
they offer free counselling for problem gambling. Help is for both problem gamblers and for
those affected by the gambling of a family member or friend.
• Twelve Monkeys Beginners' Group, Vauxhall Centre, Norwich NR2 2SA in Town Close
electoral ward.
• Various AA groups, Chapelfield Road Methodist Church, Chapelfield Road., NR2 1SD,
Town Close electoral ward
c) Youth
Children are singled out for additional regulatory protection in The Gambling Act 200517 and
the Geofutures18 research identifies the distinctive age range 10-24 of ‘emerging adults’ as
15
Norfolk Alcohol and Drug Behaviour Change Service (2020). Find a service near you [online]. Available from
https://www.changegrowlive.org/service-search-
results?postal_code=nr3%204tr&distance=10&service_type%5B9%5D=9 [Accessed 3 June 2020].
16
Alcoholics Anonymous (2020). AA meetings [online]. Available from https://www.alcoholics-
anonymous.org.uk/AA-Meetings/Find-a-Meeting/Norwich [Accessed 11 June 2020].
17
Legislation.gov.uk. (2020). Gambling Act 2005 [online]. Available from
http://www.legislation.gov.uk/ukpga/2005/19/body [Accessed 11 June 2020].
18
Geofutures (2015). Exploring area-based vulnerability to gambling-related harm: Who is vulnerable?
[online]. Available from
http://transact.westminster.gov.uk/docstores/publications_store/licensing/final_phase1_exploring_area-
based_vulnerability_and_gambling_related_harm_report_v2.pdf [Accessed 11 June 2020].
Page 8 of 61Back to contents page
well as younger children in ‘transitional life stages’ as vulnerable. Two metrics have been
used to explore this category of risk, educational institutions and the population density of
10-24 years old.
Educational institutions
State educational institutions19 and independent schools20 in Norwich can be located on the
Norwich City Council licensed premises register and gambling local area profile mapping
tool. They are also itemised in Appendix 3 sorted alphabetically by electoral ward. A map of
Norwich electoral wards is available in Appendix 1.
Population Demographic
Norwich has a youthful demographic in comparison to Norfolk and the rest of the country,
with 24 per cent of residents in the 10 to 24 age group, as opposed to 17 per cent in Norfolk
and 18 per cent in England.
Population density of 10 - 24 year olds is taken from Norfolk County Council, Norfolk
Insights webpage21 data is based on Office of National Statistics (ONS) 2019 Mid-Year
estimates.
Figure 2. Population estimates for all persons by 5 year age group for 2019 released
May 2020
Data source: ONS 201921
19
Norfolk County Council (2020). Norfolk Schools [online]. Available from
https://csapps.norfolk.gov.uk/schoolfinder/default.asp [Accessed 2 June 2020].
20
Independent Schools Council (2020). Find a school [online]. Available from https://www.isc.co.uk/schools/
[Accessed 10 June 2020].
21
Norfolk Insight, (2020). Population [online] Available at:
https://www.norfolkinsight.org.uk/population/report/view/b15822d80ec54439bb12134b7c857bb9/E07000
148 [Accessed 2 June 2020].
Page 9 of 61Back to contents page
This chart shows that the percentage of the age groups 15 -19 and 20 - 24 are higher in
Norwich than in Norfolk and England.
Figure 3 below highlights the particular electoral wards in Norwich where the % of 10 - 24
year olds is greater than the Norwich average and are at the highest risk of gambling
related harm.
Figure 3. Norwich population density (%) for 10 - 24 years
old by ward released in October 2019
Source data: ONS 201821
Norwich 23.9%
Ward
Bowthorpe 29.2%
Catton Grove 17.8%
Crome 17.3%
Eaton 18.1%
Lakenham 17.6%
Mancroft 18.6%
Mile Cross 20.6%
Nelson 30.6%
Sewell 16.1%
Thorpe Hamlet 15.4%
Town Close 20.8%
University 55.3%
Wensum 27.1%
Norfolk 16.3%
England 17.7%
Highlighted figures are wards in Norwich where the % of 10 - 24 year olds is greater than
the Norwich average
d) Poor Mental Health
The NatCen Social Research on Gambling behaviour in Great Britain in 201622 found that
problem gambling was more prevalent among those with the lowest well-being at 2.5%
compared with only 0.5% for others and more prevalent at 2.2% among those with probable
mental ill health compared with 0.2% for those with no evidence of probable mental ill
22
NatCen (2018). Gambling behaviour in Great Britain in 2016 [online]. Available from
https://www.gamblingcommission.gov.uk/PDF/survey-data/Gambling-behaviour-in-Great-Britain-2016.pdf
[Accessed 2 June 2020].
Page 10 of 61Back to contents page
health. This suggests that those with low well-being and probable mental ill health should
be considered vulnerable to problem gambling.
There are several community mental health services in Norwich where service users are
‘pulled’ to.
The location of community NHS mental health services in Norwich
• The Wellbeing Service, Holland Court, The Close , Norwich, Norfolk, NR1 4DY in
Thorpe Hamlet electoral ward
The Wellbeing Service offers help and support to improve wellbeing and manage stress,
low mood and anxiety. Reducing the onset of mental ill health, preventing deterioration and
promoting recovery by offering a range of flexible services
• The City Anchorage, Julian Hospital, Bowthorpe Road, Norwich NR2 3TD in Nelson
electoral ward.
Mental health service for adults over the age of 25. Provides a service for people with a
severe and enduring mental health problem and offer a range of specialist, evidence-based
treatments and interventions in line with NICE guidance.
• Community Services, Central Norfolk, Child Family and Young Person Service, 80
Stephen's Road, Norwich NR1 3RE in Town Close electoral ward.
Youth-friendly (14 – 25 years) working in partnership with third sector agencies. A team of
psychiatrists, psychologists, nurses, social workers, occupational therapists, assistant
practitioners and community support workers.
The NHS Quality and Outcomes Framework (QOF)
The NHS Quality and Outcomes Framework (QOF)23 published in October 2019 has a
number of indicators across a range of key areas of clinical care and public health. The
data used here is for the reporting year 1 April 2018 to 31 March 2019.
Because the metrics are recorded at GP surgery level they are useful proxies to determine
the health of the population at electoral ward level. The two measures used are,
• Percentage of patients aged 18 or over with depression in the preceding year 1 April
2018 to 31 March 2019
• Percentage of patients with a recorded disease within the mental health and
neurology group 1 April 2018 to 31 March 2019
The prevalence is tabled below for each GP Practice and can be located on the Norwich
City Council licensed premises register and gambling local area profile mapping tool.
23
NHS Digital (2020), Quality and Outcomes Framework [online]. Available from https://digital.nhs.uk/data-
and-information/publications/statistical/quality-and-outcomes-framework-achievement-prevalence-and-
exceptions-data/2018-19-pas [Accessed 11 June 2020]
Page 11 of 61Figure 4. Percentage of patients aged 18 or over with depression in the preceding year
1 April 2018 to 31 March 2019 published 24 October 2019
Source data: NHS Quality and Outcomes Framework, Achievement, prevalence and
exceptions24
GP Practices as at 24 October 2019 Ward %
The Surgery
Catton Grove 15.13
29 Woodcock Road, Norwich NR3 3UA
Thorpewood Surgery
Crome 11.15
Woodside Road, Thorpe St Andrew, Norwich NR7 9QL
Castle Partnership, Gurney Surgery
Mancroft 14.01
101-103 Magdalen Street, Norwich NR3 1LN
Norwich Practices Health Centre
Mancroft 7.53
Rouen House, Rouen Road, Norwich NR1 1RB
Oak Street Medical Practice
Mancroft 7.37
Oak Street, Norwich NR3 3DL
Prospect Medical Practice
Mile Cross 10.75
95 Aylsham Road, Norwich NR3 2HW
West Pottergate Health Centre
Nelson 9.45
West Pottergate, Earlham Road, Norwich NR2 4BX
The Health Centre
Sewell 7.11
Lawson Road, Norwich NR3 4LE
The Magdalen Medical Practice
Sewell 10.36
Lawson Road, Norwich NR3 4LF
Yare Valley Medical Practice
Thorpe Hamlet 9.59
202 Thorpe Road, Norwich NR1 1TJ
The Lakenham Surgery
Town Close 12.17
1 Ninham Street, Lakenham, Norwich NR1 3JJ
Newmarket Road Surgery
Town Close 6.73
7 Newmarket Road, Norwich NR2 2HL
St Stephens Gate Medical Practice
Town Close 9.5
55 Wessex Street, Norwich NR2 2TJ
Trinity & Bowthorpe Surgery
Town Close 9.08
1 Trinity Street, Norwich NR2 2BQ
Bacon Road Medical Centre
University 16.04
16 Bacon Road, Norwich NR2 3QX
The Health Centre
University 8.79
University Of East Anglia, Norwich NR4 7TJ
Adelaide Street Health Centre,
Wensum 10.67
19 Adelaide Street, Norwich NR2 4JL
Average of Norwich Clinical Commissioning Group Practices 10.34
Average of England Practices 10.74
Highlighted figures are Practices/Wards that have a % of patients higher than the Norwich GP
Practice average.
24
NHS Digital (2020). Quality and Outcomes Framework, Achievement, prevalence and exceptions data 2018-19 [PAS]
[online]. Available from https://digital.nhs.uk/data-and-information/publications/statistical/quality-and-outcomes-
framework-achievement-prevalence-and-exceptions-data/2018-19-pas [Accessed 11 June 2020].Back to contents page
Figure 5. Percentage of patients with a recorded disease within the mental health and
neurology group 1 April 2018 to 31 March 2019 published 24 October 2019
Source data: NHS Quality and Outcomes Framework25
GP Practices as at 24 October 2019 Ward %
The Surgery
Catton Grove 1.13
29 Woodcock Road, Norwich NR3 3UA
Thorpewood Surgery
Crome 0.98
Woodside Road, Thorpe St Andrew, Norwich NR7 9QL
Castle Partnership, Gurney Surgery
Mancroft 1.29
101-103 Magdalen Street, Norwich NR3 1LN
Norwich Practices Health Centre
Mancroft 1.26
Rouen House, Rouen Road, Norwich NR1 1RB
Oak Street Medical Practice
Mancroft 2.12
Oak Street, Norwich NR3 3DL
Prospect Medical Practice
Mile Cross 1.77
95 Aylsham Road, Norwich NR3 2HW
West Pottergate Health Centre
Nelson 1.34
West Pottergate, Earlham Road, Norwich NR2 4BX
The Health Centre
Sewell 1.88
Lawson Road, Norwich NR3 4LE
The Magdalen Medical Practice
Sewell 1.14
Lawson Road, Norwich NR3 4LF
Yare Valley Medical Practice
Thorpe Hamlet 1.59
202 Thorpe Road, Norwich NR1 1TJ
The Lakenham Surgery
Town Close 1.95
1 Ninham Street, Lakenham, Norwich NR1 3JJ
Newmarket Road Surgery
Town Close 1.1
7 Newmarket Road, Norwich NR2 2HL
St Stephens Gate Medical Practice
Town Close 1.58
55 Wessex Street, Norwich NR2 2TJ
Trinity & Bowthorpe Surgery
Town Close 1.32
1 Trinity Street, Norwich NR2 2BQ
Bacon Road Medical Centre
University 1.63
16 Bacon Road, Norwich NR2 3QX
The Health Centre
University 0.46
University Of East Anglia, Norwich NR4 7TJ
Adelaide Street Health Centre
Wensum 1.17
19 Adelaide Street, Norwich NR2 4JL
Average of Norwich CCG Practices 1.26
Average of England Practices 0.96
Highlighted figures are Practices/Wards that have a % of patients higher than Norwich GP
Practice average.
25
NHS Digital (2020). Quality and Outcomes Framework, Achievement, prevalence and exceptions data 2018-19 [PAS]
[Online]. Available from https://digital.nhs.uk/data-and-information/publications/statistical/quality-and-outcomes-
framework-achievement-prevalence-and-exceptions-data/2018-19-pas [Accessed 11 June 2020].
Page 13 of 61e) Financial difficulties and debt
In the Geofutures (2015) study Exploring area-based vulnerability to gambling-related harm:
Who is vulnerable?26 Found that low income – particularly individuals defined as being in
poverty - may serve as a reasonable proxy for vulnerability. To identify areas of Norwich
where the population is experiencing financial difficulties and debt several data sources
have been used.
Household Income
Norwich City Council use CACI Ltd Paycheck to provide consistent and reliable gross
household income estimates at full postcode level across the UK. Income reflected by
Paycheck is gross household income from all sources including earnings, benefits and
investments.
Figure 6. Household Income
Source data: CACI Paycheck 2018 accessed by Strategy and transformation team NCC
Total Mean Median Mode Lower
Ward Name
Households Income Income Income Quartile
Bowthorpe 4,920 £30,395 £24,491 £12,500 £14,172
Catton Grove 5,043 £31,332 £25,173 £12,500 £14,552
Crome 4,367 £28,167 £22,476 £12,500 £13,061
Eaton 4,113 £48,242 £40,211 £17,500 £23,171
Lakenham 4,499 £28,106 £22,446 £12,500 £12,956
Mancroft 6,368 £26,884 £20,858 £12,500 £11,928
Mile Cross 5,033 £26,431 £21,179 £12,500 £12,400
Nelson 4,314 £44,964 £38,278 £22,500 £22,997
Sewell 5,000 £34,782 £29,357 £17,500 £17,392
Thorpe Hamlet 6,920 £35,057 £28,410 £17,500 £15,930
Town Close 5,896 £37,284 £29,804 £12,500 £16,306
University 3,324 £27,763 £21,464 £12,500 £12,400
Wensum 5,207 £29,976 £24,189 £12,500 £14,071
Norwich 65,004 £32,895 £26,093 £12,500 £14,748
England 23,687,832 £39,884 £32,090 £17,500 £17,868
Key
Mean The average
Median The "middle" value of a data set
Mode The mode is the number that is repeated more often than any other
Lower Quartile The lower quartile value is the median of the lower half of the data
Highlighted figures are Wards that have an income lower than Norwich mean, median and
mode respectively.
26
Geofutures (2015). Exploring area-based vulnerability to gambling-related harm: Who is vulnerable?
[online]. Available from
http://transact.westminster.gov.uk/docstores/publications_store/licensing/final_phase1_exploring_area-
based_vulnerability_and_gambling_related_harm_report_v2.pdf [Accessed 11 June 2020].Back to contents page
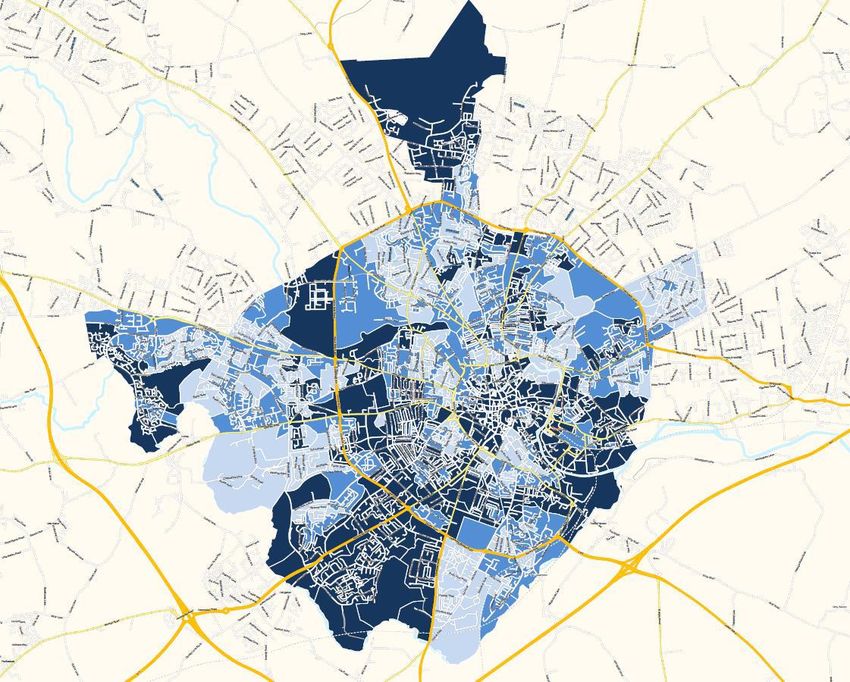
Figure 7 below is a detailed map of low, medium and high income households in Norwich.
Figure 7. Household Income Norwich City Council map
Data source: CACI Paycheck 2018 accessed by Strategy and transformation team NCC
Businesses and organisations that indicate an area where there is financial hardship
The presence of food banks27, pawnbrokers, cheque cashing and loan shops indicates an
area where people are experiencing financial hardship28 https://www.yell.com/. Appendix 5
lists these facilities sorted alphabetically by electoral ward and Figure 8 shows the
prevalence by ward.
27
Data source for foodbanks Network Norwich (2020). Norwich foodbank - Distribution Centres [online].
Available from
https://www.networknorwich.co.uk/Articles/360759/Network_Norwich_and_Norfolk/Partners/Norwich_Fo
odbank/Admin_Articles/Norwich_Foodbank_Distribution_Centres.aspx [Accessed 17 February 2020].
Website pages unavailable 11 June 2020 due to Corona virus pandemic.
28
Yell.com (2020). The UK's leading online business directory [Online]. Available from https://www.yell.com/
[Accessed 15 June 2020].
Page 15 of 61Back to contents page
Figure 8. The prevalence of businesses and organisations that indicate an area where
there is financial hardship
Data source: Foodbanks Network Norwich & Yell.com 27 & 28
Cheque
Electoral ward Food bank Loans Pawnbrokers Total
cashing
Catton Grove 1 2 1 4
Crome 1 1 2
Lakenham 1 1
Mancroft 2 2 5 3 12
Thorpe Hamlet 1 1
University 1 2 3
Wensum 3 3
Total 5 9 8 4 26
The Indices of Deprivation 2019
The Indices of Deprivation are a unique measure of relative deprivation at a small local area
level (Lower-layer Super Output Areas) across England. The Indices of Deprivation 2019
(IoD2019)29 published September 2019 is the most recent release. The Indices provide a
set of relative measures of deprivation for small local area level across England, based on
seven different domains, or facets, of deprivation:
• Income Deprivation
• Employment Deprivation
• Education, Skills and Training Deprivation
• Health Deprivation and Disability
• Crime
• Barriers to Housing and Services
• Living Environment Deprivation
Combining information from the seven domains produces an overall relative measure of
deprivation, the Index of Multiple Deprivation (IMD). In addition to the seven domain-level
indices above, there are two supplementary indices: the Income Deprivation Affecting
Children Index (IDACI) and the Income Deprivation Affecting Older People Index (IDAOPI).
These are created as subsets from the Income Deprivation domain. Figure 9 is a map of
the combined Index of Multiple Deprivation (IMD) for Norwich.
29
GOV.UK (2019). English indices of deprivation 2019 [online]. Available from
https://www.gov.uk/government/statistics/english-indices-of-deprivation-2019 [Accessed 15 June 2020].
Page 16 of 61Back to contents page
Figure 9. Map of the combined Index of Multiple Deprivation (IMD) for Norwich
Data source: GOV.UK English Indices of Multiple Deprivation 201929
For an interactive map looking at all the LSOAs across England, comparing data for 2010,
2015 and 2019, please click on the link below:
https://maps.cdrc.ac.uk/#/geodemographics/imde2019/default/BTTTFFT/14/1.2799/52.6400
/
The deciles are calculated by ranking the 32,844 LSOAs in England from most deprived to
least deprived and dividing them into 10 equal groups. LSOAs in decile 1 fall within the
most deprived 10% of LSOAs nationally and LSOAs in decile 10 fall within the least
deprived 10% of LSOAs nationally.
Figure 10 shows that overall 20.5% of the population of Norwich is in the most deprived
decile nationally, and 5 wards are higher than the average Norwich percentage of 20.5%,
Mancroft, Mile Cross, Wensum, Bowthorpe and Crome indicating high levels of
deprivation.
Page 17 of 61Back to contents page
Figure 10. Percentage of the Norwich population in the most deprived
national Index of Multiple Deprivation (IoMD) decile 2019
Data source: Overall Index of Multiple Deprivation (IoMD)29
Ward Name % of population in most deprived national decile 2019
Bowthorpe 28.6%
Catton Grove 16.7%
Crome 28.6%
Eaton 0.0%
Lakenham 16.7%
Mancroft 50.0%
Mile Cross 42.9%
Nelson 0.0%
Sewell 0.0%
Thorpe Hamlet 14.3%
Town Close 14.3%
University 0.0%
Wensum 42.9%
Norwich 20.5%
England 10.0%
Highlighted figures are Wards that have a higher % than the Norwich figure.
The Gambling participation in 2019 report5 includes data on the prevalence of problem,
moderate-risk and low-risk gambling. This data is taken from the NHS Digital Health Survey
for England 201830 published December 2019, due to its use of the full PGSI (Problem
Gambling Severity Index) and DSM-IV diagnostic screening tools.
Figure 11 below shows that the percentage of problem gamblers rise with deprivation from
0.1% in the lowest IMD quintile to 0.9% in the most deprived IMD quintile.
30
NHS Digital (2019). Health Survey for England 2018 [online]. Available from https://digital.nhs.uk/data-
and-information/publications/statistical/health-survey-for-england/2018 [Accessed 15 June 2020].
Page 18 of 61Back to contents page
Figure 11. Problem gambling prevalence by Index of Multiple Deprivation (IMD)
Data source: Health Survey for England 201830
Classification IMD quintile
according to either Least Most
DSM-IV and PGSI deprived 2nd 3rd 4th deprived
scores % % % % %
Non-problem gambler 99.9 99.7 99.3 99.2 99.1
Problem gambler according to 0.1 0.3 0.7 0.8 0.9
either DSM-IV or PGSI
Children under 16 living in low income families
The children in low income families (CiLIF) statistics31 published 26 March 2020 provides
information on the number and proportion of children living in Relative and Absolute low
income families across Great Britain. To be classed as low income, the family must have
claimed one or more of Universal Credit, Tax credits or Housing Benefit at any point in the
year. Income is calculated before housing costs are taken into account.
At a national level, the proportion of children aged under 16 living in low-income families
varies greatly, ranging from 6% to 38% across Local Authorities. Figure 12 below gives the
figures at Norwich electoral ward level based on Relative low income, which measures low
income in the reference year 2018-19.
31
GOV.UK (2020). Children in low income families: local area statistics 2014/15 to 2018/19 [online]. Available
from https://www.gov.uk/government/statistics/children-in-low-income-families-local-area-statistics-
201415-to-201819 [Accessed 15 June 2020].
Page 19 of 61Figure 12. Children under 16 living in Relative low income
families (before housing costs) 2018/19
Data source: GOV.UK CiLIF figures31.
Ward Name %
Bowthorpe 25%
Catton Grove 25%
Crome 25%
Eaton 13%
Lakenham 32%
Mancroft 34%
Mile Cross 29%
Nelson 10%
Sewell 23%
Thorpe Hamlet 17%
Town Close 16%
University 26%
Wensum 32%
Norwich 24%
Great Britain 18%
Highlighted figures are Wards that have a higher % than the Norwich figure.
f) Education, skills and training attainment
The Education, Skills and Training Domain of the IoD2019 measures the lack of attainment
and skills in the local population. The indicators fall into two sub-domains: one relating to
children and young people and one relating to adult skills. Lack of attainment can be used
as a proxy metric for low IQ. Individuals with low IQ have been identified as being at greater
risk of gambling related harm.32
Figure 13 Highlights those electoral wards Education, Skills and Training Domain
(subset of IoMD) % of population in most deprived national decile 2019
32
Geofutures (2015). Exploring area-based vulnerability to gambling-related harm: Who is vulnerable?
[online]. Available from
http://transact.westminster.gov.uk/docstores/publications_store/licensing/final_phase1_exploring_area-
based_vulnerability_and_gambling_related_harm_report_v2.pdf [Accessed 15 June 2020].Figure 13. Education, Skills and Training Domain subset of the
IoMD
Data source: Overall Index of Multiple Deprivation (IoMD) 201929
Ward Name % of population in most deprived
national decile 2019
Bowthorpe 57.1%
Catton Grove 66.7%
Crome 57.1%
Eaton 0.0%
Lakenham 66.9%
Mancroft 16.7%
Mile Cross 85.7%
Nelson 0.0%
Sewell 16.7%
Thorpe Hamlet 14.3%
Town Close 0.0%
University 20.0%
Wensum 57.1%
Norwich 36.1%
England 10.0%
Highlighted figures are Wards that have a higher % than the Norwich figure.
g) Unemployment
The Health Survey for England 2018 analyses the prevalence of problem gambling by
economic activity using the Problem Gambling Severity Index (PGSI)33. Figure 14 below
shows that unemployed individuals have the highest prevalence of both low, moderate and
problem gambling of all economic groups.
Problem gambling, is gambling to a degree that compromises, disrupts or damages family,
personal or recreational pursuits. The study found that 1.9% of unemployed were problem
gamblers, compared with 0.4% of those in paid employment.
Moderate and low risk gambling, these gamblers are people who fall below the threshold of
problem gambling but may already be experiencing lower levels of harm. The study found
that 1.7% of unemployed were moderate gamblers, compared with 1.1% of those in paid
employment
33
NHS Digital (2019). Health Survey for England 2018 – Supplementary analysis on gambling [online].
Available from https://files.digital.nhs.uk/E8/2B52F0/HSE18-gambling-supp-tab-v3.xlsx [Accessed 15 June
2020].Back to contents page
Figure 14. Problem gambling prevalence aged 16 and over by economic activity
Data source: Health Survey for England 2018, NHS Digital33
Economic activity of individual
PGSI Risk Category In
employment
self- In full-time Other
Unemployed Retired
employment education inactive
government
training
% % % % %
Non problem (PGSI score 0) 95.1 91.2 97.5 98.8 96.9
Low risk gambler (PGSI score 1-2) 3.3 5.3 2.1 0.9 2.5
Moderate risk gambler (PGSI score 3-7) 1.1 1.7 0.4 0.2 0.4
Problem gambler (PGSI score 8+) 0.4 1.9 - 0.1 0.2
All at-risk gamblers (PGSI score 1-7) 4.4 6.9 2.5 1.1 2.9
Figure 15 below taken from the figures on Nomis Official Labour Market Profile34 gives both
the percentage of people economically active and the number of unemployed from the 2011
Census. It also gives the Department of Work and Pensions (DWP) February 2020 claimant
count. This is the number of people claiming benefit principally for the reason of being
unemployed. The number of people receiving Universal Credit for being unemployed is still
being developed by the Department of Work and Pensions so these figures are subject to
review).
34
Nomis (2020). 2011 Ward Labour Market Profile [online]. Available from
https://www.nomisweb.co.uk/reports/lmp/ward2011/1140855177/report.aspx [Accessed 15 June 2020].
Page 22 of 61Figure 15. Nomis Official Labour Market Profiles
Data source: Nomis 2011 Ward Labour Market Profile34
2011 ONS Census DWP Feb 2020
Economically Unemployed Claimant
Ward
Active Count
Bowthorpe 69.2% 9.7% 3.0%
Catton Grove 79.7% 9.9% 3.8%
Crome 73.4% 9.6% 3.9%
Eaton 77.1% 5.2% 1.6%
Lakenham 76.0% 9.9% 4.4%
Mancroft 73.8% 11.8% 6.3%
Mile Cross 76.1% 11.9% 5.7%
Nelson 75.2% 6.2% 1.3%
Sewell 82.6% 6.7% 3.0%
Thorpe Hamlet 81.2% 8.1% 3.9%
Town Close 75.9% 6.8% 2.4%
University 48.4% 18.2% 1.2%
Wensum 71.1% 10.7% 3.6%
Norwich 73.6% 9.4% 3.4%
England and Wales 76.8% 7.6% 3.0%
Highlighted figures are Wards that have a prevalence higher than the Norwich average
h) Homelessness
Rough sleeping35
Norwich City Council recorded 18 rough sleepers in autumn 2019 a decrease from 21 in
autumn 2018.
Pathways36 is a partnership project to ensure rough sleepers and vulnerable people can
access the help they need. Pathways operates from hubs across the city and through
outreach work on the street. See Appendix 5 for details of the hubs and which electoral
wards they are situated in, the Norwich City Council licensed premises register and
gambling local area profile mapping tool identifies the types of services they provide for
example food, advice, washing, shower.
35
Ministry of Housing, Communities & Local Government (2020). Rough sleeping snapshot in England:
autumn 2019 – data tables [online]. Available from
https://assets.publishing.service.gov.uk/government/uploads/system/uploads/attachment_data/file/86775
3/2019_Rough_Sleeping_Snapshot_Tables.xlsx [Accessed 15 June 2020].
36
Pathways (2020). Services [online]. Available from https://www.pathwaysnorwich.org.uk/services
[Accessed 15 June 2020].Back to contents page
Household homelessness37
This is measured quarterly by household and local authority. Ward level statistics are not available.
October - December 2019 figures published May 2020 reveal that 117 households in Norwich were
assessed as being owed a duty to be housed of which 30 were families with children. In England
1.42 households per 1,000 were homeless in Norwich it was 0.80 per 1,000.
i) Ethnic groups
The Health Survey for England 2018 analyses the prevalence of problem gambling by ethnicity
using the Problem Gambling Severity Index (PGSI)38 Figure 16 shows that the Mixed/Other
ethnic group has the highest percentage of low risk gamblers at 5.1%. White/White British
have the highest percentage of moderate risk gamblers at 0.9% and Asian/Asian British
ethnic group have highest percentage of problem gamblers at 0.7 % but the highest
percentage with non-problem gambling at 97.8%. Although noting people from white
backgrounds had a greater frequency of gambling.
Figure 16. Problem gambling prevalence aged 16 and over by ethnic group
Data source: Health Survey for England 2018, NHS Digital38
Ethnic Group
PGSI Risk Category
White/White Asian/Asian Black/Black
Mixed/Other
British British British
% % % %
Non problem (PGSI score 0) 95.9
97.8 97.2 94.3
Low risk gambler (PGSI score 1-2) 2.9 0.7 1.8 5.1
Moderate risk gambler (PGSI score 3-7) 0.9 0.8 0.5 0.4
Problem gambler (PGSI score 8+) 0.3 0.7 0.5 0.3
All at-risk gamblers (PGSI score 1-7) 3.8 1.5 2.3 5.4
The data in Figure 17 below is taken from Nomis39 Census 2011 Ethnic Group data, the table
highlights electoral ward hotspots where the % of population is higher than the Norwich average for
particular ethnic groups .
37
GOV.UK (2020). Live tables on homelessness [online]. Available from
https://www.gov.uk/government/statistical-data-sets/live-tables-on-homelessness#statutory-homelessness-
and-prevention-and-relief-live-tables [Accessed 15 June 2020].
38
NHS Digital (2019). Health Survey for England 2018 – Supplementary analysis on gambling [online].
Available from https://files.digital.nhs.uk/E8/2B52F0/HSE18-gambling-supp-tab-v3.xlsx [Accessed 15 June
2020].
39
Nomis (2020). 2011 Ward Labour Market Profile [online]. Available from
https://www.nomisweb.co.uk/reports/lmp/ward2011/1140855177/report.aspx [Accessed 15 June 2020].
Page 24 of 61Figure 17. Ethnic Group
Data Source Nomis ONS Census 201139
Bowthorpe
Mile Cross
Lakenham
University
Mancroft
Wensum
Norwich
Catton
Thorpe
Hamlet
Nelson
Crome
Sewell
Grove
Eaton
Close
Town
Ward
Population 132,512 11,683 10,596 9,855 8,781 9,326 9,641 10,655 9,297 9,934 10,557 10,404 10,279 11,504
All categories: Ethnic group 100% 100% 100% 100% 100% 100% 100% 100% 100% 100% 100% 100% 100% 100%
White: Total 91% 87% 93% 89% 76% 81% 82% 94% 82% 87% 90% 90% 77% 100%
White: English/Welsh/Scottish/Northern Irish/British 85% 82% 86% 86% 72% 78% 75% 87% 75% 80% 82% 83% 72% 93%
White: Irish 1% 1% 0% 0% 1% 0% 1% 1% 1% 0% 1% 1% 1% 1%
White: Gypsy or Irish Traveller 0% 0% 0% 0% 0% 0% 0% 0% 0% 0% 0% 0% 0% 0%
White: Other White 5% 4% 7% 2% 3% 3% 7% 7% 5% 6% 7% 6% 4% 5%
Mixed/multiple ethnic group: Total 2% 2% 2% 2% 1% 2% 3% 2% 2% 2% 2% 3% 3% 2%
Mixed/multiple ethnic group: White and Black Caribbean 1% 1% 1% 1% 0% 0% 1% 1% 1% 1% 1% 0% 1% 0%
Mixed/multiple ethnic group: White and Black African 0% 0% 0% 0% 0% 0% 1% 1% 0% 0% 1% 1% 1% 0%
Mixed/multiple ethnic group: White and Asian 1% 0% 1% 0% 1% 1% 1% 1% 1% 0% 1% 1% 1% 1%
Mixed/multiple ethnic group: Other Mixed 1% 1% 1% 0% 0% 1% 1% 1% 1% 1% 1% 1% 1% 1%
Asian/Asian British: Total 4% 6% 3% 1% 4% 3% 4% 2% 2% 3% 5% 4% 13% 4%
Asian/Asian British: Indian 1% 2% 1% 0% 2% 1% 1% 0% 1% 0% 2% 2% 2% 1%
Asian/Asian British: Pakistani 0% 0% 0% 0% 0% 0% 0% 0% 0% 0% 0% 0% 1% 0%
Asian/Asian British: Bangladeshi 0% 0% 1% 0% 0% 1% 0% 0% 0% 1% 0% 0% 0% 0%
Asian/Asian British: Chinese 1% 1% 1% 0% 1% 0% 1% 0% 1% 0% 1% 1% 8% 1%
Asian/Asian British: Other Asian 1% 3% 1% 1% 1% 1% 1% 1% 1% 1% 1% 1% 3% 2%
Black/African/Caribbean/Black British: Total 2% 3% 2% 1% 1% 1% 1% 2% 1% 1% 1% 1% 3% 2%
Black/African/Caribbean/Black British: African 1% 2% 2% 1% 1% 1% 1% 1% 0% 1% 1% 1% 2% 1%
Black/African/Caribbean/Black British: Caribbean 0% 0% 0% 0% 0% 0% 0% 0% 0% 0% 0% 0% 0% 0%
Black/African/Caribbean/Black British: Other Black 0% 0% 0% 0% 0% 0% 0% 0% 0% 0% 0% 0% 0% 0%
Other ethnic group: Total 1% 3% 0% 0% 0% 0% 1% 0% 1% 1% 1% 1% 1% 0%
Other ethnic group: Arab 0% 2% 0% 0% 0% 0% 1% 0% 0% 0% 0% 0% 1% 0%
Other ethnic group: Any other ethnic group 0% 0% 0% 0% 0% 0% 0% 0% 0% 0% 0% 0% 1% 0%
Highlighted figures are Wards where the % of a particular ethnic group is higher than the Norwich average.j) Crime and disorder
DATA.POLICE.UK40 data records the following categories.
• Anti-social behaviour • Possession of weapons
• Bicycle theft • Public order
• Burglary • Robbery
• Criminal damage and arson • Shoplifting
• Drugs • Theft from the person
• Other crime • Vehicle crime
• Other theft • Violence and sexual offences
The number of crimes by ward can only therefore be a proxy for gambling related crime.
Figure 18. Number of Crimes
Data sources: Insight Norfolk41 and ONS Mid-2018 population estimates42
Reported crimes Number of reported crimes
Ward Name
May 2019 - April 2020 per 1000 population
Bowthorpe 805 66
Catton Grove 1,236 112
Crome 1,035 105
Eaton 465 53
Lakenham 1,011 108
Mancroft 3,960 364
Mile Cross 1,260 113
Nelson 413 43
Sewell 882 88
Thorpe Hamlet 2,686 219
Town Close 859 76
University 566 45
Wensum 1,243 102
Norwich 16,421 116
Norfolk 55,278 61
Highlighted figures are Wards that have more reported crime per 1,000 population than Norwich.
40
DATA.POLICE.UK (2019). Data Downloads [online]. Available from https://data.police.uk/data/ [Accessed
15 June 2020].
41
Norfolk Insight (2020). Crime and community safety [Online]. Available from
https://www.norfolkinsight.org.uk/crime-and-community-
safety/report/view/03360192254a403ca3279479e7264eba/E05005877
[Accessed 15 June 2020].
42
ONS (2020). Population estimates [online]. Available from
https://www.ons.gov.uk/peoplepopulationandcommunity/populationandmigration/populationestimates
[Accessed 15 June 2020].Back to contents page
Please note Covid-19 lockdown commenced 23 March 2020.
Please note that Mancroft ward includes the city centre and main shopping centres; Thorpe
Hamlet includes the train station, football ground and Prince of Wales
k) Immigrant population
The Geofutures study43, Exploring area-based vulnerability to gambling-related harm:
Developing the gambling-related harm risk index (2016) found there was emerging
evidence that immigrants are vulnerable to problem gambling.
The 2011 Census44 recorded country of birth, which can act as a proxy for immigrant
populations in electoral wards.
Figure 19. Country of Birth
Data source: Norfolk Insights Population estimates
All usual residents UK Ireland EU Other countries
Bowthorpe 85.4% 0.5% 3.7% 10.4%
Catton Grove 88.0% 0.4% 6.2% 5.4%
Crome 94.1% 0.3% 2.4% 3.1%
Eaton 88.8% 0.7% 3.0% 7.5%
Lakenham 90.6% 0.3% 3.4% 5.7%
Mancroft 84.6% 0.6% 5.6% 9.2%
Mile Cross 89.1% 0.4% 5.8% 4.7%
Nelson 87.7% 0.8% 4.8% 6.6%
Sewell 87.9% 0.4% 5.4% 6.2%
Thorpe Hamlet 83.4% 0.6% 6.1% 10.0%
Town Close 86.3% 0.6% 4.9% 8.2%
University 78.9% 0.4% 3.3% 17.4%
Wensum 88.6% 0.5% 4.1% 6.7%
Norwich 87.1% 0.5% 4.5% 7.8%
United Kingdom 86.2% 0.7% 3.7% 9.4%
43
Geofutures (2016). Exploring area-based vulnerability to gambling-related harm: Developing the gambling-
related harm risk index [online]. Available from https://www.westminster.gov.uk/gambling-research
[Accessed 15 June 2020].
44
Norfolk Insights (2020). Population estimates [online]. Available from
https://www.norfolkinsight.org.uk/population/report/view/286efa84892b46e1aba60a1cd3853e3d/E050058
79 [Accessed 15 June 2020].
Page 27 of 61Back to contents page
Highlighted figures are wards that have a higher percentage of 'country of birth' than
Norwich as a whole
l) Late Night Activity Zone
The city council has been working with the police and other organisations to help tackle any
negative effects of the night-time economy on residents, businesses and visitors within the
city centre.
As a result of this joint-working a number of measures have been put in place. They include
the following:
• New access restrictions on residential side roads between 11pm and 6am daily
(Cathedral Street, St Faiths Lane and Recorder Road) to reduce noise to local
residents.
• Signage on residential roads reminding people to respect local residents at night.
• New CCTV cameras on Cathedral Street and Bank Plain/Queen Street.
• Improved policing of the night time economy areas (Prince of Wales Road area).
Along with this, and after consultation on the matter, the city council adopted a Cumulative
Impact Policy (CIP) under the Licensing Act 2003 on 1 August 2015 around the Prince of
Wales Road area.
The policy relates to premises applying for a licence, or a licence variation, to sell alcohol or
late night refreshments between 9pm and 6am.
Since the introduction of the CIP, it has become the responsibility of any business applying
for a new license, or looking to change an existing license within the designated area, to
demonstrate that their business will not contribute to the anti-social behaviour before their
application can be approved.
The City Council will expect similar considerations to be taken by applicants for gambling
licences, permits and sex establishment licences in the defined area if they wish to trade
during the late evening and night time period.
Page 28 of 61Back to contents page
Figure 20. Map showing the Late Night Activity Zone
Data source: Norwich City Council
Prince of Wales Road area
Riverside Area
4. Summary
The Gambling Commission’s introduction of local area risk profiles into practice and
procedure represents a new opportunity for Norwich City Council and industry alike to think
more deeply about the protection of vulnerable people from gambling-related harm. We
would encourage all stakeholders to consider what this means and develop a more
comprehensive understanding of who might be vulnerable and why.
Page 29 of 61Back to contents page
Appendices
Appendix 1
The Norwich City Council licensed premises register and gambling local area profile
mapping tool is available on the Norwich City Council website.
Licensed Premises
The map can be used to locate all of the following licensed premises, by clicking and
scrolling on the map icon the details of the license and where applicable opening hours are
listed.
Below the map is a register of all the Premises licences listing the following details:
Licence Type
Premises and Trading Address
Licensing Designated Premises Supervisor
Issue date
Valid from date
Expiry date
Licence reference number.
Page 30 of 61Back to contents page
Gambling Act 2005 - Local Area Profile metrics.
The Norwich City Council local area profile mapping tool includes metrics indicating the
presence and concentration of groups vulnerable to harm from gambling.
These metrics include
Businesses and organisations that indicate an area where there is
financial hardship
Location of cheque cashing, food bank, loan lenders and pawnbrokers
Pathway Partners
Homeless services provided by Pathways Norwich
Click on the map icon for details of the services offered
Homelessness Support
Ancillary Organisations that provide support for the homeless
Mental Health Proxies
NHS Quality and Outcomes Framework 2018-19
Percentage of patients (18+) registered with the GP surgery with depression
April 2018 to March 2019. Norwich CCG average 10.3 England average 10.7
Percentage of patients registered with the GP surgery with a recorded disease
within the mental health and neurology group April 2018 to March 2019.
Norwich CCG average 1.3 England average 1.0
Schools
School type listed as nursery, infant, junior, primary, secondary, senior, pupil
referral units and special schools
Community centres
Community centres offers a wide range of community, educational and
recreational facilities to the local community
Treatment centres
Gamblers Anonymous and Gamcare meeting locations
Substance abuse/misuse treatment centres
Page 31 of 61Back to contents page
% of population aged 10 - 24 by ward
% of population that identified as from an ethnic minority by ward
% of population that identified as from an ethnic minority by ward
% of population on Universal Credit or Jobseekers allowance by ward
Appendix 2 Map of Norwich City Council electoral wards
Page 32 of 61Appendix 3 Norwich profile by ward, followed by data listed in categories.
Services for people
aged 10-24 by ward
Seekers Allowance
licensed premises
Minorities by ward
Gamblers Anonymous
treatment centres
and Gamcare meeting
Drug and alcohol
% of Population
establishments
Homelessness
% of Universal
Credit & Job
% of Ethnic
in financial
Secondary
WARD
Gambling
premises
difficulty
services
schools
schools
schools
by ward
Primary
Alcohol
locations
Special
Sex
Bowthorpe 3 2 14 20.8 - 30.6 8.9 - 10.5 2.2 - 2.7
Catton Grove 1 1 4 42 4 16.1 - 18.5 4.4 - 7.2 2.7 - 3.9
Crome 1 1 2 17 2 16.1 - 18.5 0.0 - 4.4 2.7 - 3.9
Eaton 3 1 2 0 17 16.1 - 18.5 7.2 - 8.9 1.0 - 1.2
Lakenham 3 2 2 3 33 1 16.1 - 18.5 4.4 - 7.2 2.7 - 3.9
Mancroft 1 3 18 2 212 3 8 1 16 16.1 - 18.5 7.2 - 8.9 3.9 - 6.2
Mile Cross 2 3 20 18.5 - 20.8 4.4 - 7.2 3.9 - 6.2
Nelson 2 1 1 35 20.8 - 30.6 4.4 - 7.2 1.0 - 1.2
Sewell 5 1 1 30 1 15.4 - 16.1 4.4 - 7.2 2.2 - 2.7
Thorpe Hamlet 3 4 2 121 1 5 15.4 - 16.1 7.2 - 8.9 2.7 - 3.9
Town Close 1 1 0 30 18.5 - 20.8 7.2 - 8.9 1.2 - 2.2
10.5 -
University 4 1 1 24 1 30.6 - 55.4 1.0 - 1.2
19.1
Wensum 6 2 20 3 1 20.8 - 30.6 7.2 - 8.9 2.7 - 3.9You can also read