Ethnicity is not public service destiny - The political logic of service distribution in South Africa - UNU-WIDER
←
→
Page content transcription
If your browser does not render page correctly, please read the page content below

WIDER Working Paper 2021/63

Ethnicity is not public service destiny

The political logic of service distribution in South Africa

John Porten,1 Inbok Rhee,2 and Clark Gibson1*

April 2021
Abstract: Millions of South Africans in thousands of demonstrations have protested the unequal
allocation of public services. Despite the African National Congress’s promise to reduce the
disparities generated by apartheid, the level of public services remains highly uneven across the
country. Most studies of service provision in Africa assume that politicians will target their co-
ethnics; other ‘diversity deficit’ literature hypothesizes that a high level of ethnic diversity
undermines service provision from the start. Rather than assuming that ethnicity underlies service
distribution in Africa, we argue that explanations of service provision should first examine how
political institutions incentivize politicians to choose what services to distribute and how to
distribute them. Even in an ethnicized polity, ethnic targeting may not be a politician’s best
strategy. We seek to explain the variation in service levels across South African municipalities and
advance three hypotheses: (1) Municipal councillors in more ethnically diverse municipalities will
form policy coalitions that produce higher service levels. (2) Due to their extensive powers and
the possibility of being residual claimants to municipality resources, South African mayors will
decrease services when they enjoy electoral safety. (3) The strategic interaction between councillors
and their mayor helps to account for the variation in service provision across South Africa’s
municipalities. We test our hypotheses with data from more than 1.37 million households and
aggregated municipality-level measures and find strong support for all three hypotheses. Political
institutions—not ethnic demography—drive policy choices and service outcomes.
Key words: public services, ethnicity, Africa, distributive politics, development policy, South
Africa
JEL classification: D72, H41, O55, Z18
Acknowledgements: The authors would like to acknowledge the leadership and contributions of
Professor Robert H. Bates to the study of the political economy of development. We thank Robert
H. Bates, Alexander Lee, Rachel Gisselquist, and the members of the University of California San
Diego’s Centre for the Study of African Political Economy for their ideas and comments on this
research.

1 University of California, San Diego, USA; 2 KDI School of Public Policy and Management, Seoul, South Korea; * corresponding

author: ccgibson@ucsd.edu
This study is published within the UNU-WIDER project Addressing group-based inequalities.
Copyright © UNU-WIDER 2021
UNU-WIDER employs a fair use policy for reasonable reproduction of UNU-WIDER copyrighted content—such as the
reproduction of a table or a figure, and/or text not exceeding 400 words—with due acknowledgement of the original source,
without requiring explicit permission from the copyright holder.
Information and requests: publications@wider.unu.edu
ISSN 1798-7237 ISBN 978-92-9267-001-6
https://doi.org/10.35188/UNU-WIDER/2021/001-6
Typescript prepared by Joseph Laredo.
United Nations University World Institute for Development Economics Research provides economic analysis and policy advice
with the aim of promoting sustainable and equitable development. The Institute began operations in 1985 in Helsinki, Finland, as
the first research and training centre of the United Nations University. Today it is a unique blend of think tank, research institute,
and UN agency—providing a range of services from policy advice to governments as well as freely available original research.
The Institute is funded through income from an endowment fund with additional contributions to its work programme from
Finland, Sweden, and the United Kingdom as well as earmarked contributions for specific projects from a variety of donors.
Katajanokanlaituri 6 B, 00160 Helsinki, Finland
The views expressed in this paper are those of the author(s), and do not necessarily reflect the views of the Institute or the United
Nations University, nor the programme/project donors.
1 Introduction

Despite the African National Congress’s promise to reduce the inequalities generated by apartheid,
the level of public services remains highly uneven across the country. Millions of South Africans
in thousands of demonstrations have protested the unequal allocation of public services; dozens
have died (Vally 2009). 1 South Africa’s constitution makes elected local municipal governments
responsible for providing many basic public services, including water, sanitation, waste removal,
and electricity (Alexander 2010; Booysen 2007, 2009; Habib 2010; Marais et al. 2008). The
country’s citizens, ‘officially’ comprising four ethnic groups and speaking 11 languages, know this
and often direct their anger and frustration directly at their mayors and municipal councillors
(Atkinson 2007; Siddle 2011). However, given federal requirements that local government provide
these public services, that constituents actively demand them, and that democratic elections reward
incumbents for distributing them, why would municipal councillors choose to under-provide
them?

Two main research agendas in the social sciences seek to explain the relationship between ethnicity
and public service provision in Africa. One, the ‘diversity deficit’ approach, borrows simple models
from collective action theory to argue that increasing the number of ethnic groups involved in
decision-making undermines the likelihood of policy agreement. This leads to either few or low-
quality services delivered (Alesina et al. 1997; Ashraf and Galor 2013: Easterly et al. 2006). Applied
to the South African case, the diversity deficit approach would expect the relationship between
measures of ethnic diversity and service provision to be negative. As detailed below, we find that
municipalities with higher levels of ethnic heterogeneity actually produce 2 more public services. At
 1F

first glance, then, the simple model of inevitable conflict between ethnic groups does not hold in
South Africa.

Another extensive set of studies explores the logic of ethnic favouritism in distributive politics. In
this view, individuals competing for political power create patronage systems by targeting co-
ethnics with services in exchange for their support, especially during elections (Ejdemyr et al. 2018;
Kramon 2013; Wantchekon 2003). Much of this work assumes that in countries where ethnicity is
politically salient, politicians will inevitably distribute services on the basis of an ethnic logic. Such
an approach might predict that increasing the share of mayors’ ethnicity would improve service
provision. We find no such relationship in South Africa.

We believe that these two main approaches undervalue how institutions shape politicians’ choices
regarding public service distribution. Studies hypothesizing a diversity deficit exclude any role for
political institutions: this model assumes that individuals have equal political power and hold
ethnically determined preferences that lead to identical strategies. Studies of ethnic favouritism do
include a role for political institutions—elections (usually at the presidential level)—as the main
driver of ethnic service targeting. However, like the diversity deficit approach, this work often
assumes that politicians have identical preferences and, whenever able, employ ethnic strategies.

1
 Estimates of service delivery protests vary. Alexander et al. (2016) count about 67,000 service delivery protests from
1997 to 2013: the South African police claim that more than 14,000 protests of all types occurred from 2014 to 2015.
Municipal IQ, a specialized local government organization, has recorded between 100 and 200 protests annually.
2
 For this paper, we use the terms ‘distribution’ and ‘provision’ of public services interchangeably. For a detailed
discussion of their differences, see Ostrom (2005).

 1
The strategy of targeting co-ethnics can be efficacious only under certain conditions. Politicians
wishing to target co-ethnics must have some public authority over distributing services and believe
that their constituents will understand and reward them at the ballot box for their provision.
Political institutions lie at the heart of these conditions: institutional rules establish which part of
government has the legislative and executive power over services. They also establish the process
by which the actors empowered to deliver services are elected. These institutions therefore
determine whether ethnicity is translated into decisions about service provision. Failing to account
for how institutions affect politicians’ choices can lead to spurious associations. For example, in
their examination of four services across six African countries, Kramon and Posner (2106) find a
significant relationship between a president’s ethnicity and higher services less than one third of
the time.

Rather than begin with an assumption that ethnicity is always a central part of politicians’ decisions,
we focus on how political institutions affect a politician’s choices about service distribution (e.g.
Bates 1983). In particular, we consider how the specific rules of South African municipal
governance and elections affect the services provided by the municipalities themselves.

Our argument has three parts. First, we examine the general effect of elections on municipal
councillor behaviour. Following Gibson and Hoffman (2013), we present and test a model
demonstrating how elections can motivate more ethnically heterogeneous councils to produce
more services. South Africa’s central government devolves to municipal governments the
responsibility for many services, especially connections to sewerage, waste removal, piped water,
and electricity. Citizens know this. Council rules require a majority of councillors to select a mayor
and to pass policy. Councillors therefore benefit from constructing coalitions, luring new members
by including at least some of their policy preferences in future legislation. Assuming that the ethnic
diversity of a municipality is reflected by its councillors, we hypothesize that the more ethnically
heterogeneous a South African municipality’s population, the more services it will provide.

Second, we examine how institutions create incentives for mayors that are different from those of
their fellow councillors. Elected by the public as a councillor first, they are then chosen by
councillors to be mayor. This position offers a considerable array of powers over executive and
legislative processes, powers that allow mayors to create and pass legislation even if it undermines
the policy preferences of a council majority. These powers permit mayors to target voters with
public services in order to win re-election, but they also allow mayors to direct resources to
themselves and their followers for personal gain. We argue that mayors’ electoral safety helps
predict the level of services they provide. Mayors enjoying strong electoral support will have less
incentive to provide services in the hope of procuring votes (Besley and Burgess 2002; Corstange
2018; Díiaz-Cayeros and Magaloni 2009). Thus, as the electoral security of a mayor increases, the
level of services the municipality provides will decrease.

Finally, building from our previous two steps, we present our central and novel argument that the
variation of service provision across South African municipalities results from the interaction of
mayors’ and councillors’ strategies. While ethnic diversity is associated with increased levels of the
services a legislature produces for its citizens (Hypothesis 1) and a mayor’s electoral security can
have the opposite effect (Hypothesis 2), it is the interaction of these two factors that largely
determines the level of a municipality’s services (Hypothesis 3).

We test our hypotheses on four different public services: connections to sewerage, waste removal,
piped water, and electricity. Citizens can easily tie the actions of their municipal government to the
first three: sewerage, waste removal, and piped water. Physical improvements can be readily seen,
and municipalities have straightforward authority to create distributional policy. Electricity, on the
other hand, is different. While municipalities are given the mandate to distribute it, Eskom—South

 2
Africa’s national utility—disputes municipality authority. As a result, the number of actors
involved in its provision varies across municipalities. In some municipalities, Eskom supplies
electricity directly to households. In others, the municipal government has a hand in its delivery.
In still others, three or more entities coordinate its provision. In contrast to sewerage connections,
waste removal, and piped water, not all councils or their mayors can affect the delivery of
electricity, and citizens cannot directly tie this service to municipal politicians. This difference gives
us the opportunity to evaluate our hypotheses using electricity as a placebo.

We find evidence to support our three hypotheses. Increasing levels of a municipality’s ethnic
heterogeneity has a strong, robust positive effect on levels of sewerage connections and waste
removal. The coefficient for piped water is also in the expected positive direction but not
statistically significant. We also find highly significant negative effects for a mayor’s electoral
safety—measured as margin of victory—on the levels of all three services. Finally, our tests offer
evidence for the central argument in this paper, that the interaction of councillor and mayor
strategies determines service levels. The interaction of a mayor’s electoral safety and a
municipality’s ethnic heterogeneity is negative and significant for sewerage connections and piped
water. Waste removal also has a negative coefficient, as expected, but it does not reach statistical
significance. Offering additional credibility to our arguments, we find no significant relationship
between levels of electricity and ethnic heterogeneity, and the association between a mayor’s
electoral security and electricity is reversed, becoming positive.

We also consider a number of alternative explanations, including the potentially high correlation
between diversity and electoral security and the influence of centre–local government
relationships, defined by either the co-partisanship or co-ethnicity of the mayor and the president,
and find no evidence for either. To explore the possibility that our results might be due to factors
related to time, we also conduct a test analogous to a triple-differences estimation, using diversity,
electoral security, and service levels at the time of the previous election (2011). The results of this
test also support our intuition: we observe greater differences in levels of services in the presence
of greater diversity and lower electoral security.

Our study makes important contributions to the study of the strategic distribution of services.
First, we show that political institutions—in this case, electoral and legislative rules at the municipal
level—generate conditional incentives to form ethnic coalitions for service distribution. Further,
we show that these institutions have dissimilar effects on different kinds of politicians. In some
situations, municipal councillors may follow ethnic strategies while mayors may not. Second, unlike
the vast majority of current research, we find evidence that ethnic heterogeneity does not
undermine service provision. Indeed, we show that high levels of diversity lead to higher levels of
services. Demography alone cannot explain policy outcomes.

Third, we add to the growing literature that seeks to place the choices of politicians at the centre
of explanations of service provision. Fourth, we contribute to the growing number of studies using
subnational panel data to test their theories about the provision of services, avoiding the problems
associated with cross-national research designs (Burgess et al. 2015; Kadt and Lieberman 2017; cf.
Pepinsky 2019). Finally, our study also contributes to the small but growing literature that considers
how the logistical and political demands of each specific government service affect its distribution
(e.g. Kramon and Posner 2016; Lee 2018).

Section 2 reviews two important literatures that seek to explain the provision of public services,
especially in Africa. Section 3 discusses our approach. Section 4 outlines the structure of public
service provision in South Africa. Section 5 discusses the data and our empirical strategy. Section
6 presents our results, Section 7 assesses possible alternative explanations for these results, and
Section 8 concludes.

 3
2 Studies of public service provision

A substantial set of studies hypothesizes that social diversity—usually measured as ethnic
heterogeneity—leads to a wide variety of poor policy outcomes, including the under-provision of
public goods (Easterly and Levine 1997), economic growth (Alesina et al. 1997; Ashraf and Galor
2013; Easterly et al. 2006; Eris 2010; Montalvo and Reynal-Querol 2005; Okediji 2011), public
health (Lieberman 2009; Tequame 2012), the prevalence of conflict (Michalopoulos 2012; Miguel
2004), and good governance (Aghion et al. 2005; Alesina and Zhuravskaya 2011; Alesina et al.
1999; Alesina et al. 2001; Alesina et al. 2003; Baldwin and Huber 2010; Desmet et al. 2009; Easterly
et al. 2006; Kaniovski and Mueller 2006; Lieberman and McClendon 2013; Mauro 1995). The
findings of this ‘diversity deficit’ literature are so well accepted that Banerjee et al. (2005) claim
this relationship to be ‘one of the most powerful hypotheses in political economy’.

While this approach forces researchers to contend with the idea that demographic differences can
lead to undesirable policy consequences, a growing set of studies challenges the theoretical and
methodological foundations of the diversity deficit enterprise. Some studies point to the sensitivity
of the approach’s cross-country research designs (Bharathi et al. 2020; Gao 2016; Gerring et al.
2015; Gisselquist et al. 2016; Lee 2018), 3 while others find little or no relationship between diversity
and public goods at the national level, instead detecting a positive relationship within countries
(Bharathi et al. 2020; Gao 2016; Gerring et al. 2015; Gibson and Hoffman 2013; Gisselquist et al.
2016; Lee 2018). One reason for this could be that most governments have decentralized some
public service provision to local governments and in most settings combinations of provincial,
district, and local governments co-finance public services (Bharathi et al. 2020; Lee et al. 2016).
Some recent empirical work doubts the basic assumptions of the diversity deficit: co-ethnics may
not be more pro-social with each other than non-co-ethnics (e.g. Berge et al. 2015) nor possess
significantly different preferences (e.g. Habyarimana et al. 2007).

Perhaps the most important of these challenges is that the diversity deficit hypothesis is built from
a theoretical foundation ill-suited to explanations of electoral politics. The basic model relies on
simple collective action theory, which does not reflect the reality of policy-making. Its proponents
argue that reaching collective agreement is difficult, not only because of free rider problems (Olson
1965), but also on account of the bargaining costs incurred as individuals or groups seek to
overcome the differences between their preferred outcomes (Buchanan and Tullock 1965). As the
number of preferences among participants increases, so does the cost of reaching agreement. If
ethnic groups have diverse preferences (Alesina and La Ferrara 2005; Alesina et al. 1999;
Lieberman and McClendon 2013), the cost of reaching an agreement increases with the number
of ethnicities represented. At some point, those costs will exceed the benefits and the group will
be unable to reach a collective decision.

While collective action theory is well suited to explaining the private provision of public goods, it
is less useful for explaining the public provision of public goods. The distinction between the private
and public provision of goods is critical. Politicians and private citizens operate in contexts with
vastly different resources, institutional constraints, and incentives. Individuals in a private setting
seek to act collectively to reach greater levels of social welfare, and co-ethnicity may attenuate the

3
 For instance, in Alesina et al. (2003)—cited by nearly every study hypothesizing the diversity deficit, the authors
note the sensitivity of their findings and report that fractionalization has no significant effect on their suite of
government outputs after controlling for common factors like per capita GDP and latitude. They state: ‘The bottom
line is that the evaluation of the effect of ethnic fragmentation on quality of government depends on whether one
believes that latitude belongs in the regression or not.’

 4
free rider problem. Most political scientists assume that politicians, on the other hand, provide
public goods to persuade enough voters to put them in office. They respond to the incentives
generated by political institutions, especially electoral systems. They confront constituencies
defined along multiple social and economic axes. They can access a myriad of government
institutions that private citizens cannot—including taxation, administrative machinery, and even
coercion—many of which were explicitly designed to overcome collective action problems.

Scholars often conflate these contexts: nearly all cross-national studies of diversity and policy
outcomes published since 2005 cite Habyarimana et al. (2007) and Miguel and Gugerty (2005) as
theoretical foundations for their own work. But Habyarimana et al. (2007)’s work featured 300
Ugandans playing economic games, and Miguel and Gugerty’s (2005) research focuses on voluntary
contributions to schools. Governments are not related to either case, and yet the diversity deficit
literature continues to link them to explanations of national-level outcomes. By excluding the
pivotal roles of political institutions, the diversity deficit approach lets ethnic demography
determine a country’s provision of public goods. 4 It also leads such work away from exploring the
strategies of the individuals actually responsible for service distribution—politicians.

The other extensive set of studies exploring the role of ethnicity and service distribution focuses
on the creation of ethnically based patronage systems built by individuals competing for political
power (Bates 1983; Ejdemyr et al. 2018; Joseph 1987; Kramon 2013; Wantchekon 2003). Since
most Sub-Saharan countries have weakly institutionalized party systems, targeting co-ethnics with
services can be an efficient way to mobilize followers (Bates 1983; Burgess et al. 2015; Kramon
2013). This work generally assumes that in countries where ethnicity is politically salient, politicians
will inevitably distribute services on the basis of an ethnic logic. The logic of ethnic distribution
builds from Dixit and Londregan (1996: 1134)’s argument that politicians have a better
understanding of some voters than others and that this understanding can translate ‘into greater
efficiency in the allocation of particularistic benefits’. This relative efficiency creates a ‘core’
constituency (Cox and McCubbins 1986), to which politicians conveniently appeal when
programmatic differences between parties are small, as is often the case in Africa (Posner 2005).
Some experimental evidence from South Africa attests that ethnic favouritism offers a plausible
model for service distribution there (McClendon 2016).

Many other empirical studies provide evidence for the ethnic targeting of services. The co-ethnics
of African political leaders have better health and educational outcomes (Franck and Rainer 2012),
superior infrastructure (Burgess et al. 2015), and preferential access to foreign aid (Briggs 2014;
Jablonski 2014). Carlson (2015) finds that Ugandan voters disproportionately reward provision of
services by co-ethnic politicians. Wantchekon (2003) finds clientelism easier and more appealing
between co-ethnics. Kramon (2013) finds that vote-buying in Kenya is more effective when
politicians target co-ethnics. Adida et al. (2016) show that voters only reward good legislative
performance by co-ethnic candidates. Other research suggests that voters are not straightforwardly
motivated by service provision at all (de Kadt and Lieberman 2018).

But not all investigations of ethnic patronage find such a pattern. Franck and Rainer (2012) find
strong evidence of ethnic favouritism in only 6 of the 18 African countries they study. Kramon
and Posner (2016) demonstrate variation in ethnic favouritism both across African countries and
between different types of distributive goods within countries. Kasara (2007) finds that presidents
tax co-ethnic cash crop farmers at higher rates than non-co-ethnics. Growing evidence suggests

4
 Alesina et al. (2016) exemplifies the exclusion of political intuitions in explanations of service provision. In this 177-
page review of the research on social diversity and public goods, the words ‘policy’, ‘politics’, ‘politician’, ‘election’,
and ‘legislature’ never occur.

 5
that individual vote choices are not deterministically set by ethnic identity; both identity and
performance matter for individual vote choice (Bratton et al. 2012; Ferree 2006; Long and Gibson
2015; Posner and Simon 2002; Rhee 2020).

The ethnic distribution approach shares many of the diversity deficit’s less realistic assumptions.
Much of the literature assumes that distributing goods along ethnic networks is always a preferred
strategy to winning elections. It assumes that national-level politicians use central government to
provide services and tie these to national-level elections.

Three recent studies resonate with our work here. De Kadt and Lieberman (2017) explore political
accountability by testing the effect of service provision on ANC vote share at the municipal level.
Using a difference-in-differences design, they find that contra the accountability hypothesis,
improvements in service provision can decrease the vote share for African National Congress (ANC)
party incumbents. The authors explain that their results may reflect voters’ perception of a high
level of corruption or changing expectations about service levels. Farole (2020) also investigates
electoral accountability and services in South Africa but focuses on the main opposition party in
South Africa, the Democratic Alliance (DA). Unlike de Kadt and Lieberman, Farole finds that
increased service delivery does help the DA’s electoral support, even in adjacent areas. Finally,
Wegner (2018) argues that, even though the country can be considered a one-party system, the
ANC still seems to be responsive to voters. This study uses several indicators of councillor
performance and finds that the renomination of councillors is correlated with performance in
municipalities with high electoral competition.

While building on this work, our study includes important differences. First, our models focus on
the individual politician, rather than the party. We are interested in exploring the choices politicians
make given the incentives generated by electoral and legislative institutions. While we do explore
the possibility of party influence, here we are making a more general, individual-level argument.
By focusing on the reverse causal mechanism—that is, from electoral incentives to service delivery
and not the other way around—we show who is more likely to engage in service delivery in the
first place. Thus we use a politician’s margin of victory, rather than party vote share, to capture the
idea of electoral security (upon which we elaborate below). Second, focusing on the politicians
leads naturally to examining whether and how institutions can present different sets of incentives
to different types of politician—in our case municipal councillors and mayors—even if they are at
the same level of government (e.g. Dropp and Peskowitz 2012; Mayhew 1974; Shepsle et al. 2009).
Finally, our approach allows a clear way to test the outcomes produced by the interaction of
different politicians’ choices.

3 Our approach

Rather than assume that an ethnic logic undergirds the provision of all benefits, we focus in detail
on how institutions affect politicians’ choices about service distribution (Bates 1983). In particular,
we explore three fundamental institutions—public authority, legislative and executive power, and
elections—and argue that these institutions explain variation in South African municipal service
provision.

We begin with the assumption that politicians want to hold office. They will choose strategies they
believe will achieve this end. Rather than assuming that ethnicity is a necessary part of their
strategy, we suggest that politicians will favour their co-ethnics only when doing so results in
increasing their power. In the context of elections, this means winning. Further, politicians enjoy

 6
different sets of powers when they hold different types of office. These powers give office-holders
different sets of choices to appeal to constituents for re-election.

The strategy of targeting co-ethnics with public services can be efficacious only under certain
conditions. Even if a politician is a member of their constituency’s largest ethnic group, they will
target co-ethnics only when (1) they have the authority and finances to distribute the service, (2)
citizens associate that distribution with the politicians, and (3) citizens vote on the basis of this
linkage (Lizzeri and Persico 2001; Milesi-Ferretti et al. 2002; Persson et al. 2000). Political
institutions lie at the heart of these conditions: governments establish rules about which of their
units possess the public authority to distribute services. They structure elections. They confer
different powers on different kinds of politician. In sum, they determine whether or not ethnicity
is translated into decisions about service provision. Few studies explore these conditions in their
analyses of ethnic distribution, which can lead to spurious associations between ethnicity and
services (Franck and Rainer 2012; Kramon and Posner 2013).

A close look at the institutions of South Africa (upon which we elaborate in the next section) leads
us to three hypotheses. First, we expect that, when comparing the subnational units under electoral
democracies, greater levels of diversity are associated with higher public service provision. Second,
we argue that because mayors have different incentives than their fellow councillors, the
municipality will provide fewer services when mayors are electorally safer. Third, we hypothesize
that the interaction between an ethnically heterogeneous council’s propensity to provide higher
levels of services and a mayor’s desire to under-provide services when electorally safer explains the
variation in service provision across South African municipalities.

To explain how higher levels of ethnic diversity lead to higher service provision, we follow the
theoretical work of Rosenbluth and Baum (2006) and Gibson and Hoffman (2013), which
addresses the effect of legislative coalitions on services.

Following their models, we denote the number of groups in a given municipality with n, and the
number of groups in the winning coalition with k, where k < n. The coalition holds together
because it creates net benefits for its members. Adopting a simple assumption that municipalities
prefer balanced budgets (e.g. Alesina et al. 1999), we set the total expenditure for public services,
e, to be equal to total taxation, t. Thus, expenditure per group, e/n, equals taxation per group, t/n.
The coalition can create net benefits for k, and hold together, since k can tax n, but only needs to
provide benefits to k. Each group pays t/n in taxes and those in the coalition receive e/k benefits,
with e/k > t/n since k < n. Net benefits to members of the coalition equal e/k - t/n. As k increases,
e/k falls as long as t remains constant. In order for net benefits to remain constant as k rises, so
must t, and also e. This model thus leads to the outcome where increasing levels of ethnic
heterogeneity lead to higher levels of service provision.

We extend this model to include the effect of a mayor’s electoral security on service provision.

Recall that the net benefit to a given group is defined as e/k - t/n. By providing benefits to groups,
politicians derive utility in terms of electoral support. However, the marginal benefit of having one
additional group’s support decreases as politicians enjoy greater levels of political resources. In
other words, the utility derived from providing service e is no longer equal to the cost, t. We can
denote with δ the discount rates on the expenditure for public services, such that e equals δt, where
0≤δ≤1. Then, considering the revised net benefits, δt/k - t/n, we see that a decrease in δ would
require a decrease in t and/or k. In other words, if the mayor enjoys greater levels of electoral
security, we can expect there to be, on average, lower levels of public service provision.

 7
This model also implies that the discounting derived from electoral security conditions the impact
of diversity on public service provision. In the revised net benefits, δt/k - t/n, the effect of any
change in k is undercut by change in δ. District-level demographic structures matter less to
politicians making decisions about services when they have greater electoral support. In contrast,
where local politicians face fiercer competition, they must attempt to build coalitions. When
politicians have only limited political support, they need to maintain broader appeal to wider
groups in order to increase their chances of re-election. In other words, while an increase in k will
lead to an increase in e, holding others constant, a simultaneous decrease in δ will prevent the
positive effects of diversity from materializing.

From these models, we derive our three hypotheses:

 H1 – Greater levels of diversity are associated with a legislature’s higher levels of public service provision.
 H2 – Greater electoral security of a mayor is associated with lower levels of public service provision.
 H3 – The positive effect of diversity on public service provision is conditional upon the level of electoral security
 that the local municipality mayor enjoys.

4 Public service provision in South Africa

After the 1995 national elections, the ANC’s government embarked on an ambitious plan to
redraw local government boundaries (RSA 1998, 2004) and to bequeath to municipalities new and
important political and economic rights and responsibilities (RSA 1998, 2004). The result was a
newly empowered set of 284 municipalities containing 3,774 wards.

Citizens chose their municipal councillors through elections using a mixed-member system:
individuals vote for a ward councillor under single-member plurality rules and at-large councillors
under party-list proportional representation rules. All municipalities have a council, and all councils
have a mayor; the mayor acts as the head of the council. About two-thirds of councils have an
executive mayor, elected by the council. In the other third, the council votes for members of an
executive committee who, in turn, elect a mayor as the chairperson of the committee.

Mayors enjoy an extensive set of legislative and executive powers. 5 Most councils have an executive
mayoral system, whereby mayors appoint an inner core of advisors known as the mayoral or
executive committee, which oversees the work of municipal managers. The mayor also appoints
members of committees—known as Section 80 committees—who are responsible for the
oversight of and policy recommendations about specific municipality activities, such as finance
and public safety. Section 80 committees report directly to the mayor. Further, since the
Constitution designates the council as the executive, and the mayor dominates the workings of the
council, mayors have tremendous influence over decisions regarding the allocation of resources,
jobs, and power. For example, mayors not only have the power to appoint the municipality’s
salaried managers but can also create a performance agreement with them (de Visser 2009). In
sum, mayors occupy crucial political positions at the local level in South Africa, reflected in the
fact that between 2011 and 2016 (the period of our study), three leading South African newspapers 6
printed more than seven thousand articles about mayors around the country.

5
 The functions of the executive mayor can be found in section 56 of the Municipal Structures Act.
6 The Cape Times, The Star, and The Sowetan.

 8
The ANC government wants local governments to lead the country’s ‘developmental crusade’ to
rectify the biased public investments made by the apartheid regime. To this end, the country’s
Constitution mandates that municipal councils focus on an extensive range of objectives, including
providing democratic and accountable government for local communities, promoting social and
economic development, encouraging a safe and healthy environment and, most important for this
study, ensuring the provision of services to communities. 7 More specifically, municipalities are
 6F

given the duty to provide sewerage connections, waste removal, and piped water to their
constituents.

In principle, municipal councils are expected to fund their public services using the revenue they
garner from property taxes and fees levied on the service. 8 In reality, this almost never occurs,
especially in poorer regions, and most municipal government budgets depend on the grants they
receive from the national government, especially the unconditional Equitable Shares Grant (1998)
and the conditional Municipal Infrastructure Grant (2006).

Extensive opportunities exist for mayors to enrich themselves, their family, and their supporters.
According to the South African Auditor-General’s report on municipal activities in 2014–15 (RSA
2014–15), few municipalities met the management standards required by law. Among other things,
the report found that for the year 2014–15 only 19 per cent of municipalities received a completely
clean (‘unqualified’) audit report; 80 per cent of contracts reviewed had ‘material findings’ of
problems, with around half of all contracts awarded to councillors, staff, and their close family
members; nearly three-quarters of municipalities had some form of unauthorized expenditure, the
monetary amount doubling over the previous five years.

The Auditor-General’s office also expressed frustration with the lack of action taken by municipal
leaders to investigate or prosecute wrongdoers. Less than half of the municipalities made any
attempt to investigate previously uncovered unauthorized, irregular, fruitless, and wasteful
expenditure. The Auditor-General’s office complained that while municipalities ‘continue to report
to management indicators of possible fraud or improper conduct [it is] to little avail as the cases
continue to increase and in most instances are not investigated’ (RSA 2014–15: 18). It also noted
specifically the ‘unwillingness of the council to scrutinise the mayors’ use of public resources’ (RSA
2014–15: 64).

Below we provide more detail and context for the main public services that South Africa’s central
government expects municipalities to provide—piped water, sewerage connections, and waste
removal—and the provision of electricity.

4.1 Piped water

To promote cost recovery for water provision, the national government required a rising block
tariff system that divided water consumption into levels (blocks) and applied progressively higher
prices for each block. These charges soon became a focal point for residents’ service delivery
protests. The national government created a number of policies seeking to address these
complaints (and reduce protests). In 2001 it established the Free Basic Water Policy, which requires
municipalities to provide 25 litres of potable water per person per day. 9 The 2004 Municipal

7
 The powers and functions of local government are found in Schedules 4B and 5B of the Constitution of South
Africa (Act 106 of 1996) and include the provision of connected sewerage, piped water, and waste removal.
8
 Section 229 of the Constitution, Act 108, 1996.
9The ANC promised free basic amounts of water, electricity, and other services immediately before the 2000 national
elections.

 9
Property Rates Act (RSA 2004) mandates municipalities to take account of poor residents when
charging for water and other public services. 10 These two policies led most municipalities to supply
some level of free water to all (or almost all) of their residents. They also led to water deficits in
many places, which municipalities try to fill by buying additional water using their equitable share
grants.

Citizens’ grievances about water include more than its cost. Residents also complain about the
quality of water, its intermittent supply, corruption in water contracting, poor maintenance and
operation of water systems, and lack of monitoring of private water services. 11 As recently as 2016,
over 700,000 South African households obtained their water from ‘unsafe’ sources (rivers, streams,
springs, or wells (RSA 2017)). South Africans clearly blame municipalities for failing to provide
adequate water. Covering one set of service protests, the New York Times noted that protesters
directed their ire ‘at municipal officials they consider uncaring, incompetent and corrupt’. 12 1F

4.2 Sewerage connection

The ANC adopted a policy of providing free sanitation to schools in 2003, to clinics in 2007, and
countrywide in 2010. But, as with water delivery, sanitation services fell far short of policy targets.
In 2008, the government did not even attempt to conduct the detailed assessments required by
policy of more than half of the country’s 852 municipal treatment plants because their overall
operations were ‘poor to non-functional’. 13 Untreated or insufficiently treated sewerage led to over
6,000 cases of cholera in 2009. The year before the 2011 municipal elections, more than 800,000
households either had no toilet or used ‘bucket toilets’—which are a particularly sensitive subject
in South Africa since the bucket toilet was the only access to sanitation for millions of citizens
during apartheid. 14 13F

4.3 Waste removal

Surveys from 2003 to 2010 show that citizens criticized waste removal more than any other public
service, with complaints increasing over the same period. As with water and sanitation, the
Constitution confers the responsibility of waste removal on municipalities (Act 108, Section
152(1), Republic of South Africa, 1996); National Environmental Management: Waste Act, 2008).
While municipalities were removing waste from about 60 per cent of South African households in
2010, that proportion was virtually unchanged from 2002 (General Household Survey 2010). Half
of households had waste removed less than once a week, and half a million South Africans dumped
their waste anywhere. South African media have relentlessly covered the municipalities’ failure in
this service as well.

4.4 Electricity

The national electricity company, Eskom, and municipalities share responsibility for distributing
electricity to users. Seventy-five per cent of municipalities buy electricity from Eskom and resell it

10
 The Municipal Property Rates Act (Act 6, 2004: Local Government Municipal Property Rates Act) mandates
municipalities to provide relief for the poor by lowering tariffs on property rates, water, electricity, sanitation, and
refuse collection.
11
 Water Services Commission, February 2016.
12
 New York Times, ‘South Africa’s Poor Renew a Tradition of Protest’, Barry Bearak, 9 June 2009.
13
 South Africa Department of Water Affairs, ‘Green Drop Report 2009’.
14
 ‘How Poo Became a Political Issue’, Steven Robbins, 3 July 2013.

 10
to their citizens. In some municipalities, more than one entity can provide electricity, and each
could have a different tariff schedule. Unlike the provision of water, sewerage, and waste removal,
the multi-partner supply of electricity ‘creates confusion among consumers about whom they
should hold accountable for the delivery of electricity services’ (Grant 2015).

The first three services—sanitation, waste removal, and piped water—fit our model well in the
sense that municipalities have distributional power and citizens assess them on their use of it. In
the cases of electricity, however, federal intervention removes some mayoral discretion from
distribution, and the number of entities involved in providing electricity does not make it easy for
a voter to determine who is accountable. This distinction is crucial: if demographics lead
deterministically to collective action problems that frustrate production, we should observe a
negative diversity-to-service relationship in all four services. If, on the other hand, distribution
responds to the specific electoral incentives of mayors, results on the target services should diverge.
Neither diversity nor local electoral security should have a relationship with services provided by
the federal government, as politicians do not construct their coalitions within municipalities. On
the other hand, local electoral security should correlate negatively with provision where services
distribution is completely under local control.

5 Data and empirical strategy

5.1 Data on public service provision

We use the 2016 South African Community Survey from Statistics South Africa (formerly the
Census Bureau) to measure public service provision. The survey offers fine-grained dwelling-unit-
level census data with more than 1.37 million observations. We combine those data with aggregate
municipality-level data provided by Statistics South Africa, and we calculate the percentage of
households that (1) are connected to sewerage; (2) get weekly waste removal; (3) have access to
piped water inside their dwelling; and (4) are connected to electricity by the municipality. Local
municipalities provide and manage the first three public services at their discretion, as discussed
earlier, which provides a unique opportunity to test our theory on how the combination of and
interaction between ethnic fractionalization and measures of a mayor’s electoral security affect
local-level public service provision. The national utility Eskom’s role in electricity provision
provides an opportunity to check the robustness of our results: the interaction between diversity
and electoral security should not affect electricity provision.

5.2 Key independent variables: data on diversity and electoral security

Our main independent variables of interest are diversity and electoral security. To measure
electoral security, we calculate the margin of victory of the winning party at the 2011 municipal
elections using the information reported by the Electoral Council of South Africa. We calculate
the winning margin by pooling the raw number of votes cast at the ward level for individual
councillors, and for proportional representation votes cast at the local municipality level for parties.

Moreover, as Mattes (2014) notes, diversity continues to play a critical role in South Africa.
According to Afrobarometer data collected in 2011, 7.5 per cent of South African respondents
identified themselves as a member of an ethnic group first and 70 per cent identified themselves
as South African first. By 2017, these numbers had changed to 24 per cent identifying with their
ethnic group first and only 32.2 per cent as South African first. To measure this diversity, we rely
on self-reported data on respondents’ linguistic group from South Africa’s 2016 Community

 11
Survey. For our measure of diversity, we follow the existing literature and calculate the
ethnolinguistic fractionalization (ELF) index at the municipality level (e.g. Alesina et al. 2003).

Finally, we created a dataset on individual mayors’ ethnic identification by obtaining the Provincial
and Local Government Directory (published in May 2013). This directory, published regularly by
the South African Department of Cooperative Governance, lists the names, addresses, and contact
information of the key municipality-level officials, including the mayor, municipal manager, head
of communication, and information officer. We parsed out the information on the names and
addresses of each of the municipality mayors using optical character recognition (OCR) and regular
expression (regex) matching procedures. We then provided the names and addresses of these
mayors to eight local South African research assistants and asked them to code each mayor’s ethnic
identity into one of 11 ethnolinguistic group categories based on the group categories used in the
Census and standard surveys such as the Afrobarometer. 15 We used membership in linguistic
 14F

groups to measure the ethnicity of the mayor and constituency diversity. Existing works report
that, in the Sub-Saharan African context and in South Africa particularly, the correlation between
home language and ethnic identity is nearly perfect (e.g. Lieberman and McClendon 2013: 579). 16 15F

However, there are exceptions. For the cases where the ethnicity was not apparent, we asked our
coders to conduct additional research on and off line to provide their best estimate. In total, we
have information about the mayor’s ethnic group in 223 out of 234 municipalities with on average
85.6 per cent agreement among the eight coders.

5.3 Empirical strategy

We estimate the impact of ELF on public service provision, conditional on levels of electoral
security. For this, we employ an interaction model with a multiplicative term between our measures
of diversity and electoral security in the form of

 = + + ( ∗ ) + + (1)

where Y stands for our dependent variables for public service provision (waste, water, and
sewerage). Here, we construct a model where the effects of constitutive term D (our diversity
variable) are moderated by the other constitutive term, X (the level of electoral security), through
the incorporation of the interaction term, while controlling for a host of covariates (Brambor et
al. 2006). Since the decisions to provide and manage the public services considered here occur at
the municipal level, we employ the municipality as our unit of analysis. By conducting the analyses
at this sub-national level, we naturally hold constant features of the national-level institutions. We
focus instead on within-country variations, especially municipality-level characteristics, as the key
determinants of the level of public service provision. Moreover, by focusing on a single slice of
time, we avoid introducing unnecessary time trends and potential noise into our estimation. 17

To mitigate concerns of omitted variable bias, we include a battery of controls, including municipal
population and population density. We also consider a host of variables that capture the local-level

15
 These categories are Asian/Indian, Afrikaans/Afrikaner/Boer/English/European/White, Ndebele, Xhosa, Zulu,
Peti/Spedi/North Sotho, Setswana/Tswana, Sesotho/Sotho/South Sotho, Venda, Swazi/Swati, and Shangaan/
Tsonga.
16
 To mitigate any bias or unnecessary noise introduced by coding decisions, we took a conservative approach and
grouped ‘Afrikaans’, ‘Afrikaner’, ‘Boer’, ‘English’, ‘European’, and ‘White’ into a single category and dropped
‘Coloured’, ‘Sign Language’, and ‘Other’ from the Census coding.
17
 Alesina et al. (1999) is also based on a within-state analysis (of the United States), using a snapshot in time with
similar controls.

 12
income and assets, such as percentage of housing owned, proportion of population with no
schooling, and rates of unemployment. Finally, we include province-level fixed effects to control
for the observed and unobserved heterogeneity across provinces. 18

6 Results

Before proceeding to test our hypotheses on the conditional effects of diversity variables, we first
consider the baseline effects of diversity on service provision. Table 1 shows ELF’s strong and
robust positive effects on sewerage and waste removal service provision. While the coefficients
are also in the positive direction for piped water, they are not statistically significant. As the ELF
variable takes a value between 0 and 1, this result suggests that going from complete ethnic
homogeneity (an index of 0) to complete heterogeneity (an index of 1) is associated with, for
example, an increase of 35.5 percentage points in access to sewerage.
Table 1: Effects of diversity on public service provision

 Dependent variable: access to:
 Sewerage Waste removal Piped water
 (1) (2) (3)
ELF 35.499*** 27.781*** 7.298
 (9.238) (8.551) (6.185)
Population (logged) -2.920 -3.120 1.110
 (2.630) (2.434) (1.761)
Population density -0.453 -0.311 -0.115
 (2.375) (2.198) (1.590)
No schooling (%) -1.220*** -1.722*** -1.019***
 (0.284) (0.263) (0.190)
Unemployment (%) -1.132*** -1.034*** -1.070***
 (0.241) (0.223) (0.161)
Housing owned (%) -0.173 0.041 0.061
 (0.143) (0.133) (0.096)
Gini 144.456** 93.372* 78.454**
 (58.821) (54.446) (39.385)
Constant 41.939 66.319* 10.612
 (39.844) (36.880) (26.678)
Province-fixed effects Yes Yes Yes
Observations 205 205 205
Adjusted R2 0.721 0.739 0.779

Note: *p
condition the positive influence of diversity. Diversity provides opportunities to build cross-ethnic
coalitions that benefit service provision—opportunities that secure mayors do not need.
Therefore, we expect the marginal effect of diversity on service provision to be positive when
electoral security is at its lowest. In addition, the positive effects of diversity decline in magnitude
as levels of electoral security increase, and past a certain level may even become indistinguishable
from zero.

Table 2 and Figure 1 provide support for this argument. Models 1–3 in Table 2 omit the interaction
terms. We find that the coefficients for the vote margin variable are all in the expected direction
(negative) and significant. Substantively this suggests that a 1 percentage point increase in the
winning vote margin is associated with a 0.4 percentage point decrease in access to sewerage.
Models 4–6 test conditional effects and again support our theory. The marginal effect of our
diversity variable, ELF, on public service provision is conditional upon the levels of the margin of
victory variable. Specifically, as Figure 1 demonstrates, the positive effect of ELF is strongest when
margin of victory is lowest, and declines in magnitude as margin of victory increases until
indistinguishable from zero in all three public services.
Table 2: Effects of electoral security on public service provision

 Dependent variable: access to:
 Sewerage Waste Piped Sewerage Waste Piped
 (1) removal water (4) removal water
 (2) (3) (5) (6)
Vote margin -0.402*** -0.406*** -0.324*** -0.257** -0.308*** -0.242***
 (0.075) (0.068) (0.048) (0.107) (0.098) (0.069)
ELF 35.210*** 27.492*** 7.052 63.656*** 46.792*** 23.257**
 (8.630) (7.869) (5.553) (17.320) (15.860) (11.167)
Vote margin * ELF -0.563* -0.382 -0.321*
 (0.298) (0.273) (0.192)
Constant 61.504 86.082** 26.391 53.341 80.543** 21.741
 (37.399) (34.101) (24.063) (37.395) (34.243) (24.110)
Province-fixed effects Yes Yes Yes Yes Yes Yes
Controls Yes Yes Yes Yes Yes Yes
Observations 204 204 204 204 204 204
Adjusted R2 0.757 0.779 0.823 0.761 0.781 0.825

Note: *p
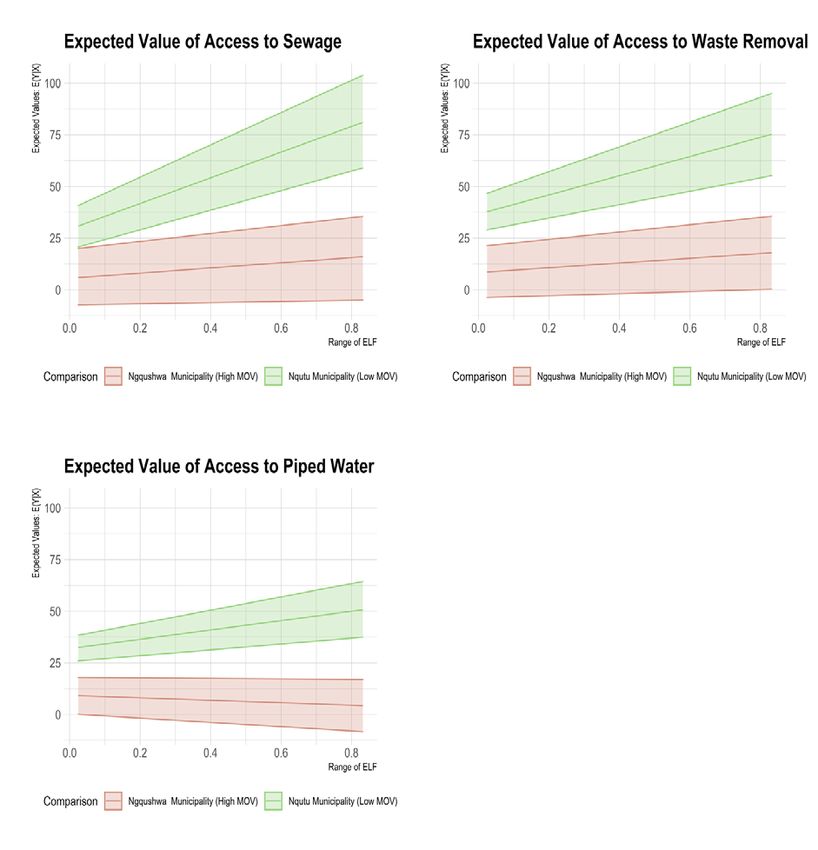
Figure 1: Marginal effects of diversity on public service provision conditional on electoral security

Source: authors’ calculations.

To provide additional substantive interpretations, we consider the simulated results as we move
from a municipality with a low to high margin of victory. In Figure 2, we show the effect of moving
from the municipality with the lowest margin of victory (Nqutu Municipality in Kwa Zulu-Natal
Province) to that with the highest margin of victory (Ngqushwa Municipality in Eastern Cape
Province) across a range of diversity levels, while holding all else constant. The simulated expected
values indicate that the percentage of people with access to sewerage, waste removal, and piped
water increases substantially with diversity. However, we see such effects only for Nqutu, the
municipality with the lowest margin of victory (green), and not for Ngqushwa with the highest
margin of victory (red); in fact the lines’ slopes are close to being flat, if not negative.

 15
You can also read