Impact of mineral dust on shortwave and longwave radiation: evaluation of different vertically resolved parameterizations in 1-D radiative ...
←
→
Page content transcription
If your browser does not render page correctly, please read the page content below
Atmos. Chem. Phys., 19, 523–542, 2019
https://doi.org/10.5194/acp-19-523-2019
© Author(s) 2019. This work is distributed under
the Creative Commons Attribution 4.0 License.

Impact of mineral dust on shortwave and longwave radiation:
evaluation of different vertically resolved parameterizations
in 1-D radiative transfer computations
María José Granados-Muñoz1 , Michael Sicard1,2 , Roberto Román3 , Jose Antonio Benavent-Oltra4,5 ,
Rubén Barragán1,2 , Gerard Brogniez6 , Cyrielle Denjean7,8 , Marc Mallet7 , Paola Formenti8 , Benjamín Torres6,9 , and
Lucas Alados-Arboledas4,5
1 Remote   Sensing Laboratory/CommSensLab, Universitat Politècnica de Catalunya, 08034 Barcelona, Spain
2 Ciències  i Tecnologies de l’Espai – Centre de Recerca de l’Aeronàutica i de l’Espai/Institut d’Estudis Espacials de Catalunya
(CTE-CRAE / IEEC), Universitat Politècnica de Catalunya, 08034 Barcelona, Spain
3 Grupo de Óptica Atmosférica (GOA), Universidad de Valladolid, Valladolid, Spain
4 Department of Applied Physics, University of Granada, 18071 Granada, Spain
5 Andalusian Institute for Earth System Research (IISTA-CEAMA), University of Granada,

Autonomous Government of Andalusia, 18006 Granada, Spain
6 Laboratoire d’Optique Atmosphérique, University of Lille 1, Villeneuve d’Ascq, France
7 CNRM, Centre National de la Recherche Météorologique (UMR3589, CNRS, Météo-France), Toulouse, France
8 LISA, UMR CNRS 7583, Université Paris Est Créteil et Université Paris Diderot,

Institut Pierre-Simon Laplace, Créteil, France
9 GRASP-SAS, Bachy, 59830, France

Correspondence: María José Granados-Muñoz (maria.jose.granados@tsc.upc.edu)

Received: 10 July 2018 – Discussion started: 3 August 2018
Revised: 18 December 2018 – Accepted: 19 December 2018 – Published: 14 January 2019

Abstract. Aerosol radiative properties are investigated in        crophysical aerosol properties measured in situ by the aircraft
southeastern Spain during a dust event on 16–17 June 2013         instrumentation. Once retrieved, the outputs of the RTM in
in the framework of the ChArMEx/ADRIMED (Chemistry-               terms of both shortwave and longwave radiative fluxes are
Aerosol Mediterranean Experiment/Aerosol Direct Radiative         compared against ground and in situ airborne measurements.
Impact on the regional climate in the MEDiterranean region)       In addition, the outputs of the model in terms of the aerosol
campaign. Particle optical and microphysical properties from      direct radiative effect are discussed with respect to the dif-
ground-based sun/sky photometer and lidar measurements,           ferent input parameterizations. Results show that calculated
as well as in situ measurements on board the SAFIRE ATR           atmospheric radiative fluxes differ no more than 7 % from the
42 French research aircraft, are used to create a set of dif-     measured ones. The three parameterization datasets produce
ferent levels of input parameterizations, which feed the 1-D      a cooling effect due to mineral dust both at the surface and
radiative transfer model (RTM) GAME (Global Atmospheric           the top of the atmosphere. Aerosol radiative effects with dif-
ModEl). We consider three datasets: (1) a first parameteriza-     ferences of up to 10 W m−2 in the shortwave spectral range
tion based on the retrievals by an advanced aerosol inversion     (mostly due to differences in the aerosol optical depth) and
code (GRASP; Generalized Retrieval of Aerosol and Sur-            2 W m−2 for the longwave spectral range (mainly due to dif-
face Properties) applied to combined photometer and lidar         ferences in the aerosol optical depth but also to the coarse
data, (2) a parameterization based on the photometer colum-       mode radius used to calculate the radiative properties) are
nar optical properties and vertically resolved lidar retrievals   obtained when comparing the three parameterizations. The
with the two-component Klett–Fernald algorithm, and (3) a         study reveals the complexity of parameterizing 1-D RTMs
parameterization based on vertically resolved optical and mi-     as sizing and characterizing the optical properties of min-

Published by Copernicus Publications on behalf of the European Geosciences Union.
524                           M. J. Granados-Muñoz et al.: Impact of mineral dust on shortwave and longwave radiation

eral dust is challenging. The use of advanced remote sensing        al., 2012; Perrone et al., 2012; Meloni et al., 2015) as well
data and processing, in combination with closure studies on         as the regional climate (Nabat et al., 2015). The ARE in the
the optical and microphysical properties from in situ aircraft      Mediterranean region can be responsible for a strong cooling
measurements when available, is recommended.                        effect both at the surface (or bottom of the atmosphere, BOA)
                                                                    and at the top of the atmosphere (TOA). The so-called forc-
                                                                    ing efficiency (FE), which is defined as the ratio between the
                                                                    ARE and the aerosol optical depth (AOD) for the SW spec-
1   Introduction                                                    tral component ranges between −150 and −160 W m−2 for
                                                                    solar zenith angles (SZAs) in the range 50–60◦ (di Biagio et
The radiative effect by atmospheric aerosol is estimated to         al., 2009), being able to reach values larger than 200 W m−2
produce a net cooling effect of the Earth’s climate. However,       at the BOA during strong dust events in the Mediterranean
an accurate quantification of this cooling is extremely dif-        region (Gómez-Amo et al., 2011). The LW component ac-
ficult. In fact, the aerosol radiative effect (ARE) is affected     counts for an effect of up to 53 % of the SW component and
by large uncertainties. Due to the direct aerosol–radiation         with an opposite sign (di Sarra et al., 2011; Perrone et al.,
interaction, the ARE is estimated to be −0.27 W m−2 on              2012; Meloni et al., 2015).
average at the global scale, with an uncertainty range of              The Aerosol Direct Radiative Impact on the regional
−0.77 to −0.23 W m−2 ; whereas the radiative effect related         climate in the MEDiterranean region (ADRIMED) field
to cloud adjustments due to aerosols is −0.55 W m−2 (−1.33          campaign within the Chemistry-Aerosol Mediterranean Ex-
to −0.06 W m−2 ; Boucher et al., 2013), which is the largest        periment (ChArMEx, http://charmex.lsce.ipsl.fr, last access:
unknown in the radiative forcing of the atmosphere. The ex-         25 January 2018) took place in the Mediterranean region
tent to which the ARE uncertainty range reported is due to          from 11 June to 5 July 2013 (Mallet et al., 2016). It aimed at
physical processes or due to the measurement uncertainty it-        characterizing the different aerosol particles and their radia-
self is still hard to quantify.                                     tive effects using airborne and ground-based measurements
   In previous studies, the AREs in longwave (LW) spectral          collected in the Mediterranean Basin, with special focus on
range were commonly neglected due to the complexity of an           the western region. In particular, two ChArMEx/ADRIMED
accurate quantification of the optical properties in this spec-     flights, F30 and F31 from the French ATR 42 environmental
tral range (Roger et al., 2006; Mallet et al., 2008; Sicard et      research aircraft of SAFIRE (http://www.SAFIRE.fr, last ac-
al., 2012). However, the contribution of the LW component           cess: 25 January 2018), took place above southeastern Spain
to the ARE is nonnegligible for large aerosol particles, i.e.,      during a Saharan dust episode on 16 and 17 June 2013.
marine aerosol or mineral dust (e.g., Markowicz et al., 2003;          In this paper, we present an analysis of the mineral dust ra-
Vogelmann et al., 2003; Otto et al., 2007; Perrone and Berg-        diative properties during this particular episode and take ad-
amo, 2011; Sicard et al., 2014a, b; Meloni et al., 2018).           vantage of the thorough database that is available. Multiple
   The contribution of mineral dust to the ARE in the infrared      datasets are used as input in a radiative transfer model (RTM)
spectral range is especially relevant because of its large size     to evaluate the influence of the different measurements and
and abundance (Meloni et al., 2018). Mineral dust is esti-          data processing in the retrieved direct ARE. The model used
mated to be the most abundant aerosol type in the atmo-             here is the Global Atmospheric ModEl (GAME; Dubuisson
sphere by mass (e.g., Ginoux et al., 2012; Choobari et al.,         et al., 1996, 2005), which allows for calculating both the so-
2014), with global emission between 1000 and 3000 Mt yr−1           lar and thermal infrared fluxes. An evaluation against aircraft
(Zender et al., 2004; Zender, 2003; Shao et al., 2011). The         in situ measurements of radiative fluxes is also presented.
high temporal and spatial variability in dust concentrations           Two main goals are pursued: (i) the quantification of the
and the variability in their microphysical and optical prop-        direct ARE for two case studies within a dust transport
erties present a significant challenge to our understanding of      episode and (ii) the evaluation of the model estimate sensi-
how these particles impact the environment (Dubovik et al.,         tivity to the aerosol input used.
2002). Many measurements worldwide have been made us-                  The paper is structured as follows: Sect. 2 includes a de-
ing different approaches, including satellites, which can pro-      scription of both the ground-based and in situ aircraft instru-
vide global coverage of mineral dust properties. However, the       mentation and a short description of the retrieval algorithms
retrievals of particle properties are still affected by large un-   used for the present study, Sect. 3 is devoted to the descrip-
certainties (Levy et al., 2013) and the information on mineral      tion of GAME and the input datasets used here, and results
dust properties is quite scarce (Formenti et al., 2011).            are presented in Sect. 4; finally, a short summary and con-
   One of the areas frequently influenced by mineral dust           cluding remarks are included in Sect. 5.
is the Mediterranean Sea region, affected by dust intrusions
from the close by Sahara or the Middle East region (Moulin
et al., 1998; Israelevich et al., 2012; Gkikas et al., 2013) pro-
ducing significant perturbations to the shortwave (SW) and
the LW radiation balance (di Sarra et al., 2011; Papadimas et

Atmos. Chem. Phys., 19, 523–542, 2019                                                 www.atmos-chem-phys.net/19/523/2019/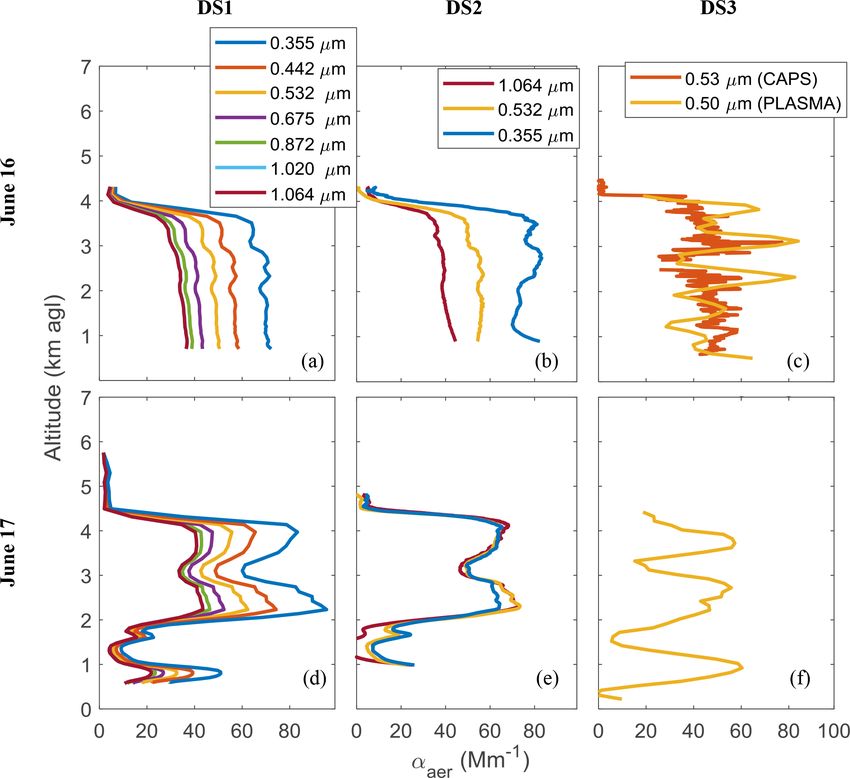
M. J. Granados-Muñoz et al.: Impact of mineral dust on shortwave and longwave radiation                                       525

2     Instruments and data                                        LINET/ACTRIS (European Aerosol Research Lidar Net-
                                                                  work/Aerosols, Clouds, and Trace Gases Research Infras-
2.1    Ground-based measurements                                  tructure Network; https://www.actris.eu/default.aspx, last ac-
                                                                  cess: 15 June 2018; Pappalardo et al., 2014) since April 2005.
Ground-based measurements used in this work were car-             The system has a monostatic biaxial configuration, which
ried out at the Andalusian Institute for Earth System Re-         usually requires an overlap correction to minimize the in-
search (IISTA-CEAMA) of the University of Granada, Spain          complete overlap effect (Navas-Guzmán et al., 2011). The
(lat 37.16, long −3.61; 680 m a.s.l.) by the Atmospheric          system emits vertically to the zenith by means of a pulsed
Physics Group of the University of Granada (GFAT-UGR).            Nd:YAG laser, with second- and third-harmonic generators,
This experiment site is located in the western Mediterranean      that emits simultaneously at 1064, 532, and 355 nm. The re-
basin, near the African continent (∼ 200 km). Therefore,          ceiving system consists of several detectors, which can split
long-range transport of mineral dust particles from north         the radiation according to the three elastic channels at 355,
Africa is a main source of natural atmospheric aerosol in the     532 (parallel- and perpendicular-polarized; Bravo-Aranda et
region (e.g., Lyamani et al., 2005; Valenzuela et al., 2012).     al., 2013), and at 1064 nm; two nitrogen Raman channels at
The station is also affected by long-range transported smoke      387 and 607 nm; and a water vapor Raman channel at 408 nm
(Ortiz-Amezcua et al., 2017) and fresh smoke from nearby          (Navas-Guzmán et al., 2014). The aerosol backscatter coef-
biomass burning (Alados-Arboledas et al., 2011). Anthro-          ficient profiles (βaer (z, λ), z being the vertical height) ob-
pogenic sources such as pollution from Europe, the Iberian        tained from the multiwavelength lidar were calculated with
Peninsula, and the Mediterranean Sea (Pérez-Ramírez et al.,       the Klett–Fernald method (Fernald et al., 1972; Fernald,
2016) also affect the station. Local sources are mainly road      1984; Klett, 1981, 1985). For the retrieval of the aerosol ex-
traffic and central heating systems (Titos et al., 2017).         tinction coefficient profiles (αaer (z, λ)), a height-independent
   IISTA-CEAMA station is equipped with a CE-318-4                lidar ratio (LR) obtained by forcing the vertical integration
(Cimel Electronique) sun/sky photometer, which belongs to         of αaer (z, λ) to the AOD from the AERONET photometer
the AERONET network (Holben et al., 1998). This instru-           (Landulfo et al., 2003) was assumed. The assumption of a
ment performs direct solar irradiance measurements, used          constant LRs introduces uncertainty in αaer (z, λ) retrievals,
to derive AOD, and sky radiance measurements both mea-            especially when different types of aerosol appear at differ-
sured at least at the following nominal wavelengths (λ):          ent layers. In our case, the LR used for the Klett–Fernald
440, 670, 870, and 1020 nm. The AOD product provided by           retrieval are very similar to those provided by GRASP (see
AERONET has uncertainties of ±0.01 for λ > 440 nm and of          Benavent-Oltra et al., 2017). Considering the different uncer-
±0.02 for λ < 440 nm (Holben et al., 1998; Eck et al., 1999).     tainty sources, total uncertainty in the profiles obtained with
AERONET also provides aerosol optical and microphysical           the Klett–Fernald method is usually 20 % for βaer (z, λ) and
properties such as columnar particle size distribution (PSD),     25 %–30 % for αaer (z, λ) profiles (Franke et al., 2001).
real and imaginary parts of the refractive indices (RRI and          Additionally, surface temperature and pressure are con-
IRI, respectively), asymmetry factor (g), and single scatter-     tinuously monitored at IISTA-CEAMA by a meteorological
ing albedo (SSA) using the AOD and sky radiance values in         station located 2 m above the ground. At the same location,
an inversion algorithm (Dubovik and King, 2000; Dubovik et        the global and diffuse downward radiative fluxes for the SW
al., 2006). For the present study, AERONET Version 2 Level        component are continuously measured with a CM11 pyra-
1.5 (Level 2.0 when available) data are used. The uncer-          nometer (Kipp & Zonen) and diffuse downward radiative
tainty in the retrieval of SSA is ±0.03 for high aerosol load     fluxes for the LW component are measured with a precision
(AOD440 > 0.4) and SZAs > 50◦ ; while for measurements            infrared radiometer pyrgeometer (Eppley), both being instru-
with low aerosol load (AOD440 < 0.2), the retrieval accu-         ments regularly calibrated at the site (Antón et al., 2012,
racy of SSA drops down to 0.02–0.07 (Dubovik and King,            2014).
2000). For high aerosol load and SZAs > 50◦ , errors are
about 30 %–50 % for the IRI. For particles in the size range
                                                                  2.2   Airborne measurements
0.1 < r < 7 µm (r being the aerosol radius), errors in PSD
retrievals are around 10 %–35 %, while for sizes lower than
1 µm and higher than 7 µm retrieval errors rise up to 80 %–       The SAFIRE ATR 42 aircraft performed two overpasses
100 %. The inversion code provides additional variables such      above Granada on 16 (flight F30) and 17 June (flight F31)
as the volume concentration; effective radius, reff ; and geo-    in 2013 during the ChArMEx/ADRIMED campaign. Dur-
metric standard deviation of the equivalent lognormal distri-     ing F30, the SAFIRE ATR 42 descended performing a spiral
bution, σ , for fine and coarse modes of the retrieved PSD that   trajectory from 14:15 to 14:45 UTC; whereas during flight
will be used in the current study.                                F31, the aircraft ascended in the early morning (from 07:15
   The multiwavelength aerosol Raman lidar MULHACEN,              to 07:45 UTC) at around 20 km from Granada station (see
based on a customized version of LR331D400 (Raymet-               Fig. 1 from Benavent-Oltra et al., 2017). Additional flight de-
rics S.A.) is operated at Granada station as part of EAR-         tails can be found in previous studies (Denjean et al., 2016;

www.atmos-chem-phys.net/19/523/2019/                                                  Atmos. Chem. Phys., 19, 523–542, 2019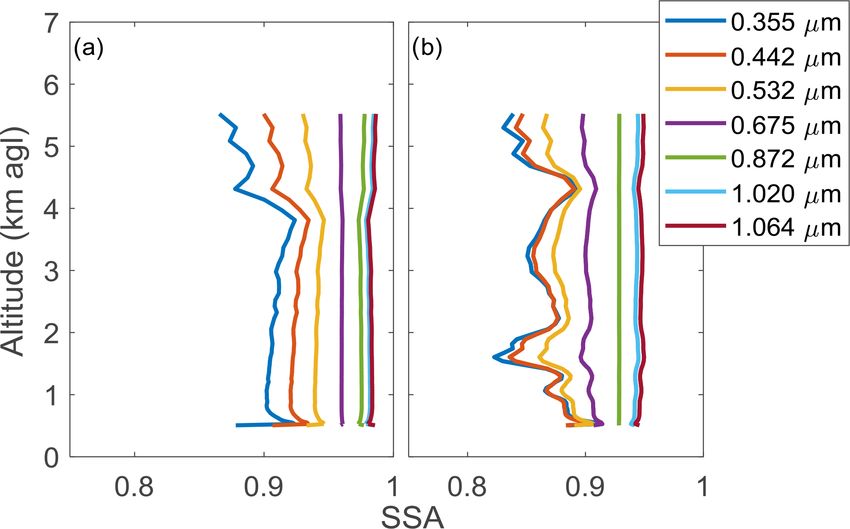
526                            M. J. Granados-Muñoz et al.: Impact of mineral dust on shortwave and longwave radiation

Mallet et al., 2016; Benavent-Oltra et al., 2017; Román et al.,      aerosol optical and microphysical properties in the atmo-
2018).                                                               sphere by combining the information from a variety of re-
   The airborne instrumentation includes a scanning mobility         mote sensors (e.g., Kokhanovsky et al., 2015; Espinosa et
particle sizer (SMPS) and an ultra-high sensitivity aerosol          al., 2017; Torres et al., 2017; Román et al., 2017, 2018; Chen
spectrometer (UHSAS) for measuring aerosol number size               et al., 2018). In our case, GRASP was used to invert simul-
distribution in the submicron range. The forward-scattering          taneously coincident lidar data (range-corrected signal, RCS,
spectrometer probe model 300 (FSSP-300) and the GRIMM                at 355, 532, and 1064 nm) and sun/sky photometer measure-
optical particle counter (sky-OPC 1.129) were used to mea-           ments (AOD and sky radiances both from AERONET at 440,
sure the optical size distributions in the diameter nominal          675, 870, and 1020 nm) providing a detailed characterization
size range between 0.28 and 20 µm and between 0.3 and                of the aerosol properties, both column-integrated and verti-
32 µm, respectively. A nephelometer (TSI Inc, model 3563)            cally resolved. It is worthy to note that this GRASP scheme,
was used to measure the particle scattering coefficient at 450,      based on Lopatin et al. (2013), presents the main advantage
550, and 700 nm, and a cavity attenuated phase shift extinc-         that it allows for retrieving aerosol optical and microphys-
tion monitor (CAPS-PMex, Aerodyne Inc.) was employed to              ical properties for two distinct aerosol modes, namely fine
obtain the aerosol extinction coefficient (αaer ) at 530 nm. For     and coarse. The αaer , βaer , SSA (all at 355, 440, 532, 675,
more details on the aircraft instrumentation see Denjean et          870, 1020, and 1064 nm), and aerosol volume concentra-
al. (2016) and references therein. The PLASMA (Photomètre            tion (VC) profiles obtained as output from GRASP will be
Léger Aéroporté pour la Surveillance des Masses d’Air) sys-          used as input to GAME in the present study, together with
tem, which is an airborne sun-tracking photometer, was ad-           the column-integrated PSD properties (namely reff and σ for
ditionally used to obtain AOD with wide spectral coverage            fine and coarse modes). A more in-depth analysis of GRASP
(15 channels between 0.34 and 2.25 µm) with an accuracy              output data retrieved using the lidar and sun/sky photome-
of approximately 0.01, as well as the vertical profiles of the       ter data at Granada station for the two inversions coinciding
aerosol extinction coefficient (Karol et al., 2013; Torres et al.,   with the aircraft overpasses during flights F30 and F31 during
2017).                                                               ChArMEx/ADRIMED campaign can be found in Benavent-
   Airborne radiative fluxes (F ) were measured with Kipp            Oltra et al. (2017).
& Zonen CMP22 pyranometers and CGR4 pyrgeometers.
Upward and downward SW fluxes (↑ FSW and ↓ FSW ) were
measured in the spectral range 297–3100 nm by two instru-            3     GAME radiative transfer model
ments located above and below the aircraft fuselage. The
                                                                     3.1    GAME description
same setup was used for the pyrgeometers, which provided
the LW upward and downward radiative fluxes (↑ FLW and               The GAME code is widely described by Dubuisson et
↓F
    LW ) for wavelengths larger than 4 µm. Both pyranome-            al. (2004, 2005) and Sicard et al. (2014a). It is a modular
ters and pyrgeometers were calibrated in January 2013 and            RTM that allows for calculating upward and downward ra-
data were corrected for the temperature dependence of the            diative fluxes at different vertical levels from the ground up
radiometer’s sensitivity following Saunders et al. (1992).           to 20 km (100 km) in the SW (LW) spectral range. The solar
   Radiation measurement data from the aircraft were filtered        and thermal infrared fluxes are calculated in two adjustable
out for large pitch and roll angles and corrected from the           spectral ranges, which in this study were fixed to match those
rapid variations in the solar incidence angle around the SZA         of the aircraft radiation measurements (namely 297–3100 nm
due to the aircraft attitude (pitch and roll). This correction       for the SW and 4.5–40 µm for the LW) by using the dis-
also depends on aircraft heading angle and solar position. It        crete ordinates method (Stamnes et al., 1988). Note that the
should be noted that, beforehand, roll and pitch offsets must        GAME code has a variable spectral sampling in the SW (de-
be determined (the axis sensor is not necessarily vertical on        pending on the spectral range considered) and a fixed spectral
average during a horizontal leg). Cosine errors were taken           sampling (115 values) in the LW spectral range (Table 1).
into account. Finally, data were corrected from variations in
the SZA during the flight to ease the comparison with GAME           3.2    GAME input data parameterization
retrievals. After these various corrections, an estimated un-
certainty of ±5 W m−2 is considered to affect the data, taking       The two considered SAFIRE ATR 42 flights, F30 and F31,
into account the accuracy of the calibration and the acquisi-        took place on 16 and 17 June 2013, respectively, coinciding
tion system together with the consistency of airborne mea-           with ground-based lidar and sun/sky photometer measure-
surements (Meloni et al., 2018).                                     ments performed at the station. On these days, mineral dust
                                                                     with origin in the Sahara region (southern Morocco near the
2.3   The GRASP code                                                 border with Algeria) reached Granada after ∼ 4 days of trav-
                                                                     eling, according to back-trajectory analysis (see Supplement
The GRASP (Generalized Retrieval of Aerosol and Sur-                 Fig. S1) and the results presented in Denjean et al. (2016).
face Properties) code (Dubovik et al., 2011, 2014) provides          A homogenous dust layer reaching up to 5 km a.g.l. was ob-

Atmos. Chem. Phys., 19, 523–542, 2019                                                  www.atmos-chem-phys.net/19/523/2019/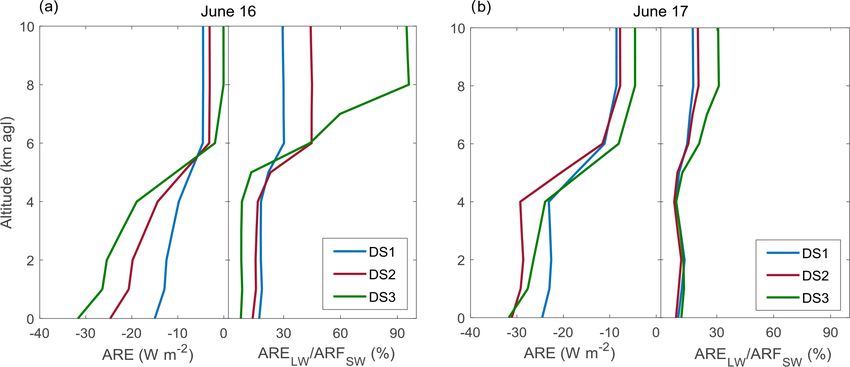
M. J. Granados-Muñoz et al.: Impact of mineral dust on shortwave and longwave radiation                                            527

Table 1. Summary of main GAME properties for the SW and LW spectral ranges. The altitude range corresponding to the different vertical
resolution values is indicated between parentheses.

                                                                  SW                       LW
                      Spectral range (µm)                         0.297–3.100              4.5–40
                      Vertical range (km)                         0–20                     0–100
                      Number of levels                            18                       40
                      Vertical resolution (vertical range) (km)   0.005 (0–0.01)           1 (0–25)
                                                                  0.01 (0.01,0.05)         2.5 (25–50)
                                                                  0.05 (0.05–0.1)          5 (50–60
                                                                  0.1 (0.1–0.2)            20 (80–100)
                                                                  0.2 (0.2–1)
                                                                  1 (1–2)
                                                                  2 (2–10)
                                                                  5 (10–20)

served on 16 June, whereas on 17 June the dust layer was
decoupled from the boundary layer and located between 2
and 4.5 km a.g.l. (Benavent-Oltra et al., 2017). A very similar
vertical structure was observed for the same dust event above
Minorca (Renard et al., 2018). Daily maps of Meteosat Sec-
ond Generation-derived AOD over the Mediterranean from
15 to 18 June during the dust event shown in Fig. 4 of Renard
et al. (2018) show the regional extension of the plume over
the western Mediterranean region. On 16 June, the F30 flight
above Granada site took place between 14:15 and 14:45 UTC
coincident with the lidar measurements. The corresponding
SZA at 14:30 UTC was 31.49◦ . The sun/sky photometer mi-
crophysics data were not available until 16:22 UTC, even                Figure 1. Relative humidity (RH), temperature (T ), and pres-
though the retrieved AOD and its spectral dependence (rep-              sure (P ) profiles measured on board the ATR during flights F30
resented by the Ångström exponent) were very stable be-                 (16 June) and F31 (17 June).
tween the time of the lidar measurements and the time of
the sun/sky photometer inversion. On 17 June, the F31 flight
occurred in the early morning (07:15 to 07:45 UTC, with                 3.2.1   Surface parameters and profiles of
SZA = 61.93◦ at 07:30 UTC), and simultaneous lidar and                          meteorological variables
sun/sky photometer data were available. Unfortunately, the
                                                                        The surface parameters required for GAME are the sur-
airborne vertical profile of extinction by the CAPS measure-
                                                                        face albedo (alb(λ)) and land-surface temperature (LST). The
ments was not available during this second flight. Clouds
                                                                        alb(λ) for the SW range is obtained from the sun/sky pho-
were detected by the lidar on 17 June after 15:00 UTC. Fur-
                                                                        tometer data using the AERONET retrieval at 440, 675, 880,
thermore, a sky camera and the ground-based pyranome-
                                                                        and 1020 nm, and for the LW from the integrated emissiv-
ter and pyrgeometer data indicate cloud contamination (but
                                                                        ity between 4 and 100 µm provided by the Single Scanner
not in the zenith) in the radiation data much earlier (around
                                                                        Footprint (SSF) Level2 products of the CERES (Clouds and
09:00 UTC), also preventing satellite retrievals in the region.
                                                                        the Earth’s Radiant Energy System (http://ceres.larc.nasa.
   A summary of the experimental data used as input for
                                                                        gov/, last access: 10 December 2018) instrument (Table 3).
GAME calculations during these two case studies is pre-
                                                                        LST values are obtained from MODIS (Moderate Resolution
sented in Table 2. This input includes surface parameters and
                                                                        Imaging Spectroradiometer) 1 km daily level-3 data (Wan,
atmospheric profiles of meteorological variables, main gas
                                                                        2014) on 16 June. Unfortunately, on 17 June MODIS data
concentrations, and aerosol properties. The aerosol proper-
                                                                        were not available due to the presence of clouds and the local
ties used in the present study are parameterized using three
                                                                        surface temperature was obtained from temperature measure-
different datasets, based on the different instrumentation and
                                                                        ments at the Granada site, where the meteorological station
retrievals available, i.e., Dataset 1 (DS1), Dataset 2 (DS2)
                                                                        is located at 2 m above the ground. LST and alb(λ) values
and Dataset 3 (DS3). A more detailed description of the dif-
                                                                        used for the two analyzed cases are included in Table 3.
ferent parameters is provided next.

www.atmos-chem-phys.net/19/523/2019/                                                       Atmos. Chem. Phys., 19, 523–542, 2019
528 M. J. Granados-Muñoz et al.: Impact of mineral dust on shortwave and longwave radiation
Table 2. Summary of the data sources used to obtain the input data parameterizations for GAME computations both in the SW and LW
spectral ranges, including the surface parameters (albedo, alb, and land-surface temperature, LST), profiles of meteorological variables, and
main gases and the aerosol parameters. For the aerosol parameters (aerosol extinction, αaer ; single scattering albedo, SSA; and asymmetry
parameter, g) three different datasets are used (DS1, DS2, and DS3) based on different instrumentation and retrievals. The indications below
the sources of the aerosol parameters indicate whether the parameter is column-integrated (col) or if it is vertically resolved (z) and the
number of wavelengths at which it is given (nλ).
SW LW
Surface alb AERONET CERES
LST IISTA-CEAMA MODIS
Met. prof. P , T , RH Aircraft + US std. atm. Aircraft + US std. atm.
Main gases Conc. prof. US std. atm. US std. atm.
Abs. Coeff. HITRAN HITRAN
DS 1 DS 2 DS 3 DS 1 DS 2 DS 3
Aerosol parameters αaer GRASP (z, 7λ) Klett (z, 3λ) Aircraft (z, 1λ) Mie calculation
SSA GRASP (z, 7λ) AERONET (col, 4λ) Aircraft (col, 1λ)
g AERONET (col, 4λ) AERONET (col, 4λ) AERONET (col, 4λ)
Table 3. Surface albedo, alb(λ), values provided by AERONET for the SW spectral range and by CERES for the LW. Land-surface temper-
ature (LST) on 16 June was obtained from MODIS, whereas on 17 June it was estimated from the meteorological station at the Granada site.
These surface parameters are common to all parameterizations.
alb (440 nm) alb (675 nm) alb (870 nm) alb (1020 nm) alb (LW) LST (K)
16 June 0.05 0.15 0.30 0.30 0.016 314.5
17 June 0.05 0.15 0.31 0.31 0.013 298.1
Figure 1 shows the pressure (P ), temperature (T ), and tometer, and the in situ instrumentation on board the aircraft.
relative humidity (RH) profiles obtained from the SAFIRE On the other hand, direct measurements of the aerosol prop-
ATR 42 measurements. Data from the meteorological sta- erties in the LW are not so straightforward and thus scarce.
tion located at IISTA-CEAMA are used to complete these Hence, the aerosol LW radiative properties are calculated by
profiles at the surface level; whereas at altitudes above the a Mie code included as a module in GAME. According to
aircraft flight, a scaled US standard atmosphere is used for Yang et al. (2007), the dust particles nonsphericity effect at
completion. The concentration profiles of the main absorb- the thermal infrared wavelengths is not significant on the LW
ing gases (O3 , CH4 , N2 O, CO, and CO2 ) are also taken from direct ARE, thus the shape of the mineral dust can be as-
the US standard atmosphere, while for the gaseous absorp- sumed as spherical for the Mie code retrievals introducing
tion coefficients the HITRAN database is used (as in Sicard negligible uncertainties.
et al., 2014a, b). Variations in the concentration profiles of the For the SW simulations, we run GAME using three dif-
main absorbing gases have low impact of the radiative fluxes ferent aerosol input datasets, i.e., DS1, DS2, and DS3 (Ta-
and the ARE, thus small uncertainty is introduced by this ble 2), in order to evaluate their influence on the ARE cal-
approach. A sensitivity test performed in the present study, culations. DS1 relies on a parameterization based on the ad-
varying the O3 profiles up to double concentrations, indicates vanced postprocessing GRASP code, which combines lidar
maximum differences of 4 W m−2 in the FSW and 3.6 W m−2 and sun/sky photometer data to retrieve aerosol optical and
in the case of the FLW . For the ARE, differences are negligi- microphysical property profiles; DS2 relies on Klett–Fernald
ble (below 0.2 W m−2 ). lidar inversions and AERONET products and corresponds to
a reference parameterization (easily reproducible at any sta-
3.2.2 Aerosol parameterization tion equipped with a single- or multiwavelength lidar and an
AERONET sun/sky photometer and without the need of an
As for the aerosol parameterization, αaer (λ, z), SSA(λ, z), advanced postprocessing algorithm); and DS3 relies on in
and g(λ, z) are required as GAME input data (Table 2). For situ airborne measurements and corresponds to an alternative
the SW wavelengths, these properties can be obtained from parameterization to DS1 and DS2.
the measurements performed with the instrumentation avail-
able during the campaign; namely the lidar, the sun/sky pho-
Atmos. Chem. Phys., 19, 523–542, 2019 www.atmos-chem-phys.net/19/523/2019/M. J. Granados-Muñoz et al.: Impact of mineral dust on shortwave and longwave radiation 529 Figure 2. Profiles of αaer obtained from GRASP/DS1 (a, d), Klett/DS2 (b, e), and aircraft in situ/DS3 measurements (c, f) on 16 June (a, b, c) and 17 June (d, e, f). Figure 2 shows αaer profiles on 16 June (top row) and 17 ferences in the αaer profiles translate into differences in the (bottom row) obtained using the three different approaches. integrated extinction and, hence, into differences in the AOD For DS1 (Fig. 2a and d), αaer profiles at seven different values used as input in the radiative flux retrievals. The AOD wavelengths obtained with GRASP are used as input data in values presented here (included in Table 4) are obtained by GAME. In DS2 (Fig. 2b and e), the αaer profiles are obtained integrating the αaer profiles at 550 nm from the surface up to from the lidar data using Klett–Fernald retrievals and adjust- the considered top of the aerosol layer (4.3 km on 16 June and ing the lidar ratio to the AERONET retrieved AODs, as men- 4.7 km on 17 June). In GRASP retrieved αaer profiles, values tioned in Sect. 2.1. Finally, for DS3 (Fig. 2c and f) the αaer above this top of the aerosol layer are slightly larger than values are obtained from the aircraft in situ measurements zero since GRASP takes into account stratospheric aerosols (CAPS and PLASMA data on 16 June and PLASMA on by an exponential decay (Lopatin et al., 2013), thus the ap- 17 June). A detailed analysis and discussion on the compar- proach used here to calculate the AOD leads to lower values ison between αaer profiles provided by the aircraft measure- compared to the column-integrated AOD provided by the sun ments, GRASP, and the lidar system at Granada is already photometer. Differences among the three datasets are more included in Benavent-Oltra et al. (2017). In general, the li- noticeable on 16 June, when the AOD for DS1 is 0.05 lower dar, GRASP, and the CAPS data are in accordance, observing than for DS2 and DS3; whereas on 17 June the maximum dif- the same aerosol layers and similar values, with differences ference is 0.03, obtained between DS1 and DS2. The AOD within 20 %. GRASP slightly overestimates CAPS data by values at 550 nm reveal that GRASP input data (DS1) and 3 Mm−1 on average, whereas the differences with PLASMA to a lesser extent the aircraft in situ data (DS3) underesti- are larger, reaching 30 % (or 11 Mm−1 ). In the case of the mate the aerosol load in the analyzed dust layer compared to Klett–Fernald retrieval, values are lower than those retrieved AERONET (DS2) due to the differences in the retrieval tech- with GRASP by up to 19 %. Considering that the uncertainty niques, e.g., although AERONET provides integrated AOD in αaer is around 30 % for both GRASP and the Klett–Fernald for the whole column, low αaer values above the aerosol layer retrieval and 3 % for the CAPS data, this discrepancy is well are neglected for the AOD calculations in DS1 and DS3. below the combined uncertainty in the different datasets. Dif- www.atmos-chem-phys.net/19/523/2019/ Atmos. Chem. Phys., 19, 523–542, 2019
530                             M. J. Granados-Muñoz et al.: Impact of mineral dust on shortwave and longwave radiation

Table 4. Column-integrated number concentration (N), effective radii (reff ), and standard deviation (σ ) of fine and coarse aerosol modes and
AOD at 550 nm for DS1, DS2, and DS3 on 16 and 17 June.

                                                 16 June (SZA = 31.49◦ )
                       Nf (no. µm−2 )     Nc (no. µm−2 )    reff,f (µm)    reff,c (µm)   σf (µm)   σc (µm)     AOD (550 nm)
               DS1                9.04             0.018          0.12           2.22       0.48       0.73              0.18
               DS2                7.53             0.014          0.12           1.90       0.57       0.65              0.23
               DS3                   –                 –          0.11           1.92       0.63       0.66              0.23
                                                 17 June (SZA = 61.93◦ )
                       Nf (no. µm−2 )     Nc (no. µm−2 )    reff,f (µm)    reff,c (µm)   σf (µm)   σc (µm)     AOD (550 nm)
               DS1                9.04             0.014          0.10           2.40       0.45       0.72              0.16
               DS2                8.03             0.012          0.11           2.08       0.53       0.68              0.19
               DS3                   –                 –          0.11           2.56       0.64       0.59              0.18

                                                                          0.04 and 0.02 are observed on 16 and 17 June, respectively,
                                                                          among the SSA values obtained with the three datasets. De-
                                                                          spite these differences, the retrieved SSA values obtained
                                                                          here are within the range of typical values for dust aerosols
                                                                          (Dubovik et al., 2002; Lopatin et al., 2013) and differences
                                                                          are still within the uncertainty limits, which range between
                                                                          0.02 and 0.07 depending on the aerosol load for AERONET
                                                                          data (Dubovik and King, 2000) and is 0.04 for the aircraft
                                                                          values. In the case of g values, the same data are used for
                                                                          the three aerosol input datasets. Multispectral values of g are
                                                                          taken from AERONET columnar values and assumed to be
                                                                          constant with height (Fig. 4b).
                                                                             Summing up, for the SW aerosol parametrization in
                                                                          GAME three datasets are tested. In DS1, GRASP-derived
Figure 3. SSA profiles obtained from GRASP/DS1 on 16 June (a)
                                                                          spectral profiles at seven wavelengths of the aerosol extinc-
and 17 June (b).
                                                                          tion and SSA are used. In DS2, the Klett retrieved extinc-
                                                                          tion profiles at three wavelengths are used together with
                                                                          the AERONET SSA columnar values at four wavelengths,
   Figure 3 presents the SSA values retrieved by the GRASP                which are assumed to be constant with height. For DS3,
algorithm, used as input for GAME in DS1, on 16 (F30,                     one extinction profile at 550 nm and a column-averaged
Fig. 3a) and 17 June (F31, Fig. 3b). The mean SSA at 440 nm               single-wavelength value of the SSA from the airborne mea-
is equal to 0.92 on 15 June, whereas on 17 June it is 0.85. On            surements are considered. In the three cases, the column-
17 June the SSA profiles present lower values and more vari-              integrated AERONET asymmetry parameter at four wave-
ation with height than on 16 June; the lower SSA values indi-             lengths is assumed to be constant with height and used as
cate the presence of more absorbing particles on 17 June. The             input.
vertical variation on 17 June is associated with the presence                For the LW calculations, the Mie code is used to obtain
of two different layers, whereas a more homogeneous dust                  αaer (λ, z), SSA(λ, z), and g(λ, z) from the information on
layer is observed on 16 June. For DS2, the SSA are taken                  the aerosol PSD, complex refractive index (RI), and density,
from AERONET columnar values and assumed to be con-                       following a similar approach to that used in previous stud-
stant with height (Fig. 4a). The SSA at 440 nm was 0.89 and               ies (Meloni et al., 2015, 2018; Peris-Ferrús et al., 2017). A
0.83 on 16 and 17 June, respectively; as already observed                 summary of the aerosol parameters used in the Mie calcula-
in Fig. 3, SSA values are lower on 17 June due to the in-                 tions is included in Table 5. Three different datasets are also
trusion of more absorbing particles. For DS3, SSA values at               used for the aerosol parameterization in the LW calculations.
530 nm are obtained from the nephelometer and the CAPS                    In this case, the sensitivity of the model to the PSD used is
or PLASMA on board the ATR. In order to reduce the un-                    tested. A similar scheme to that presented for the SW is used,
certainty in the measured data, only averaged values for the              where DS1 relies on GRASP retrievals, DS2 on AERONET
column will be considered, being 0.88 and 0.83 on 16 and                  products, and DS3 relies on in situ airborne measurements.
17 June, respectively (Fig. 4). Therefore, differences of up to

Atmos. Chem. Phys., 19, 523–542, 2019                                                        www.atmos-chem-phys.net/19/523/2019/
M. J. Granados-Muñoz et al.: Impact of mineral dust on shortwave and longwave radiation 531
Figure 4. (a) AERONET/DS2 column-integrated (circles) and aircraft/DS3 averaged (diamonds) SSA values on 16 June at 16:22 UTC and
17 June at 07:20 UTC. (b) AERONET g values for the same periods.
Table 5. Summary of the data used to obtain αaer (λ, z), SSA(λ, z), and g(λ, z) in the LW spectral range from Mie calculations, i.e., the
refractive index, RI; effective radius, reff ; geometric standard deviation, σ ; and number concentration, N. Three different datasets are used
(DS1, DS2, and DS3) based on different particle size distribution (PSD) data used. The indications below the sources of the aerosol parameters
indicate whether the parameter is column-integrated (col) or if it is vertically resolved (z) and the number of wavelengths at which it is given
(nλ). DB (2017) stands for Di Biagio et al. (2017).
LW
DS1 DS2 DS3
RI DB (2017), (col, 601λ) DB (2017), (col, 601λ) DB (2017), (col, 601λ)
reff GRASP (col), AERONET (col) Aircraft (z)
Mie calculations
σ GRASP (col) AERONET (col) Aircraft (z)
N GRASP (z) AERONET (col) Aircraft (z)
The spectral real and imaginary parts of the RI of mineral sidering the relevance of large particles for the ARELW (i.e.,
dust in the LW are obtained from Di Biagio et al. (2017), us- Perrone and Bergamo, 2011; Sicard et al., 2014a, b; Meloni
ing the Morocco source, and assumed constant with height. et al., 2018), neglecting this giant mode may contribute to
The analysis by Di Biagio et al. (2017) only covers the spec- increase the uncertainties in GAME estimations. However,
tral range 3–16 µm so an extrapolation assuming the spec- simulations with GAME assuming the presence of a third
tral dependence presented in Krekov (1993) for shorter and mode of similar characteristics to the one observed by Re-
longer wavelengths is performed. This assumption is not ex- nard et al. (2018) indicate that variations in the ARE are neg-
empt from uncertainty, since the refractive index presents a ligible in this case (lower than 0.1 W m−2 ). Even for much
certain variability associated with the different nature of min- higher concentrations (10−1 particles cm−3 ), variations in the
eral dust properties. For example, the use of the refractive in- ARE of just 0.3 W m−2 at the BOA and 0.15 W m−2 at the
dex provided for the Algerian and Mauritanian sources from TOA are obtained.
Di Biagio et al. (2017) leads to variations in the ARE of 0.8 In the case of DS1, N values are obtained from the vol-
and 0.3 W m−2 at the BOA and the TOA, respectively. Addi- ume concentration profiles provided by GRASP assuming
tionally, vertical variations in the refractive index are also a spherical particles in the range between 0.05 and 15 µm radii
source of uncertainty in the obtained radiative fluxes. The (Fig. 5). Values of reff and σ provided by GRASP (Ta-
mineral dust particle density is assumed to be 2.6 g cm−3 ble 4) are column-integrated and thus assumed to be con-
(Hess et al., 1998). Regarding the PSD, three parameters stant with height. This is also the case for DS2, in which the
(namely the effective radii, reff ; standard deviation, σ ; and PSD parameters are column-integrated values provided by
the numeric concentrations, N ) for fine and coarse modes the AERONET retrieval in Granada (see Table 4).
are used. The fine mode comprises particles within the diam- For DS3, the volume concentration (or the equivalent N ),
eter range 0.1–1 µm, whereas for the coarse mode the range r, and σ profiles for the fine and coarse modes (Fig. 5)
1–30 µm is considered. A third mode at about 30 µm was de- are calculated from the data provided by the aircraft in situ
tected in Renard et al. (2018) for the same dust event us- measurements in the range between 0.02 and 40 µm diam-
ing balloon-borne measurements with concentrations up to eter. Benavent-Oltra et al. (2017) found a general good ac-
10−4 particles cm−3 . However, this giant mode is not consid- cordance between the volume concentration profiles mea-
ered in our study due to the lack of data above Granada. Con- sured by the instrumentation on board the SAFIRE ATR
www.atmos-chem-phys.net/19/523/2019/ Atmos. Chem. Phys., 19, 523–542, 2019532 M. J. Granados-Muñoz et al.: Impact of mineral dust on shortwave and longwave radiation
where the upward and downward arrows are for upward
and downward fluxes, respectively. From the obtained radia-
tive flux profiles, the direct ARE profiles are calculated ac-
cording to the following equation:
ARE = (↓ F w −↑ F w ) − (↓ F o −↑ F o ), (2)
where F w and F o are the radiative fluxes with and without
aerosols, respectively. The direct ARE can be obtained for
the SW (ARESW ) and the LW (ARELW ) spectral ranges.
4 Mineral dust effect on shortwave and longwave
radiation
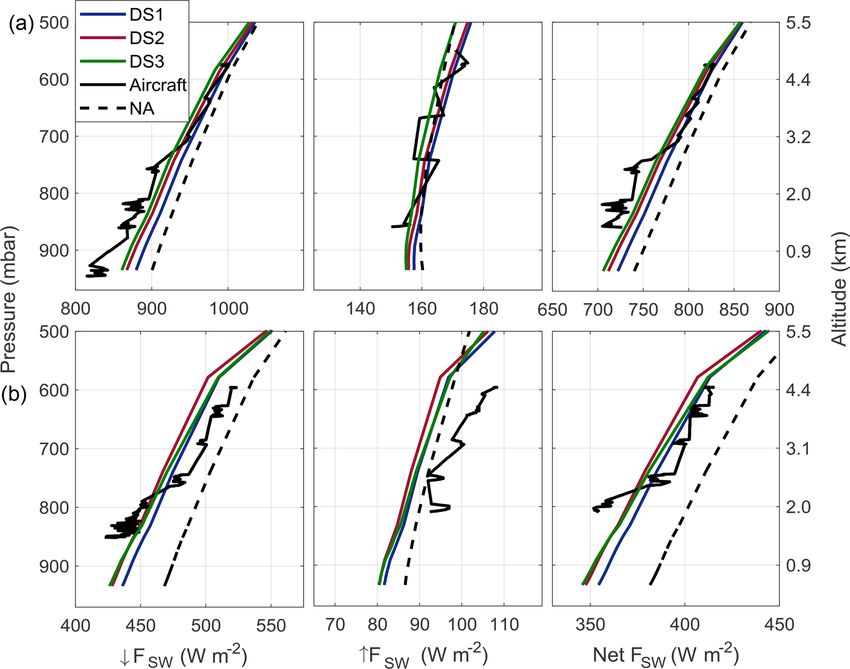
4.1 SW radiative fluxes
Figure 6 shows the radiative flux profiles for the SW spectral
Figure 5. Profiles of aerosol volume concentration for the fine
range obtained with GAME using the three different input
(blue) and coarse (red) mode obtained from GRASP/DS1 (dot-
ted line), and aircraft in situ/DS3 measurements (solid line) on
datasets described in Sect. 3, as well as the Net FSW . The
16 June (a) and 17 June (b). radiative fluxes measured by the pyranometer on board the
SAFIRE ATR 42 are also included in the figure. The three
GAME simulations show similar values with differences be-
42 and retrieved with GRASP, with differences in the to- low 8 W m−2 on average, which represents less than 1 % vari-
tal volume concentration profiles for the dust layers lower ation. The differences in the obtained fluxes are mostly due to
than 8 µm−3 cm−2 (20 %), which fall within the combined the differences in the aerosol load considered depending on
uncertainty. Nonetheless differences are still noticeable, es- the inputs. Even though the differences in the AOD among
pecially in the fine mode. On 17 June, GRASP overestimates the different datasets are small (lower than 0.05), they can
the aircraft measurements for the fine mode and underesti- lead to differences in FSW and ultimately in the ARESW . In
mates them for the coarse mode, which in turn results in a order to quantify these differences, we performed a sensitiv-
quite different fine to coarse concentration ratio for DS1 and ity test by varying the AOD while the other parameters were
DS3. Additionally, a slight shift is observed in the vertical kept constant. We observed a maximum variation in the FSW
structure of the aerosol layers. Differences are mostly techni- of 6.5 W m−2 (0.7 %) at the surface, decreasing with height,
cal, i.e., the GRASP retrieval is based on 30 min averaged li- for changes in the AOD of up to 0.05, which is the difference
dar profiles while the aircraft provide instantaneous measure- we observe between the AOD for DS2 and DS1 on 16 June.
ments, but they can also be partially caused by the discrepan- This result partly explains the differences among the three
cies between the vertical aerosol distribution above Granada datasets. In addition, a sensitivity test performed by exclu-
(sampled by the lidar) and the concentration measured dur- sively varying the SSA indicates that more absorbing parti-
ing the aircraft trajectory as they are not exactly coincident. cles are related to less ↓ FSW at the surface, namely a varia-
In addition, for 16 June, there is a 2 h time difference be- tion of 1 % is observed at the BOA for a decrease in the SSA
tween the sun/sky photometer retrieval used in GRASP cal- of 0.03. The influence of the SSA decreases with height and
culations and the airborne measurements, which can lead to is negligible at the TOA. For the ↑ FSW , a decrease of 0.8 % is
slight differences in the aerosol properties despite the homo- observed at the BOA if more absorbing particles are present,
geneity of the dust event during this period. In the following, but in this case the influence at the TOA is larger (2.2 %).
we quantify the impact these differences may introduce in In our case, the larger AOD assumed for DS2 on both days
the calculations of F . (see Table 4 and Fig. 2), causes the ↓ FSW to be slightly lower
compared to DS1. For DS3 the AOD is similar to DS2, but
3.2.3 GAME output data the SSA values used, which are relatively smaller compared
to those measured by AERONET (see Fig. 4), lead to lower
As a result of the simulation, GAME provides vertical pro- values of the radiative fluxes than for DS2. The vertical dis-
files of radiative fluxes in the shortwave (FSW ) and longwave tribution of the SSA also influences the radiative fluxes in the
(FLW ) spectral ranges. The net flux can be calculated from SW component as demonstrated in previous studies (Gómez-
the obtained profiles for both spectral ranges as Amo et al., 2010; Guan et al., 2010), contributing to explain
Net F =↓ F −↑ F, (1) the differences observed among the three datasets analyzed
here.
Atmos. Chem. Phys., 19, 523–542, 2019 www.atmos-chem-phys.net/19/523/2019/M. J. Granados-Muñoz et al.: Impact of mineral dust on shortwave and longwave radiation 533
Figure 6. Radiative fluxes for the SW spectral range for 16 June (a) and 17 June (b) simulated with GAME using different input aerosol
datasets (DS1 in blue, DS2 in red, and DS3 in green). The black lines are the aircraft in situ measurements distant from about 20 km. The
black dashed lines represent the radiative fluxes without the aerosol component (NA).
The evaluation against the aircraft measurements shows different datasets are shown in Fig. 7. AERONET surface
larger differences for altitudes below 2.5 km (∼ 860 mbar) radiative fluxes have been extensively validated at several
on 16 June, whereas a better agreement is found above. On sites around the world (e.g., García et al., 2008) and, in ad-
17 June, no ↑ FSW aircraft data are available below 2 km. dition, all AERONET sun photometers are mandatorily cali-
Relative differences between the model and the aircraft mea- brated once a year. Thus, in order to compare GAME results
sured data (calculated as (FGAME −Faircraft )/Faircraft ) are well with AERONET data, we have performed additional simu-
below 7 %, being the largest discrepancies observed for the lations for the time of the closest AERONET measurement
↓F
SW . Differences among the three GAME outputs and the on 16 June (at 16:22 UTC), assuming that the aerosol param-
aircraft pyranometer are lower than 5 % for the Net FSW eterization is constant with time between the flight time and
on both days. Considering the very different approaches fol- the photometer measurement. The ↓ FSW values at the surface
lowed by the model and the direct measurements by the air- obtained with GAME are 564.8, 551.8, and 547.0 W m−2 for
borne pyranometer (i.e., vertical resolution, temporal sam- DS1, DS2, and DS3, respectively, close to the 531.4 W m−2
pling, and data acquisition and processing) – together with provided by AERONET. On 17 June, GAME simulations
the uncertainty in the pyranometer (5 W m−2 ) and the esti- at 07:40 UTC (instead of 07:30 UTC, which is the time of
mated uncertainty in the model outputs that can be as large the flight) provide ↓ FSW at the surface of 466.3, 468.3,
as 19 W m−2 ) – these differences are quite reasonable. A con- and 456.4 W m−2 , very similar to the AERONET value of
clusive result on which input dataset provides a better perfor- 463.7 W m−2 .
mance is unlikely because of the comparable results obtained At the TOA, the ↑ FSW between GAME and AERONET
with the three datasets. are in quite good agreement on both days. On 16 June, the
The values at the surface (or BOA) and at the TOA for ↑F
SW values obtained with GAME simulations are equal to
the different radiative fluxes can also be evaluated against 152.0, 153.0, and 148.5 W m−2 , and with AERONET they
different instruments: measurements for the ↓ FSW at the sur- are equal to 146.2 W m−2 . On 17 June, the obtained values
face are available from the sun photometer; AERONET pro- with GAME are 133.6, 136.6, and 130.9 W m−2 for DS1,
vides values for the ↓ FSW and ↑ FSW at both the BOA and DS2, and DS3, and 131.6 W m−2 for AERONET.
TOA. The time series for these measurements corresponding The ARESW profiles, calculated by using Eq. (2) and
to 16–17 June and the results obtained with GAME for the GAME simulations for the three input datasets, are shown
www.atmos-chem-phys.net/19/523/2019/ Atmos. Chem. Phys., 19, 523–542, 2019534 M. J. Granados-Muñoz et al.: Impact of mineral dust on shortwave and longwave radiation
Figure 8. ARE profiles in the SW spectral range simulated using
Figure 7. Time series of the ↑ FSW at the TOA (a) and ↓ FSW at the DS1 (blue line), DS2 (red line), and DS3 (green line) as aerosol
BOA (b) for the period 16–17 June. The purple dots are AERONET input data in GAME for 16 June (a) and 17 June (b). The purple
fluxes, and GAME output data for different inputs are represented dots represent the ARE provided by AERONET (AE) at the BOA
by the blue circles (DS1), red crosses (DS2), and green crosses and the TOA and the orange dot, the AERONET corrected for the
(DS3). surface albedo effect (AE-C; see text) ARE at the BOA.
vious studies (Lolli et al., 2018). Moreover, the sensitivity
in Fig. 8, together with the simultaneous values provided by
tests performed reveal that an increase in the AOD of 0.05
AERONET on 17 June at the BOA and TOA. Comparing the
can lead to a stronger effect of the ARE both at the BOA (up
three GAME simulations, we can see that the low discrep-
to 6.7 W m−2 ) and the TOA (up to 2.5 W m−2 ), and more ab-
ancies in the F profiles from Fig. 6 lead to variations in the
sorbing particles (decrease in the SSA of 0.03) lead to more
ARESW of 10 %–27 % (3–10 W m−2 ) over the averaged pro-
ARE at the BOA and less at the TOA (4 and 2 W m−2 in ab-
file depending on the input dataset used. The variations in
solute terms, respectively). Therefore, the differences among
the ARESW values are tightly connected to differences in the
the datasets are within the estimated uncertainty.
AOD considered as input in the model, as already observed
The ARESW values obtained at the BOA and TOA for the
in previous studies (Sicard et al., 2014a; Lolli et al., 2018;
three datasets and the averaged value, as well as the FE,
Meloni et al., 2018). The SSA and the vertical distribution
are included in Table 6. Both at the BOA and TOA, the
of the aerosol also plays an important role, as observed for
ARESW has a cooling effect, as expected for mineral dust
DS3, which shows a profile that is quite different from DS2
in this region according to values obtained in the literature
despite the AOD being quite close for both datasets.
(e.g., Sicard et al., 2014a; Sicard et al., 2016; Mallet et al.,
Differences are also observed when comparing ARESW
2016). Differences among the three datasets lead to varia-
values obtained from GAME to those retrieved by
tions in the ARESW of up to 30 % (or 20 % for the FE),
AERONET. Contrary to GAME simulations, AERONET
observing larger variability on 16 June. The values of the
does not consider the vertical distribution of the aerosols
ARESW and the FESW are highly dependent on the SZA
when calculating the ARESW , and the definition of the
and a straightforward comparison with previous studies is
ARESW at the BOA (BOA ARESW ) is slightly different. In-
not simple. Nonetheless, the values obtained for this case are
deed, AERONET BOA ARESW is calculated as the difference
within the range of previous values observed in the western
between the downward fluxes with and without aerosols,
Mediterranean region for similar values of SZA, e.g., FE be-
the difference between the upward fluxes (reflected by the
tween −263.4 and −157.1 W m−2 at the BOA and −23.8
Earth) being neglected. Considering this, we can correct the
BOA ARE and −86.2 W m−2 for SZA = 60◦ or ARE values ranging
SW provided by AERONET by multiplying by a fac-
between −93.1 and −0.5 W m−2 at the BOA and between
tor 1−alb(λ). The corrected BOA ARESW value on 17 June is
−34.5 and +8.5 W m−2 at the TOA for different SZA val-
thus −31.9 W m−2 , which is within the range of values pro-
ues (e.g., Gómez-Amo et al., 2011; Sicard et al., 2014a, b;
vided by GAME at the surface. All discrepancies observed
Barragan et al., 2017).
here are mostly intrinsic to the different techniques used for
the acquisition of the data and the retrieval algorithms. The
effect of the data processing has also been observed in pre-
Atmos. Chem. Phys., 19, 523–542, 2019 www.atmos-chem-phys.net/19/523/2019/M. J. Granados-Muñoz et al.: Impact of mineral dust on shortwave and longwave radiation 535
Table 6. ARE (and FE indicated between parenthesis) at the BOA and the TOA for the SW spectral range obtained with GAME using as
inputs DS1, DS2, and DS3 for 16 and 17 June 2013. The averaged values and standard deviation are also included.
16 June 17 June
BOA ARE TOA ARE BOA ARE TOA ARE
SW (FE) SW (FE) SW (FE) SW (FE)
(W m−2 ) (W m−2 ) (W m−2 ) (W m−2 )
DS1 −18.1(−100.6) −6.3(−35.0) −27.1(−169.4) −10.3(−64.4)
DS2 −28.6(−124.4) −5.5(−23.9) −34.0(−178.9) −9.6(−50.5)
DS3 −34.3(−149.1) −1.5(−6.5) −35.8(−198.9) −6.5(−36.1)
Avg. ± SD −27.0 ± 8.2 (−124.7 ± 24.3) −4.4 ± 2.6 (−21.8 ± 14.4) −32.3 ± 4.6 (−182.4 ± 15.1) −8.8 ± 2.0 (50.3 ± 14.2)
Figure 9. Radiative fluxes for the LW spectral range for 16 June (a) and 17 June (b) simulated with GAME using different input aerosol
datasets (DS1 in blue, DS2 in red, and DS3 in green). The black line represents the aircraft in situ measurements. The dashed black lines
represent the radiative fluxes without the aerosol component (NA).
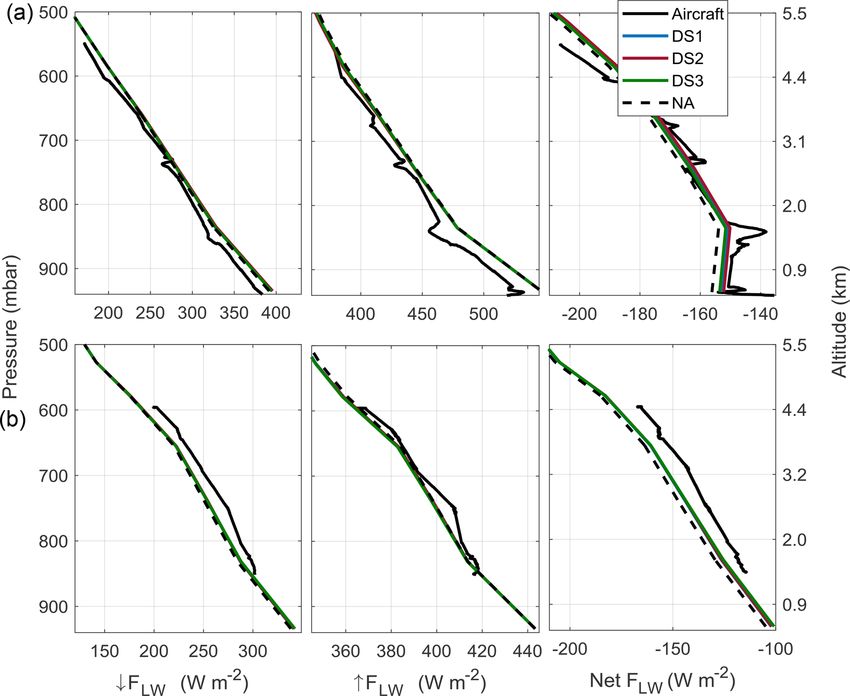
4.2 LW radiative fluxes increasing the air surface temperature measured at the me-
teorological station by 5 K indicates that ↑ FLW increases its
Figure 9 shows FLW calculated with GAME after obtaining value up to 30 W m−2 at the surface, and around 10 W m−2
the aerosol properties in the LW spectral range from Mie cal- from 1 km onwards, which is nonnegligible. This would lead
culations for the three mentioned datasets (see Sect. 3.2.2). to an overestimation of the aircraft measured values, but still
FLW values measured by pyrgeometers located on board the within a 6 % difference. This highlights the need for accu-
ATR are also shown. rate LST measurements for radiation simulations in the LW
In general, differences in the FLW are always lower than spectral range. Additionally, a sensitivity test performed by
6 % (lower than 10 W m−2 on average), with the airborne val- assuming a 10 % uncertainty in the PSD parameters (reff , N ,
ues being overestimated by the model on 16 June and under- and σ ) leads to an estimated uncertainty in the FLW retrieved
estimated on 17 June. On this latter day, larger differences by GAME of around 1.2 W m−2 . As stated before, the as-
are observed on the Net FLW compared to 16 June, which sumption of the refractive index can also introduce variations
might be explained by the inaccurate value of LST used due as large as 0.8 W m−2 . Considering the uncertainty in the pyr-
to the lack of precise data. A sensitivity test performed by geometer, the fact that the aircraft and the model present dif-
www.atmos-chem-phys.net/19/523/2019/ Atmos. Chem. Phys., 19, 523–542, 2019You can also read


