Ultrasonic nebulization for the elemental analysis of microgram-level samples with offline aerosol mass spectrometry - Atmos. Meas. Tech
←
→
Page content transcription
If your browser does not render page correctly, please read the page content below
Atmos. Meas. Tech., 12, 1659–1671, 2019
https://doi.org/10.5194/amt-12-1659-2019
© Author(s) 2019. This work is distributed under
the Creative Commons Attribution 4.0 License.

Ultrasonic nebulization for the elemental analysis of
microgram-level samples with offline aerosol mass spectrometry
Rachel E. O’Brien1,2 , Kelsey J. Ridley2 , Manjula R. Canagaratna3 , John T. Jayne3 , Philip L. Croteau3 ,
Douglas R. Worsnop3 , Sri Hapsari Budisulistiorini4,a , Jason D. Surratt4 , Christopher L. Follett5,6 , Daniel J. Repeta5 ,
and Jesse H. Kroll2
1 Department  of Chemistry, College of William and Mary, Williamsburg, Virginia 23185, USA
2 Department  of Civil and Environmental Engineering, Massachusetts Institute of Technology, Cambridge,
Massachusetts 02139, USA
3 Center for Aerosol and Cloud Chemistry, Aerodyne Research Inc., Billerica, Massachusetts 01821, USA
4 Department of Environmental Sciences and Engineering, Gillings School of Global Public Health,

University of North Carolina at Chapel Hill, Chapel Hill, North Carolina 27599, USA
5 Department of Marine Chemistry and Geochemistry, Woods Hole Oceanographic Institution, Woods Hole,

Massachusetts 02540, USA
6 Department of Earth, Atmospheric, and Planetary Sciences, Massachusetts Institute of Technology, Cambridge, MA, USA
a now at: Earth Observatory of Singapore, Nanyang Technological University, 638789, Singapore

Correspondence: Rachel E. O’Brien (reobrien@wm.edu)

Received: 25 September 2018 – Discussion started: 23 October 2018
Revised: 25 January 2019 – Accepted: 11 February 2019 – Published: 14 March 2019

Abstract. The elemental composition of organic material           to aerosol filter extracts from the field and laboratory, as
in environmental samples – including atmospheric organic          well as to the polysaccharide fraction of dissolved organic
aerosol, dissolved organic matter, and other complex mix-         matter (DOM) from the North Pacific Ocean. In the case of
tures – provides insights into their sources and environmen-      aerosol particles, the mass spectra and elemental ratios from
tal processing. However, standard analytical techniques for       the SVN–AMS agree with those from online AMS sampling.
measuring elemental ratios typically require large sample         Similarly, for DOM, the elemental ratios determined from
sizes (milligrams of material or more). Here we character-        the SVN–AMS agree with those determined using combus-
ize a method for measuring elemental ratios in environmen-        tion analysis. The SVN–AMS provides a platform for the
tal samples, requiring only micrograms of material, using         rapid quantitative analysis of the elemental composition of
a small-volume nebulizer (SVN). The technique uses ultra-         complex organic mixtures and non-refractory inorganic salts
sonic nebulization of samples to generate aerosol particles       from microgram samples with applications that include anal-
(100–300 nm diameter), which are then analyzed using an           ysis of aerosol extracts and terrestrial, aquatic, and atmo-
aerosol mass spectrometer (AMS). We demonstrate that the          spheric dissolved organic matter.
technique generates aerosol from complex organic mixtures
with minimal changes to the elemental composition of the
organic material and that quantification is possible using in-
ternal standards (e.g., NH15
                           4 NO3 ). Sample volumes of 2–4 µL
                                                                  1   Introduction
with total solution concentrations of at least 0.2 g L−1 form
sufficient particle mass for elemental ratio measurement by       A large number of environmental systems, including the at-
the AMS, despite only a small fraction (∼ 0.1 %) of the sam-      mosphere, natural waters, and terrestrial systems, contain
ple forming fine particles after nebulization (with the remain-   complex organic mixtures composed of hundreds to thou-
der ending up as larger droplets). The method was applied         sands of molecular species. Our ability to understand and
                                                                  model such complex chemical systems is often greatly im-

Published by Copernicus Publications on behalf of the European Geosciences Union.
1660 R. E. O’Brien et al.: Small-volume nebulizer proved when we characterize them in terms of simple chemi- in the size range needed for the AMS, this requires sample cal frameworks. On the simplest level, the analysis of average masses on the order of 50 µg. While this represents a sub- elemental ratios can provide important information on poten- stantial improvement over the sample mass requirements of tial sources of organic matter samples, as well as the chem- conventional CHNS analysis, it is still sufficiently large to ical and/or biological transformation processes that modify limit the applicability of the approach since it can require their composition. For example, the elemental ratios of atmo- relatively large organic samples collected with high-volume spheric organic aerosol – e.g., oxygen / carbon ratio (O : C), samplers, often over 24 h or more. hydrogen / carbon ratio (H : C), and nitrogen / carbon ratio In this work, we characterize a new technique for the el- (N : C) – provide information on aerosol sources and aging emental analysis of very small sample masses, using ultra- (Aiken et al., 2008; Canagaratna et al., 2015; Chen et al., sonic nebulization. Aerosol generation with a small-volume 2015; Daumit et al., 2013; Heald et al., 2010; Jimenez et al., nebulizer (SVN) expands the range of environmental sam- 2009; Kroll et al., 2011). Similarly, in water and soil samples, ples that can be measured, where either sample size is lim- the elemental ratios of carbon, nitrogen, and phosphorous re- ited or solvent contamination is a concern. The SVN gen- veal insights into sources and processing of dissolved and erates aerosol suitable for analysis with aerosol instrumen- particulate organic matter (Becker et al., 2014; Hansman et tation, including not only the AMS and scanning mobility al., 2015; Koch et al., 2005; Lu et al., 2015). particle sizer (SMPS), but also single-particle mass spec- The most widespread technique for elemental analysis is trometers (e.g., particle analysis by laser mass spectrome- high-temperature combustion followed by elemental (car- try, PALMS; Murphy et al., 1998), soft ionization sources bon, hydrogen, nitrogen, and sulfur – CHNS) analysis, which (e.g., extractive electrospray ionization, EESI; Gallimore and is highly accurate but can require milligrams of material Kalberer, 2013), and thermal desorption chemical ioniza- (Skoog et al., 1998). For many trace environmental samples, tion mass spectrometers (e.g., Filter Inlet for Gases and like atmospheric aerosol, this can require extremely long col- AEROsols, FIGAERO CIMS; Lopez-Hilfiker et al., 2014). lection times, which lead to low time resolution. This lim- Here, we present results characterizing the SVN using an its the amount of information provided for systems that ex- HR-ToF-AMS and an SMPS and demonstrate production hibit high temporal variability, such as air masses in major and elemental analysis of aerosol using 2–4 µL of liquid sam- urban regions. An alternative approach for measuring the ples, with masses of organic material as low as ∼ 0.4 µg. elemental ratios of aerosol is online (real-time) techniques. In some cases, depending on the sample, pre-concentration The most widely used instrument for such measurements is required to generate suitable solutions for analysis. The is the Aerodyne high-resolution time-of-flight aerosol mass concentration ranges needed (described below) are compa- spectrometer (HR-ToF-AMS) (Decarlo et al., 2006), which rable to the concentrations used for other offline character- can measure elemental ratios of ambient aerosol using just izations including soft ionization with electrospray ioniza- nanograms of material. Over the last decade, in situ anal- tion into mass spectrometers. Thus, this technique provides ysis of aerosol particles with the AMS has enabled rapid, a platform for direct comparison between offline-AMS sam- sensitive characterization of aerosol concentrations, sources, ples and other analytical techniques. Quantification of total and atmospheric aging, improving our ability to model at- organic concentrations is demonstrated using internal stan- mospheric aerosol and consequently its climate and health dards. We examine the effects of aerosol collection, extrac- effects (Kroll et al., 2015; Ng et al., 2011b; Jimenez et al., tion, and nebulization on the mass spectra and elemental ra- 2009; Canagaratna et al., 2007). tios observed for offline and online AMS. The aim of this Recently, a number of researchers have used the AMS in work is to demonstrate that offline analysis of organic mix- an “offline mode”, in which atmospheric samples are col- tures with the SVN–AMS can provide quantitative character- lected on filters, extracted, and then atomized into the AMS. istic elemental ratios for trace environmental and biological Examples include the analysis of sources and aging of atmo- samples using just micrograms of sample. spheric organic material from aerosol filter extracts (Bozzetti et al., 2017; Huang et al., 2014; Sun et al., 2011; Xu et al., 2015; Ye et al., 2017), cloud and/or fog, water samples (Kaul 2 Experiments et al., 2014; Lee et al., 2012), and organic material in glaciers (Xu et al., 2013). Offline AMS has proven especially useful 2.1 Small-volume nebulizer for the analysis of aerosol particles larger than 1 µm (Bozzetti et al., 2016; Daellenbach et al., 2016; Ge et al., 2017). Of- The SVN, illustrated in Fig. 1, creates an aerosol by ultra- fline AMS has also proven useful in investigating fraction- sonically nebulizing a small droplet placed on a thin film ation and solubility of atmospheric organic material in wa- stretched across a water reservoir. The aerosol is then car- ter and organic solvents (Daellenbach et al., 2016; Mihara ried by a gentle flow of either house air (zero air, Aadco In- and Mochida, 2011; Xu et al., 2016). These studies used struments) or argon (Airgas, 99.999 % purity) into the AMS. both custom-made and commercial atomizers with solvent The three main components of the SVN, described in detail volumes of at least 5–15 mL. To generate aerosol particles below, are (1) a bottom cylinder with an ultrasonic transducer Atmos. Meas. Tech., 12, 1659–1671, 2019 www.atmos-meas-tech.net/12/1659/2019/
R. E. O’Brien et al.: Small-volume nebulizer                                                                                       1661

                                                                           to the AMS. Additional components such as Nafion™ (Perma
                                                                           Pure LLC) dryers can be placed in line if desired, but such
                                                                           modifications were not investigated in the present work.
                                                                              Samples can be introduced into the SVN using two dif-
                                                                           ferent approaches: discrete injections of individual samples
                                                                           (for individual “one-shot” measurements) or continuous ad-
                                                                           dition of a sample flow (for continual analysis, enabling sig-
                                                                           nal averaging). For most studies, Milli-Q water was used as
                                                                           the solvent; in some cases we used HPLC-grade methanol,
                                                                           though the organic background signal is higher. This was
                                                                           likely due to a combination of increased organic background
                                                                           in organic solvents and incomplete evaporation of methanol
                                                                           prior to measurement. For most of the work described here,
                                                                           we used discrete injections of 2–5 µL of aqueous solutions
                                                                           manually deposited directly onto the center of the Kapton
                                                                           film. For continuous injections, solutions made with Milli-
                                                                           Q or organic solvents were introduced via a syringe pump
                                                                           (Harvard Apparatus model 22), which sends liquid flow (20–
                                                                           40 µL min−1 ) through a borosilicate capillary entering the
                                                                           SVN via a small downward-facing hole in the upper PVC
                                                                           piece (Fig. 1). In the future, such a port could also be used
                                                                           to provide automated discrete sample introduction using an
                                                                           autosampler.
                                                                              For aqueous samples containing salts and small organic
Figure 1. Schematic diagram of the small-volume ultrasonic nebu-           molecules, only 1 %–2 % of the original sample mass was
lizer (SVN). Samples (2–4 µL) are loaded on the Kapton (or Teflon)
                                                                           observed to remain on the thin film after a discrete injection
film through either the hole in which the glass tube is seated (for dis-
                                                                           (Fig. S2). To ensure a clean surface between different sam-
crete injections) or through the pinhole (for continuous injections).
After the transducer is turned on, the aerosol is carried up through       ples, the surface was cleaned by nebulizing 2–8 µL of Milli-Q
the glass tube and into the instrument by a ∼ 160 sccm (standard           water off the surface 5–10 times over approximately 1 min.
cubic centimeters per minute) flow of zero air or argon carrier gas.       The cleanliness of the surface was then verified by nebuliz-
The water bath between the transducer and the Kapton film carries          ing a salt solution (at least 0.5 g L−1 ) between each sample.
ultrasonic waves up to the film and serves to cool the ultrasonic          The salt solution is necessary to ensure that any contaminants
transducer.                                                                can be seen since pure water risks generating aerosol parti-
                                                                           cles that are too small to be measured in the AMS. For sam-
                                                                           ples in which carryover was observed (for example, the dis-
and water bath, (2) a thin film that is press-fit onto the top of          solved organic matter solutions discussed in Sect. 3.1), addi-
the water bath by an upper cylinder with a slightly larger ID,             tional cleaning of the film was undertaken with sonication in
and (3) a vertical glass tube that connects to the AMS. The                a deionized water bath followed by rinsing with HPLC-grade
connections between all components are airtight, but the ap-               methanol for >30 s. Careful maintenance of the surface en-
paratus is easily disassembled to inject samples onto the film,            sures uncontaminated mass spectra and accurate quantifica-
as well as to clean the thin film and change the water bath.               tion of the solution components.
   In the bottom section of the SVN, the 2.4 MHz ultrasonic
transducer (Sonaer, Inc., model 241VM) is located just under               2.2   AMS data collection and analysis
the liquid reservoir, with a thin film stretched across the top
of the reservoir to provide a clean nebulization surface for the           While a number of different aerosol instruments could be
sample. We use a 0.001 in. thick Kapton film or Teflon film,               used with the SVN, here we focus primarily on elemen-
as these two were found to have the lowest background signal               tal analysis by the HR-ToF-AMS. The AMS has previously
and the best performance in terms of the amount of aerosol                 been described in detail (Canagaratna et al., 2007; Decarlo
generated compared to other materials tested. Press-fit onto               et al., 2006) and provides quantitative measurements of non-
the bottom piece is another PVC cylinder that has two side                 refractory material (organics, ammonium sulfate, ammonium
ports with carrier gas inlets and a larger hole in the top into            nitrate, etc.) for aerosol particles between approximately 40
which a 15 cm glass tube is seated. The distance from the                  and 1000 nm. The mass spectrometer used in the AMS is
thin film to the bottom of the glass tube is ∼ 1.5 cm. During              a HR-ToF-AMS (Tofwerk AG), run under “V mode” for a
experiments, the nebulized aerosol is carried up through the               mass resolution of 2000–3000 m/1m. This mass-resolving
vertical glass tube and into the stainless steel tubing that leads         power enables peak fitting and identification of all organic

www.atmos-meas-tech.net/12/1659/2019/                                                       Atmos. Meas. Tech., 12, 1659–1671, 2019
1662 R. E. O’Brien et al.: Small-volume nebulizer
fragment ions observed here (m/z < 130), which enables the as relative measurements, and thus no CE correction is ap-
calculation of quantitative elemental ratios for the organic plied. Some biases may arise if the aerosol is not internally
mixture, after correcting for fragmentation bias during elec- mixed, but for all systems examined so far in PToF, no size
tron ionization (Aiken et al., 2007, 2008; Canagaratna et al., dependence in composition was observed (Fig. S1 in the Sup-
2015). For AMS data collected using indoor or outdoor air, plement).
the intensities of CO+ and H2 O+ are complicated by gas-
phase interferences (N+ +
2 and gas-phase H2 O ). For samples 2.3 Sample collection and solution preparation
compared to chamber or ambient online-AMS data sets, zero
air was the carrier gas, standard empirical estimates were As described below, samples were prepared from a num-
used, and the improved ambient method for elemental ratios ber of sources, including commercially available standards,
was applied (Canagaratna et al., 2015). With the SVN, inert the extracts of chamber and ambient aerosol particles col-
carrier gases such as argon can also be used, allowing for the lected on filters, and dissolved organic matter from the
direct measurement of the CO+ ion intensity. This is demon- Pacific Ocean. For all solutions, either ultrapure water
strated below for dissolved organic matter; the majority of (18.2 M cm, Milli-Q) or HPLC-grade methanol was used.
the other samples were run with zero air. Prior to use, all glassware was cleaned with a methanol sol-
For discrete sampling, “fast MS” mode (Kimmel et al., vent wash and baked at 450 ◦ C for 6 h.
2010) was used because the pulse length of a single in- Chamber aerosol (enabling offline vs. online compar-
jection is ∼ 30–60 s long. Fast MS mode generates mass isons) was generated in the MIT 7.5 m3 Teflon environmental
spectra every 0.5–2 s and the instrument cycles between the chamber, run in continuous-volume “semi-batch” mode. De-
“closed” state, in which the aerosol beam is blocked, and the tails on the facility are given elsewhere (Hunter et al., 2014).
“open” state, in which the aerosol beam can reach the va- Experiments were run at 20 ◦ C, with < 5 % relative humidity
porization and ionization region for detection. For the work (RH), in the dark, and under low-NOx (< 10 ppb) conditions
shown here, mass spectra were collected every 0.5 s for a using ozone as the oxidant. Ammonium sulfate seeds were
duration of ∼ 15–18 s in the open state, followed by 3 s in added for an initial concentration of ∼ 60 µg m−3 . The pre-
the closed state. The closed spectrum provides information cursor, α-pinene, had an initial mixing ratio of 100 ppb; a
on the instrument background, including contributions from Pen-Ray lamp (Jelight model 600) was used to add an ini-
gas-phase species, and is subtracted from the open spec- tial ozone concentration of ∼ 700 ppb of ozone. The ozone
trum in data processing. For the high-resolution peak fit- concentration decreased due to consumption and dilution to
ting and the analysis of the mass spectrum and the elemen- 400 ppb by the end of the experiment. The initial organic
tal ratios, the average mass spectrum across all injections is loading was ∼ 70 µg m−3 and decayed due to dilution, sam-
used. For quantification, the total signal under each injec- pling, and wall loss to a final value of ∼ 18 µg m−3 . Filter
tion pulse is used. For continuous injections, the standard samples were collected on Zeflour® PTFE membrane filters
AMS operating mode (“GenAlt” mode) was used. This pro- (0.5 µm pore size) at flow rates of ∼ 5 L min−1 for 10 h. Lab-
vides an average mass spectrum (by subtracting the closed oratory blank filters were prepared by placing separate filters
signal from the open signal), as well as particle time-of- in the filter holder for 10 min before the start of the experi-
flight (PToF) data (providing aerosol size distributions for ments. All filters were stored in baked aluminum foil packets,
all aerosol components), once per minute. All AMS data sealed in plastic bags, and placed in a freezer at −20 ◦ C un-
were analyzed using software packages Squirrel (v1.57I) til extraction. Filters were extracted with ∼ 4 mL of HPLC-
and Pika (v1.16I), available at http://cires1.colorado.edu/ grade methanol. In order to avoid oxidation of the organic
jimenez-group/ToFAMSResources/ToFSoftware/ (last ac- species in the extract, no sonication was used; instead, the
cess: 25 July 2016). vials were gently agitated by hand intermittently over 3 h.
The aerodynamic lens on the AMS has a transmission ef- Solutions were concentrated by evaporating to dryness un-
ficiency of nearly 100 % for particles with aerodynamic di- der a gentle stream of ultra-high-purity N2 . Dried samples
ameters of 70–500 nm; for somewhat smaller particles (40– were stored in the freezer at −20 ◦ C until reconstitution with
70 nm), this transmission is lower but not negligible (Jimenez Milli-Q water and analysis by the SVN–AMS. Blank sub-
et al., 2003). Thus, high enough solution concentrations are traction was carried out with a scaling of the filter blank to
used such that the dried particles formed in the nebulizer 12 % of the sample signal, as determined from the internal
are larger than ∼ 100 nm in aerodynamic diameter. Collec- standard in each sample.
tion efficiencies (CEs) in the AMS can vary depending on Field samples from the Southern Oxidant and Aerosol
the extent to which aerosol particles bounce off the thermal Study (SOAS) in 2013 were collected on pre-baked
element prior to vaporization (Docherty et al., 2013). This Tissuquartz™ filters (Pall Life Science, 8×10 in.) from Look
can impact the absolute concentrations observed, but for in- Rock, TN, starting on 16 June 2013 using a high-volume
ternally mixed samples, the relative concentrations of differ- aerosol filter sampler with a PM2.5 cyclone (Tisch Environ-
ent aerosol components are independent of CE. In this work, mental, Inc.) as described by Budisulistiorini et al. (2015).
most measurements (including elemental ratios) are reported For filter extraction, a 37 mm punch was extracted in a pre-
Atmos. Meas. Tech., 12, 1659–1671, 2019 www.atmos-meas-tech.net/12/1659/2019/R. E. O’Brien et al.: Small-volume nebulizer 1663
cleaned scintillation vials with 20 mL high-purity methanol
(LC-MS Chromasolv® grade, Sigma-Aldrich) by sonication
for 45 min. Filter extract was filtered through a 0.2 µm sy-
ringe filter (Acrodisc® PTFE membrane, Pall Life Sciences)
to remove suspended filter fibers. The filtered extract was
then blown down to dryness under a gentle N2 (g) stream at
room temperature. An aerosol chemical speciation monitor
(ACSM) (Ng et al., 2011a) was deployed at the same field
site (Budisulistiorini et al., 2015); the average mass spectrum
for the length of the filter sample was used for comparison
with the present SVN–AMS measurements. For all analyses
presented here (chamber and ambient) sufficient mass was
extracted to enable the analysis of individual filter samples,
with no combination of extracts from different samples re-
quired.
Standard solutions were prepared from commercially
available compounds dissolved in Milli-Q water. Reagents
used included ammonium sulfate, ammonium nitrate,
isotopically labeled ammonium nitrate (NH15 4 NO3 ), cit-
ric acid, mannitol, PEG-400, 4-hydroxy-3-methoxy-DL-
mandelic acid (HMMA), and HPLC-grade methanol, all
from Sigma-Aldrich, all at ≥ 99 % purity. Figure 2. Measurements of the composition and size of nebulized
The dissolved organic matter (DOM) polysaccharide sam- samples from the SVN. (a) Time series of aerosol composition from
ple was collected at the Natural Energy Laboratory Hawaii a single 4 µL nebulization of an aqueous solution (mannitol, am-
Authority facility in Kona, Hawaii. Seawater from a depth of monium nitrate, and ammonium sulfate). Data were recorded using
20 m was pumped though a 0.2 µm filter to remove particles, fast-mode MS for the AMS-open scans, with a mass spectrum col-
and the high-molecular-weight fraction of organic matter in lected every 0.5 s (filled circles). The gaps in the trace correspond
the filtrate was concentrated by ultrafiltration using a mem- to closed cycles where the aerosol beam was blocked to provide a
brane with a 1 nm pore size and a nominal 1000 Da molecu- background subtraction (gas phase and instrument background) that
lar weight cutoff. This fraction was desalted by serial dilution was applied during data processing. Measured concentrations are
not corrected for collection efficiency (CE) in the AMS, which af-
and concentration with Milli-Q water and then freeze-dried.
fects the absolute values but not the relative concentrations. The in-
Low-molecular-weight humic substances and residual salts
set shows the average mass spectrum acquired across the injection,
were removed by stirring with anion (hydroxide form) and normalized to total ion signal. (b) Aerosol size distribution from a
cation exchange resins (hydrogen form). The final product ∼ 1 g L−1 citric acid solution measured with an SMPS (black line).
was freeze-dried to yield a fluffy white powder. Conventional The gradient represents the transmission efficiency for particles into
CHNS analysis was carried out using a CE-440 elemental the AMS with nearly 100 % between 70 and 500 nm and decreased
analyzer (Exeter Analytical). This powder was dissolved in but substantial transmission for spherical particles 30–70 nm and
Milli-Q water at approximately 1 g L−1 to prepare solutions 500 nm to 2.5 µm (Jimenez et al., 2003); thus, the smallest particles
for analysis. in the distribution will not be efficiently detected by the AMS.
3 Results and discussion cessing. Measurements are collected until the signal returns
to the baseline (t =∼ 44 s).
3.1 Nebulization and aerosol size Figure 2b shows the size distribution of the particles gen-
erated by nebulizing an aqueous solution of citric acid with
Figure 2a shows a time series of measured aerosol mass con- continuous injection via syringe pump and a total concen-
centrations of a typical nebulized aerosol pulse from a 4 µL tration of ∼ 1 g L−1 into an SMPS (TSI, Inc.). The parti-
solution containing approximately 0.33 g L−1 each of manni- cles have size distributions centered at 150–200 nm (elec-
tol, ammonium sulfate, and ammonium nitrate. The nebulizer trical mobility diameter). These particles were sampled into
is turned on at t = 0 and shortly afterwards (t =∼ 10 s) the the SMPS without passing through a dryer. The SVN was
aerosol packet is observed in the AMS. The start of the nebu- approximately 3 m further away from the inlet of the SMPS
lization is timed so that a closed (background) measurement so the particles are likely to be somewhat smaller than those
occurs during the downslope of the signal (closed measure- entering the AMS, due to water evaporation in the dry car-
ments shown as gaps, e.g., t =∼ 16–21 s). This background rier gas. We find injections of solutions with total concen-
is subtracted from the aerosol particle signal during data pro- trations above 0.2 g L−1 provide sufficient aerosol mass for
www.atmos-meas-tech.net/12/1659/2019/ Atmos. Meas. Tech., 12, 1659–1671, 20191664 R. E. O’Brien et al.: Small-volume nebulizer
analysis (Fig. S1). These measurements compare well with
calculations based on the size of droplets reported by the
manufacturer (Sonaer, Inc.) of approximately 1.7 µm using
water solutions. Assuming that the density of the dried parti-
cle is 1.3 g cm−3 (Nakao et al., 2013), the minimum sample
concentration that will form a 100 nm dried particle is ap-
proximately 0.3 g L−1 . More dilute solutions do not generate
signal in the AMS because the majority of the aerosol parti-
cles that are formed are too small for transmission through
the aerodynamic lens of the AMS (Fig. 2b). To generate
large enough aerosol particles from more dilute solutions,
larger initial droplets could be formed by changing the trans- Figure 3. Mass of each component placed on the thin film vs. the
ducer to one that vibrates at a lower frequency. However, for mass measured by the AMS for four different solutions with varying
these larger droplets, drying will require the loss of a greater concentrations of citric acid, ammonium sulfate, ammonium nitrate,
amount of solvent, so that any impurities in the solvent will and the internal standard (NH15 4 NO3 ), all with a total solution con-
make up a larger (and possibly even dominant) fraction of centration of 0.75 g L−1 . Each sample had five replicate injections,
the resulting fine particles. Thus the use of ultrasonic nebu- with the vertical spread in the measured masses indicating substan-
lization at lower frequencies was not investigated here. tial run-to-run variability (up to a factor of 3) among injections.
3.2 Quantification
tal concentration, 0.75 g L−1 ). Six replicate injections of 4 µL
3.2.1 Nebulization efficiency drops of the solutions from one of the calibration curves
(Sect. 3.2.2 below) were atomized, and the total mass ob-
A key quantity describing the potential sensitivity of the
served in the AMS was calculated using Eq. (1). (Details on
SVN–AMS is the SVN nebulization efficiency, the ratio of
the concentrations of analytes in these calibration solutions
the mass measured in the AMS compared to the mass of ana-
are provided in the Supplement.) There are variations in the
lyte placed on the thin film. This was determined by loading
efficiency from sample to sample and run to run; thus the
4 µL of a known solution onto the film and measuring the
trends shown in Fig. 3 are illustrative only. The key trait ob-
mass of each component in the AMS integrated over the in-
served is that the measured nebulization efficiencies are on
jection pulse, determined by
the order of 0.02 %–0.06 %, indicating that the aerosol mass
Zt2 detected with the AMS is approximately 3 orders of magni-
MAMS = f (t) dt × vAMS , (1) tude lower than the mass originally deposited on the thin film.
The majority of the sample mass loss likely occurs during
t1
the nebulization process itself. For aqueous solutions in the
where MAMS is the mass measured by the AMS in micro- SVN, large droplets are observed to be ejected off the sur-
grams, f (t) is the instantaneous mass concentration mea- face of the film at the same time as the aerosol is generated.
sured in the AMS (µg m−3 ), and νAMS is the gas flow rate into These ejected droplets are then lost to the walls of the SVN.
the AMS in cubic meters per second. For each injection, the The ejection of these droplets appears to be a necessary part
background-subtracted AMS signal is calculated (Fig. 2a). of the nebulization mechanism for water samples as smaller
The gaps due to closed cycles are bridged by interpolation, volumes (< 1 µL) of water do not generate such droplets and
and the area under the injection curve is calculated via trape- also do not appear to form aerosol. This observed mecha-
zoidal integration from time points before and after the pulse nism is in agreement with previous studies of aerosol gener-
(t1 and t2 , respectively). The mass measured in the AMS is ation for ultrasonic nebulization, in which cavitation within
affected by three factors: the amount of aerosol formed and the droplet (Lang, 1962) and boiling and/or jetting from a
transported out of the SVN, the fraction of the gas flow from droplet chain (Simon et al., 2015) have been observed.
the SVN that is sampled by the AMS (typically about 50 % The size distribution and number of aerosol particles from
), and the fraction of aerosol that bounces off the heater ele- ultrasonic nebulization have been shown to be affected by
ment before vaporizing (the AMS CE). the frequency of the ultrasonic vibration; the properties of
Figure 3 shows the mass measured in the AMS compared the liquid including surface tension, density, and viscosity;
to the mass deposited on the nebulizer for replicate injections and the concentration of the solution (Donnelly et al., 2005;
of four different aqueous solutions of citric acid, ammonium Lang, 1962; Simon et al., 2015). The present application in-
nitrate, ammonium sulfate, and isotopically labeled ammo- volves a relatively dilute solution, so the only parameter that
nium nitrate (NH15 4 NO3 , used later as an internal standard) is likely to vary is the surface tension, by use of different
with concentrations ranging between approximately 0.1 and solvents. Nebulization of solvents with lower surface ten-
0.2 g L−1 for each of the components (but with the same to- sion, such as methanol, led to the ejection of much smaller
Atmos. Meas. Tech., 12, 1659–1671, 2019 www.atmos-meas-tech.net/12/1659/2019/R. E. O’Brien et al.: Small-volume nebulizer 1665
droplets, and consequently substantially higher nebulization
efficiencies (∼ 10 %). However, methanol (and other HPLC-
grade organic solvents) was found to give higher background
signals in the AMS than Milli-Q water, likely due to higher
levels of low-volatility contaminants. This difference was
also observed by Daellenbach et al. (2016); therefore, Milli-
Q water appears to be the ideal solvent to use for most en-
vironmental samples. However, with adequate solvent back-
ground characterization, organic solvents may be optimal
for environmental samples with more non-polar components
(e.g., petroleum or fresh tail pipe emissions).
3.2.2 Internal standards and calibration curves
In Fig. 3, the vertical spread of data points illustrates the vari-
ation in nebulization efficiency from one injection to the next.
This is likely the result of small differences in the droplet
shape or position on the film, leading to differences in how
the droplets are ejected from the surface during aerosol for-
mation. This run-to-run variability in nebulization efficiency,
as well as the lack of a linear correlation between the mass
placed on the film and the mass observed, complicates quan-
tification and necessitates the use of an internal standard to Figure 4. (a) Blank of the Kapton film using 1 g L−1 internal stan-
quantify the concentration of organic species within the orig- dard solution (15 N – ammonium nitrate). (b) Calibration curves
inal sample. In some cases, an inorganic ion that is indepen- made using an internal standard for solutions with three different or-
dently quantified, such as sulfate, can serve as this internal ganic compounds: citric acid, 4-hydroxy-3-methoxy-DL-mandelic
standard (Daellenbach et al., 2016). However, in many cases acid (HMMA), and polyethylene glycol 400 (PEG-400). The error
such an independent measurement is not available; addition- bars are ±1σ for five replicate injections.
ally, some environmental samples may not contain appre-
ciable levels of measurable inorganic species, or else such
species may not be soluble in the solvent of choice (e.g., ionic tions of between 0.5 and 1 g L−1 in order to generate aerosols
species in organic solvents). In these cases, an internal stan- of sufficient size for the AMS. This allows an analysis of any
dard needs to be added to the solution prior to nebulization. trace material present in the blank by creating an aerosol pop-
For use with the AMS, the internal standard must meet ulation to transfer the trace material into the AMS and allows
a number of requirements: it must be non-refractory, solu- for a background subtraction using the internal standard.
ble, unreactive with the other sample components, not al- Figure 4b shows calibration curves with linear re-
ready present in the solution, and easily distinguishable from sponses for three different organic compounds (citric
other species in the sample. For nebulization of samples dis- acid; 4-hydroxy-3-methoxy-DL-mandelic acid, HMMA; and
solved in organic solvents, organic internal standards (e.g., polyethylene glycol 400, PEG-400) at four concentrations
phthalic acid; Chen et al., 2016; Han et al., 2016) meet these using NH15 4 NO3 as the internal standard. For the calibration
requirements. In the present work, which focuses on aqueous curve, the ratios of the AMS signals for the analyte over the
samples only, we use an inorganic internal standard of iso- internal standard are compared to the ratios for known so-
topically labeled ammonium nitrate (NH15 4 NO3 ). An exam- lution concentrations, thus correcting any variations in the
ple mass spectrum for an internal standard solution is shown mass of analyte nebulized. For quantification of unknowns,
in Fig. 4a. The background signal from other components known concentrations of the internal standard are added to
(organic material, sulfate, and nitrate) is very low. Another the samples at ratios comparable to what is used for the cal-
tested option is ammonium iodide (NH4 I). Both of these salts ibration curve. The ratio of the measured AMS signals can
work well as internal standards for both laboratory and am- then be used to calculate the unknown analyte concentration
bient samples since neither 15 NO3 nor iodide is present in from the calibration curve.
appreciable amounts in the atmosphere and there is usually a For quantification of complex organic mixtures using this
very small contribution of organic fragments at the fragment technique, the most accurate organic calibration standards
masses observed for those salts. Typically, the internal stan- will have chemical structures similar to the average structure
dards are added at the same order of magnitude concentration of the mixture. The slope of each line is related to the rela-
as the sample. For all tests of background signals and blanks, tive ionization efficiency (RIE) of the organic compound in
the internal standard is added to the solutions at concentra- the AMS (Jimenez et al., 2003). The RIE values in Fig. 4b for
www.atmos-meas-tech.net/12/1659/2019/ Atmos. Meas. Tech., 12, 1659–1671, 20191666 R. E. O’Brien et al.: Small-volume nebulizer
HMMA and citric acid (1.01 and 1.95, respectively) bracket spectrum averaged over the 10 h of filter collection. For all
the range of RIE values for different types of organics mea- filter samples, spectra from the SVN are background sub-
sured using standard AMS calibration techniques (Jimenez tracted using spectra collected from blank filter samples.
et al., 2016). This range likely arises from differences in how These blanks provide the background for any trace organic
the organic compounds dissociate during volatilization on material on the filters before collection as well as any back-
the heater. The heater in the AMS is typically set at 600 ◦ C, ground organic material introduced during sample prepara-
and so most organic molecules found in organic aerosol ther- tion. The overlap in Fig. 5b between the mass spectra is very
mally decompose prior to electron impact ionization (Cana- good, with a dot product of 0.98 and a log–dot product of
garatna et al., 2015; Jimenez et al., 2016), leading to RIEs in 0.98. The elemental ratios are also very similar between the
the range of 1.0–2.0. In contrast, the slope of 2.62 for PEG- two samples with an H : C of 1.6 for both and O : C of 0.48
400 is substantially outside of the range of values. However, for the chamber and 0.49 for the SVN samples (Table 1). The
with the AMS, complex mixtures are less likely to show large largest difference is observed at m/z 44 (CO+ 2 ) and m/z 43
variations in RIE than different individual compounds, such (C2 H3 O+ ) with a larger fraction of CO+ 2 in the offline sam-
as those used in Fig. 4. For extracts of atmospheric aerosol or ple. The intensity of CO+ (m/z 28) is also different, but
other smaller organic mixtures, the RIE of 1.4, which is typi- only because it is set equal to the intensity of the CO+ 2 ion,
cally used for AMS measurements (Canagaratna et al., 2007; as is commonly done for ambient sampling with the AMS
Jimenez et al., 2016; Xu et al., 2018), is likely the best value (given that the CO+ ion generally cannot be distinguished
to use as an initial calibration slope. For extracts of other from the much more abundant N+ 2 ion). The organic con-
types of organic mixtures, compounds that have a structure tribution from H2 O+ , OH+ , and O+ is also constrained by
similar to the average organic composition should be used to the CO+ +
2 signal so any differences in CO2 intensity will also
calibrate the samples. show up in those ions (Aiken et al., 2008). The observed dif-
ference in CO+ +
2 and C2 H3 O ion intensity is likely a result
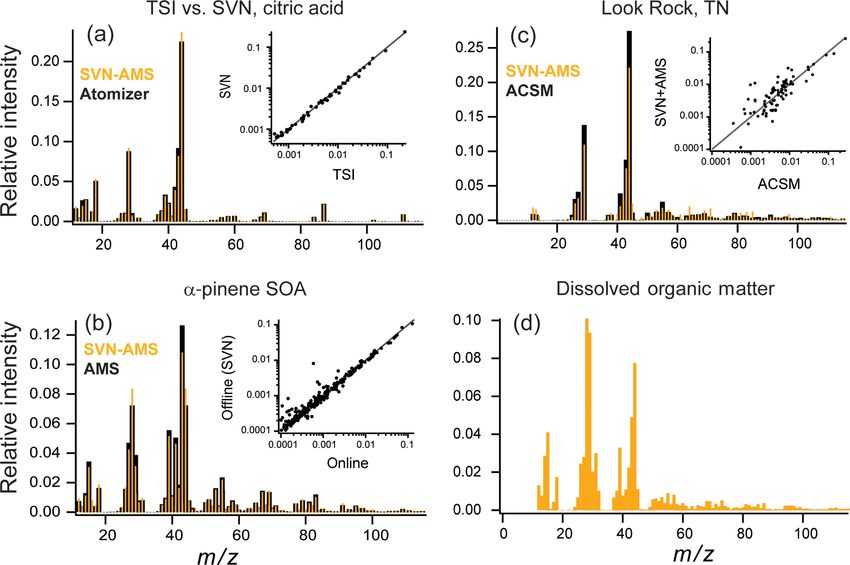
3.3 Mass spectral analysis of the extraction step prior to nebulization, which may pref-
erentially dissolve the most water-soluble (oxidized) SOA
The primary goal of the SVN–AMS is to measure quantita- components. Additionally, the online measurement is for fine
tive chemical information, specifically elemental ratios, from mode aerosol while the offline measurement collects the full
complex organic mixtures. We have characterized these for a range of particle sizes on the filter. However, based on the
number of different chemical systems, described below. Re- agreement in H : C and O : C in the online and offline cases,
sults are summarized in Fig. 5 (comparing SVN–AMS and these factors do not appear to bias elemental ratio measure-
online AMS mass spectra) and Table 1 (comparing elemen- ments substantially.
tal ratios measured with SVN–AMS with those measured by Figure 5c shows a comparison of online and offline mea-
either online AMS or CHNS analysis). surements of ambient organic aerosol, specifically ACSM
One concern with using ultrasonic nebulization to generate measurements and SVN–AMS measurements of a filter
aerosol particles is the possibility that the high temperatures extract collected simultaneously during the 2013 SOAS
possibly reached by the solution during nebulization may field campaign in Look Rock, TN (20:00 EST, 4 July to
degrade the organic compounds, affecting their mass spec- 07:00 EST, 5 July 2013). Since the ACSM is a unit-mass-
tra (and hence measured elemental composition). Figure 5a resolution instrument, the HR-AMS data are degraded to
shows a comparison of a solution containing 1 g L−1 of cit- unit mass resolution, and ions that are determined from the
ric acid aerosolized with a TSI atomizer (TSI 3076, 276 kPa m/z 44 signal (m/z = 15, 16, 17, 18, and 28) are excluded
gas) (black) and the SVN (gold), with the inset showing a from the analysis. Additionally, ions at m/z 30 and 31 were
direct comparison among the intensities measured for each removed from comparison because of interferences from the
ion in the mass spectrum. The degree of agreement can be internal standard (m/z 31) and nitrate in the sample (m/z 30).
described by the dot product of the intensities for matching The two mass spectra in Fig. 5c have a high degree of
peaks in the two spectra, as well as the log of the intensities agreement between the major ions (dot product of 0.98).
before taking the dot product (log–dot product), which gives However, there is substantially more variation among the
the lower-intensity peaks greater weight. Very good overlap two techniques than in the chamber study, especially in the
between the two mass spectra is observed, with a dot product lower-abundance peaks (m/z > 45; see inset), as reflected in
of 0.99 and a log–dot product of 0.96. This indicates minimal the lower log–dot product of only 0.90. Possible reasons for
degradation of the citric acid by ultrasonic nebulization. this lower correlation include fractionation from the extrac-
A high degree of similarity is also observed between of- tion step, the different sizes measured (PM2.5 for the filter
fline and online aerosol measurements for more complex vs. fine mode aerosol for the ACSM) (Daellenbach et al.,
mixtures. Figure 5b shows mass spectra for a comparison of 2016), the uncertainty in ACSM signals at higher masses due
offline (gold) vs. online (black) secondary organic aerosol to uncertainty in the relative ion transmission curve (Ng et
(SOA), generated from the dark ozonolysis of α-pinene. The al., 2011a), and the losses of relatively volatile compounds
online mass spectra are the average real-time AMS mass during collection, extraction, and handling. Additional work
Atmos. Meas. Tech., 12, 1659–1671, 2019 www.atmos-meas-tech.net/12/1659/2019/R. E. O’Brien et al.: Small-volume nebulizer 1667
Figure 5. Online (or TSI atomizer) (black) vs. SVN nebulizer (orange) mass spectra for (a) an aqueous solution of citric acid at 1 g L−1 ,
(b) α-pinene + O3 chamber SOA, and (c) a SOAS campaign sample from Look Rock, TN, with online data collected on an ACSM. Smaller
insets in (a), (b), and (c) show direct comparison of intensities for each mass spectrum on a log scale. (d) AMS mass spectra from North
Pacific Ocean dissolved organic matter (polysaccharide fraction) nebulized with the SVN (since this sample was not from aerosol particles,
no online samples are available).
Table 1. Elemental ratios measured by SVN–AMS vs. other techniques for the various mixtures examined in this work.
Sample O:C H:C N:C
Atomizer AMS 1.0 1.4 –
Citric acid SVN–AMS 1.1 1.3 –
Actual 1.2 1.3 –
Online AMS 0.48 1.6 < 0.002
α-pinene SOA
SVN–AMS 0.50 1.6 < 0.002
Online ACSMa 0.13 (f44 = 0.19) 1.3 (f43 = 0.062) –b
Look Rock
SVN–AMSa 0.13 (f44 = 0.16) 1.3 (f43 = 0.051) –b
CHNS analyzer ND 1.74 0.080
DOM
SVN–AMS 0.77 1.7 0.081
a Elemental ratios are estimated from parameterizations for f and f (Aiken et al., 2008; Ng et al., 2011b). b
44 43
There is no established method for determining N : C from unit mass resolution (UMR) data.
is necessary to quantify the importance of these effects, and ble 1). However, the estimated elemental ratios from a lower-
care should be taken when comparing the full mass spec- resolution AMS are more uncertain than from the HR-ToF-
tra for online compared to offline SVN–AMS analysis. The AMS. Thus, the ratios for these samples in Table 1 are pro-
high degree of overlap in the intensities of the dominant vided only as a demonstration of the overall agreement be-
ions between the online (AMS and ACSM) measurements tween the two techniques.
and offline (SVN–AMS) results indicates that the ensem- For the SVN, the small sample volume requirements can
ble organic composition for these aerosol samples is gener- make it attractive for the analysis of other environmental
ally well-represented by the SVN–AMS measurements (Ta- samples that are soluble in water (or organic solvents) and
www.atmos-meas-tech.net/12/1659/2019/ Atmos. Meas. Tech., 12, 1659–1671, 20191668 R. E. O’Brien et al.: Small-volume nebulizer
that have low enough vapor pressures to remain in the con- lower sample mass requirements. The use of organic inter-
densed phase after sample preparation and nebulization. Here nal standards is one method to potentially improve collec-
we demonstrate the analysis of the high-molecular-weight tion efficiency in the AMS as the higher organic content may
fraction of the polysaccharide fraction of dissolved organic decrease the bounce of particles off the vaporizer. Addition-
matter (DOM) with the SVN–AMS. The DOM sample was ally, the use of solvents with a lower surface tension than
prepared using a standard protocol for the isolation of this water shows promise for improved nebulization efficiencies.
fraction of the organic material (see Sect. 2.3). This prepa- Finally, in contrast to atomizers (in which the carrier gas gen-
ration removes the lower-molecular-weight compounds so erates the aerosol), ultrasonic nebulizers decouple the aerosol
chemicals such as methane sulfonic acid are not expected to formation from the carrier gas flow rate, enabling poten-
be observed. Figure 5d shows an example AMS mass spec- tial concentration of the aerosol prior to sampling. A use-
trum from DOM collected from the Pacific Ocean. The mass ful future direction for this technique will be to character-
spectrum is dominated by oxidized fragments containing one ize the background signal in different organic solvents and
or more oxygen atoms with smaller amounts of nitrogen- optimize the continuous-flow configuration to minimize the
containing fragments. The sample preparation for the DOM return of large ejected droplets back onto the film. Continu-
removed all salts; thus the ammonium fragments were as- ous flow with organic solutions will also enable the analysis
sumed to be from organonitrogen species and were assigned of more hydrophobic organic samples such as fresh vehicle
to the organic fraction. The measured N : C and H : C val- emissions, cooking oils, and petrochemical samples. In the
ues of 0.081 and 1.7, respectively, match those measured by future, the SVN can be used to generate aerosol for quantita-
CHNS analysis (0.080 and 1.74, respectively). This demon- tive and qualitative analysis of other environmental samples
strates that with the SVN, microgram quantities of dissolved to investigate sources or processing and aging of these or-
environmental mixtures can be nebulized and sampled into ganic mixtures. The SVN, combined with aerosol measure-
the AMS, providing a rapid, quantitative method to deter- ment techniques such as the AMS, provides a rapid, quan-
mine elemental ratios in these complex organic mixtures. titative method to characterize the chemical and elemental
properties of complex organic mixtures, producing rich data
sets for the exploration of exceptionally trace environmental
4 Conclusions samples.
A new ultrasonic nebulizer has been described and charac-
terized for generation of aerosol from very small sample Data availability. All data sets including mass spectra and SMPS
masses. We demonstrate the application of this technique data are available on request from Rachel E. O’Brien, reo-
to offline-AMS analysis of complex organic mixtures from brien@wm.edu.
aerosol filter extracts and DOM. Data sets that include quan-
titative organic mass, characteristic mass spectra, and quan-
titative elemental ratios can be generated from only 0.4 to Supplement. The document contains additional informa-
tion on particle sizes and memory effects between runs.
1.2 µg of material. For these samples, pre-concentration was
The supplement related to this article is available online
required to prepare a suitable solution concentration for anal- at: https://doi.org/10.5194/amt-12-1659-2019-supplement.
ysis. This will be required for some types of environmen-
tal samples and care should be taken to minimize artifacts
during solution preparation. A direct comparison between Author contributions. MRC, JTJ, PLC, DRW, JHK, and KJR de-
the mass spectra generated by commercial spray atomizers signed and built the SVN. SHB, JDS, CLF, and DJR provided am-
and particles sampled directly from the atmosphere showed bient aerosol samples and DOM. REO and JHK designed experi-
high degrees of agreement, indicating minimal composition ments and REO carried them out. REO and JHK prepared the paper
changes during sample preparation and nebulization. Neb- with contributions from all authors.
ulization of aqueous samples generated measurable aerosol
from 0.1 % of the sample mass. Higher nebulization effi-
ciencies (and smaller ejected droplets) were observed for Competing interests. The authors declare that they have no conflict
methanol, likely due to its lower surface tension. The SVN, of interest.
combined with the offline AMS, provides rapid analysis of
non-refractory organic and inorganic compounds. For other
types of characterization, including analysis of refractory Acknowledgements. This work was supported by National Oceanic
material or organic molecular composition, the SVN can and Atmospheric Administration grant nos. NA13OAR4310072
and NA140AR4310132. Kelsey J. Ridley acknowledges support
also be coupled with other aerosol instrumentation such as
from the NSF Graduate Research Fellowship Program. Sri Hapsari
PALMS or CIMS. Budisulistiorini and Jason D. Surratt acknowledges support from
Future improvements in the nebulization and collection ef- the U.S. Environmental Protection Agency award no. 835404, Elec-
ficiency of the SVN–AMS will enable analysis with even
Atmos. Meas. Tech., 12, 1659–1671, 2019 www.atmos-meas-tech.net/12/1659/2019/R. E. O’Brien et al.: Small-volume nebulizer 1669
tric Power Research Institute (EPRI), and National Oceanic and Canagaratna, M. R., Jayne, J. T., Jimenez, J. L., Allan, J. D.,
Atmospheric Administration grant no. NA13OAR4310064. Special Alfarra, M. R., Zhang, Q., Onasch, T. B., Drewnick, F., Coe,
thanks are due to David Karl and Eric Grabowski, University of H., Middlebrook, A., Delia, A., Williams, L. R., Trimborn,
Hawaii, for the CHNS elemental analysis of DOM. Daniel J. Repeta A. M., Northway, M. J., Decarlo, P. F., Kolb, C. E., Davi-
acknowledges support from the Gordan and Betty Moore Founda- dovits, P., and Worsnop, D. R.: Chemical and Microphysi-
tion award 6000 and the Simons Foundation SCOPE award 329108. cal Characterization of Ambient Aerosols with the Aerodyne
Aerosol Mass Spectrometer, Mass Spec. Rev., 26, 185–222,
https://doi.org/10.1002/mas.20115, 2007.
Review statement. This paper was edited by Keding Lu and re- Canagaratna, M. R., Jimenez, J. L., Kroll, J. H., Chen, Q., Kessler,
viewed by four anonymous referees. S. H., Massoli, P., Hildebrandt Ruiz, L., Fortner, E., Williams, L.
R., Wilson, K. R., Surratt, J. D., Donahue, N. M., Jayne, J. T.,
and Worsnop, D. R.: Elemental ratio measurements of organic
compounds using aerosol mass spectrometry: characterization,
References improved calibration, and implications, Atmos. Chem. Phys., 15,
253–272, https://doi.org/10.5194/acp-15-253-2015, 2015.
Aiken, A. C., DeCarlo, P. F., and Jimenez, J. L.: Elemen- Chen, Q., Heald, C. L., Jimenez, J. L., Canagaratna, M. R.,
tal analysis of organic species with electron ionization high- Zhang, Q., He, L.-Y., Huang, X.-F., Campuzano-Jost, P., Palm,
resolution mass spectrometry, Anal. Chem., 79, 8350–8358, B. B., Poulain, L., Kuwata, M., Martin, S. T., Abbatt, J.
https://doi.org/10.1021/ac071150w, 2007. P. D., Lee, A. K. Y., and Liggio, J.: Elemental composi-
Aiken, A. C., Decarlo, P. F., Kroll, J. H., Worsnop, D. R., Huff- tion of organic aerosol: The gap between ambient and lab-
man, J. A., Docherty, K. S., Ulbrich, I. M., Mohr, C., Kim- oratory measurements, Geophys. Res. Lett., 42, 4182–4189,
mel, J. R., Sueper, D., Sun, Y., Zhang, Q., Trimborn, A., https://doi.org/10.1002/2015GL063693, 2015.
Northway, M., Ziemann, P. J., Canagaratna, M. R., Onasch, T. Chen, Q., Ikemori, F., and Mochida, M.: Light Absorp-
B., Alfarra, M. R., Prevot, A. S. H., Dommen, J., Duplissy, tion and Excitation-Emission Fluorescence of Urban Or-
J., Metzger, A., Balensperger, U., and Jimenez, J. L.: O/C ganic Aerosol Components and Their Relationship to Chem-
and OM/OC Ratios of Primary, Secondary, and Ambient Or- ical Structure, Environ. Sci. Technol., 50, 10859–10868,
ganic Aerosols with High-Resolution Time-of-Flight Aerosol https://doi.org/10.1021/acs.est.6b02541, 2016.
Mass Spectrometry, Environ. Sci. Technol., 42, 4478–4485, Daellenbach, K. R., Bozzetti, C., Krepelová, A., Canonaco, F.,
https://doi.org/10.1021/es703009q, 2008. Wolf, R., Zotter, P., Fermo, P., Crippa, M., Slowik, J. G., Sose-
Becker, J. W., Berube, P. M., Follett, C. L., Waterbury, J. B., dova, Y., Zhang, Y., Huang, R.-J., Poulain, L., Szidat, S., Bal-
Chisholm, S. W., Delong, E. F., Repeta, D. J., and Metz, tensperger, U., El Haddad, I., and Prévôt, A. S. H.: Character-
T.: Closely related phytoplankton species produce similar ization and source apportionment of organic aerosol using of-
suites of dissolved organic matter, Front. Microbiol., 5, 1–14, fline aerosol mass spectrometry, Atmos. Meas. Tech., 9, 23–39,
https://doi.org/10.3389/fmicb.2014.00111, 2014. https://doi.org/10.5194/amt-9-23-2016, 2016.
Bozzetti, C., Daellenbach, K. R., Hueglin, C., Fermo, P., Sciare, Daumit, K. E., Kessler, S. H., and Kroll, J. H.: Average chem-
J., Kasper-Giebl, A., Mazar, Y., Abbaszade, L., El Kazzi, M., ical properties and potential formation pathways of highly
Gonzalez, R., Shuster-Meiseles, T., Flasch, M., Wolf, R., Kr, oxidized organic aerosol, Farady Discuss., 165, 181–201,
A., Francesco Canonaco, E., Schnelle-Kreis, R., Slowik, J. G., https://doi.org/10.1039/c3fd00045a, 2013.
Zimmermann, R., Rudich, Y., Baltensperger, U., El Haddad, I., Decarlo, P. F., Kimmel, J. R., Trimborn, A., Northway,
and Preo, A. H.: Size-Resolved Identification, Characterization, M. J., Jayne, J. T., Aiken, A. C., Gonin, M., Fuhrer,
and Quantification of Primary Biological Organic Aerosol at a K., Horvath, T., Docherty, K. S., Worsnop, D. R., and
European Rural Site, Environ. Sci. Technol., 50, 3425–3434, Jimenez, J. L.: Field-Depolyable, High-Resolution, Time-of-
https://doi.org/10.1021/acs.est.5b05960, 2016. Flight Aerosol Mass Spectrometer, Anal. Chem., 78, 8281–8289,
Bozzetti, C., Sosedova, Y., Xiao, M., Daellenbach, K. R., Ulevi- doi:8410.1029/2001JD001213.Analytical, 2006.
cius, V., Dudoitis, V., Mordas, G., Bycenkiene, S., Plauškaite, Docherty, K. S., Jaoui, M., Corse, E., Jimenez, J. L., Offen-
K., Vlachou, A., Golly, B., Chazeau, B., Besombes, J.-L., Bal- berg, J. H., Lewandowski, M., and Kleindienst, T. E.: Collec-
tensperger, U., Jaffrezo, J.-L., Slowik, J. G., El Haddad, I., and tion Efficiency of the Aerosol Mass Spectrometer for Chamber-
Prévôt, A. S. H.: Argon offline-AMS source apportionment of Generated Secondary Organic Aerosols, Aerosol Sci. Technol.,
organic aerosol over yearly cycles for an urban, rural, and ma- 47, 294–309, https://doi.org/10.1080/02786826.2012.752572,
rine site in northern Europe, Atmos. Chem. Phys., 17, 117–141, 2013.
https://doi.org/10.5194/acp-17-117-2017, 2017. Donnelly, T. D., Hogan, J., Mugler, A., Schubmehl, M.,
Budisulistiorini, S. H., Li, X., Bairai, S. T., Renfro, J., Liu, Y., Schommer, N., Bernoff, A. J., Dasnurkar, S., and Dit-
Liu, Y. J., McKinney, K. A., Martin, S. T., McNeill, V. F., Pye, mire, T.: Using ultrasonic atomization to produce an aerosol
H. O. T., Nenes, A., Neff, M. E., Stone, E. A., Mueller, S., of micron-scale particles, Rev. Sci. Instrum., 76, 1–10,
Knote, C., Shaw, S. L., Zhang, Z., Gold, A., and Surratt, J. D.: https://doi.org/10.1063/1.2130336, 2005.
Examining the effects of anthropogenic emissions on isoprene- Gallimore, P. J. and Kalberer, M.: Characterizing an Extractive
derived secondary organic aerosol formation during the 2013 Electrospray Ionization (EESI) Source for the Online Mass Spec-
Southern Oxidant and Aerosol Study (SOAS) at the Look Rock, trometry Analysis of Organic Aerosols, Environ. Sci. Technol.,
Tennessee ground site, Atmos. Chem. Phys., 15, 8871–8888, 47, 734–7331, https://doi.org/10.1021/es305199h, 2013.
https://doi.org/10.5194/acp-15-8871-2015, 2015.
www.atmos-meas-tech.net/12/1659/2019/ Atmos. Meas. Tech., 12, 1659–1671, 2019You can also read