Computational 4D OCM for label free imaging of collective cell invasion and force mediated deformations in collagen - Nature
←
→
Page content transcription
If your browser does not render page correctly, please read the page content below
www.nature.com/scientificreports
OPEN Computational 4D‑OCM
for label‑free imaging of collective
cell invasion and force‑mediated
deformations in collagen
Jeffrey A. Mulligan1,2, Lu Ling2, Nichaluk Leartprapun2, Claudia Fischbach2,3 &
Steven G. Adie2*
Traction force microscopy (TFM) is an important family of techniques used to measure and study the
role of cellular traction forces (CTFs) associated with many biological processes. However, current
standard TFM methods rely on imaging techniques that do not provide the experimental capabilities
necessary to study CTFs within 3D collective and dynamic systems embedded within optically
scattering media. Traction force optical coherence microscopy (TF-OCM) was developed to address
these needs, but has only been demonstrated for the study of isolated cells embedded within optically
clear media. Here, we present computational 4D-OCM methods that enable the study of dynamic
invasion behavior of large tumor spheroids embedded in collagen. Our multi-day, time-lapse imaging
data provided detailed visualizations of evolving spheroid morphology, collagen degradation, and
collagen deformation, all using label-free scattering contrast. These capabilities, which provided
insights into how stromal cells affect cancer progression, significantly expand access to critical data
about biophysical interactions of cells with their environment, and lay the foundation for future efforts
toward volumetric, time-lapse reconstructions of collective CTFs with TF-OCM.
Cellular traction forces (CTFs) play a critical role in both physiological and pathological tissue remodeling
processes, including a ngiogenesis1,2, collective m
igration3–5, and cancer m
etastasis6,7, and can vary as a function
of extracellular matrix (ECM) remodeling and cellular phenotype. For example, compositional or structural
changes of the ECM change the CTFs that cells exert upon the surrounding m atrix8, and these changes in CTFs,
in turn, alter cellular mechanosignaling, which reciprocally modulates CTFs9. Traction force microscopy (TFM)
is a diverse family of techniques used to quantify and study the CTFs that cells exert upon the E CM10–12. Spe-
cifically, TFM reconstructs CTFs from optical measurements of CTF-induced ECM deformations using ECM
rheological data and a suitable mechanical model. By providing measurements of both CTFs and CTF-induced
ECM deformations, TFM serves as an important tool for studying the biophysical interactions of cells with the
ECM (e.g., forces, degradation, and remodeling) and the role that these interactions play within the broader field
of mechanobiology13. Consequently, there is an ongoing demand for the development of novel TFM capabilities
that satisfy the evolving needs of mechanobiology to investigate CTF dynamics within complex ECM substrates.
There are substantial gaps between the capabilities of current standard TFM technologies and modern
research needs. For example, the vast majority of TFM techniques are limited to the study of 2D cell culture
models14–19. However, since cells can exhibit drastically different phenotypes in 2D versus 3D environments13,20–23,
3D TFM techniques are crucial for studying cells under physiologically relevant 3D conditions. Although 3D
TFM methods have been developed in response to this need24–28, the confocal microscopy paradigm which
these techniques rely upon restricts their capabilities. In particular, a limited penetration depth (of a few hun-
dred micrometers in optically scattering media) hinders the study of either deeply embedded cells or extended
multicellular collectives within scattering substrates. Photobleaching and/or phototoxicity impede long-term
observations of dynamic interactions and feedback between CTFs and ECM remodeling (and thereby limit 3D
TFM studies to endpoint observations and/or brief/sparse time-sequences)18,28. These concurrent limitations have
culminated in a lack of readily available TFM technologies which simultaneously enable the study of 3D, collec-
tive, and dynamic cell behaviors within optically scattering media. As a consequence, TFM research continues to
1
School of Electrical and Computer Engineering, Cornell University, Ithaca, NY 14853, USA. 2Nancy E. and Peter
C. Meinig School of Biomedical Engineering, Cornell University, Ithaca, NY 14853, USA. 3Kavli Institute at Cornell
for Nanoscale Science, Cornell University, Ithaca, NY 14853, USA. *email: sga42@cornell.edu
Scientific Reports | (2021) 11:2814 | https://doi.org/10.1038/s41598-021-81470-7 1
Vol.:(0123456789)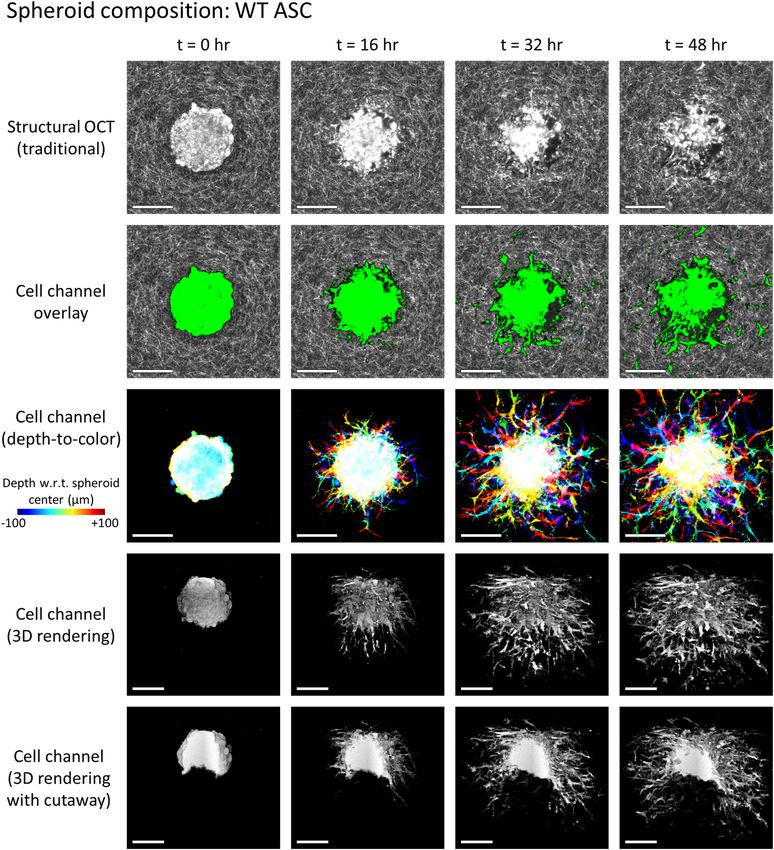
www.nature.com/scientificreports/
employ cell culture models (e.g., 2D instead of 3D) which can differ markedly from the systems that researchers
seek to u nderstand5. This has created a significant opportunity for new TFM techniques to enable experiments
that are impractical or impossible with current standard methods.
In order to meet the growing demand for TFM methods which enable the study of 3D, collective, and dynamic
behaviors, we recently developed traction force optical coherence microscopy (TF-OCM)29,30. This technique
leverages optical coherence microscopy (OCM) to provide rapid, label-free, volumetric imaging within optically
scattering media. As a result, the technique is well-suited to both rapid and long-term 3D time-lapse imaging
with numerous exposures (since photobleaching and photoxicity are not of concern due to a lack of fluorescent
labels and a low incident power, < 5 mW). Furthermore, the use of near-infrared light and coherence gating
enables imaging deep within scattering media, such as collagen or other biopolymer substrates (up to 1 mm
and deeper). As a result, TF-OCM is a promising candidate to perform studies of 3D, collective, and dynamic
systems within physiologically relevant substrates. However, TF-OCM has only been demonstrated for the study
of isolated cells within optically clear (Matrigel) substrates29,30.
Here, we report on the use of 4D-OCM imaging and data processing methods (henceforth referred to as
‘computational 4D-OCM’) to study the invasion of tumor spheroids embedded within optically scattering 3D
collagen substrates over long periods of time. Spheroids consisting of premalignant tumor cells and/or stromal
cells were fabricated and embedded into dense collagen matrices (6 mg/mL) to mimic cellular interactions with
a surrounding fibrotic ECM characteristic of tumors. Subsequently, collective tumor cell and/or stromal cell
invasion into the surrounding collagen and corresponding ECM remodeling were monitored over 2 days using
a 40-min imaging interval. In order to obtain m m3-scale volumetric images with high spatial resolution and
minimal distortions, we developed and employed a novel OCM system design in combination with a refined set
of numerical image formation techniques which together provided the spatial coverage and resolution required
for these new experimental conditions. Importantly, by leveraging the label-free and long-term imaging capa-
bilities of our OCM system, we were able to measure time-varying 3D displacement fields within the collagen
substrate(s) without the use of either fiducial marker beads or contractility inhibiting reagents, since such addi-
tives (although ubiquitous in standard TFM methods) may alter cell behavior and/or preclude long-term, con-
tinuous observation of individual spheroid systems. One example of the potential impact of the methods reported
here can be found in our recently published study31 that investigated the role of stromal cells in CTF-dependent
collective tumor cell invasion under clinically relevant conditions. As a result, computational 4D-OCM has been
demonstrated to be a promising technique for the study of biophysical cell-ECM interactions and collective cell
behavior in physiologically relevant model systems. These developments provide a critical foundation for enabling
future work toward time-lapse reconstructions of collective CTFs with TF-OCM.
Results
Overview of experiments, context, and findings. In this study, spheroids (consisting of
5–10 × 103 cells) were embedded in dense 3D collagen matrices (6 mg/mL). Upon completion of this embedding,
time-lapse imaging was begun immediately in order to monitor all subsequent spheroid invasion and collagen
deformation/remodeling via our computational 4D-OCM imaging methods (detailed in the “Methods” section).
Imaging was performed at 40-min intervals for a total duration of 2 days, after which custom data processing
routines (detailed in the “Methods” section and Supplementary Note 3) were used to reconstruct 4D image
data and visualize/quantify the biophysical interactions between cell collectives and 3D collagen substrates. Our
computational 4D-OCM methods (and subsequent data visualizations) for imaging cell invasion and collagen
deformation/remodeling are detailed in the remaining sections of this manuscript, whereas biological findings
arising from the application of these methods to study the role of obesity-associated adipose stromal cells (ASCs)
in cancer progression can be found in a companion paper31.
Computational 4D-OCM imaging of biophysical cell-ECM interactions was used to study multiple spheroids
of differing compositions, consisting of monocultures and/or co-cultures of both tumor cells and/or ASCs. In
particular, tumor cells were modeled using MCF10AT1 cells, a premalignant human breast epithelial cell line.
Tumor spheroids consisting of these cells (in monoculture) do not typically invade dense collagen matrices such
as those used h ere31. ASCs, on the other hand, can be used to form highly invasive spheroids (e.g., as in Fig. 1)
and have previously been shown to promote malignant behavior in tumor cells, including increased proliferation
and migration32. In this study, two types of (murine) ASCs were used, derived from subcutaneous fat of both lean
(wildtype, WT) and obese (ob/ob) mice, respectively. In Ref.31, it was shown (using our computational 4D-OCM
methods) that while both WT and ob/ob ASCs were highly motile/invasive, ob/ob ASCs induced greater ECM
deformations both in monoculture and co-culture (with MCF10AT1 cells) than their WT counterparts. (Please
refer to Ref.31 for additional data and quantitative comparisons regarding these findings).
In the sections that follow, we highlight the imaging capabilities provided by our computational 4D-OCM
methods and provide details regarding the underlying imaging methods and data processing routines. In particu-
lar, we demonstrate the 4D label-free visualization of spheroids and their invasion into the surrounding collagen
(Figs. 1, 2). This visualization is greatly enhanced by the segmentation of cells from the collagen substrate, which
was achieved using only temporal fluctuations of backscattered optical signals. We further visualize remodeling
of the collagen substrate, in the form of both degradation (Fig. 3) and CTF-induced deformation (Fig. 4), without
the addition of any labels or fiducial marker beads to the substrate medium. Together, these data, which could not
otherwise be obtained through more conventional confocal fluorescence and/or reflectance microscopy-based
techniques, were used to make essential contributions to the study detailed in Ref.31. Specifically, quantitative
comparisons of differing spheroid invasion and ECM remodeling behaviors (not shown here) may be found
in the manuscript for that study31. These findings and contributions demonstrate the utility of computational
4D-OCM for making novel contributions to mechanobiology research.
Scientific Reports | (2021) 11:2814 | https://doi.org/10.1038/s41598-021-81470-7 2
Vol:.(1234567890)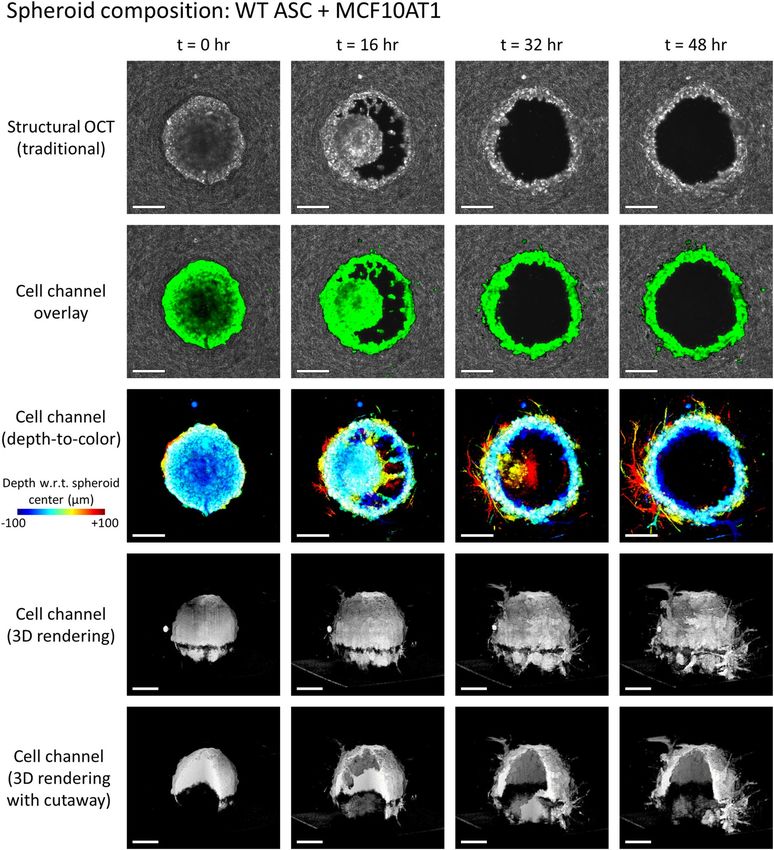
www.nature.com/scientificreports/
Figure 1. Invasion of a WT ASC monoculture spheroid into the surrounding collagen substrate, revealed via
label-free OCM imaging and temporal speckle contrast. Traditional OCM imaging (top row) records scattering
signals of cells and collagen alike. Temporal speckle contrast enables segmentation of volumetric data into
synthetic ‘cell’ and ‘collagen’ channels (rows 2–5). Scale bars = 200 µm. See text for details. Time-lapse animation
is available in Supplementary Video 1.
Temporal speckle contrast enables label‑free, 4D visualization of spheroid invasion behavior
in collagen. One challenge of using label-free imaging (as is the case with OCM) is to identify the boundary
between cells and the surrounding collagen substrate. In order to address this challenge, we leveraged a ‘burst’
imaging protocol similar to our previously reported TF-OCM methods30. For each time-point in a given time-
lapse experiment, a ‘burst’ of nine volumetric images was acquired in rapid succession. Due to the short time
period (~ 12–15 s) between individual acquisitions in a given ‘burst’, the observed speckle pattern from (quasi-
static) collagen fibers remained practically constant. In contrast, the observed speckle pattern from cells exhib-
Scientific Reports | (2021) 11:2814 | https://doi.org/10.1038/s41598-021-81470-7 3
Vol.:(0123456789)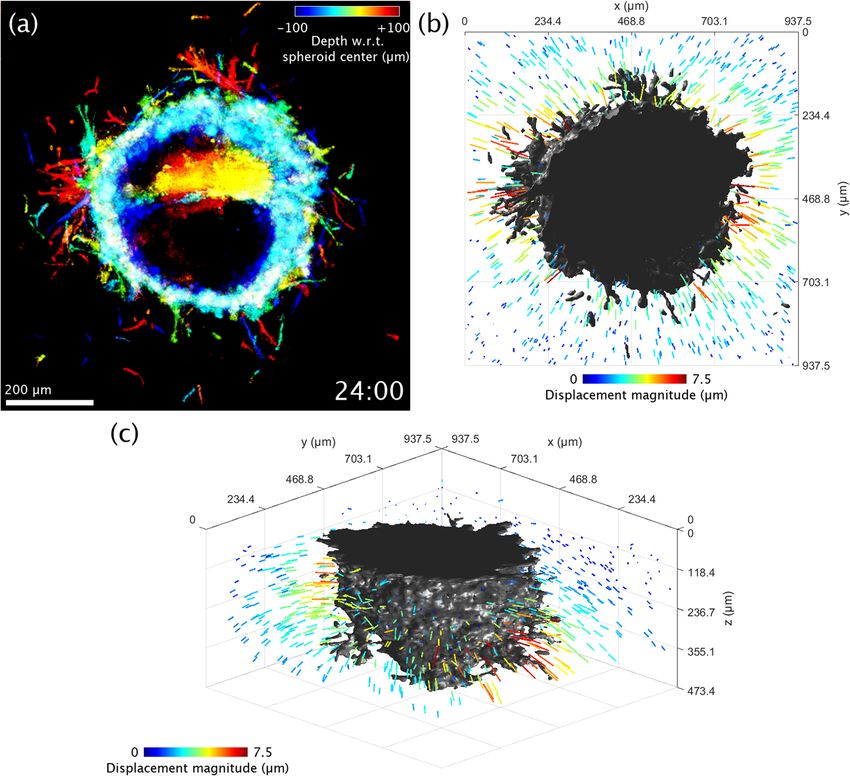
www.nature.com/scientificreports/
Figure 2. Invasion of a WT ASC + MCF10AT1 co-culture spheroid into the surrounding collagen substrate,
revealed via label-free OCM imaging and temporal speckle contrast. Traditional OCM imaging (top row)
records scattering signals of cells and collagen alike. Temporal speckle contrast enables segmentation of
volumetric data into synthetic ‘cell’ and ‘collagen’ channels (rows 2–5). Scale bars = 200 µm. See text for details.
Time-lapse animation is available in Supplementary Video 2.
ited substantial variation between acquisitions, due to the rapid motion of intracellular components. In order
to take advantage of this temporal speckle contrast, the images of a given ‘burst’ were combined into a single
volumetric image via a ‘standard deviation projection’ operation, as defined by Eq. (2) in the “Methods” section.
The resulting image(s) exhibited strong/enhanced contrast in regions with temporally unstable speckle patterns,
and weak/suppressed contrast in regions with temporally stable speckle patterns, consistent with similar existing
methods30,33,34. This enabled the generation of two synthetic ‘channels’ from otherwise label-free OCM image
data: (1) A ‘cell’ channel which strongly correlates to live/active cells and (2) a ‘collagen’ channel which strongly
Scientific Reports | (2021) 11:2814 | https://doi.org/10.1038/s41598-021-81470-7 4
Vol:.(1234567890)www.nature.com/scientificreports/
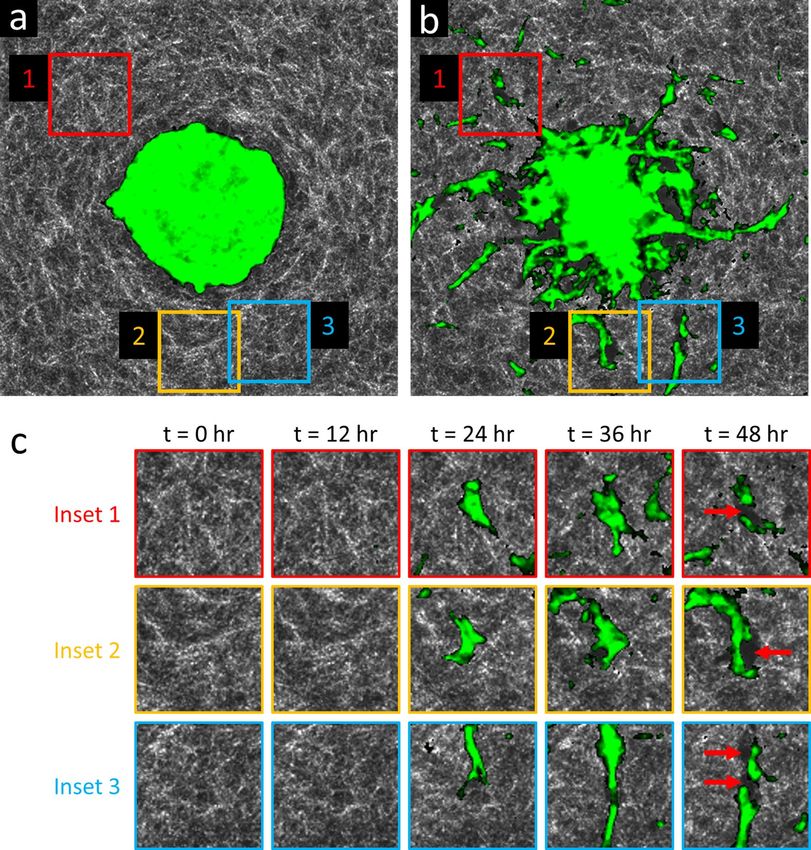
Figure 3. Time-lapse OCM imaging reveals collagen degradation by invasive cells and strands of cells. (a) En
face plane intersecting the center (i.e., the ‘equator’) of a lean (WT) ASC monoculture spheroid, acquired at time
t = 0 h. The spheroid (green, highlighted via temporal speckle contrast) is recently embedded, and has not yet
invaded the surrounding collagen (white). (b) The same en face plane as in (a), acquired at time t = 48 h. Invasive
protrusions are abundant. Large dark regions surrounding the spheroid and invasive strands correspond to
‘voids’ with low/weak scattering signals, suggesting a lack of either cells or collagen. (c) Time-lapse view of
insets 1–3 from (a,b). Red arrows at time t = 48 h indicate newly formed ‘void’ regions where only collagen was
initially present. These new ‘voids’ are likely due to degradation of the collagen matrix by invasive strands via
matrix metalloproteinase activity. (a,b) span a 750 × 750 μm2 lateral FOV. Time-lapse animation is available in
Supplementary Video 3.
correlates to nonliving/static collagen. (Quotes are used here to signify that the correspondence of a given signal
to actual cells and/or collagen lacks the direct specificity of fluorescent labels. Qualitative and quantitative com-
parisons of our temporal speckle contrast technique versus conventional confocal fluorescence microscopy can
be found in Supplementary Note 6).
Representative results of this process are depicted in Figs. 1 and 2. Row 1 (structural OCT) shows standard
label-free OCM images, corresponding to en face planes which intersect the center (i.e., the ‘equator’) of the given
spheroid. Although it may be easy to distinguish the spheroid from the surrounding collagen by eye at time t = 0,
the distinction becomes less clear as time (and spheroid invasion) progresses, especially in Fig. 1. However, in
row 2 (cell channel overlay), a clear picture of invasion activity is obtained via false-color ‘labeling’ of regions
with high temporal speckle contrast. By extension, the 3D structure of the invading spheroids is revealed by the
synthetic ‘cell’ channel (rows 3–5). Row 3 depicts a top-down view of this ‘cell’ channel, wherein each depth in
Scientific Reports | (2021) 11:2814 | https://doi.org/10.1038/s41598-021-81470-7 5
Vol.:(0123456789)www.nature.com/scientificreports/
Figure 4. Visualization of 3D collagen displacements in the vicinity of an obese (ob/ob) ASC + MCF10AT1
co-culture spheroid at time t = 24 h. (a) Top-down view of the spheroid, using the same depth-to-color
projection as in row 3 of Figs. 1 and 2. (b) Top-down rendering of the spheroid (shown in gray) accompanied
by colored arrows which indicate displacement of the collagen matrix as measured with respect to its initial
configuration at time t = 0 h. Arrow lengths have been exaggerated for visualization purposes. (c) Re-rendering
of (b) from an isometric viewing angle. The flat surface of the spheroid corresponds to a region where the
spheroid comes into contact with the coverslip bottom of the petri dish. Time-lapse animation is available in
Supplementary Video 4.
the image is assigned a unique color based on its distance from the plane shown in rows 1 and 2, and the final
image is obtained via a maximum intensity projection of each color channel along the depth axis. Rows 4 and 5
depict 3D renderings of the ‘cell channel’, where row 4 shows the surface of the spheroid from an isometric view-
ing angle, and row 5 shows a ‘cutaway’ which reveals the interior structure of the spheroid. The wildtype (WT,
lean) ASC monoculture spheroid in Fig. 1 retains a solid/confluent internal structure over time, whereas the WT
ASC + MCF10AT1 co-culture spheroid in Fig. 2 exhibits a central ‘core’ of cells which detached from the exterior
‘shell’ and migrated along the depth axis until it was no longer visible to the imaging system. The presence of these
distinct structures in the co-culture spheroid is consistent with histology, such as that shown in Fig. S1 of Ref.31.
Label‑free scattering contrast provides visualization of collagen degradation. In addition to
the ‘cell’ and ‘collagen’ channels discussed above, we also observed a third feature in the image data: ‘voids’.
These regions of low scattering signal correspond to one of two features: (1) areas which cells initially occu-
pied but vacated over time, leaving behind fluid-filled spaces and cavities, or (2) areas in the collagen substrate
which have been degraded by invading cells (and are not currently occupied by cells). Both of these features
are depicted in Fig. 3, with Fig. 3c highlighting regions of newly degraded collagen, in particular. The ability to
identify these modifications to the collagen substrate is potentially useful for studying the mechanisms underly-
ing the collective invasion process31. Unfortunately, these regions are also (currently) prohibitive to conducting
Scientific Reports | (2021) 11:2814 | https://doi.org/10.1038/s41598-021-81470-7 6
Vol:.(1234567890)www.nature.com/scientificreports/
quantitative CTF reconstructions with TF-OCM due to the complicated and heterogeneous mechanical envi-
ronment + boundary conditions that they present (further details are provided in the Discussion).
Elastic image registration reveals space‑ and time‑varying collagen displacements. Time-
varying deformations of the collagen substrate were observed in conjunction with the previously described
changes in spheroid morphology and collagen degradation/remodeling. Unlike standard TFM methods which
track the motion of embedded fiducial marker beads, here, the motion of collagen fibers was tracked directly
(analogous to a previously reported TFM method based on confocal reflectance microscopy27). Elastic image
registration (via the built-in MATLAB function imregdemons) was employed to estimate the time-varying 3D
displacement field which would map the original collagen substrate at time t = 0 to the deformed collagen sub-
strate observed at any given time-point during the first 24 h of imaging. (Quantitative analyses and discussions
regarding the performance of the tracking algorithm may be found in Supplementary Notes 4 and 5.) As a result,
the time-varying collagen displacement field could be quantified and visualized, as in Fig. 4 and Supplementary
Video 4. (Note that Fig. 4 and Supplementary Video 4 depict collagen displacements measured around an ob/
ob ASC + MCF10AT1 co-culture spheroid. These spheroids demonstrated the most dramatic displacement fields
among all imaged s pheroids31.) These data revealed contraction of the collagen toward the spheroid body, with
the strength of contraction varying as a function of position. Regions of collagen with stronger displacements
likely indicate areas where the spheroid may be exerting stronger contractile forces, although a quantitative
reconstruction of CTFs would be required to verify this h ypothesis35. However, even in the absence of CTF
reconstructions, this deformation data alone can provide valuable information for learning about cell/spheroid
behavior31,36.
Discussion
The results of the previous section demonstrate several advantages provided by our computational 4D-OCM
imaging methods. Micrometer-scale details of both spheroid and collagen structure were observed over a large
mm3-scale volumetric field-of-view using only native scattering contrast. Rapid volumetric image acquisition
(on the order of 10–15 s per volume, as detailed in the “Methods” section) enabled the measurement of temporal
fluctuations in the backscattered optical signals from cells, and these fluctuations were successfully exploited to
enable the segmentation of cells from the surrounding collagen. (We again refer the reader to Supplementary
Note 6 for a comparison of temporal speckle contrast images against confocal fluorescence microscopy.) As a
result, 3D spheroid morphology was readily extracted from the optically scattering collagen background with-
out the aid of labeling agents. Furthermore, due to the low phototoxicity inherent to OCM imaging, spheroid
morphology was readily monitored in detail throughout multi-day time-lapse experiments. Finally, since the
scattering contrast provided by OCM also captured time-varying collagen structure, collagen degradation could
be observed in the vicinity of invading cellular protrusions, and spatiotemporally heterogeneous deformations
of the collagen substrate could be quantified. Unlike standard TFM methods, 4D-OCM was able to track these
collagen deformations directly, without the addition of artificial fiducial marker beads. These combined imag-
ing capabilities have enabled access to previously inaccessible data that is critical to advancing mechanobiology
research in clinically relevant settings31. Taken together, this establishes computational 4D-OCM as a promis-
ing experimental technique for 4D imaging of biophysical cell-ECM interactions and collective cell behavior in
physiologically relevant 3D collagen substrates.
Temporal speckle contrast has proven remarkably useful for distinguishing invading cells from the surround-
ing (quasi-static) collagen substrate. However, this method does have weaknesses. In particular, in our previous
study30, we showed that fine cellular protrusions (e.g., filipodia) can exhibit relatively static speckle patterns
over the time-scales of our ‘burst’ imaging protocol (i.e., a volumetric acquisition rate on the order of 0.1 Hz
repeated over a total duration of 1.5–2 min). We expect similar limitations to be present in this study. As a result,
fine/static structures may exhibit weak contrast after performing our ‘standard deviation projection’ operation,
and thus be incorrectly placed within the ‘collagen’ channel of our data. Future work with co-registered OCM
and confocal fluorescence microscopy images will be required to quantify the severity of this effect. (However,
a preliminary investigation is provided in Supplementary Note 6.) Our use of temporal speckle contrast also
substantially increases the amount of raw data that must be acquired by nearly an order of magnitude. However,
the ability to generate synthetic imaging channels from label-free, long-term OCM image data may outweigh
this cost. Nevertheless, future work which seeks to reduce the amount of data that must be acquired would be
of great value. If large quantities of data are acceptable, and high-speed OCM imaging is available, the utility of
temporal speckle contrast may be further enhanced by enabling the generation of multiple synthetic channels
which correspond to different structures and/or levels of metabolic activity34.
Although we were able to quantify the displacement of collagen fibers via elastic image registration (using
the MATLAB function imregdemons), these measurements cannot be expected to be reliable very close to the
cell-collagen boundary. This is because imregdemons uses Thirion’s ‘Demons algorithm’37,38, which performs
image registration via an iterative optimization procedure inspired by the optical flow equations. This ill-posed
problem is typically regularized via a diffusion (blurring/smoothing) process over the (iteratively updated)
displacement field and/or by imposing other constraints (such as requiring that the computed displacement
field describes a diffeomorphic transformation)37. Unfortunately, since invading cells can degrade and migrate
through the 3D collagen substrate, a displacement field which ‘perfectly’ registers collagen fibers over time may
exhibit jump discontinuities and/or be non-invertible at the cell-collagen interface. The typical regularization
schemes of the Demons algorithm (i.e., isotropic and homogeneous spatial averaging) cannot accommodate
these types of features. Algorithms based on local cross-correlation/matching would be similarly vulnerable,
due to the spatial averaging inherent to cross-correlation windows. In the event that migrating cells deposit new
Scientific Reports | (2021) 11:2814 | https://doi.org/10.1038/s41598-021-81470-7 7
Vol.:(0123456789)www.nature.com/scientificreports/
collagen substrate, a valid displacement field may not even exist at all locations within the collagen substrate at a
given time-point. In order to obtain reliable collagen displacement data near the cell-collagen boundary (when
such a measurement is possible), alternative algorithms must be found or devised which account for the complex
boundary conditions which occur over long-term multicellular invasion processes. For example, regularization of
the Demons algorithm via a spatial averaging scheme which ignores cell-occupied regions (via spatially-varying
averaging kernels) may be a viable option. If such a solution cannot be found, the incorporation and tracking of
scattering fiducial marker beads within the collagen substrate may be a suitable alternative so long as the presence
of beads does not appreciably alter cellular behavior. One advantage of the label-free contrast leveraged by our
computational 4D-OCM methods is that, unlike fluorescence-based TFM techniques for which marker beads are
typically required, our results here demonstrate that marker beads are merely optional when using computational
4D-OCM. By extension, future variations of TF-OCM built upon this technique may be particularly attractive
for studying cells within physiologically relevant 3D collagen substrates.
Long-term imaging with computational 4D-OCM offers another interesting advantage for TF-OCM. In order
to understand this advantage, we first require some background knowledge about TFM. In order to measure
substrate deformations, most TFM techniques require at least two images (any technique which does not require
two images must have some form of a priori knowledge about the substrate s tructure11,39). These images consist
of a ‘reference’ state (i.e., when the substrate is relaxed and no appreciable CTFs are present) and a ‘deformed’
state (i.e., when CTFs are present and the substrate is deformed). In typical TFM applications, these two images
are acquired as follows: (1) cells are embedded and allowed to achieve a contractile state (this may require several
hours in an incubator), (2) an image of the resulting ‘deformed’ state is acquired, (3) a contractility inhibitor or
lethal reagent is introduced to induce cell relaxation, and (4) an image of the resulting ‘reference’ state is acquired.
This is a relatively rapid and simple procedure. However, it relies on a few important assumptions: (1) the intro-
duced reagent completely eliminates CTFs, (2) the substrate becomes fully relaxed (i.e., with no residual stress due
to cell-mediated remodeling of the original substrate or other mechanisms), and (3) no further information about
the temporal evolution of the biological system under physiological conditions is required (since physiological
conditions and normal cell behavior are disrupted after the addition of force-inhibiting and/or lethal reagents).
In this study, since we wished to observe the long-term behavior of invading cells which were free to remodel
the collagen substrate, an ‘artificial’ chemically-induced reference state was not acceptable. Instead, by imaging
the collagen substrate and spheroid immediately after embedding, we obtained a ‘natural’ reference state before
sufficient time had elapsed for cells to appreciably deform the collagen substrate. (This method is corroborated
by a similar ‘natural’ reference state approach that was recently applied to TFM for embedded spheroid systems
using far-field deformation m easurements35.) As a result, we were able to continuously monitor the evolving
substrate deformations as long as our image registration algorithm could be trusted. (Here, displacement tracking
was halted after 24 h, since invasions into the collagen became substantial beyond that time.) Long-term imaging
experiments with computational 4D-OCM may offer new opportunities to study plastic deformations/collagen
remodeling by following a new procedure: (1) acquire the ‘natural’ reference state immediately after spheroid
embedding, (2) observe CTF-induced deformations over time, (3) when sufficient time has elapsed, introduce a
contractility inhibitor, and (4) acquire the ‘artificial’ reference state. Any discrepancies between the ‘natural’ and
‘artificial’ reference states may offer a means to quantify residual/plastic deformations and/or residual CTFs. We
are not aware of any current TFM methods which provide/use such measurements.
The reconstruction of CTFs exerted by large multicellular constructs embedded in collagen over long time-
scales is a challenging problem that has yet to be fully addressed by the TFM field5. In addition to the challenges
of image segmentation and displacement tracking (discussed above), force reconstruction within collagen is a
challenging problem in its own r ight11,26,40,41. In particular, collagen is mechanically nonlinear and often exhibits
heterogeneity and anisotropy across a range of spatial scales. Moreover, cells can remodel the collagen matrix,
altering its mechanical properties over time. This makes collagen supremely difficult to characterize and model
to the degree necessary for numerical CTF-reconstruction schemes. Researchers have begun to make forays into
addressing this c hallenge26,35. For example, Han et al. have demonstrated the use of optical tweezers to probe
localized nonlinear changes in stiffness and stress induced by cellular forces42. Leggett et al., on the other end of
the spectrum, have developed a rapid assay for extracting useful data from the contractile profiles generated by
cell clusters (rather than performing force reconstructions)43. However, much work remains in order to enable
high-resolution CTF reconstructions for large and dynamic multicellular constructs. In the meantime, our com-
putational 4D-OCM imaging methods provide data that is useful to mechanobiology research (e.g., spheroid/
cell morphology and collagen displacement data), even in the absence of quantitative CTF r econstructions31,36,40.
By making such data more readily available for studies of multicellular systems embedded in scattering media,
our methods may further help to provide necessary data to aid ongoing and future research toward achieving
quantitative CTF reconstructions. Other OCM-based techniques, such as optical coherence elastography, may
also be used alongside our computational 4D-OCM imaging methods to aid in the characterization of local and
dynamic mechanical properties within biopolymer s ubstrates44–47.
Conclusion
In this study, our previously developed (single-cell) TF-OCM imaging methods30 were adapted to enable the
study of the dynamic invasion behavior of tumor spheroids embedded within 3D scattering collagen substrates.
By leveraging temporal speckle contrast to distinguish live cells from the background collagen substrate, our
methods revealed detailed spheroid morphology throughout multi-day, time-lapse experiments without the
use of either endogenous or exogenous labeling. The label-free contrast mechanism underlying OCM imaging
further revealed cell-induced collagen remodeling and CTF-induced deformations of the collagen substrate.
This was achieved without the use of fiducial marker beads or disruptive contractility inhibiting reagents that
Scientific Reports | (2021) 11:2814 | https://doi.org/10.1038/s41598-021-81470-7 8
Vol:.(1234567890)www.nature.com/scientificreports/
are otherwise ubiquitous to TFM. Although much work remains to enable quantitative reconstructions of CTFs
within highly nonlinear (and possibly remodeled) collagen substrates, the new capabilities afforded by our
current methods nevertheless provided access to valuable data that have already facilitated the advancement
of broader mechanobiology s tudies31. Altogether, computational 4D-OCM provides a promising approach to
bridge the gap between current experimental TFM capabilities and the needs of mechanobiology researchers to
study 3D, collective, and dynamic cell behaviors within optically scattering media. As a result, future research
and development toward the quantitative reconstruction of collective cell forces with TF-OCM may enable new
and promising investigations of biophysical phenomena.
Methods
Animal use and regulatory compliance. All experiments using cells isolated from animals were
approved by the Cornell University Institutional Animal Care and Use Committee (IACUC) under protocol
number 2009–0117. All experiments and methods were performed in accordance with relevant regulations and
Animal Research: Reporting of In Vivo Experiments (ARRIVE) guidelines.
Cell culture. Adipose stromal cells (ASCs) were isolated from subcutaneous fat of 10-week-old B6.Cg-
Lepob/J (ob/ob) mice and their age-matched C57BL/6J wild-type (WT) controls (Jackson Laboratories) accord-
ing to previously published protocols32. MCF10AT1 cells were obtained from the Barbara Ann Karmanos Can-
cer Institute. (For the purposes of the companion study reported in Ref.31) MCF10AT1 cells were transfected
with a commercially available turbo-green fluorescent protein (GFP) vector (Thermo). Successfully transfected
GFP + cells were sorted on a BD FACS Aria cytometer.
ASCs were cultured in DMEM/F12 media supplemented with 10% fetal bovine serum and 100 U/mL penicil-
lin–streptomycin. MCF10AT1 cells were cultured in enriched DMEM/F12 media supplemented with 5% horse
serum, 10 μg/mL insulin, 0.5 μg/mL hydrocortisone, 100 ng/mL cholera toxin, 20 ng/mL EGF, and 100 U/mL
penicillin–streptomycin. All cell lines were maintained in incubators at 37 °C and 5% CO2, with media changes
every two days. For co-culture experiments, a 1:1 ratio of the respective media for each cell type was used.
Spheroid/sample preparation. 96-well tissue culture plates were coated with 50 μL/well of 1.5% agarose
diluted in DMEM/F12. This coating solidified to form a non-adherent surface (which promotes the coalescence
of cells into spheroids). MCF10AT1 cells, ASCs, or co-cultures of the two (in a 1:1 ratio) were seeded into each
well of the agarose-coated plate and placed on a rotating shaker (60 rpm) overnight to form multicellular sphe-
roids.
Glass-bottomed petri dishes (Matsunami, 35 mm diameter well) were divided into three distinct wells/sec-
tors via the addition of a handcrafted divider. This divider was made from a 1.5 mm thick sheet of PDMS with
three equal-sized compartments cut out, and was covalently bonded to the glass-bottomed petri dishes following
plasma treatment.
High concentration rat tail collagen I (Corning) was reconstituted and neutralized with sodium hydroxide
(NaOH) and 10 × DMEM/F12 to a final concentration of 6 mg/mL. Collagen and spheroids were deposited on the
prepared 3-well dishes (1 spheroid/well). In order to promote the formation of thick collagen fibers, the dishes
were held at 4 °C for 15 min, 20 °C for 15 min, and finally 37 °C for 15 min. Each gel was then immersed with
media and transported to the incubating bio-chamber (described below).
Imaging system. All images were acquired using a custom-built spectral domain OCM imaging system
(depicted in Fig. S1 in Supplementary Note 1) which was developed based upon our previously reported system30
with minor modifications, including a novel sample arm design (detailed below and in Supplementary Notes 1
and 2). Light was supplied by a Ti:Sapph laser (Femtolasers, INTEGRAL Element, central wavelength = 800 nm,
bandwidth = 160 nm) and distributed within the microscope by a fiber coupler (Thorlabs, TW805R2A2, 90% to
the reference arm, 10% to the sample arm). (The power incident upon biological samples was approximately 4–5
mW.) Polarization in each arm was controlled and matched via manual fiber polarization controllers (Thorlabs,
FPC560). Custom-length fiber patch cords were added to reduce the total dispersion mismatch between the two
arms.
In the sample arm, light exiting the optical fiber was collimated using a (Thorlabs, AC127-019-B) lens.
Beam angle was scanned using a pre-mounted galvanometer mirror pair (Cambridge Technologies, ProSeries
I, 10 mm aperture, 10 V analog communication, S4 coating). The separation of the two galvanometer mirrors
along the optical axis (as determined by their housing) was d = 13.69 mm. The two galvanometer mirrors were
(approximately) imaged to the back focal plane of the objective lens (Olympus, LCPlan N 20 × /0.45 IR, air
immersion) via a novel custom-built 1:1 magnification 4F telescope. The telescope consisted of three lenses: two
f = 100 mm lenses (Thorlabs, AC508-100-B) at the front and back, and one fx = ∞, fy = +700 mm cylindrical lens
(Thorlabs, LJ1836L1-B) at the center. The central cylindrical lens was used to compensate for coherence gate
curvature (CGC)30,48, a distortion artifact which emerges due to the separation (d) of the galvanometer mirrors
along the optical axis. A theoretical model and results of a validation experiment for this novel OCM system
design are provided in Supplementary Notes 1 and 2, respectively. As detailed in Supplementary Note 1, the ‘opti-
mal’ focal length of the cylindrical lens was predicted to be approximately (100 mm)2/(13.69 mm) ≈ + 730 mm.
The + 700 mm lens that was used here was the nearest readily available ‘off-the-shelf ’ part. With this design, our
system reduced CGC to at most 6% (and may be capable of reducing CGC to as little as 1.5%) of its original
severity (i.e., when no cylindrical lens is present).
In the reference arm, light was collimated as in the sample arm and then reflected via a retro-reflector (Thor-
labs, PS975M-B) mounted to a single-axis micrometer stage (Newport 9064-X, for fine position adjustment),
Scientific Reports | (2021) 11:2814 | https://doi.org/10.1038/s41598-021-81470-7 9
Vol.:(0123456789)www.nature.com/scientificreports/
which was further mounted to a rail (for coarse position adjustment). The amount of returning light was con-
trolled via a manual tunable aperture.
The objective lens was mounted so as to image samples in an inverted configuration (i.e., from underneath).
Samples were held above the objective lens in an incubating bio-chamber (Okolab, UNO-PLUS), which was used
to maintain physiological temperature (37 °C), humidity (100%), and pH (via a 5% C O2 atmosphere) throughout
time-lapse experiments. The bio-chamber was mounted to a 3-axis micrometer stage (Newport, 9064-XYZ-R).
Linear stepper motors (Thorlabs, ZST225B motor, KST101 controller, and KCH601 controller hub/power sup-
ply) were used to control the position of all four micrometer stages in the system (3 axes to control the position
of the bio-chamber in the sample arm, and 1 axis to control the distance to the retro-reflector in the reference
arm). These motors were controlled via commands issued in MATLAB R2017a.
Raw image data were acquired using a spectrometer (Wasatch Photonics, Cobra 800) with a 2048-pixel line
scan camera (Teledyne e2v, Octoplus). Galvanometer mirror scanning and data acquisition were controlled via
custom software built in LabVIEW. Data was acquired using a line scan rate of 55 kHz and an exposure time of
10 μs. The system exhibited a sensitivity of ~ 90 dB and a fall-off of − 5 dB/mm. The axial and lateral resolutions
of the system were approximately 2.4 μm and 1.5 μm, respectively. In order to perform automated multi-day
time-lapse imaging, the data acquisition software, motors, laser, and computer-to-server data transfers were
orchestrated via a master control program implemented in MATLAB R2017a.
Time‑lapse imaging protocol. Immediately after spheroid embedding, the sample dish (containing 2–3
spheroids) was placed within the bio-chamber. Manual adjustment of the 4 linear motors was used to establish a
set of control points for each spheroid. These control points defined a fixed position for each motor to hold when
acquiring images of the corresponding spheroid. The control points for a given spheroid were selected such that:
(1) the spheroid was centered within the lateral FOV of the system (sample arm x/y control points), (2) the ‘equa-
tor’ of the spheroid was roughly aligned to the focal plane (sample arm z control point), and (3) the spheroid and
coverslip surface (at the base of the dish) appeared within an acceptable range of locations within the axial FOV
of the imaging system (reference arm z control point). Establishing control points for all of the spheroids in a
given dish required approximately 10–15 min in total.
Prior to beginning time-lapse imaging, a ‘calibration image’ was acquired for each spheroid. For a given
spheroid, the motors were commanded to move to their corresponding control points. Then, one of the lateral
(x/y) motors was adjusted such that the FOV was centered at a point 1–1.25 mm to the side of the spheroid.
This resulted in the spheroid being removed from the FOV, such that only ‘empty’ collagen substrate remained.
An image of this region was then acquired for use during OCT image reconstruction. (The use of this calibra-
tion image is detailed in Supplementary Note 3, ‘OCT image reconstruction procedure: Focal plane curvature
removal’.) This imaging procedure (which was performed manually for all of the spheroids in a given dish)
required approximately 5–10 min in total.
Once the above procedures were completed, time-lapse imaging was begun. Images of each spheroid in the
dish were acquired at 40-min time intervals for a total of 48 h. (In between rounds of imaging, the laser shutter
was closed to avoid optical heating of the sample.) For a given spheroid and time-point, nine volumetric images
were acquired in rapid succession, similar to the ‘burst protocol’ used in our previous TF-OCM s tudy30. The
nine images consisted of 1 ‘full FOV’ volume (spanning a lateral FOV of 1.25 × 1.25 mm2 for larger co-culture
spheroids, or 1 × 1 mm2 for smaller monoculture spheroids, using 1024 × 1024 lateral pixels) and 8 ‘reduced FOV’
volumes (spanning a lateral FOV of 937.5 × 937.5 µm2 for larger co-culture spheroids, or 0.75 × 0.75 mm2 for
smaller monoculture spheroids, using 768 × 768 lateral pixels). Each such ‘burst’ of volumetric data generated
approximately 24 GB of raw data (resulting in each time-series experiment generating approximately 1.75 TB
of raw data per spheroid). Each burst required ~ 2 min to acquire. Imaging of 3 spheroids in a single dish
(including sample repositioning between spheroids) required approximately 8–10 min per time-point. This left
approximately 30 min of ‘down time’ between each (40-min interval) time-point for raw data to be transferred
to a remote high-capacity server.
OCT image reconstruction. Volumetric OCT images were reconstructed from raw image data using a
custom procedure similar to that described in our previous study30. In brief, this procedure was designed to
minimize both spatial distortions within individual OCT volumes and relative spatial distortions between OCT
images in a single time-series. The procedure consisted of 6 key components: (1) (Depth-selective) OCT volume
reconstruction, (2) coherence gate curvature removal, (3) phase registration, (4) focal plane curvature mitiga-
tion, (5) bulk demodulation, and (6) computational adaptive optics. (Evidence and discussions regarding the
need/reasoning for these procedures may be found in our previous publication30.) Since the implementation
of these procedures has been updated/modified since our previous study, flow charts and equations describing
these updated procedures have been provided in Supplementary Note 3 (‘OCT image reconstruction proce-
dure’). All OCT image reconstruction and subsequent image processing was performed in MATLAB R2018a.
Drift correction. Despite the use of precision motors for sample positioning, small amounts of bulk drift
(along x, y, and/or z) were present between time-points. The OCT image reconstruction procedures (described
in Supplementary Note 3) automatically corrected for drift along the z-axis. Drift along the lateral dimensions
was measured and corrected separately after OCT image reconstruction.
In order to measure lateral drift, first, an average OCT image was computed via a ‘mean projection’ of the
8 ‘reduced
FOV’ images obtained for a given time-point. That is, denoting the N = 8 reduced FOV images by
Si x, y, z, t for i ∈ {1, 2, . . . , N}, the average (‘mean projection’) OCT image S x, y, z, t was obtained via:
Scientific Reports | (2021) 11:2814 | https://doi.org/10.1038/s41598-021-81470-7 10
Vol:.(1234567890)www.nature.com/scientificreports/
N
1
(1)
S x, y, z, t = Si (x, y, z, t).
N
i=1
For a given time-point, 4 sub-volumes were extracted from this average OCT image, corresponding to regions
along each of the 4 sides of the lateral FOV. The lateral dimensions of these sub-volumes were selected to be as
large as possible while still excluding the glass surface and spheroid body (which appeared at the center of the
FOV) and thus only contained signals from the surrounding collagen substrate. (For a visual representation,
these regions of interest are analogous to the four sides of the region depicted in Fig. S9 in Supplementary Note
3.) The drift of each sub-volume with respect to the corresponding sub-volume of the previous time-point was
computed to sub-pixel precision via 3D cross-correlation. The total lateral drift of a given time-point with respect
to the previous time-point was taken to be the median value of the individual drift values reported across all 4
sub-volumes. Total drift with respect to the first time-point was then computed via cumulative summation from
time t = 0 up to the given time-point. This lateral drift was removed from all OCT images which were used for
subsequent processing.
Cell and collagen channel synthesis. Reconstructed OCT images were split into two synthetic ‘chan-
nels’ corresponding to cells and collagen/background medium, respectively. To achieve this, the 8 reduced FOV
images acquired for a given spheroid and time-point were
combined via a ‘standard deviation projection’. That
is, denoting the N = 8 reduced FOV images by z, t for i ∈ {1, 2, . . . , N}, the output (‘standard deviation
S i x, y,
projection’) OCT image Sσ x, y, z, t was obtained via:
N
1 Si x, y, z, t − S x, y, z, t 2 (2)
Sσ x, y, z, t =
N −1
i=1
where S x, y, z, t is defined as in Eq. (1). Similar to our previously reported method30, this technique leverages
temporal speckle contrast to distinguish rapidly changing structures (primarily cells) from static background
structures (here, primarily collagen), resulting in a synthetic ‘cell’ channel. ‘Cell’ channel images were down-
sampled by a factor of 768:400 along the lateral dimensions, and by a suitable factor along the axial dimension,
via the MATLAB function imresize3 to yield a final voxel size of (1.88 μm)3 and (2.34 μm)3 for images of mono-
culture spheroids and co-culture spheroids, respectively. This down-sampling was used in order to perform
smoothing and reduce computational load. These images exhibited a depth-dependent additive ‘background’.
This depth-dependent background profile was estimated by computing the median depth-dependent intensity
profile from a volumetric region along the periphery of the lateral FOV of the ‘cell’ channel image (analogous
to the previously described sub-volumes used for performing lateral drift correction). This background profile
was then subtracted from the original image, yielding the completed ‘cell’ channel image.
Preliminary binary images were generated from each (down-sampled) ‘cell’ channel image by applying a
5 × 5 × 5 voxel median filter followed by thresholding via Otsu’s method. Noise and non-cell structures in these
preliminary binary images were mitigated via 4D region growing. Specifically, at the first time-point, only the
spheroid (the largest connected structure) was retained from the preliminary binary image. The resulting ‘clean’
binary image then served as the ‘seed’ image for the second time-point. The only structures retained from the
preliminary binary image of the second time-point were those which exhibited partial or complete spatial overlap
with the structure present in the seed image. This resulted in a clean binary image for the second time-point,
which then served as a seed image for the third time-point, and so on. (This algorithm is vulnerable to ‘losing’
cells which break away from the spheroid body and migrate away fast enough as to exhibit no spatial overlap
with cells in the image acquired at the previous time-point. However, we did not observe substantial instances
of this phenomenon with our 40-min imaging interval. Decreasing this interval could be used to mitigate this
problem in the future).
In order to generate the ‘collagen’ channel, the volumes in the image sequence S x, y, z, t from Eq. (1) were
down-sampled in the same manner as the ‘cell’ channel images described above. The values of any voxels cor-
responding to ‘cells’ (as determined by the cleaned binary images described above) were set to 0, yielding the
complete ‘collagen’ channel image.
Collagen displacement tracking. Time-varying collagen displacements were computed across the first
24 h of images using elastic image registration via the built-in MATLAB function imregdemons (which uses
Thirion’s ‘Demons Algorithm’, an iterative, large-deformation registration method inspired by the optical flow
equations37,38). Specifically, this function was used to compute the 3D displacement field required to register
the ‘collagen’ channel image of the first time-point (t = 0) to the ‘collagen’ channel image of any given time-
point acquired during the first 24 h of imaging. The imregdemons function was called using the following input
parameters (as defined on the documentation page for the function49): pyramid levels = 3, iterations per pyramid
level = 100, and accumulated field smoothing = 2. With these parameters, the resulting displacement measure-
ments exhibited a noise floor of 34 nm for images of monoculture spheroids, and 41 nm for images of co-culture
spheroids. Further details and definitions regarding these measurements are provided in Supplementary Note
4. Detailed quantitative analyses and discussions regarding the performance of imregdemons at varying spatial
scales are provided in Supplementary Note 5. Supplementary Note 5 also discusses the role of algorithm input
parameters and collagen properties in determining the limits of algorithm performance.
Displacements were not computed for later time-points beyond the 24 h mark because the progression of
invasive protrusions (and associated collagen degradation and deformation) became substantial, and so the
Scientific Reports | (2021) 11:2814 | https://doi.org/10.1038/s41598-021-81470-7 11
Vol.:(0123456789)www.nature.com/scientificreports/
assumptions underlying the Demons Algorithm (and most other standard elastic image registration algorithms)
break down38. As detailed in the Discussion, further work will be required in the future to obtain deformation
tracking results that are sufficiently accurate/reliable for quantitative CTF reconstructions. However, the methods
used here have been assumed to be sufficiently accurate to demonstrate the value of our computational 4D-OCM
imaging methods for mechanobiology research and future developments in 4D TF-OCM.
Figure/video generation. All figure/video panels were generated/rendered using MATLAB R2019b. Fig-
ures were arranged using Microsoft PowerPoint 2016.
Data availability
All relevant data are available from the authors.
Code availability
All relevant code is available from the authors.
Received: 23 July 2020; Accepted: 29 December 2020
References
1. Jansen, K. A., Bacabac, R. G., Piechocka, I. K. & Koenderink, G. H. Cells actively stiffen fibrin networks by generating contractile
stress. Biophys. J. 105, 2240–2251. https://doi.org/10.1016/j.bpj.2013.10.008 (2013).
2. Kutys, M. L. & Chen, C. S. Forces and mechanotransduction in 3D vascular biology. Curr. Opin. Cell. Biol. 42, 73–79. https://doi.
org/10.1016/j.ceb.2016.04.011 (2016).
3. Song, W. et al. Dynamic self-organization of microwell-aggregated cellular mixtures. Soft Matter 12, 5739–5746. https://doi.
org/10.1039/c6sm00456c (2016).
4. Sunyer, R. et al. Collective cell durotaxis emerges from long-range intercellular force transmission. Science 353, 1157–1161. https
://doi.org/10.1126/science.aaf7119 (2016).
5. Labernadie, A. et al. A mechanically active heterotypic E-cadherin/N-cadherin adhesion enables fibroblasts to drive cancer cell
invasion. Nat. Cell. Biol. 19, 224–237. https://doi.org/10.1038/ncb3478 (2017).
6. Kraning-Rush, C. M., Califano, J. P. & Reinhart-King, C. A. Cellular traction stresses increase with increasing metastatic potential.
PLoS ONE 7, e32572 (2012).
7. Paszek, M. J. et al. Tensional homeostasis and the malignant phenotype. Cancer Cell. 8, 241–254 (2005).
8. Breckenridge, M. T., Desai, R. A., Yang, M. T., Fu, J. & Chen, C. S. Substrates with engineered step changes in rigidity induce trac-
tion force polarity and durotaxis. Cell. Mol. Bioeng. 7, 26–34. https://doi.org/10.1007/s12195-013-0307-6 (2014).
9. Xi, W., Saw, T. B., Delacour, D., Lim, C. T. & Ladoux, B. Material approaches to active tissue mechanics. Nat. Rev. Mater. 4, 23–44.
https://doi.org/10.1038/s41578-018-0066-z (2019).
10. Roca-Cusachs, P., Conte, V. & Trepat, X. Quantifying forces in cell biology. Nat. Cell. Biol. 19, 742–751. https://doi.org/10.1038/
ncb3564 (2017).
11. Mulligan, J. A., Bordeleau, F., Reinhart-King, C. A. & Adie, S. G. In Biomechanics in Oncology (eds Dong, C. et al.) (Springer, Berlin,
2018).
12. Schwarz, U. S. & Soine, J. R. Traction force microscopy on soft elastic substrates: a guide to recent computational advances. Biochim.
Biophys. Acta 3095–3104, 2015. https://doi.org/10.1016/j.bbamcr.2015.05.028 (1853).
13. Jansen, K. A. et al. A guide to mechanobiology: where biology and physics meet. Biochim. Biophys. Acta 3043–3052, 2015. https
://doi.org/10.1016/j.bbamcr.2015.05.007 (1853).
14. Dembo, M., Oliver, T., Ishihara, A. & Jacobson, K. Imaging the traction stresses exerted by locomoting cells with the elastic sub-
stratum method. Biophys. J. 70, 2008–2022. https://doi.org/10.1016/S0006-3495(96)79767-9 (1996).
15. Dembo, M. & Wang, Y. L. Stresses at the cell-to-substrate interface during locomotion of fibroblasts. Biophys. J. 76, 2307–2316
(1999).
16. Butler, J. P., Tolic-Norrelykke, I. M., Fabry, B. & Fredberg, J. J. Traction fields, moments, and strain energy that cells exert on their
surroundings. Am. J. Physiol. Cell Physiol. 282, C595–C605 (2002).
17. Schwarz, U. S. et al. Calculation of forces at focal adhesions from elastic substrate data: the effect of localized force and the need
for regularization. Biophys. J. 83, 1380–1394 (2002).
18. Legant, W. R. et al. Multidimensional traction force microscopy reveals out-of-plane rotational moments about focal adhesions.
Proc. Natl. Acad. Sci. U.S.A. 110, 881–886 (2013).
19. Franck, C., Maskarinec, S. A., Tirrell, D. A. & Ravichandran, G. Three-dimensional traction force microscopy: a new tool for
quantifying cell-matrix interactions. PLoS ONE 6, e17833. https://doi.org/10.1371/journal.pone.0017833 (2011).
20. Vogel, V. & Sheetz, M. Local force and geometry sensing regulate cell functions. Nat. Rev. Mol. Cell Biol. 7, 265–275 (2006).
21. Pampaloni, F., Reynaud, E. G. & Stelzer, E. H. K. The third dimension bridges the gap between cell culture and live tissue. Nat. Rev.
Mol. Cell Biol. 8, 839–845 (2007).
22. Wirtz, D., Konstantopoulos, K. & Searson, P. C. The physics of cancer: the role of physical interactions and mechanical forces in
metastasis. Nat. Rev. Cancer 11, 512–522 (2011).
23. Siedlik, M. J., Varner, V. D. & Nelson, C. M. Pushing, pulling, and squeezing our way to understanding mechanotransduction.
Methods 94, 4–12 (2016).
24. Gjorevski, N. & Nelson, C. M. Mapping of mechanical strains and stresses around quiescent engineered three-dimensional epithelial
tissues. Biophys. J. 103, 152–162. https://doi.org/10.1016/j.bpj.2012.05.048 (2012).
25. Hall, M. S. et al. Toward single cell traction microscopy within 3D collagen matrices. Exp. Cell Res. 319, 2396–2408. https://doi.
org/10.1016/j.yexcr.2013.06.009 (2013).
26. Hall, M. S. et al. Fibrous nonlinear elasticity enables positive mechanical feedback between cells and ECMs. Proc. Natl. Acad. Sci.
USA 113, 14043–14048. https://doi.org/10.1073/pnas.1613058113 (2016).
27. Kim, J., Jones, C. A., Groves, N. S. & Sun, B. Three-dimensional reflectance traction microscopy. PLoS ONE 11, e0156797. https
://doi.org/10.1371/journal.pone.0156797 (2016).
28. Legant, W. R. et al. Measurement of mechanical tractions exerted by cells in three-dimensional matrices. Nat. Methods 7, 969–971
(2010).
29. Mulligan, J. A., Bordeleau, F., Reinhart-King, C. A. & Adie, S. G. Measurement of dynamic cell-induced 3D displacement fields
in vitro for traction force optical coherence microscopy. Biomed. Opt. Express 8, 1152–1171. https://doi.org/10.1364/BOE.8.00115
2 (2017).
Scientific Reports | (2021) 11:2814 | https://doi.org/10.1038/s41598-021-81470-7 12
Vol:.(1234567890)You can also read