Recent Advances in Seismocardiography - Review - MDPI
←
→
Page content transcription
If your browser does not render page correctly, please read the page content below
vibration

Review
Recent Advances in Seismocardiography
Amirtahà Taebi 1,2, * , Brian E. Solar 2 , Andrew J. Bomar 2,3 , Richard H. Sandler 2,3 and
Hansen A. Mansy 2
 1    Department of Biomedical Engineering, University of California Davis, One Shields Ave, Davis,
      CA 95616, USA
 2    Biomedical Acoustics Research Laboratory, University of Central Florida, 4000 Central Florida Blvd,
      Orlando, FL 32816, USA; bsolar@knights.ucf.edu (B.E.S.); bomaraj@knights.ucf.edu (A.J.B.);
      rhsandler@gmail.com (R.H.S.); hansen.mansy@ucf.edu (H.A.M.)
 3    College of Medicine, University of Central Florida, 6850 Lake Nona Blvd, Orlando, FL 32827, USA
 *    Correspondence: ataebi@ucdavis.edu; Tel.: +1-407-580-4654

 Received: 29 August 2018; Accepted: 4 January 2019; Published: 14 January 2019

 Abstract: Cardiovascular disease is a major cause of death worldwide. New diagnostic tools are
 needed to provide early detection and intervention to reduce mortality and increase both the duration
 and quality of life for patients with heart disease. Seismocardiography (SCG) is a technique for
 noninvasive evaluation of cardiac activity. However, the complexity of SCG signals introduced
 challenges in SCG studies. Renewed interest in investigating the utility of SCG accelerated in recent
 years and benefited from new advances in low-cost lightweight sensors, and signal processing and
 machine learning methods. Recent studies demonstrated the potential clinical utility of SCG signals
 for the detection and monitoring of certain cardiovascular conditions. While some studies focused on
 investigating the genesis of SCG signals and their clinical applications, others focused on developing
 proper signal processing algorithms for noise reduction, and SCG signal feature extraction and
 classification. This paper reviews the recent advances in the field of SCG.

 Keywords: seismocardiography; heart-induced vibrations; cardiovascular disease; signal processing;
 signal segmentation; noise removal; feature extraction; machine learning

1. Introduction
     Cardiovascular disease results in one death every 40 s in the United States [1]. Improved diagnostic,
surveillance, and intervention methods would help reduce mortality [2,3] and extend lives.
Heart disease may be detected using many non-invasive methods including manual auscultation
of heart sounds, which is a common component of physical examinations and known to provide
useful diagnostic information. However, simple auscultation of heart sounds is of limited utility.
Detection and processing of very-low-frequency heart sounds (“infrasounds”) below the limit of human
ear detection may extend the diagnostic power of auscultation. New studies of cardiac-generated
sounds using computational fluid dynamics [4,5] and advanced signal processing methods suggested
increased potential to provide quantitative information that may be helpful for patient monitoring and
diagnosis. Seismocardiography (SCG) is a noninvasive technique that measures cardiac-induced
mechanical vibrations at the chest surface including those below the human hearing threshold.
The reader is referred to previous SCG reviews [6,7] describing earlier studies, while this paper
reviews more recent SCG studies including advances in instrumentation and signal processing
that hold the promises of increased clinical utility. Since previous reviews of SCG [6,7] described
early SCG studies, this article is more focused on the developments in the field during the last few
years. Between September 2017 and March 2018, we conducted a search of the scientific journals
and conferences using MEDLINE, as well as the Google Scholar search engine, for the following

Vibration 2019, 2, 64–86; doi:10.3390/vibration2010005                          www.mdpi.com/journal/vibration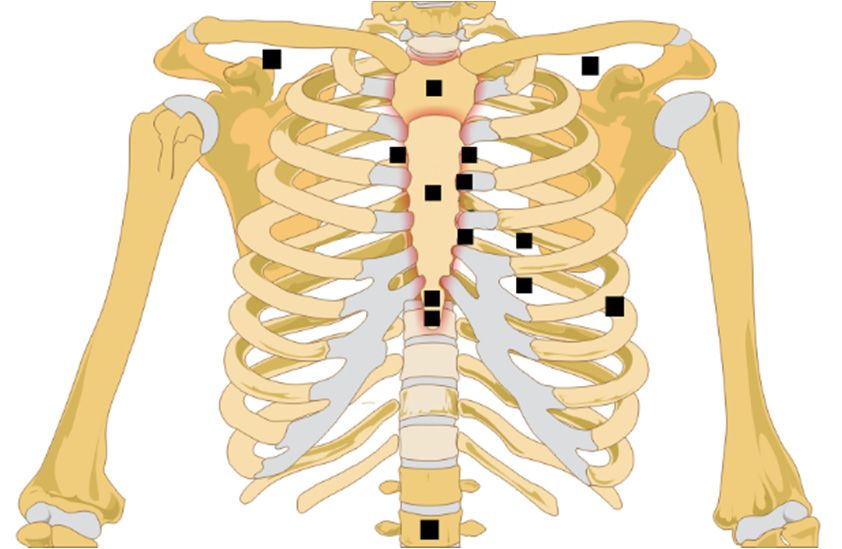
Vibration 2019, 2 65
expressions: “SCG”, “seismocardiography”, and “seismocardiogram”. Reviewing the reference section
of the initial results led to additional articles. More resources were added during the manuscript
preparation and revision. The final sampling period includes studies that were published after [7] and
before November 2018.
1.1. Definition of SCG Signals
The measurements of heart-induced motion, including displacement, velocity, and acceleration,
were performed as early as the turn of the 20th century [8]. These approaches can be categorized
into two classes [6,7]: (a) the measurement of whole-body recoil forces in response to cardiac
ejection, usually termed ballistocardiography (BCG); and (b) the local chest surface measurement of
cardiac-induced vibrations, typically referred to as SCG [9–13]. These vibrations are usually measured
in the form of acceleration (m/s2 ). This article focuses on the latter.
1.2. Physiological Sources of SCG Signals
SCG signals are believed to be caused by cardiac mechanical processes including cardiac
muscle contraction, cardiac valve movement, blood flow turbulence, and momentum changes.
The characteristics of these signals are likely to contain useful information that correlate with
cardiovascular physiologic [14] and pathologic processes [15]. Such information may powerfully
complement methods of detecting heart electrical activity (such as electrocardiography), serologic
testing, and imaging modalities (e.g., echocardiography, cardiac magnetic resonance imaging (MRI),
and catheterization).
Early BCG studies [8] suggested that heart-induced motion may be used to estimate changes
in cardiac output, and reported certain signal patterns in patients with myocardial infarction [16].
These signal patterns were also found to correlate with the strength of myocardial contractions [17,18]
and contain detectable waveform changes during heart disease resolution [19]. After introducing SCG
in early 1990s [13], recent studies suggest possible SCG utility for monitoring left-ventricle function,
coronary blood flow during balloon angioplasty [9,10,20], heart and breathing rates [21–26], and
ventricular filling, cardiac valve closure, and ventricular ejection preceding the onset of ischemic
symptoms [10].
While the relationship between SCG waves and cardiac activity is not fully understood, several
studies investigated this relationship. For example, SCG was reported to contain a low-frequency
wave during atrial systole, a high-amplitude wave during ventricular systole, another wave during
early ventricular filling, and some relatively high-frequency waves at the time of the first and second
heart sounds [13]. Simultaneous recording of SCG and electrocardiogram (ECG) indicated that the
peaks and valleys of the SCG correspond to known physiological events including mitral valve
opening (MO) and closure (MC), isovolumetric contraction, ejection, aortic valve opening (AO) and
closure (AC), and cardiac filling [7,27]. The utility of SCG in estimating cardiac intervals such as
electromechanical systolic pre-ejection period (PEP) and left-ventricular ejection time (LVET) was
also shown [28]. Multi-channel partially simultaneous SCG, ECG, and sonographic measurements
were used to identify the feature points in a cardiac cycle corresponding to the four common valvular
auscultation locations. Using these measurements, new feature points (including left-ventricular
lateral wall contraction peak velocity, septal wall contraction peak velocity, trans-aortic valve peak
flow, transpulmonary peak flow, trans-mitral ventricular relaxation peak flow, and trans-mitral atrial
contraction peak flow) were reported.
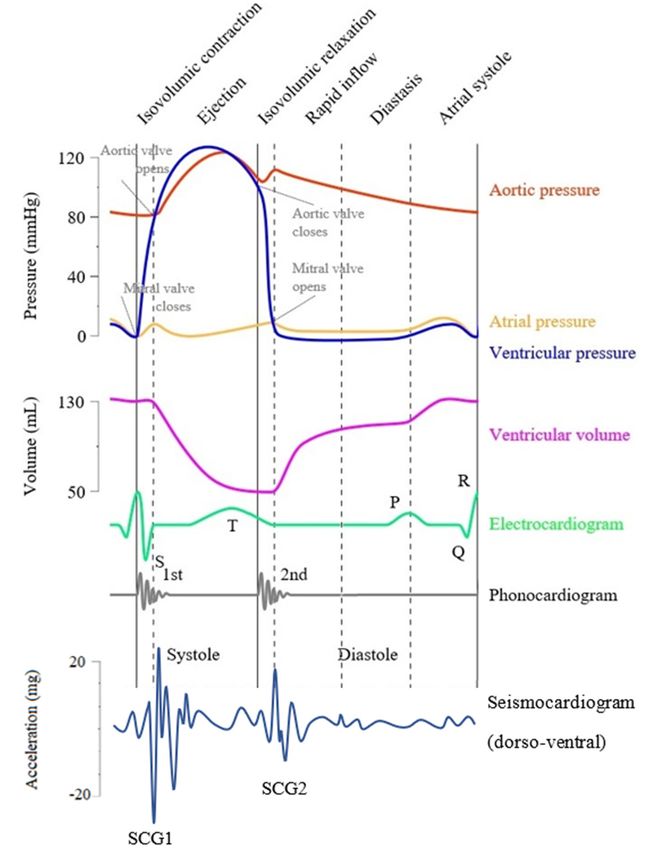
Table 1 lists all the SCG feature points and cardiac time intervals (CTIs) that were reported in
the literature, while Figure 1 shows a modified Wiggers diagram [29] where a sample SCG signal
(in the dorso-ventral direction) is plotted along with aortic blood pressure, ventricular volume, and
the electrocardiogram.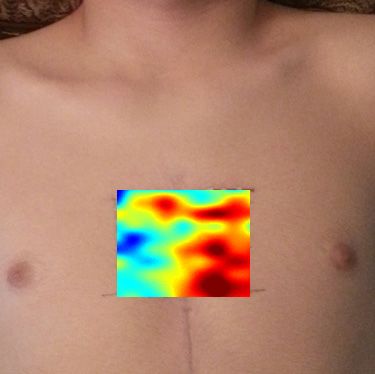
Vibration 2019, 3 FOR PEER REVIEW 3 of 22
Table 1. Seismocardiography (SCG) feature points pointed out in the literature.
Vibration 2019, 2 66
Feature Point Reference
Peak of atrial systole (AS) [10,14,30]
Mitral valve
Table 1. Seismocardiography (SCG) feature points pointed out in the[10,14,28,30,31]
closure (MC) literature.
Peak of rapid systolic ejection (RE) [10,14,30,32]
Peak of rapid diastolic filling (RF) Feature Point Reference[10,14,30]
Isovolumic contraction
Peak (IC) (AS)
of atrial systole [10,14,30][10]
Mitral
Mitral valve valve closure
opening (MO) (MC) [10,14,28,30,31]
[14,28,30,31]
Peak of rapid systolic ejection (RE) [10,14,30,32]
Aortic valve closure (AC) [14,28,30–32]
Peak of rapid diastolic filling (RF) [10,14,30]
Aortic valve opening
Isovolumic (AO)
contraction (IC) [10] [14,28,30–33]
Isovolumic movement
Mitral (IM) (MO)
valve opening [14]
[14,28,30,31]
Aortic valve
Rapid diastolic fillingclosure
time (AC) [14,28,30–32]
[14]
Aortic valve opening (AO) [14,28,30–33]
Isotonic contraction (IC) [14]
Isovolumic movement (IM) [14]
Isovolumic relaxation
Rapid diastolictime (IVRT)
filling time [14] [14,28,31]
Left ventricular
Isotonicejection
contraction time (LVET)
(IC) [14] [14,28,31,32]
Maximum Isovolumic
acceleration relaxation
in aorta time (IVRT)
(MA) [14,28,31][28,32]
Left ventricular
Pre-ejection period (PEP) ejection time (LVET) [14,28,31,32]
[28,31,32]
Maximum acceleration in aorta (MA) [28,32]
Total electromechanical systole
Pre-ejection period (PEP) period (QS2) [28,31,32][28,31,32]
Maximum blood
Total injection (MI)systole period (QS2)
electromechanical [28,31,32][28]
Isovolumic contraction
Maximum bloodtime (IVCT)
injection (MI) [28] [28,31]
Isovolumic
Left ventricular contraction
lateral time (IVCT)
wall contraction peak velocity (LCV) [28,31] [34]
Left ventricular lateral wall contraction peak velocity (LCV) [34]
Septal wall contraction peak velocity (SCV) [34]
Septal wall contraction peak velocity (SCV) [34]
Trans-aortic peak flow (AF)
Trans-aortic peak flow (AF) [34] [34]
Trans-pulmonary peak flow
Trans-pulmonary peak(PF)
flow (PF) [34] [34]
Trans-mitral
Trans-mitral ventricularventricular
relaxation relaxation flowE(MF
flow (MF ) E) [34] [34]
Atrial contraction flow (MFA ) [34]
Atrial contraction flow (MFA) [34]
Figure
Figure 1.
1. Modified
Modified Wiggers diagram. A
Wiggers diagram. A sample
sampleaxial
axialseismocardiography
seismocardiography(SCG)
(SCG)signal
signal (acceleration
(acceleration in
in
thethe dorso-ventral
dorso-ventral direction)
direction) is shown
is shown alongside
alongside other cardiovascular
other cardiovascular signals signals
such as such as the
the aortic aortic
pressure,
pressure, atrial ventricular
atrial pressure, pressure, ventricular volume, electrocardiogram,
volume, electrocardiogram, and phonocardiogram.
and phonocardiogram. The closure
The mitral valve mitral
valve
(MC) closure (MC) (MO),
and opening and opening (MO),
and aortic andclosure
valve aortic valve
(AC) closure (AC) and
and opening (AO)opening (AO)based
are labeled are labeled
on the
pressure
based on signals.
the pressure signals.Vibration 2019, 2 67
During the cardiac cycle of healthy individuals, the apex and base rotate in opposite directions,
which results in a twisting motion of the left ventricle [35] known to be affected by different factors
such as aging and diastolic dysfunction. Investigating the rotational vibration induced by this heart
twisting motion might provide complementary information to the current SCG analysis of uni- and
triaxial accelerations. In recent studies [31,36,37], a three-axis micro electromechanical systems (MEMS)
gyroscope and a three-axis accelerometer were used simultaneously to measure the rotational and axial
components of chest vibrations. The potential utility of the combined analysis of axial and rotational
heart-induced vibrations were suggested for the ECG-independent identification of systolic points
(such as AO and AC) and cardiac time intervals (such as LVET and PEP) [38].
In summary, despite many studies conducted about SCG genesis, the relationship between SCG
waves and cardiac activity is not yet fully understood. This is possibly because of the waveform
variations in different studies and lack of understanding of the exact SCG waves sources. Thus, there
is still a need for widely accepted universal labeling (i.e., valid for all/majority of patients) analogous
to PQRST labeling in ECG.
1.3. Measurement Methods
New advances and availability of lightweight low-noise accelerometers improved the quality
of recorded SCG signals. Different methods were used for SCG measurement in the recent studies,
including the following:
• Uniaxial/triaxial piezoelectric accelerometers [39–42];
• Uniaxial/triaxial MEMS accelerometers [36,43–45];
• Smartphone accelerometers and gyroscopes [46–48];
• Triaxial gyroscopes [31,36,37,45];
• Laser Doppler vibrometers [42,49];
• Microwave Doppler radars [50–52];
• Airborne ultrasound surface motion camera (AUSMC) [53].
Depending on the sensors that are used, SCG signals might consist of one or more axial and
rotational components. For example, a uniaxial accelerometer can be used to measure SCG component
in the dorso-ventral direction. However, combination of a triaxial accelerometer and triaxial gyroscope
can provide information about axial and rotational heart-induced motion in three different directions.
This review focuses on the dorso-ventral component of the SCG signal, unless otherwise stated.
Sensors are most commonly placed on (or directed to) the sternum or its left lower border.
However, in some studies, other locations were used for SCG signal acquisition, including over the
heart apex (lateral left lower chest) and the “aortic valve listening area” at the right upper sternal
boarder [34,43,44]. Information about sensor type, model, and placement location in recent studies is
summarized in Table 2 and Figure 2.Vibration 2019, 2 68
Table 2. Summary of acceleration sensors used for SCG data acquisition. Abbreviations used in
the table: Acc—accelerometer; Gyr—gyroscope; ARS—angular rate sensor; 1—-uniaxial; 2—-biaxial;
3—-triaxial; MEMS—micro electromechanical systems; SP—smart phone.
Reference Sensor Type Sensor Model Sensor Location
[54–56] 3-Acc SCA610-C21H1A, Murata Electronic 1 cm above xiphoid
[43,44] 3-MEMS-Acc MMA 7361, Freescale Semiconductor Heart apex
[57] 3-MEMS-Acc MMA 7361, Freescale Semiconductor Above xiphoid
[58] 3-MEMS-Acc Analog Devices 2 cm above xiphoid
[36,38,45] 3-MEMS-Acc KXRB5-2042, Kionix Left sternal border along the 3rd rib
3-MEMS-Gyr MPU9150, Invensense
[59] 3-Acc ViSi Mobile, Sotera Wireless Chest wall
[60,61] 1-Acc 4381, Brüel & Kjær Above xiphoid
1-Acc 393C, PCB Piezotronics
[62,63] 1-Acc DS1104, DSPACE Xiphoid process
[64] 3-Acc ADXL 335, Analog Devices Chest wall
[46] 3-SP-Acc iPhone6, Apple Midclavicular line and 4th intercostal
space
Belly above navel
[65,66] 3-Acc 356A32, PCB Piezotronics Left sternal border along the 4th
intercostal space
[67] 3-Acc X6-2mini, GCDC Left sternal border along the 4th
intercostal space
[68] 1-MEMS-Acc SCA620, Murata Sternum—anterior chest
Electronic
[25,69,70] 3-MEMS-Acc MMA8451Q, Freescale Semiconductor Sternum
[34,71] 1-Acc LIS331DLH, STMicroelectronics Mitral valve, tricuspid valve, aortic valve,
pulmonary valve
[72] 3-MEMS-Acc MMA 7361, Freescale Semiconductor Left sternal border along the 3rd rib
[73] 3-MEMS-Acc MMA8451Q, Freescale Semiconductor Sternum, aortic valve, heart apex
[74] 3-Acc CXL01LF3, Crossbow Technology Manubrium
1-Acc 7290-A, Endevco Microtron Xiphoid
[75–78] 3-Acc BMA280, Bosch Sensortec GmbH Mid-sternum
[79] 3-MEMS-Acc TSD109C, Biopac Systems Left sternal border along the 3rd rib
[41] 3-Acc 356A32, PCB Piezotronics Sternum, upper and lower sternum
[80] 1-Acc N/A Sternum
[81] 3-MEMS-Acc MMA8451Q, Freescale Semiconductor N/A
3-Gyr L3GD20, STMicroelectronics
[82] 3-Acc ADXL 335, Analog Devices Mid-sternum, upper sternum, lower
sternum
Point of max impulse, below left clavicle,
below right clavicle
[83] 3-MEMS-Acc SparkFun, Intel Edison Sensor clipped on subjects clothes
3-MEMS-Gyr
[50,51] Microwave Doppler
radar
[47,48] 3-SP-Acc Xperia Z-series, Sony Chest
[49] Laser Doppler PDV-100, Polytec
vibrometer
[37] 3-MEMS-Acc LIS344ALH, STMicroelectronics Heart apex
2-MEMS-Gyr LPY403AL, STMicroelectronics Lower back of subject between 2nd and
3rd lumbar vertebrae
[31] 3-MEMS-Acc MMA8451Q, Freescale Semiconductor Sternum
3-MEMS-ARS MAX21000, Maxim Integrated
[53] AUSMC Composed of the following sensors: ~30 × 40 cm2 thoracic and abdominal
- MA40S4S, Murata Electronics surface
- FG-23629 Knowles microphoneVibration 2019, 2 69
Vibration 2019, 3 FOR PEER REVIEW 6 of 22
Figure 2.
Figure 2. Sensor location distribution in recent
recent SCG
SCG studies.
studies.
In some
some applications,
applications, such as burn patients, patients, highly infectious patients, and premature babies,
attaching adhesive ECG electrodeselectrodes or or SCG
SCG sensors
sensors would
would not not be
be feasible.
feasible. Therefore, development of
efficient contactless
efficient contactless SCGSCG detection
detection techniques
techniques are are under
under investigation.
investigation. These techniques
techniques include laser
Doppler vibrometry (LDV), microwave Doppler radar, and airborne ultrasound imaging [22,53,84].
A non-contact
A non-contactSCG SCGmeasurement
measurementmight mightalso alsoreduce
reduceskinskin coupling
coupling artefacts
artefacts thatthat
may may be present
be present in
in the
the SCG
SCG signals
signals acquired
acquired by contact
by the the contact sensors
sensors attached
attached to theto skin.
the skin.
The LDV approach
The approach compares
compares the the frequency
frequency shiftshift between
between the outgoing
outgoing and reflected
reflected laser beams
and determines the corresponding vibration velocity velocity of the surface
surface that reflected
reflected the beam
beam [85].
Considerations when using LDV for SCG SCG measurements
measurements includeinclude thethe following:
following: (1) the chest surface
surface
needs to be be reasonably
reasonably reflective
reflective for for accurate
accurate LDV LDV measurements,
measurements, (2) the laser laser beam
beam should
should be be
perpendicular to chest surface, and (3) chest movement due to respiration needs to be accounted
perpendicular accounted for,for,
since breathing causes the point of of measurement
measurement to be be displaced
displaced in in the
the chest
chest plane.
plane. One
One solution
solution to
this issue
this issueisistotodevelop
developanan algorithm
algorithm that
that cancan automatically
automatically havehave the beam
the beam followfollow a measurement
a measurement point
point
on theon the surface.
chest chest surface.
Other Other LDV limitations
LDV limitations include include theirand
their cost cost and size.
size.
MicrowaveDoppler
Microwave Doppler radar
radar is another
is another non-contact
non-contact method method
that can be that
usedcan be used
for SCG for SCG
measurements.
measurements.
When recording Whenthe SCG recording the SCG
signal using signal Doppler
microwave using microwave
radars, theDoppler
SCG willradars,
exhibitthe SCG
in the will
phase
exhibit in of
variation thethe
phase variationsignal.
microwave of the microwave
SCG signalssignal. SCGbe
can then signals can then
extracted frombethisextracted from this
phase variation.
phaseLDV
Like variation.
sensors,LikeDoppler
LDV sensors,
radar Doppler
approaches radar approaches
have the benefit have of the benefit ofsignal
contactless contactless signal
acquisition,
acquisition,
but suffer from but the
suffer from the
reflection reflection of microwave
of background backgroundsignals microwave
(calledsignals (called radar
radar clutter) loweringclutter)
the
lowering the signal-to-noise
signal-to-noise ratio [51]. ratio [51].
The utility of ultrasound
ultrasoundimaging
imagingin inestimating
estimatingnon-contact
non-contacttwo-dimensional
two-dimensional (2D) SCG
(2D) SCG maps
mapsof
thethe
of bodybody surface
surfacewaswasalsoalsoinvestigated
investigated[53]. [53].InInaddition
additiontoto the the advantages
advantages of other contactless
contactless
measurement methods,
measurement methods, thisthis technique
technique can can collect SCG data from multiple locations through different
resulting in
channels resulting in aa potentially
potentially higherhigher reliability.
reliability. However, this method requires a planar planar
measurement surface
measurement surface that
that is
is parallel
parallel to to the
the emission
emission panel.
panel.
Piezoelectric and
Piezoelectric andMEMS
MEMSsensors sensors areare smaller
smaller andand lighter
lighter thanthan contactless
contactless sensors.
sensors. Therefore,
Therefore, these
these sensors
sensors might be might
usedbe used insettings
in clinical clinicalfor settings
everydayfor and
everyday and screening
continuous continuous screening
subjects subjects
suspected of
suspectedcardiovascular
different of different cardiovascular
diseases. diseases.
1.4.
1.4. Parameters
Parameters Affecting
Affecting SCG
SCG Waveform
Waveform
A
A main
main challenge
challengeininSCGSCGstudies
studiesisisthat
thatSCG
SCGsignal morphology
signal morphology appears
appearsto vary significantly,
to vary not
significantly,
only by cardiovascular pathology, but also normal inter-subject variation. These changes
not only by cardiovascular pathology, but also normal inter-subject variation. These changes are are affected by
several
affectedfactors including
by several respiratory
factors cycle
including phases, gender,
respiratory age, sensor
cycle phases, chestage,
gender, location,
sensorhealth
chestconditions,
location,
cardiac
health conditions, cardiac contractility, heart rhythm, and postural positions [23,25,86,87]. lead
contractility, heart rhythm, and postural positions [23,25,86,87]. While these changes can to
While
undesirable
these changesSCGcanvariability, deeper understandings
lead to undesirable SCG variability,of these processes
deeper will enhance
understandings our understanding
of these processes will
of SCG signals,
enhance help aggregateofSCG
our understanding SCGcycles intohelp
signals, groupings with SCG
aggregate similar SCGinto
cycles events to reducewith
groupings SCGsimilar
signal
variability and noise, and hopefully lead to more accurate definition of SCG features
SCG events to reduce SCG signal variability and noise, and hopefully lead to more accurate definition for diagnoses
and monitoring.
of SCG features for diagnoses and monitoring.
A few studies addressed SCG variability, e.g., the consistent effects of respiration [11,32]. One
recent study [66] reported that the SCG morphology appeared to mainly depend on the lung volumeVibration 2019, 2 70
A few studies addressed SCG variability, e.g., the consistent effects of respiration [11,32].
One recent study [66] reported that the SCG morphology appeared to mainly depend on the lung
volume (and, hence, possibly the intrathoracic pressure), rather than dependence on negative or
positive airflow (i.e., inspiration or expiration). This SCG morphology variation can also be used
to automatically identify the lung volume states and respiratory phases by employing machine
learning [56]. Another study used support vector machines to classify the SCG cycles occurring during
the high and low lung volumes [40]. Successful grouping of SCG cycles into two groups, where SCG
events in each group are more similar to each other and dissimilar to the events in the alternate group,
would improve the signal-to-noise ratio in calculating the SCG ensemble average. This would result in
more accurate estimation of diagnostic information from the SCG ensemble average.
Subject motion and postural position were also shown to cause changes in SCG signals [7,75,88].
In an ongoing study, the effect of posture on the SCG signals was investigated for patients with heart
failure (HF) [75]. The SCG signals were measured using a wearable unit in supine and seated positions.
The SCG power spectral density (PSD) was estimated using Welch’s periodogram, and the means of
PSD values were calculated in the 0–20-Hz band. The results showed that SCG signals contained high
energy in bands greater than 8 Hz in the supine and seated postures. Identification of chest orientation
(supine, 45◦ , or vertical), and, therefore, grouping of SCG signals according to chest orientation is
possible with the use of certain triaxial accelerometers [88]. However, chest orientation measurement
is not sufficient to account for all postural changes, as shown by the reported SCG differences between
sitting upright and standing, which have the same chest orientation. Movement of the patient also
produces a change in the SCG signal. The ability to filter noise originating from speaking, walking,
and indistinct motions associated with workplace tasks was demonstrated [43]. Understanding the
effects of posture and movement on the SCG waveform is a useful step toward continuous collection
of SCG signals from a patient from a wearable sensor. However, this may not be needed if intermittent
testing in a more controlled environment is performed at a fixed subject position.
Exercise and the following period of recovery was also demonstrated to produce changes in SCG
signals. Not surprisingly, exercise is associated with an increase in the overall amplitude of the SCG
signal, measured as the root-mean-square (RMS) power [89,90]. This increase in signal amplitude was
shown to correlate with increased cardiac output observed during exercise [89]. This cardiac output
increase is a result of increased heart rate and stroke volume. Exercise also produces changes in the
left-ventricular ejection time (LVET) and the pre-ejection period (PEP) [88,90]. As exercise increases
the heart rate (also seen as the R–R interval decrease in ECG), it generally causes a decrease in other
measured time intervals such as LVET and PEP. LVET correlates with both heart rate and contractility
and, hence, decreases with exercise. PEP is less affected by heart rate but does decrease during exercise
due to the increased contractility (inotropy). These changes in LVET and PEP were detectable by
SCG [88,91], and exercise-induced decrease in PEP was found to shift the SCG signal power spectrum
toward higher frequencies [78].
Digestive state and mood may affect cardiac function through similar physiological mechanisms,
thereby possibly affecting SCG signal morphology. Systematic investigations of these effects are
lacking, and future studies are needed to determine the magnitude and nature of these effects on the
SCG signal.
The sensitivity of the SCG signal to sensor location is well known and, therefore, needs to
be taken into account when comparing results from different studies. Historically, investigators
placed accelerometers at different anatomical locations, including the clavicle, the sternum, and
various intercostal spaces [34,88,89]. A recent study [34] investigated the differences in SCG signals
morphology at the common auscultation sites of the four heart valves (aortic, pulmonary, tricuspid,
and mitral), and found significant differences in SCG morphology. That study also concluded, with
the aid of sonographic measurements, that more feature points can be defined from multi-point
SCG measurements.Vibration 2019, 2 71
Due to the sensitivity of SCG signals to the measurement location, unexperienced users might not
be able to repeatably record the SCG at ideal locations. Hence, the SCG-based estimations of cardiac
activity might change significantly due to sensor location errors. This can, in turn, result in inaccurate
Vibration 2019,
Vibration 2019, 33 FOR
FOR PEER
PEER REVIEW
REVIEW 88 of
of 22
22
interpretations [41]. To overcome this issue, Ashouri and Inan [41] proposed a method to automatically
detect when the
automatically sensor
detect whenis not
theplaced
sensor in a desired
is not placedlocation by comparing
in a desired location bythe regression
comparing theparameters
regression
from the acquired SCG and an SCG measured from a reference
parameters from the acquired SCG and an SCG measured from a reference position. position.
High-spatial-resolution measurement
High-spatial-resolution measurementof ofthe
theSCG
SCGsignal
signalwaswascarried
carriedout
outinina a pilot
pilot study.
study. Here,
Here, a
alaser
laservibrometer
vibrometerwas wasused
usedtotoperform
performnon-contact
non-contactuniaxial
uniaxialSCG SCG measurements
measurements in in the
the dorso-ventral
dorso-ventral
direction. The
direction. The laser
laser beam
beam waswas 30%.An Anaccelerometer
accelerometerwith withlarger
largercontact
contactarea
area cm2cm
(3.5(3.5 ) was alsoalso
22) was usedused
and and
it was found
it was that,
found
for a sensor location change of 1 cm, the SCG amplitude changed by about
that, for a sensor location change of 1 cm, the SCG amplitude changed by about 5%. Due to this 5%. Due to this smaller
change,
smaller the largerthe
change, contact
largerarea mayarea
contact be beneficial in reducing
may be beneficial inSCG dependence
reducing on sensor placement.
SCG dependence on sensor
The effects of sensor contact area and SCG spatial distributions (including
placement. The effects of sensor contact area and SCG spatial distributions (including axial axial or rotational signals)or
need further investigations.
rotational signals) need further investigations.
Figure 3.
Figure
Figure 3.Map
3. Mapofof
Map of root-mean-square
root-mean-square
root-mean-square (RMS)(RMS)
(RMS) amplitude
amplitude
amplitude of waves
of
of SCG SCG waves
SCG waves at the
at
at the chestthe chestusing
chest
surface surface
surface using
using
scanning
scanning
scanning laser vibrometry.
laser vibrometry.
laser vibrometry. There were There
There were
localwere local amplitude
local amplitude
amplitude maxima that maxima
maxima that coincided
that with
coincided coincided with the aortic,
with pulmonary,
the aortic, the aortic,
pulmonary,
pulmonary,
tricuspid, andtricuspid,
tricuspid, and mitral
and mitral auscultation
mitral auscultation auscultation areas.
areas. Theseareas. These data
These
data suggest data suggest
thatsuggest that
sensor that sensor
sensor
location location
location
and andtosize
and
size need size
be
need
need to
to be
be chosen
chosen with
with care
care and
and that
that the
the effects
effects of
of sensor
sensor misplacement
misplacement
chosen with care and that the effects of sensor misplacement need to be quantified.need
need to
to be
be quantified.
quantified.
2. Signal
2. Signal Processing
Processing
SCG signal
SCG signalprocessing
processing usually
usually consists
consists of steps
of several several steps preprocessing
including including preprocessing
(e.g., down-
(e.g., down-sampling and denoising), signal segmentation, feature extraction, and classification
sampling and denoising), signal segmentation, feature extraction, and classification (Figure 4). There
(Figure
were 4). There
several were
recent severalthat
studies recent studies
focused onthat focused
noise on noise
removal, removal, segmentation,
segmentation, and feature
and feature extraction of
extraction
SCG signals. of SCG
Thesesignals.
studiesThese studies are
are reviewed reviewed
in this in this section.
section.
Figure 4.
Figure SCG signal
4. SCG signal processing
processing steps.
steps.
2.1. Noise Reduction
While SCG signals can contain useful diagnostic information, they are often contaminated by
noise from different sources including sensor mechano-electronics, motion artefacts, and
environmental vibrations. This signal contamination might result in errors in calculating SCG
features and eventually inaccurate signal classification, especially if automated SCG processing is
performed (i.e., without human supervision). For example, a recent study [92] showed that, whenVibration 2019, 2 72
2.1. Noise Reduction
While SCG signals can contain useful diagnostic information, they are often contaminated by noise
from different sources including sensor mechano-electronics, motion artefacts, and environmental
vibrations. This signal contamination might result in errors in calculating SCG features and
eventually inaccurate signal classification, especially if automated SCG processing is performed
(i.e., without human supervision). For example, a recent study [92] showed that, when determining the
instantaneous frequency of SCG signals using different time–frequency distributions, estimation
accuracy differed significantly with the signal-to-noise ratio. These results indicated that some
time–frequency distributions performed poorly in noisy conditions and would lead to inaccurate
time–frequency features. It was then concluded that feature extraction methods might fail or, at a
minimum, perform inaccurately for low signal-to-noise ratio conditions.
Most research groups applied conventional band-pass filters to remove baseline wandering, body
movements, and breathing artefacts from SCG signals [26,36,38,41,45,46,55,58–63,67,71,75,76,78–80,82,93].
A few studies utilized or proposed more advanced noise removal techniques [64,76,88,94–96]. A recent
study [94] proposed a filtering algorithm based on the ensemble empirical mode decomposition
(EEMD) to remove white Gaussian noise from SCG signals. This algorithm provided a higher
signal-to-noise ratio than other filters such as Wiener filters. In a different study [76], a filtering
algorithm based on empirical mode decomposition (EMD) was suggested to filter the SCG signals
recorded during walking from a wearable device. This EMD-based denoising approach appeared to
result in better estimations of PEP during walking. However, the EMD method generally suffers from
mode mixing, and the EEMD algorithm was proposed to resolve this issue [97]. Thus, employment
of EEMD in future studies might result in a more accurate denoising of SCG signals during walking,
and eventually better estimation of cardiac time intervals such as PEP. Other noise reduction methods,
including wavelet transform, adaptive filters, and morphological techniques (e.g., using top hat
transform), were also used to remove noise from SCG signals [95].
Daily physical activities, such as walking, introduce noise into the recorded SCG signals and
affect their morphology. Therefore, techniques that can remove noise from ambulatory SCG are
essential. One study [98] used an evolving fuzzy neural network algorithm to identify the SCG
cycles polluted by movement artefacts and remove them from the SCG signal. In another effort [72],
a normalized least-mean-square (NLMS) adaptive filter was utilized to cancel the motion noise from
SCG of ambulatory subjects. The results of that study showed that adaptive filtering was promising in
denoising SCG signals captured during walking. To improve these results, another study [99] utilized a
dual-sensor approach where the SCG signals from the anterior and posterior chest wall were acquired.
An NLMS adaptive filter algorithm was then used to remove the motion artefact from SCG signal.
The noise cancellation performance was calculated and compared for five different reference sensor
placement spots around the chest wall. Results showed that using two SCG sensors can lead to a better
motion noise cancellation than using a single sensor. Using multiple sensors, however, will increase
system complexity.
Some studies pointed out the importance of assessing day-to-day variability when developing a
robust system of SCG analysis. Pouyan et al. [100] proposed an algorithm based on a graph-mining
technique, called graph similarity score, which was robust to noise and day-to-day variability and
could be used to evaluate the risk of HF-related exacerbations for patients at home. A summary of
noise removal techniques utilized for SCG denoising is listed in Table 3. More studies are needed that
compare different filtering methods in clinical and ambulatory settings.Vibration 2019, 2 73
Table 3. Summary of the noise removal methods used for SCG filtration.
Method Application Reference
low-, band-, high-pass, notch Baseline wandering, breathing and [26,36,38,41,45,46,55,58–63,67,71,
filtering body movement artefact removal 75,76,78–80,82,93]
Adaptive filtering Motion artefact removal [88,95]
Averaging theory Motion artefact removal [101]
Removing respiration noise from
Comb filtering [50]
radar signal
Baseline wandering, breathing and
Empirical mode decomposition [76,94,95]
body movement artefact removal
Independent component analysis Motion artefact removal [102]
Median filtering [96]
Morphological filtering [95]
Polynomial smoothing Motion artefact removal [103]
Savitzky–Golay filtering Motion artefact removal [83,103]
Wavelet denoising Segmentation of HSs and SCG [64,95,96]
Wiener filtering [94]
2.2. Segmentation
Signal segmentation is one of the first steps in the processing of SCG signals. Segmentation
is the process of finding SCG events (i.e., cardiac cycles) in the SCG signal. Different methods and
algorithms were used for SCG segmentation. For example, Jain and Tiwari [64] proposed a three-step
algorithm where the signal was first filtered using a denoising algorithm based on discrete wavelet
transform. The denoised signal peaks were then detected using an adaptive threshold based on Otsu’s
method. The first and second components of SCG (corresponding to the first and second heart sounds,
i.e., S1 and S2) were finally identified based on the signal energy. Other methods, such as matched
filtering with a template consisting of previously identified SCG events, were also used for SCG
segmentation [66,67].
2.3. Feature Extraction
Feature extraction is yet another step of SCG signal processing. Identifying the most significant
signal features can result in efficient signal classification since these features are eventually the
inputs to machine learning algorithms. Determining the most effective and accurate techniques
to extract specific signal features is a necessary step that should be done before identification of useful
features. For example, there are different methods for estimating the time–frequency distribution
of the SCG signal. Every method has its own advantages and disadvantages, and might be suitable
for certain types of signals or under certain conditions. Several studies were done to determine the
most accurate methods for extracting time–frequency features of the SCG signals [67,104,105]. In
these studies, different time–frequency distribution techniques were utilized, including short-time
Fourier transform [67,104,105], polynomial chirplet transform (PCT) [67,105], wavelet transform
with different mother functions [67], Wigner–Ville distribution, and smoothed pseudo Wigner–Ville
distribution (SPWVD) [105]. PCT and SPWVD were found to have the most accurate time–frequency
distribution estimations and appeared more suited for determining the frequency content of SCG
signals. Using these methods, SCG signals of healthy subjects were found to contain three main
spectral peaks below 100 Hz.
Historically, feature extraction of SCG signals mostly focused on the time domain and the
frequency domain, separately. The time domain features include statistical features, such as mean,
median, and standard deviation, and features related to cardiac mechanics, such as cardiac timeVibration 2019, 2 74
intervals. The frequency domain features include statistical features and frequency coefficients obtained
from fast Fourier transform (FFT).
2.3.1. Time-Domain Features
Statistical time-domain features include those based on the entire signal, and those from divided
segments of the signal. Features from segments of the SCG signal were obtained by dividing the SCG
signal into a specific number of equal-sized bins and calculating the arithmetic mean of each bin as
a feature [56,106]. Similarly, one study divided the signal into bins; however, binning of the signal
was performed discriminately, where the signal portions corresponding to higher variation received a
higher concentration of bins [65]. That algorithm divided the bin corresponding the highest standard
deviation in a recursive fashion, until some criteria, such as reaching the desired number of bins, was
met. Other statistical time-domain features, such as mean, kurtosis, skewness, and standard deviation
were also extracted from the SCG signal [41]. Time-domain features also included features related to
cardiac mechanics, heart rate and heart rate variability, and turning point ratios [47,48]. In addition,
when the ECG R and Q information is concurrently available with the SCG fiducial points (AO, AC,
MO, and MC), certain intuitive time-domain features can be determined. These include CTIs (e.g., PEP,
isovolumic contraction time (IVCT), LVET, and isovolumic relaxation time (IVRT)) and other metrics
such as PEP/LVET ratio, (IVCT+IVRT)/LVET (also called myocardial performance index), and the
LVET/R–R-interval ratio [81,107]. Amplitudes and slopes associated with the fiducial points, such as
MC to AO slope, were used in some studies [61,107], as well as features of the SCG signal that do not
depend on specific fiducial points, such as maxima, minima, and their associated widths of specific
segments of the SCG signal [82].
2.3.2. Frequency-Domain Features
Statistical frequency-domain features include those obtained from various frequency bands, and
across the entire available frequency spectrum. Features from the frequency bands of an averaged
triaxial SCG signal were obtained by calculating the median of each band [78]. One study calculated
the approximate and spectral entropy of the 0–11-Hz frequency band [47]. The average power of
various frequency bands (0–3 Hz, 3–6 Hz, . . . , 15–18 Hz) was also utilized [41]. Various statistical
metrics, such as arithmetic mean, median, standard deviation, skewness, kurtosis, mode, average
power, sample entropy, spectral entropy, and the Kolmogorov complexity, were also calculated across
the entire available frequency band [40,41].
Other frequency-domain features include frequency coefficients such as amplitudes and
frequencies. Features were either obtained by taking the frequency amplitudes across a range of
the frequency spectrum (0–512 Hz) [56], or by taking the frequencies and amplitudes at specific peaks
of the spectrum, such as the first, second, and third peaks [41].
In summary, successful feature extraction from SCG signals results in a more efficient classification
of these signals. Different studies that investigated the utility of various feature extraction
methods/algorithms in both time and frequency domains were described in this section. However,
more studies can possibly lead to improve the available methods and define more effective features.
In addition, the features currently extracted from SCG signals can be categorized into intuitive (e.g.,
LVET) and non-intuitive (e.g., skewness) features. Future studies can also address the question of
which intuitive or non-intuitive features can be more useful in classification of SCG signals. A summary
of these features are listed in Table 4.Vibration 2019, 2 75
Table 4. Summary of the features used in machine learning algorithms for SCG signal analysis.
SCG Features Reference
Simple time domain [47,61,81,82,107]
Statistical time domain [41,56,65,106]
Simple frequency domain [41,56]
Statistical frequency domain [40,41,47,78]
2.4. Machine Learning
Applications of predictive methods such as machine learning are increasingly being used in
biomedical signal processing, including for SCG analysis. Much inter- and intra-subject variability
exists in SCG signals and machine learning can be used to automatically recognize the underlying
patterns. Some of the applications of machine learning techniques include detection of cardiovascular
disease, cardiac mechanics, and parameters affecting SCG waveform such as respiration cycles.
Some studies sought to use classification tools such as support vector machines (SVM) and neural
networks (NN) to automatically detect cardiovascular disease. An early study using NNs [107] classified
patients based on their SCG as either having coronary artery disease (CAD) or as low risk/normal.
They predicted CAD with a sensitivity of 80% and a specificity of 80%. Recent studies [47,48] sought to
classify cardiovascular conditions with SCG signals obtained via a smartphone’s inertial measurement
unit (IMU). A multi-class classifier was used [48] to classify subjects as either having ST-elevation
myocardial infarction, having atrial fibrillation, being preferred for percutaneous coronary intervention
procedure, or normal. The proposed classifier achieved classification accuracies between 70 and 79%.
However, the same study [48] created a binary classifier (normal vs. atrial fibrillation) and achieved an
accuracy of 98.7% using an SVM.
Classification was also used to detect the respiration cycles (inspiration and expiration) [56,106]
and lung volume (high and low lung volume) [40,65]. In one study [56] classifying respiration cycles,
two different training scenarios were implemented. The first was a leave-one-subject-out (LOSO)
approach, which trained the SVM on all but one subject, and tested on the subject who was left
out. The second was a subject-specific (SS) approach, which trained and tested on each subject
individually. The average accuracies for LOSO and SS were 88.1% and 95.4% respectively. Other
studies [40,65] sought to classify SCG signals according to the lung volume phases as opposed to
inspiration/expiration.
Classification methods were also utilized to help identify fiducial points on the SCG signals [61],
artefact presence in the SCG [98], and identification of the sensor location [41,82].
Other machine learning methods were used on SCG signals such as hidden Markov models
(HMM) and graph similarity analysis. An HMM-based method was used in one study [108] to estimate
the heart rate, heart rate variability, and CTIs from an SCG signal. A graph similarity analysis [78] was
used in another study through the use of k-nearest neighbor graphs on SCG signals from HF patients
to identify them as compensated (outpatient) or decompensated (hospitalized).
In summary, machine learning algorithms were used for different purposes in SCG studies,
including SCG classification into different phases of respiratory cycle (e.g., high vs. low lung volume),
determining fiducial points (e.g., IM and AO) and cardiac time intervals (e.g., PEP), and classification
of subjects into patients and low risk/normal. A summary of the machine learning algorithms used
for SCG analysis is listed in Table 5.Vibration 2019, 2 76
Table 5. Summary of the machine learning algorithms used for SCG signal analysis. NN—neural
network; SVM—support vector machine; HMM—hidden Markov model; k-NN—k-nearest neighbors;
EFuNN—Evolving Fuzzy Neural Network.
Reference
NN [107,109]
EFuNN [98,110]
SVM [40,47,56,65,106,109]
Classification
Random forest [47,109]
Logistic regression [61]
J48 decision tree [41]
Clustering k-means [109]
Regression Xgboost [82]
Graph-Similarity k-NN graph [78]
HMM Viterbi sequence [108]
3. Recent Human Studies Suggesting Clinical Utilities
Early use of SCG for cardiac diagnosis faced obstacles such as the large instrumentation size and
unclear understanding of the signal characteristics and inter- and intra-subject variabilities. However,
recent advances in sensor technologies and signal processing methods led, at least in part, to new
numerous studies that provided better insight into these issues. The high morbidity and mortality
associated with cardiovascular disease and the high cost of care may have provided motivation to more
studies that re-evaluated the feasibility and utility of seismocardiography for diagnosis and monitoring
of cardiac function [77,111,112]. Some of the studies reviewed here focused on telemonitoring of cardiac
time intervals and heart rates.
3.1. Portable Detection of SCG
Wearable technologies can continuously monitor cardiac activity outside clinics and hospitals.
This continuous monitoring might help in early detection of serious cardiac conditions, which
can enable timely intervention and potentially reduce healthcare costs. Most current wearable
cardiac activity monitoring techniques are based on ECG measurements. However, recent studies
proposed wearable SCG systems for the assessment of the mechanical aspects of cardiovascular
function, including relative changes in cardiac output, contractility, and blood pressure [113].
SCG wearable monitors might be used to assess myocardial contractility via pre-ejection period
(PEP) [81]. Another wearable system utilized triaxial accelerometers and gyroscopes to record all six
axial and rotational components of the SCG signals [36]. The rotational vibration about the longitudinal
(head-to-foot) axis showed a lower sensitivity to walking noise than other components, which might
be useful for annotation of SCG signals in ambulant subjects [36].
Today, smartphones and smartwatches are common and can be used as part of telemedicine for
real-time patient monitoring at a relatively low cost. Smartphones used SCG for continuous monitoring
of heart rate variability [114], and cardiac activity of patients suffering from heart disease [115]. In a
recent study, the feasibility and accuracy of measuring heart rate using a smartphone accelerometer
was assessed in different postural positions [46] and suggested utility of SCG for heart rate estimation.
Wearable SCGs might be contaminated with different type of noise. Therefore, investigating
the effective noise removal techniques for ambulatory subjects is needed. A few ongoing studies are
addressing this question. These studies were described in Section 2.1.
3.2. Heart Rate Monitoring
Heart rate (HR) monitoring is a common way to monitor cardiovascular function, and can
identify some abnormalities such as arrhythmia. Traditional HR estimation methods are mostlyVibration 2019, 2 77
based on ECG signal processing. SCG signals can also be used for HR estimation. SCG-based HR
estimation algorithms are not usually developed to replace the current HR monitoring methods.
Instead, SCG-based HR estimations can be used as a feature in other studies that focus on the clinical
utility of SCG, since recent studies revealed that SCG can reliably detect HR in the absence of other
modalities such as ECG. For example, Cosoli et al. [26] suggested a general algorithm that can estimate
HR from various signals, including SCG, ECG, phonocardiogram (PCG), and PPG. Considering the
ECG signal as a gold standard, the SCG HR estimation was more accurate than the estimations from
the PCG and PPG signals. Wahlstrom et al. [108] used an HMM to determine different stages of a
cardiac cycle, which were used for estimating beat-to-beat intervals. The beat-to-beat intervals of
the SCG signal were then utilized for HR and HR variability estimations. Mafi [116] suggested an
algorithm based on empirical mode decomposition and empirical wavelet transform that can extract
HR from SCG signals. Tadi et al. [25] used a Hilbert adaptive beat identification technique to determine
the heartbeat timings and inter-beat time intervals from SCG signals. An android application was
implemented based on this algorithm that could monitor the subject heart rate in real time using a
smartphone accelerometer. Tadi et al. [69] proposed an algorithm based on S-transform, Shannon
energy, and successive mean quantization transform to identify heartbeat and beat-to-beat interval
from SCGs. The algorithms proposed in the latter two studies had a high agreement with the ECG HR.
Taebi et al. [39] used SCG signals in the dorso-ventral direction to estimate the HR during different
phases of respiration in real time. Their results showed that normal subjects have a different HR during
high and low lung volumes. In a recent study [46], the heart rate was derived from a smartphone
SCG signal, and compared to that extracted from ECG. Results showed that the HR provided by SCG,
particularly in the dorso-ventral direction of the supine position, was equivalent to that provided by
conventional ECG.
3.3. Pulse Transit Time
SCG is used to estimate different cardiovascular parameters such as cardiac time intervals, pulse
transit time, and blood pressure. For example, non-contact SCG was used at different body locations for
estimating central arterial pressure and carotid arterial pressure waveforms [49,117,118]. Pulse transit
time might be estimated from the time difference between AO point on the xiphoid SCG and AO
point on the carotid SCG [119]. Blood pressure changes can be monitored using pulse transit time.
For this purpose, the pulse transit time, which was defined as the time required for the blood pressure
wave to travel from one location to another [120], was first measured from the SCG signals [121].
The measured pulse transit time was then used to estimate the patient blood pressure [79]. Based on
similar techniques, a wrist-watch, consisting of an accelerometer and an optical sensor, was developed
to monitor blood pressure [122]. In this “SeismoWatch”, the blood pressure was estimated from the
travel time of the micro-vibrations propagating from the heart to the wrist when the watch was held
against the subject’s sternum. In a different study, Di Rienzo et al. [73] developed a system that
measures SCG and PPG at multiple locations alongside the ECG signal. The pulse transit time may
then be derived from the PPG.
3.4. Cardiac Time Intervals
Cardiac time intervals were used for a long time for cardiovascular disease diagnosis [123,124].
There are various SCG-based algorithms with different levels of accuracy that were proposed
for estimating cardiac time intervals such as PEP, LVET, ICT, systolic time, and diastolic time in
healthy subjects and patients with previous heart conditions [61,108]. For example, LVET might be
estimated from SCG signals that are acquired using LDV and microwave Doppler radar [51,117].
The LVET value from non-contact SCG was similar to the value derived from a photoplethysmogram
(PPG) [117]. Rivero et al. [125] proposed a new algorithm that uses continuous wavelet transform
as a base to determine the aortic valve opening and isovolumic moment points on the SCG signal.
The electro-mechanical window (EMw) is defined as the duration between the electrical and mechanicalVibration 2019, 2 78
systole. EMw is a potential biomarker that can be utilized for diagnosing several cardiovascular
diseases. ECG and PCG signals are conventionally used to determine EMw. However, Jain et al. [57]
showed that SCG is a suitable alternative to PCG for estimating the EMw.
Analysis of SCG data recorded from the sleep patterns of a subject aboard the International Space
Station (in microgravity) resulted in accurate identification of cardiac time intervals and SCG fiducial
points (such as AO, AC, MO, MC, LVET, and PEP) with implications for future clinical application [81].
As described earlier, SCG morphology is affected by different factors such as the sensor location and
respiration. Investigating the effect of these factors on the estimation of cardiac time intervals from
SCG signals can possibly reveal clinically useful information.
3.5. SCG in Patients with Cardiac Conditions
In addition to human studies on healthy populations, there were several studies that focused on
the application of SCG in patients with cardiovascular disease. SCG signals were used for diagnosis and
monitoring of different clinical conditions such as atrial fibrillation [47,48,68,70], atrial flutter [55], heart
valve disease [37,44,80], coronary artery disease and ischemia [9,10,48], myocardial infarction [126],
heart failure [75,78,82,100,119], structural heart disease [80], and heart stress testing [58].
According to a 2017 report, the prevalence of any heart valve disease is 2.5% of the United States
population [127]. Heart sounds that are believed to be generated by opening and closure of heart
valves can be used as a diagnostic marker of these diseases. Stethoscope and PCG are the common
conventional methods for heart sound monitoring. SCG signals were reported as a potential efficient
alternative for PCG signals for monitoring of heart sound signals [44].
ECG is currently the main diagnostic method of atrial fibrillation (AF). A preclinical study [68]
investigated the usefulness of SCG for AF detection. Results suggested that the amplitude of the SCG
signal correlates to beat interval and significantly varies from beat to beat during AF. This study also
suggested that the combination of SCG and ECG may reveal certain behavior in the electromechanical
delay characteristic of AF, which may lead to extra indicators for early detection of AF.
Paukkunen et al. [55] showed that three-dimensional (3D) vector trajectory of SCG might be
useful in diagnosing atrial flutter. The results of this study suggested that the intra-subject correlation
of 3D SCGs was strong. However, the signals had a very weak inter-subject correlation. Future studies
might prove the utility of SCG 3D vector trajectory for diagnosis of different cardiovascular disease
and abnormalities.
4. Conclusions, Limitations, and Future Directions
Growth in the field of seismocardiography accelerated during the last decade. However, open
issues and limitations hamper its clinical application. Reviewed here are some of the current limitations
along with potential future work.
• SCG variability: SCG morphology is affected by different factors such as respiration, sensor
location, subject posture, the amount of chest surface soft tissue, and different heart diseases.
Although studies investigated some of these factors, further research is needed to adequately
account for SCG variations. The results of such investigations might improve utility for cardiac
disease diagnosis and monitoring.
• Lack of accepted standard for the cardio-mechanical SCG fiducial points: A small number of recent
studies focused on robust documentation of the relationship between fiducial points and their
physiological sources. In addition, SCG morphology changes with different factors (e.g., sensor
location, patient posture, etc.). It would be useful to investigate the effect of these factors on the
SCG signal fiducial points.
• SCG genesis: Although several studies aimed to elucidate the physiological source(s) of the SCG
signals, much work remains to be done. SCG signals are likely affected by extra-cardiac factorsYou can also read