Service Guidelines KING COUNTY METRO - 2015 UPDATE April 27, 2016 - Moving Forward ...
←
→
Page content transcription
If your browser does not render page correctly, please read the page content below
Attachment B

                                   KING COUNTY METRO

           Service Guidelines

                                             2015 UPDATE

April 27, 2016
      KING COUNT Y METRO STRATEGIC PL AN   (2015 UPDATE)   SERVICE GUIDELINES     A
TABLE OF CONTENTS
Introduction.........................................................................................1
Evaluating and Reporting on the Existing Network............................5
Setting target service levels.......................................................................5
Evaluating and managing system performance..........................................14
Planning and Designing Service and Service Changes........................17
Designing service.......................................................................................17
Restructuring service..................................................................................21
Planning alternative services......................................................................23
Working with partners...............................................................................25
Planning and community engagement.......................................................27
Adding, Reducing and Changing Service............................................29
Appendix 1 Centers in King County.....................................................34
Appendix 2 Corridors Evaluated for all Day and Peak Network..........36
Appendix 3 Glossary............................................................................39
SERVICE GUIDELINES KING COUNT Y METRO STRATEGIC PL AN (2015 UPDATE)Introduction
Metro uses service guidelines to evaluate, design and modify transit services to meet changing needs and to deliver
efficient, high-quality service. The guidelines help us make sure that our decision-making and recommendations to
policy makers are objective, transparent, and aligned with the region’s goals for public transportation. Use of the
guidelines fulfills Metro’s Strategic Plan Strategy 6.1.1, “Manage the transit system through service guidelines and
performance measures.”
The service guidelines establish criteria and processes that Metro uses to analyze and plan changes to the transit
system. They provide direction in the following areas:
Evaluating and Reporting on the Exisiting Network
SETTING TARGET SERVICE LEVELS
Define a process for assessing the market potential of corridors in Metro’s bus network using factors
of corridor productivity, social equity, and geographic value, and determining the appropriate level
of service for each corridor.
EVALUATING AND MANAGING SYSTEM PERFORMANCE
Establish measures for evaluating route productivity, passenger loads, and schedule reliability for
every route based on service type (urban, suburban, DART/community shuttles) to identify where
changes may be needed to improve efficiency, effectiveness and quality.
Planning and Designing Service and Service Changes
DESIGNING SERVICE
Provide qualitative and quantitative guidelines for designing specific transit routes and the overall
transit network.
RESTRUCTURING SERVICE
Define the circumstances that should prompt Metro to restructure multiple routes along a corridor or
within a larger area and how restructures should be done.
PLANNING ALTERNATIVE SERVICES
Help Metro plan, implement and manage the Alternative Services Program.
WORKING WITH PARTNERS
Describe how Metro can form partnerships to complement and expand service.
PLANNING AND COMMUNITY ENGAGEMENT
Guide the public engagement process that is part of Metro’s service planning.
Adding, Reducing and Changing Service
ADDING, REDUCING AND CHANGING SERVICE
Establish the priority order in which the guidelines will be considered as Metro makes
recommendations about adding, reducing, or adjusting service and describe how Metro will report
on the performance of individual bus routes and the Metro system as a whole.
KING COUNT Y METRO STRATEGIC PL AN (2015 UPDATE) SERVICE GUIDELINES 1How the guidelines are used
Every year, Metro uses the service guidelines to analyze the corridors and bus routes in the transit system. The
results are published in an annual Service Guidelines Report that is transmitted to the King County Council and made
available to the public.
Metro uses the results of this analysis, as well as guidelines concerning service design and alternative services, to
develop service change proposals. The guidelines analysis is one step in a planning process that starts with the
adoption of Metro’s budget and results in changes to transit service (see chart below).
Executive
Metro Metro Service Guidelines If changes, Draft transmits
system system Report with preliminary alternative proposed
Budget analysis system analysis concepts plan ordinance to Council Service
adopted begins issued annually developed developed County Council action changes
Budget Guidelines analysis Service Community Council review Service change
direction planning engagement and action implementation
• Growth Target
• Identify corridor, • Involve • Committee and • Prepare schedules,
• Reduction
• Stable
service
levels
Possible
jurisdiction and
community needs community and
jurisdictions
Council consider
proposal, Title VI
information
materials and
• Use service • Revise and analysis, public website
priorities for design guidelines adjust concepts engagement report, • Inform customers
• Investments • Develop conceptual public testimony and community
System
• Reductions changes • Council may make
performance
• Consider alternative adjustments,
services adopts ordinance
• Analyze system
impacts, Title VI
Why the guidelines were created and how they have changed
Metro’s original service guidelines resulted from the work of the 2010 Regional Transit Task Force (RTTF). King
County formed the RTTF to consider a policy framework to guide service investments or—if necessary—reduction of
the Metro Transit system.
The RTTF recommended that Metro adopt transparent, performance-based guidelines for planning service that
emphasize productivity, social equity, and geographic value.
In the four years after the service guidelines were adopted, Metro completed five Service Guidelines Reports that
evaluated system performance and identified countywide service needs, and adjusted service using the results 12
times. The County made revisions to the Service Guidelines in 2012 and 2013.
The County formed a Service Guidelines Task Force (SGTF) in 2015 to consider further refinements to the guidelines
based on the experience using them. The SGTF used the solid foundation developed in the 2010 effort to further
analyze how transit service is allocated and measured across the region. The success of the RTTF was due in part
to collaboration among King County, partner cities, regional decision makers, and diverse stakeholders. This same
approach helped the SGTF develop recommendations for improving King County’s transit system.
This 2015 update of the service guidelines incorporates the recommendations of the Service Guidelines Task Force.
We also revised the explanation of the guidelines to make them clearer and easier to understand. The update
includes the following changes:
• Modifies the way Metro evaluates corridors to better reflect productivity, social equity and geographic
value.
2 SERVICE GUIDELINES KING COUNT Y METRO STRATEGIC PL AN (2015 UPDATE)• Changes the definition of “low income” used in setting target service levels from 100 percent to 200
percent of the federal poverty level, in line with Metro’s ORCA LIFT program.
• Establishes a minimum target service level of every 60 minutes for corridors and routes.
• Provides greater protection for peak-only services in the event of major service reductions.
• Modifies Metro’s service types so that comparable services are measured against one another.
• Expands the description of Metro’s planning and public engagement process and how the agency engages
and works with the community.
• Expands the description of the Alternative Services Program as a way to meet diverse needs.
• Expands the descriptions of how Metro will partner with communities and with private partners to build
the best transit network possible.
• Expands the description of the different factors Metro considers when making investments.
• Gives more consideration to the relative impacts in all parts of the county when making service reductions.
Future guidelines
From the beginning, policymakers and Metro intended the service guidelines to be a living document; regular
updates were required by the ordinance approving the guidelines. Updates to the guidelines will continue to be
considered along with updates to the Strategic Plan for Public Transportation 2011-2021.
In 2016, Metro expects to transmit a long-range plan to the King County Council for consideration and adoption. This
long range plan establishes a future network for transit that Metro will work toward and hopes to complete in 2040.
It will include new transit corridors and connections between centers to meet the growing demand. The network will
include fixed-route service as well as a variety of Alternative Services products and ADA Paratransit, depending on
the diverse travel needs of the local community. This network will reflect local jurisdictions’ planning efforts.
In future updates to the guidelines, Metro will respond to near-term issues and will seek to align the guidelines with
the network defined in the long-range plan. In turn, the long-range plan will reflect the productivity, social equity and
geographic value principles defined in the strategic plan and service guidelines.
KING COUNT Y METRO STRATEGIC PL AN (2015 UPDATE) SERVICE GUIDELINES 34 SERVICE GUIDELINES KING COUNT Y METRO STRATEGIC PL AN (2015 UPDATE)
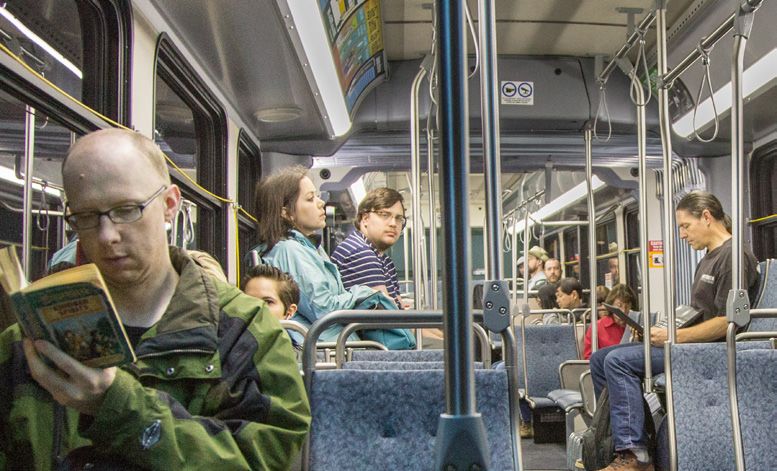
Evaluating and Reporting on the Existing Network

              SETTING TARGET SERVICE LEVELS

A major function of the service guidelines is to assess and
set target service levels for the corridors that make up
Metro’s All-Day and Peak-Only Network.

This network is a set of corridors that connect designated
regional growth centers, manufacturing/industrial centers,                       Photo
and transit activity centers. All-day service is two-way
service designed to meet a variety of travel needs and trip
purposes throughout the day. The network also includes
peak-only service that tends to travel in one direction and
provides faster travel times, accommodates high demand for
travel to and from major employment centers, and serves            Productivity
park-and-ride lots that are collection points for transit users.   Productivity is a primary value for transit
                                                                   service in King County. It means making the
For Metro’s service guidelines, corridors are defined as
                                                                   most efficient use of resources and targeting
major transit pathways that connect regional growth
                                                                   transit service to the areas of the county with
centers, manufacturing/industrial centers, activity centers,
                                                                   the most potential for use. Metro uses the
park-and-rides and transit hubs, and major destinations
                                                                   term productivity in two important ways in the
throughout King County. Routes are the actual bus services
                                                                   service guidelines:
provided. Service within a single corridor might be provided
by multiple bus routes. Almost all corridors have at least         1. Corridor productivity is the potential
one route that operates on it, but not all routes in Metro’s          market for transit based on the number
network operate on a corridor.                                        of households, jobs, students, and park-
                                                                      and-rides along the corridor. Higher
Target service levels are set by corridor rather than by route
                                                                      concentrations of people support higher use
because a corridor could be served by a single route or by
                                                                      of transit.
multiple routes.

As the region changes and corridors are added to the               2. Route productivity is the actual use of
network, a similar evaluation process is used to set target           transit, determined using two performance
service levels for the new corridors.                                 measures of ridership—rides per platform
                                                                      hour and passenger miles per platform mile.

KING COUNT Y METRO STRATEGIC PL AN      (2015 UPDATE)                                  SERVICE GUIDELINES            5
Corridor analysis
Metro establishes target service levels for the corridors in the All-Day and Peak-Only Network using a three-step
process. Service levels are very frequent, frequent, local, or hourly (see chart on p. 11).
STEP
Step one sets target service levels for each corridor based on measurable indicators of corridor
productivity, social equity, and geographic value. Indicators of productivity make up 50 percent of the
total score, while geographic value and social equity indicators each comprise 25 percent of the total score
in this step.
The use of measures related to social equity and geographic value is consistent with Metro’s Strategic
Plan. The use of social equity factors helps Metro plan transit service that provides travel opportunities
for historically disadvantaged populations (Strategy 2.1.2). Factors concerning transit activity centers and
geographic value guide service to areas of concentrated activity (Strategy 3.4.1) and ensure that services
provide value in all areas of King County. The use of productivity factors helps Metro plan and deliver
productive service throughout King County (Objective 6.1).
• Corridor productivity indicators demonstrate the potential demand for transit in a corridor using land-use
factors: the number of households, jobs, enrolled students1, and park-and-ride stalls2 located within a quarter-
mile walk to a bus stop. These factors are used because areas where many people live, work, or go to school
have high potential transit use. The quarter-mile calculation considers how well streets are connected; only
those areas that have an actual path to a bus stop are considered to have access to transit. This is an important
distinction in areas that have a limited street grid or barriers to direct access, such as lakes or freeways. Park-and-
rides are included because many people who access the transit system live outside of the quarter-mile draw area.
• Social equity indicators show how well a corridor serves any areas where there are concentrations of minority
and low-income populations along the corridor. This is done by comparing boardings in these areas against
the systemwide average of all corridor boardings within minority and low-income census tracts.3 Metro assigns
the highest value to corridors with concentrations of boardings in low-income or minority census tracts that are
higher than the system average. Those close to the system average, but just below, are also awarded value in this
process.
• Geographic value indicators establish how well a corridor supports connections and service to transit activity
centers, regional growth centers, and manufacturing/industrial centers4 throughout King County. All connections
between centers are important and are given value in this process. Corridors that are the primary connections
between centers, based on ridership and travel time, receive higher value in this process. King County centers are
described on p. 15 of the strategic plan and are listed in Appendix 1 of this document.
1
An enrolled student is one who attends classes in a degree-conferring institution.
2
Park-and-ride stalls are added at a factor of 1.1 to account for carpool usage. According to the Washington State Department of Transportation
(WSDOT), the average occupancy of a parked car is very near 1 with the highest being 1.102 passengers per parked car. See WSDOT’s report:
How Can We Maximize Efficiency and Increase Person Occupancy at Overcrowded Park and Rides?
3
Low-income tracts are those where a greater percentage of the population than the countywide average has low incomes (less than 200% of the
federal poverty level depending on household size), based on current American Community Survey data. Minority tracts are defined as tracts where a
greater percentage of the population than the countywide average is minority (all groups except White, non-Hispanic), based on current census data.
4
“Centers” are areas that are important for Metro to serve. Transit activity centers, identified by Metro, are areas with relatively high transit use.
Regional growth centers and manufacturing/industrial centers, designated by the Puget Sound Regional Council, are areas with dense population,
employment, and manufacturing and industrial activity.
6 SERVICE GUIDELINES KING COUNT Y METRO STRATEGIC PL AN (2015 UPDATE)Scoring: The following table shows the measures of corridor productivity, social equity and geographic value and the
points that would be assigned (out of a total 40) to determine the corridor’s preliminary score in the corridor analysis.
THRESHOLDS AND POINTS USED TO SET SERVICE LEVELSOLDS AND POINTS USED TO T
SVICE LEVELS
Factor Measure Threshold Points
>3,000 Households & park-and-ride stalls/
10
Corridor mile
>2,400 Households & park-and-ride stalls/
8
Corridor mile
Households and park-and-ride stalls (with a
factor of 1.1 to include carpools) within ¼ mile >1,800 Households & park-and-ride stalls/
6
of stops per corridor mile Corridor mile
>1,200 Households & park-and-ride stalls/
4
Corridor mile
>600 Households & park-and-ride stalls/
Corridor 2
Corridor mile
productivity
>10,250 Jobs & students/Corridor mile 10
>5,500 Jobs & students/Corridor mile 8
Jobs and student enrollment at universities and
colleges within ¼ mile of stops per corridor mile >3,000 Jobs & students/Corridor mile 6
>1,400 Jobs & students/Corridor mile 4
>500 Jobs & students/Corridor mile 2
Above system average 5
Just below system average
Percent of boardings in low-income census tracts 3
(.5 standard deviations5)
Below system average 0
Social equity
Above system average 5
Just below system average
Percent of boardings in minority census tracts 3
(.5 standard deviations5)
Below system average 0
Primary connection between regional growth,
manufacturing/industrial centers Yes 10
Primary connections between transit activity
Geographic center and regional growth, manufacturing/ Yes 7
value industrial centers
Primary connection between transit activity centers Yes 5
Other connection to any center Yes 2
5
Standard deviation is a measure of how spread out the numbers are. It is a statistic that describes the average difference between the values
in the dataset and the average value of that dataset.
KING COUNT Y METRO STRATEGIC PL AN (2015 UPDATE) SERVICE GUIDELINES 7The table below shows the initial target service level that would be assigned to a corridor based on the number of
points awarded for the corridor productivity, social equity and geographic value factors of that corridor. Service levels
are very frequent, frequent, local, or hourly.
SCORES USED TO SET INITIAL SERVICE LEVELS (STEP 1)
Scoring Minimum Peak Service Minimum Off-Peak Minimum Night Service Service Level
Range Frequency Service Frequency Frequency Assigned
(minutes) (minutes) (minutes)
25-40 15 15 30 Very frequent
19-24 15 30 30 Frequent
10-18 30 30 --* Local
0-9 60 60 -- Hourly
*Night service on local corridors is determined by ridership and connections.
8 SERVICE GUIDELINES KING COUNT Y METRO STRATEGIC PL AN (2015 UPDATE)Step
Step two adjusts the target service level assigned in step one to accommodate actual ridership.
Metro increases a corridor’s target service level if service at the level established under step one would
not accommodate existing riders, would be inconsistent with policy-based service levels set for RapidRide,
or would result in an incomplete network of night service6. Adjustments are only made to assign a higher
service level to a corridor; service levels are not adjusted downward in this step.
The table below shows how Metro adjusts the target service levels set in step one to ensure that the All-Day
and Peak-Only Network accommodates current riders or to preserve a complete network of night service.
6
Night service includes any trips between 7 p.m. and 5 a.m., seven days a week. Please refer to the Summary of Typical Service Levels table for target
night service levels (p. 13). An incomplete network of night service is defined as a network in which night service is not provided on a primary
connection between regional growth centers or on a corridor with frequent peak service. Provision of night service on such corridors is important to
ensure system integrity and social equity during all times of day.
THRESHOLDS USED TO ADJUST SERVICE LEVELS (STEP 2)L
Adjustment to Warranted Frequency
Factor Measure Threshold Service Level Step 1 Frequency Adjusted
Adjustment (minutes) Frequency
(minutes)
15 or more
Estimated ratio of 15 or 30
>110% of the established Increase two frequent
maximum load to
passenger load threshold service levels
the established ≥ 60 15
Ridership passenger load
(Load) threshold7 by time 15 or more
15
of day – if existing frequent
>55% of the established Increase one
riders were served 30 15
passenger load threshold service level
by step-one service
levels ≥ 60 30
Primary connection between
Add night service -- ≥ 60
Service Connection regional growth centers
span8 at night
Add night service
Frequent peak service -- 30
7
This ratio is calculated by dividing the maximum load along a route by the passenger load threshold. The passenger load threshold is equal to the
number of seats on the bus, plus an allowance of four square feet per standing passenger.
8
Service span: The span of hours over which service is operated. Service span often varies by day of the week. For example, a route’s service span
could be from 5 a.m. to 9 p.m.
Metro also adjusts service levels on existing and planned RapidRide corridors to ensure that assigned target service
frequencies are consistent with policy-based service frequencies for the RapidRide program: more frequent than 15
minutes during peak periods, 15 minutes or more frequent during off-peak periods, and 15 to 30 minutes at night.
Where policy-based service frequencies are higher than service frequencies established in step two, frequencies are
improved to the minimum specified by policy.
The combined outcome of steps one and two is a set of corridors with all-day service levels that reflect factors
concerning productivity, social equity, geographic value, and actual ridership. These corridors are divided into service
levels based on the frequency of service, as described in the “Service Levels” section that follows. Corridors with the
highest frequency would have the longest span of service.
KING COUNT Y METRO STRATEGIC PL AN (2015 UPDATE) SERVICE GUIDELINES 9Step
Step three evaluates peak-only service to determine the value it provides in addition to other
service provided on corridors in the network. Peak-only service operates only during peak travel periods
(5-9 a.m. and 3-7 p.m. weekdays), primarily in one direction. Peak-only service typically brings riders from
residential areas to job centers in the morning with return service from the job centers in the afternoon.
All-day routes also offer service during peak periods, but are not included in the peak-only analysis.
Peak service thresholds ensure that peak-only service has higher ridership and/or faster travel times than
provided in the network of all-day service. Service levels on peak-only routes are established separately
from the all-day network because of this specialized function within the transit network.
THRESHOLDS FOR PEAK SERVICE
Factor Measure Threshold
Travel time relative to all-day
Travel time should be at least 20% faster than the all-day
Travel time service provided during peak
service, as measured during peak periods
periods
Rides per trip should be 90% or greater compared to the all-
Ridership Rides per trip
day service provided during peak periods
Peak-only service is provided for a limited span compared to all-day service. Peak-only service generally has a minimum
of eight trips per day on weekdays only (morning trips travel from residential areas to job centers, and afternoon trips
take riders from the job centers back to the residential areas). The exact span and number of trips for each peak-only
route are determined by the level of demand for service that meets the travel time and ridership criteria.
Because of the value that peak-only service provides in the network, it is protected in any potential reduction
scenario. Peak-only service is lower priority for reduction if it is in the bottom 25 percent, but passes one or both of
the travel time and ridership criteria described above. If peak-only service does not meet the load and travel-time
thresholds but serves an area that has no other service, Metro may consider preserving service or providing service
in a new or different way, such as connecting an area to a different destination or providing alternatives to fixed-
route transit service, consistent with strategic plan Strategy 6.2.3.
10 SERVICE GUIDELINES KING COUNT Y METRO STRATEGIC PL AN (2015 UPDATE)Service levels
All-day services are categorized by level of service into four levels, plus peak-only and alternative services. Service
levels are primarily defined by the frequency and span of service they provide. The table below shows the typical
characteristics of each level. Some services may fall outside the typical frequencies, depending on specific conditions
in the corridor served.
SUMMARY OF TYPICAL SERVICE LEVELS
Service Level: Frequency (minutes) and Time Period
Service Level Peak Off-peak Night Days of Service Hours of Service
15 or more 15 or more 30 or more
Very frequent 7 days 16-24 hours
frequent frequent frequent
15 or more
Frequent 30 30 7 days 16-24 hours
frequent
Local 30 30 - 60 --* 5-7 days 12-16 hours
Hourly 60 60 -- 5 days 8-12 hours
8 trips/day
Peak-only -- -- 5 days Peak
minimum
Alternative
Determined by demand and community collaboration process
Services
*Night service on local corridors is determined by ridership and connections.
• Very frequent services provide the highest levels of all-day service. Very frequent corridors serve very large
employment and transit activity centers and very dense residential areas.
• Frequent services provide high levels of all-day service. Frequent corridors generally serve major employment
and transit activity centers and very dense residential areas.
• Local services provide a moderate level of all-day service. Local corridors generally serve regional growth
centers and residential areas with low to medium density.
• Hourly services provide all-day service at 60 minute frequencies. Corridors generally connect low-density
residential areas to regional growth centers.
• Peak-only services provide specialized service in the periods of highest demand for travel. Peak services
generally provide service to a major employment center in the morning and away from a major employment
center in the afternoon.
• Alternative service is any non-fixed-route service directly provided or supported by Metro. These are further
described in the “Planning Alternative Services” section, p. 23.
KING COUNT Y METRO STRATEGIC PL AN (2015 UPDATE) SERVICE GUIDELINES 11Target service level comparison
The corridors in the All-Day and Peak-Only Network are analyzed annually in Metro’s Service Guidelines Report. The
report compares the target service levels set through the corridor analysis with existing levels of service. A corridor
is determined to be either “below,” “at” or “above” its target service level. This process is called the target service-
level comparison, and is used to inform potential changes to bus routes. For example, in simple terms, a corridor
below its target service level would be a candidate for investment and a corridor above its target service level could
be a candidate for reduction. This target service level comparison is a factor in both the investment and reduction
priorities, as described in the “Adding, Reducing and Changing Service” section. Using the results of the annual
corridor analysis and as resources allow, Metro adjusts service levels to better meet the public transportation needs
of King County. The corridor analysis process is summarized in the chart below.
CORRIDOR ANALYSIS SUMMARY
STEP SET INITIAL TARGET SERVICE LEVELS
Factor Purpose
Corridor productivity Support areas of higher employment and household density
Support areas with high student enrollment
Support function of park-and-rides in the transit network
Social equity and geographic Serve historically disadvantaged communities
value Provide appropriate service levels throughout King County for connections between all
centers
STEP ADJUST TARGET SERVICE LEVELS
Factor Purpose
Ridership (Loads) Provide sufficient capacity for existing transit demand
Service span Provide adequate levels of service throughout the day to meet demand
STEP EVALUATE PEAK-ONLY SERVICE
Factor Purpose
Travel time Ensure that peak-only service provides a travel time advantage compared to other service
alternatives
Ridership Ensure that peak-only service is well utilized compared to other service alternatives
OUTCOME: ALL-DAY AND PEAK-ONLY NETWORK
12 SERVICE GUIDELINES KING COUNT Y METRO STRATEGIC PL AN (2015 UPDATE)Evaluating new service
Metro’s long-range plan will respond to King County growth by defining a future transit network and service levels
that are based on the current network with additional corridors. Metro will use the service guidelines, along with
extensive input from cities and community members, to identify and evaluate service corridors in the long-range
plan. As the region continues to grow, new services and service corridors can be added to future long-range plan
updates through a planning process guided by the principles in the service guidelines.
Centers in King County
The list of centers associated with the All-Day and Peak-Only Network is adopted by the King County
Council as part of the service guidelines. The region’s growth and travel needs change over time, and
centers may be added to the list in future updates of the service guidelines as follows:
Regional Growth Centers and Manufacturing/Industrial Centers
Additions to and deletions from the regional growth and manufacturing/industrial centers lists should
be based on changes approved by the Puget Sound Regional Council and defined in the region’s growth
plan, Vision 2040, or subsequent regional plans.
Transit Activity Centers
Additions to the list of transit activity centers will be nominated by the local jurisdictions and must meet
one or more of the following criteria:
• Is located in an area of mixed-use development that includes concentrated housing, employment,
and commercial activity.
• Includes a major regional hospital, medical center or institution of higher education located outside
of a designated regional growth center.
• Is located outside other designated regional growth centers at a transit hub served by three or more
all-day routes.
In addition to meeting at least one of the criteria above, a transit activity center must meet the following
criteria:
• Pathways through the transit activity centers must be located on arterial roadways that are
appropriately constructed for transit use.
• Identification of a transit activity center must result in a new primary connection between two or more
regional or transit activity centers in the transit network, either on an existing corridor on the All-Day
and Peak-Only Network or as an expansion to the network to serve an area of projected all-day transit
demand.
• When a corridor is added to the network, step one of the All-Day and Peak-Only Network analysis
must result in an assignment of a 30-minute target service level or better.
The size of transit activity centers varies, but all transit activity centers represent concentrations of
activity in comparison to the surrounding area.
• Additional centers and corridors may be established by Metro’s long-range plan network, under
development with the community and local jurisdictions.
KING COUNT Y METRO STRATEGIC PL AN (2015 UPDATE) SERVICE GUIDELINES 13EVALUATING AND MANAGING SYSTEM PERFORMANCE Metro manages the performance of bus routes to improve the efficiency, effectiveness and quality of the transit system. Performance management guidelines are applied to individual routes to identify high and low performance, areas where investment is needed, and areas where resources are not being used efficiently and effectively. Service types and route productivity When comparing the productivity of individual bus routes, Metro classifies them by service type, which indicates the primary market served as well as other characteristics of service described below. These service types allow Metro to measure the performance of routes against similar services. • Urban routes primarily serve the densest parts of the county: the PSRC-designated Regional Growth Centers of Seattle Downtown, First Hill/Capitol Hill, South Lake Union, the University Community, and Uptown. • Suburban routes primarily serve passengers in suburban and rural areas in Seattle and King County. • Dial-A-Ride Transit and shuttles are those that provide flexible, community-based service that has different characteristics than the fixed-route system. These services are held to different standards than those outlined for the fixed-route network below. These standards are under development and will be included in Metro’s annual service guidelines reports. These services are described in more detail in the “Planning Alternative Services” section, p. 23. High and low performance thresholds differ for routes that serve urban areas and those that serve suburban areas. Regional growth centers in the Seattle core and the University District have the highest job and residential densities in the county. Because the potential market for transit is so high, routes serving these areas are expected to perform at a higher level. These routes comprise the Urban category and are given higher performance thresholds compared to other routes. The other routes, which make up the Suburban category, meet important transit needs of areas that generally have lower job and residential densities. Performance thresholds are lower for these routes because they are different from markets served in other areas of King County. Service types are based on these two primary market types, as well as other characteristics of service, to ensure that like services are compared. The performance management analysis uses route productivity measures to identify fixed-route service where performance is strong or weak as candidates for addition, reduction, or restructuring for each service type. The measures for evaluating fixed-route service productivity are rides per platform hour and passenger miles per platform mile. • Rides per platform hour is a measure of the number of riders who board a transit vehicle relative to the total number of hours that a vehicle operates (from leaving the base until it returns). • Passenger miles per platform mile is a measure of the total miles riders travel on a route relative to the total miles that a vehicle operates (from leaving the base until it returns). Two measures are used to reflect the different values that services provide in the transit system. Routes with a higher number of riders getting on and off relative to the time in operation perform well on the rides-per-platform-hour 14 SERVICE GUIDELINES KING COUNT Y METRO STRATEGIC PL AN (2015 UPDATE)
measure; an example is a route that goes through the urban core with lots of riders taking short trips. Routes with
full and even loading along the route perform well on the passenger-miles-per-platform-mile measure; an example is
a route that fills up at a park-and-ride and is full until reaching its destination.

Low performance is defined as route productivity that ranks in the bottom 25 percent of all routes within a service
type and time period; high performance is defined as route productivity in the top 25 percent. Fixed-route services
in the bottom 25 percent on both route productivity measures are identified as the first candidates for potential
reduction if service must be reduced. However, reduction of these routes is not automatic; other factors are
considered as well. For more information, see p. 30.

Thresholds for the top 25 percent and the bottom 25 percent are identified for peak, off-peak, and night time periods
and Urban and Suburban destinations for each of the two performance measures.

Passenger loads
Passenger loads are measured to identify overcrowded services as candidates for increased investment.
Overcrowding is a problem because buses may pass up riders waiting at stops, riders may choose not to ride if other
transportation options are available, and overcrowded buses often run late because it takes longer for riders to board
and to get off at stops.

Passenger loads are averaged on a per trip basis using counts from an entire service change period (about six
months). Trips must have average maximum loads higher than the thresholds for the entire service change period to
be identified as overcrowded. Two metrics are used to measure passenger loads: crowding and the amount of time
the bus has a standing load (standing load time).

Overcrowding occurs when the average maximum load of a trip exceeds its passenger load threshold. A passenger
load threshold is calculated for each trip, based on the characteristics of the bus type scheduled for the trip. This
threshold is determined by:

    • The number of seats on the bus, plus

    • The number of standing people that can fit on the bus, when each standing person is given no less than
      4 square feet of floor space.
A trip’s standing load time is determined by measuring the amount of time that the number of passengers on the bus
exceeds the number of seats.

    • No trip on a route should have a standing load for more than 20 minutes.
Routes with overcrowded trips or standing loads for more than 20 minutes are identified as candidates for invest-
ment. These candidates are analyzed in detail to determine appropriate actions to alleviate overcrowding, including:

    • Assigning a larger vehicle to the trip, if available

    • Adjusting the spacing of trips within a 20-minute period

    • Adding trips.

KING COUNT Y METRO STRATEGIC PL AN      (2015 UPDATE)                                   SERVICE GUIDELINES              15
Schedule reliability
Metro measures schedule reliability to identify routes that are candidates for investment because they provide poor
quality service.
Schedule reliability is measured for all Metro transit service. Service should adhere to published schedules, within
reasonable variance based on time of day and travel conditions. “On time” is defined as an arrival at designated
points along a route9 that is no more than five minutes late or one minute early relative to the scheduled arrival time.
When identifying candidates for remedial action, Metro focuses on routes that are regularly running late.
To do this, Metro identifies trips that exceed the lateness thresholds (shown below). If a trip experiences lateness that
exceeds the thresholds, it can be identified for investment. Investment can include improvements in route design,
schedule, or traffic operations. Schedule reliability can also be improved through speed and reliability improvements,
such as business access and transit lanes, queue jumps, transit signal priority and other transit priority treatments.
Time Period Lateness Threshold
Weekday average > 20%
Weekday PM peak average > 35%
Weekend average > 20%
Metro allows for a higher lateness threshold in the PM peak period to account for increased passenger demand and
higher levels of roadway congestion experienced during this time period.
Metro actively manages the headways of RapidRide service, primarily in peak periods, with a goal of providing
riders with a high-frequency service where they do not rely on paper timetables. High frequencies and real-time
information are intended to give riders a reliable service. When actual service has gaps that are three minutes more
than the intended headway, service is considered late. With that difference in mind, “lateness” on RapidRide service
uses the same thresholds as shown above.
Routes that operate with a headway that is less frequent than every 10 minutes that do not meet performance
thresholds will be given priority for schedule adjustment or investment. Routes that operate with a headway of every
10 minutes or more frequent that do not meet performance thresholds will be given priority for speed and reliability
investments to improve traffic operations. It may not be possible to improve through-routed routes10 that do not
meet performance thresholds because of the high cost and complication of separating routes.
Other considerations: External factors affecting reliability
Action alternatives:
• Adjust schedules/add run time
• Adjust routing
• Invest in speed and reliability improvements.
9
Metro measures schedule reliability based on the arrival time of a given coach at designated points along a route. At the time the Strategic Plan
and Service Guidelines were transmitted to the King County Council, Metro calculated this measure using the coach’s arrival at time points. As Metro
transitions with the Stop-Based Scheduling project, Metro will calculate this measure based on the coach’s arrival at stops along a route, providing
Metro with more data and improved accuracy for measuring schedule reliability.
10
Through-routed services are routes that arrive at the end of one route and continue on as a different route. For example, Route 5 between Shoreline
and Downtown Seattle continues on as Route 21 between downtown Seattle and Westwood Village.
16 SERVICE GUIDELINES KING COUNT Y METRO STRATEGIC PL AN (2015 UPDATE)Planning and Designing Service and Service Changes
DESIGNING SERVICE
Metro uses the following service design guidelines to develop transit routes and the overall transit network. Based
on industry best practices for designing service, these guidelines help us enhance transit operations and improve the
rider experience. The guidelines include both qualitative considerations and quantitative standards for comparing
and measuring specific factors.
Network connections
Routes should be designed in the context of the entire transportation system, which includes local and regional
bus routes, light-rail lines, commuter rail lines and other modes. When designing a network of services, Metro
should consider locations where transfer opportunities could be provided for the convenience of customers and
to improve the efficiency of the transit network. Where many transfers are expected to occur between services of
different frequencies, timed transfers should be maintained to reduce customer wait times.
Multiple purposes and destinations
Routes are more efficient when designed to serve multiple purposes and destinations rather than specialized
travel demands. Routes that serve many rider groups rather than a single group appeal to more potential
riders and are more likely to be successful. Specialized service should be considered when there is sizable and
demonstrated demand that cannot be adequately met by more generalized service.
Easy to understand, appropriate service
A simple transit network is easier for riders to understand and use than a complex network. Routes should have
predictable and direct routings, and the frequency and span of service should be appropriate to the market
served. As budget allows, routes should be targeted for a minimum service level of at least every 60 minutes.
If a route cannot support this frequency level, it should be a candidate for alternative services as funding allows
and the service meets the allocation criteria. Routes should serve connection points where riders can transfer to
frequent services, opening up the widest possible range of travel options.
Route spacing and duplication
Routes should be designed to avoid competing for the same riders. Studies indicate that people are willing to
walk 1/4 mile on average to access transit, so in general routes should be no closer together than 1/2 mile.
Services may overlap where urban and physical geography makes it necessary, where services in a common
segment serve different destinations, or where routes converge to serve regional growth centers. Where services
do overlap, they should be scheduled together, if possible, to provide effective service along the common routing.
KING COUNT Y METRO STRATEGIC PL AN (2015 UPDATE) SERVICE GUIDELINES 17Routes are defined as duplicative in the following circumstances:
• Two or more parallel routes operate less than 1/2 mile apart for at least one mile, excluding operations within
a regional growth center or approaching a transit center where pathways are limited.
• A rider can choose between multiple modes or routes connecting the same origin and destination at the same
time of day.
• Routes heading to a common destination are not spaced evenly (except for operations within regional growth
centers).
Route directness
A route that operates directly between two locations is faster and more attractive to riders than one that takes
a long, circuitous path. Circulators or looping routes do not have competitive travel times compared to walking
or other modes of travel, so they tend to have low ridership and poor performance. Some small loops may
be necessary to turn the bus around at the end of routes and to provide supplemental coverage, but such
extensions should not diminish the overall cost-effectiveness of the route. Directness should be considered in
relation to the market for the service.
Route deviations are places where a route travels away from its major path to serve a specific destination. For
individual route deviations, the delay to riders on board the bus should be considered in relation to the ridership
gained on a deviation. New deviations may be considered when the delay is less than 10 passenger-minutes per
person boarding or exiting the bus along the deviation.
Riders traveling through x Minutes of deviation
≤ 10 minutes
Boardings and exitings along deviation
Bus stop spacing
Bus stops should be spaced to balance the benefit of increased access to a route against the delay that an
additional stop would create for all other riders. While close stop-spacing reduces walk time, it may increase
total travel time and reduce reliability, since buses must slow down and stop more frequently.
Service Average Stop Spacing
RapidRide ½ mile
All other services ¼ mile
Portions of routes that operate in areas where riders cannot access service, such as along freeways or limited-
access roads, should be excluded when calculating average stop spacing. Additional considerations for bus stop
spacing include the pedestrian facilities, the geography of the area around a bus stop, passenger amenities, and
major destinations.
Route length and neighborhood route segments
A bus route should be long enough to provide useful connections for riders and to be more attractive than other
travel modes. A route that is too short will not attract many riders, since the travel time combined with the wait
for the bus is not competitive compared to the time it would take to walk. Longer routes offer the opportunity to
make more trips without a transfer, resulting in increased ridership and efficiency. However, longer routes may
18 SERVICE GUIDELINES KING COUNT Y METRO STRATEGIC PL AN (2015 UPDATE)also have poor reliability because travel time can vary significantly from day to day over a long distance. Where
many routes converge, such as in regional growth centers, they may be through-routed to increase efficiency,
reduce the number of buses providing overlapping service, and reduce the need for layover space in congested
areas.
In some places, routes extend beyond regional growth centers and transit activity centers to serve less dense
residential neighborhoods. Where routes operate beyond centers, ridership should be weighed against the time
spent serving neighborhood segments, to ensure that the service level is appropriate to the level of demand.
The percent of time spent serving a neighborhood segment, which are defined as ≤ 20% of the total mileage
length of a route, should be considered in relation to the percent of riders boarding and exiting on that segment.
Percent of time spent serving neighborhood segment
≤ 1.211
Percent of riders boarding/exiting on neighborhood segment
Operating paths and appropriate vehicles
Buses are large, heavy vehicles and cannot operate safely on all streets. Services should operate with vehicles
that are an appropriate size to permit safe operation while accommodating demand. Buses should be routed
primarily on arterial streets and freeways, except where routing on local or collector streets is necessary to
reach layover areas or needed to ensure that facilities and fleet used in all communities is equivalent in age
and quality. Appropriate vehicles should be assigned to routes throughout the county to avoid concentrating
older vehicles in one area, to the extent possible given different fleet sizes, technologies and maintenance
requirements.
Bus routes should also be designed to avoid places where traffic congestion and delay regularly occur, if it
is possible to avoid such areas while continuing to meet riders’ needs. Bus routes should be routed, where
possible, to avoid congested intersections or interchanges unless the alternative would be more time-consuming
or would miss an important transfer point or destination.
Route terminals
The location where a bus route ends and the buses wait before starting the next trip must be carefully selected.
Priority should be given to maintaining existing layover spaces at route terminals to support continued and
future service. People who live or work next to a route end may regard parked buses as undesirable, so new
route terminals should be placed where parked buses have the least impact on adjoining properties, if possible.
Routes that terminate at a destination can accommodate demand for travel in two directions, resulting in
increased ridership and efficiency. Terminals should be located in areas where restroom facilities are available for
operators, taking into account the times of day when the service operates and facilities would be needed. Off-
street transit centers should be designed to incorporate layover space.
Fixed and variable routing
Bus routes should operate as fixed routes in order to provide a predictable and reliable service for a wide range
of potential riders. However, in low-density areas where demand is dispersed, demand-responsive service may
be used to provide more effective service over a larger area than could be provided with a fixed route. Demand-
responsive service may be considered where fixed-route service is unlikely to be successful or where unique
conditions exist that can be met more effectively through flexible service.
11
The value of the service extended into neighborhoods beyond major transit activity centers should be approximately equal to the investment made to
warrant the service. A 1:1 ratio was determined to be too strict, thus this ratio was adjusted to 1.2.
KING COUNT Y METRO STRATEGIC PL AN (2015 UPDATE) SERVICE GUIDELINES 19Bus stop amenities and bus shelters
Bus stop amenities should be installed based on ridership in order to benefit the largest number of riders. Bus
stop amenities include such things as bus shelters, seating, waste receptacles, lighting, information signs, maps,
and schedules. In addition to ridership, special consideration may be given to areas where:
• high numbers of transfers are expected
• waiting times for riders may be longer
• stops are close to facilities such as schools, medical centers, or senior centers
• the physical constraints of bus stop sites, preferences of adjacent property owners, and construction costs
could require variance from standards.
Major infrastructure such as elevators and escalators will be provided where required by local, state, and federal
regulations.
RIDERSHIP GUIDELINES FOR BUS STOP AMENITIES
RapidRide Routes
Level of amenity Weekday Boardings
Station 150+
Enhanced stop 50-149
Standard stop Less than 50
All Other Metro Routes
Location Level of amenity Weekday Boardings
City of Seattle Standard shelter and bench 50
Outside Seattle Standard shelter and bench 25
20 SERVICE GUIDELINES KING COUNT Y METRO STRATEGIC PL AN (2015 UPDATE)RESTRUCTURING SERVICE
Service restructures are changes to multiple routes along a corridor or within a large area consistent with the service
design criteria in this document. Restructures may be prompted by a variety of circumstances, and in general are made
to improve the efficiency and effectiveness of transit service as a whole, to better integrate with the regional transit
network, or to reduce Metro’s operating costs because of budget constraints. When planning for service restructures,
factors other than route performance are taken into account, such as large-scale service and capital infrastructure
enhancements. Restructures may result in the modification, addition, and deletion of corridors that align with future
corridors in the long-range plan. These changes must be approved by council as part of a service change package.
• Under all circumstances, whether adding, reducing or maintaining service hours, service restructures will
have the goals of focusing frequent service on the service segments with the highest ridership and route
productivity, creating convenient opportunities for transfer connections between services, and matching
capacity to ridership demand to improve the productivity and cost-effectiveness of service.
• Service restructures to manage the transit system will have a goal of increasing ridership.
• Under service reduction conditions, service restructures will have an added goal of an overall net reduction of
service hours invested.
• Under service addition conditions, service restructures will have the added goals of increasing service levels
and ridership.
When one or more circumstances trigger consideration of restructures, Metro specifically analyzes:
• Impacts on current and future travel patterns served by similarly aligned transit services.
• Passenger capacity of the candidate primary route(s) relative to projected consolidated ridership.
• The cost of added service in the primary corridor to meet projected ridership demand relative to cost savings
from reductions of other services.
Restructures will be designed to reflect the following:
• Service levels should accommodate a projected minimum of 80 percent of the expected passenger loads per
the established loading guidelines.
• When transfers are required as a result of restructures, the resulting service will be designed for convenient
transfers. Travel time penalties for transfers should be minimized.
• A maximum walk distance goal of 1/4 mile in corridors where service is not primarily oriented to freeway or
limited-access roadways. Consideration may be given to exceeding this maximum distance where the walking
environment supports pedestrians or at transfer locations between very frequent services.
KING COUNT Y METRO STRATEGIC PL AN (2015 UPDATE) SERVICE GUIDELINES 21Based on these guidelines, Metro will recommend specific restructures that have compatibility of trips, have capacity
on the consolidated services to meet anticipated demand, and can achieve measurable savings relative to the
magnitude of necessary or desired change.
After a service restructure, Metro will regularly evaluate the resulting transit services and respond to chronically
late performance and passenger loads that exceed the performance management guidelines as part of the ongoing
management of Metro’s transit system.
Key reasons that will trigger consideration of restructures include:
Sound Transit or Metro service investments
• Extension or service enhancements to Link light rail, Sounder commuter rail, and Regional Express bus
services.
• Expansion of Metro’s RapidRide network, investment of partner or grant resources, or other significant
introductions of new Metro service.
Corridors above or below the All-Day and Peak-Only Network target service level
• Locations where the transit network does not reflect current travel patterns and transit demand due to changes
in travel patterns, demographics, or other factors.
Services compete for the same riders
• Locations where multiple transit services overlap, in whole or in part, or provide similar connections.
Mismatch between service and ridership
• Situations where a route serves multiple areas with varying demand characteristics or situations where
ridership has increased or decreased significantly even though the underlying service has not changed.
• Opportunities to consolidate or otherwise reorganize service so that higher ridership demand can be served
with improved service frequency and fewer route patterns.
Major transportation network changes
• Major projects such as SR-520 construction and tolling and the Alaskan Way Viaduct replacement; the opening
of new transit centers, park-and-rides, or transit priority pathways.
Major development or land use changes
• Construction of a large-scale development, new institutions such as colleges or medical centers, or significant
changes in the overall development of an area.
22 SERVICE GUIDELINES KING COUNT Y METRO STRATEGIC PL AN (2015 UPDATE)You can also read