GALWAY COUNTY Economic Baseline Summary Overview - Galway Dashboard
←
→
Page content transcription
If your browser does not render page correctly, please read the page content below
Economic Baseline Summary Overview

                                            GALWAY COUNTY

                                   ouncil
                                 yC
                             Ci t
                       y
                         a
                       lw
         Gaillimhe | Ga
      na
   ch
ra

                          th
                        Ca
                                Comhairle
02                                                                                                                                                                                                                                                                                                03

                                                                                                            TABLE OF CONTENTS

                                                                                                                Foreword.  .  .  .  .  .  .  .  .  .  .  .  .  .  .  .  .  .  .  .  .  .  .  .  .  .  .  .  .  .  .  .  .  .  .  .  .  .  .  .  .  .  .  .  .  .  .  .  .  . 04
                                                                                                                About the Project .  .  .  .  .  .  .  .  .  .  .  .  .  .  .  .  .  .  .  .  .  .  .  .  .  .  .  .  .  .  .  .  .  .  .  .  .  .  .  .  .  .  .  .  .  .  . 05
                                                                                                                Acknowledgements .  .  .  .  .  .  .  .  .  .  .  .  .  .  .  .  .  .  .  .  .  .  .  .  .  .  .  .  .  .  .  .  .  .  .  .  .  .  .  .  .  .  .  .  . 05
                                                                                                                Project Remit . .  .  .  .  .  .  .  .  .  .  .  .  .  .  .  .  .  .  .  .  .  .  .  .  .  .  .  .  .  .  .  .  .  .  .  .  .  .  .  .  .  .  .  .  .  .  .  .  .  . 05
                                                                                                                Approach & Observations .  .  .  .  .  .  .  .  .  .  .  .  .  .  .  .  .  .  .  .  .  .  .  .  .  .  .  .  .  .  .  .  .  .  .  .  .  .  .  . 06

                                                                                                                HIGH LEVEL SUMMARY OF GALWAY COUNTY. .  .  .  .  .  .  .  .  .  .  .  .  .  .  .                                                                                         07

                                                                                                                Introduction .  .  .  .  .  .  .  .  .  .  .  .  .  .  .  .  .  .  .  .  .  .  .  .  .  .  .  .  .  .  .  .  .  .  .  .  .  .  .  .  .  .  .  .  .  .  .  .  .  .  .  . 08
                                                                                                                Population. .  .  .  .  .  .  .  .  .  .  .  .  .  .  .  .  .  .  .  .  .  .  .  .  .  .  .  .  .  .  .  .  .  .  .  .  .  .  .  .  .  .  .  .  .  .  .  .  .  .  .  .  . 09
                                                                                                                Housing. .  .  .  .  .  .  .  .  .  .  .  .  .  .  .  .  .  .  .  .  .  .  .  .  .  .  .  .  .  .  .  .  .  .  .  .  .  .  .  .  .  .  .  .  .  .  .  .  .  .  .  .  .  .  . 12
                                                                                                                Social Class .  .  .  .  .  .  .  .  .  .  .  .  .  .  .  .  .  .  .  .  .  .  .  .  .  .  .  .  .  .  .  .  .  .  .  .  .  .  .  .  .  .  .  .  .  .  .  .  .  .  .  . 13
                                                                                                                Education.  .  .  .  .  .  .  .  .  .  .  .  .  .  .  .  .  .  .  .  .  .  .  .  .  .  .  .  .  .  .  .  .  .  .  .  .  .  .  .  .  .  .  .  .  .  .  .  .  .  .  .  .  . 14
                                                                                                                Commuting. .  .  .  .  .  .  .  .  .  .  .  .  .  .  .  .  .  .  .  .  .  .  .  .  .  .  .  .  .  .  .  .  .  .  .  .  .  .  .  .  .  .  .  .  .  .  .  .  .  .  .  . 15
                                                                                                                PCs and Internet Access. .  .  .  .  .  .  .  .  .  .  .  .  .  .  .  .  .  .  .  .  .  .  .  .  .  .  .  .  .  .  .  .  .  .  .  .  .  .  .  .  . 16
                                                                                                                Industries .  .  .  .  .  .  .  .  .  .  .  .  .  .  .  .  .  .  .  .  .  .  .  .  .  .  .  .  .  .  .  .  .  .  .  .  .  .  .  .  .  .  .  .  .  .  .  .  .  .  .  .  .  . 17
                                                                                                                Employment.  .  .  .  .  .  .  .  .  .  .  .  .  .  .  .  .  .  .  .  .  .  .  .  .  .  .  .  .  .  .  .  .  .  .  .  .  .  .  .  .  .  .  .  .  .  .  .  .  .  .  . 20
     Economic Baseline Summary Overview
     Galway County                                                                                              Occupations.  .  .  .  .  .  .  .  .  .  .  .  .  .  .  .  .  .  .  .  .  .  .  .  .  .  .  .  .  .  .  .  .  .  .  .  .  .  .  .  .  .  .  .  .  .  .  .  .  .  .  . 22

     Produced in 2015 by                                                                                        SECTORAL REVIEW SUMMARIES .  .  .  .  .  .  .  .  .  .  .  .  .  .  .  .  .  .  .  .  .  .  .  .  .  .  .  .  .                                                          25

                                                                                                                Agriculture Sector .  .  .  .  .  .  .  .  .  .  .  .  .  .  .  .  .  .  .  .  .  .  .  .  .  .  .  .  .  .  .  .  .  .  .  .  .  .  .  .  .  .  .  .  .  .  . 26
     The Whitaker Institute, NUI Galway in conjunction with Galway City Council and Galway County Council
     Further information is available on www.galwaydashboard.ie                                                 Creative Sector. .  .  .  .  .  .  .  .  .  .  .  .  .  .  .  .  .  .  .  .  .  .  .  .  .  .  .  .  .  .  .  .  .  .  .  .  .  .  .  .  .  .  .  .  .  .  .  .  . 29

     Community & Culture Department                                                                             Education Sector.  .  .  .  .  .  .  .  .  .  .  .  .  .  .  .  .  .  .  .  .  .  .  .  .  .  .  .  .  .  .  .  .  .  .  .  .  .  .  .  .  .  .  .  .  .  .  . 32
     Galway City Council, City Hall, College Road, Galway                                                       Food Sector.  .  .  .  .  .  .  .  .  .  .  .  .  .  .  .  .  .  .  .  .  .  .  .  .  .  .  .  .  .  .  .  .  .  .  .  .  .  .  .  .  .  .  .  .  .  .  .  .  .  .  . 36
     Phone +353 91 536400
     Email c&c@galwaycity.ie                                                                                    ICT Sector. . . . . . . . . . . . . . . . . . . . . . . . . . . . . . . . . . . . . . . . . . . . . . . . . . . . . 40
     www.galwaycity.ie
                                                                                                                Marine Sector.  .  .  .  .  .  .  .  .  .  .  .  .  .  .  .  .  .  .  .  .  .  .  .  .  .  .  .  .  .  .  .  .  .  .  .  .  .  .  .  .  .  .  .  .  .  .  .  .  .  . 44
     Community, Enterprise and Economic Development                                                             Medical Device Sector. .  .  .  .  .  .  .  .  .  .  .  .  .  .  .  .  .  .  .  .  .  .  .  .  .  .  .  .  .  .  .  .  .  .  .  .  .  .  .  .  .  .  . 48
     Galway County Council, Áras an Chontae, Prospect Hill, Galway
     Phone +353 91 509521                                                                                       Retail Sector.  .  .  .  .  .  .  .  .  .  .  .  .  .  .  .  .  .  .  .  .  .  .  .  .  .  .  .  .  .  .  .  .  .  .  .  .  .  .  .  .  .  .  .  .  .  .  .  .  .  .  . 52
     Email community@galwaycoco.ie
                                                                                                                Tourism Sector.  .  .  .  .  .  .  .  .  .  .  .  .  .  .  .  .  .  .  .  .  .  .  .  .  .  .  .  .  .  .  .  .  .  .  .  .  .  .  .  .  .  .  .  .  .  .  .  .  . 56
     www.galway.ie
04                                                                                                                                                                                                                05

     FOREWORD                                                                                               ABOUT THE PROJECT

       Galway County is located at the heart of Ireland’s Western region, It is an attractive location          About the Project
       as a key tourism destination with a unique natural environment and a rich cultural heritage
       including the Irish language, but is also a County with internationally recognised clusters in           Galway City Council and Galway County Council commissioned the Whitaker Institute at
       medical devices and ICT, a centre for marine research and development and an extensive                   NUI Galway to undertake an industrial baseline study to support the development of an
       agricultural sector. There is a strong tradition of entrepreneurship within County Galway and in         economic plan for Galway City and County. Further information is available on the website
       recent years the food and the creative film sector’s have become prominent.                              www.galwaydashboard.ie.

       While County Galway is recognised as an attractive location in which people wish to live, work
       and visit, Galway County Council aims to reinforce this position and enhance the County as               Acknowledgements
       a leader in innovation and creativity. We recognise that there is an interdependency between
       Galway City and County and we are working closely with our colleagues in Galway City                     The Whitaker Institute wish to acknowledge the support of Liam Hanrahan, Patricia Philbin,
       Council to stimulate and enable enterprise and innovation in the region.                                 Sharon Carroll and Niamh Farrell of Galway City Council and Alan Farrell and Brian Barrett
                                                                                                                of Galway County Council in preparing this high level summary overview and the sectoral
       The Government Policy Document “Putting People First” made a number of significant                       review summaries. Unless otherwise stated, the data in this document is taken from the 2011
       changes to the structures, operations and functions of local authorities. The Government’s               Census Central Statistics Office data and other public sources.
       vision is that “local government will be the main vehicle for governance at local level” including
       economic development and recognised that “there is a strong rationale for increased local
       government involvement in economic development”.                                                         Project Remit

       This Economic Baseline Study, carried out by The Whitaker Institute in NUI Galway, was                   The work programme had three elements. First, state of the art white papers on innovation
       commissioned by both Galway County Council and Galway City Council to support the                        were created that provided a review and syntheses of extant international literature and
       development of an Economic Strategy for Galway City and County. The website                              policies and several innovation indicators. These white papers focused on Innovation; an
       www.galwaydashboard.ie, developed as part of the study, will be built upon to increase                   Innovation and Entrepreneurship Policy Overview for US, EU and Ireland; and Macro and Firm
       the visibility of Galway as a location for sustainable economic activity. The Baseline Study             Level Innovation Measurement and Indicators. Second, baseline data and overviews for key
       provides a snapshot of Galway and its demographic base and gives the clear message that                  sectors within the City and County were collated using publicly available data sources. Third,
       Galway is well positioned to grow economically.                                                          using publicly available data, mapping and visualisation was carried out of key data points
                                                                                                                relevant to the development of an economic strategy for the Galway City and County. These
       Galway County Council and Galway City Council have recognised that a collaborative effort                white papers and summary overviews are available at galwaydashboard.ie.
       will deliver better outcomes more efficiently and effectively and seek to work together with
       both industry representatives and the relevant agencies and the relevant Strategic Policy                The approach for each sectoral overview was to take a global and national perspective on the
       Committees in the development and implementation of an Economic Strategy, relevant                       sector before focusing on the regional and local level. One of the main limitations we faced
       action plans and other economic related initiatives while ensuring that plans and programmes             preparing each sectoral review was the lack of quality and reliable data at the local level.
       including the Local Economic and Community Plans and the Rural Development Plans are                     The framing of the global and national level overviews against the available publicly available
       aligned in terms of what they seek to achieve.                                                           local data provides a basis and context to consider the future of each sector in Galway
                                                                                                                City and County. For each sectoral overview we have outlined some future opportunities
       This is an exciting and challenging time for Galway and it is a period that offers much potential        and recommendations as a guide to be considered during the consultation phase of the
       in a situation where the local authorities and all interested parties work together on identifying       economic strategy development.
       and delivering shared objectives and common goals. We welcome feedback from all on the
       Economic Baseline Study and would ask you to engage with Galway County Council during
       the development of our Economic Strategy over the coming months.

       Kevin Kelly
       Chief Executive (Interim)
       Galway County Council
06   ECONOMIC BASELINE SUMMARY OVERVIEW - GALWAY COUNTY

     APPROACH & OBSERVATIONS

        To develop this high level summary overview, we have used the most recent Central Statistics
        Office data and disaggregated this data, where possible, along the five electoral areas in Galway
        County. We have taken key data points that are relevant to the development of economic and
                                                                                                                   High Level
        social planning. Galwaydashboard.ie has more data available and enables comparability of data
        across municipal areas of Galway City and County.

        General Observations
                                                                                                                 Summary of
        • There is a diversified sectoral base in Galway, with a mix of traditional and new sectors.
        • Third-level educational institutions and public research organisations, such as Marine Institute
          and Teagasc, are significant assets in Galway and they provide far-reaching benefits to the
                                                                                                               Galway County
          City and County.
        • Richness of culture and the natural environment, coupled with diversified sectors, are key
          elements of place-based innovation and they are key assets for future development in Galway.
        • There are high levels of educational attainment and skills in Galway.
        • A growing and globally recognised creative sector has contributed to the visibility of
          Galway globally.
        • The medical device cluster is one of a rare set of successful international industrial clusters.
        • There is a growing interest in entrepreneurship and business start-ups in Galway and this is
          particularly evident in ICT and food sectors.
        • There is an economic interdependency between Galway City and County.

        The next steps
        In the next phase of developing an economic plan, careful consideration should be given to:
        • Developing sectoral specific plans and supports that contribute to the competitiveness,
          managerial capability, operational efficiency and effectiveness of all firms.
        • Creating a master brand for Galway to illuminate the economic strengths, the rich cultural
          heritage and the natural environment that contribute to making Galway a unique and great
          location to live in and to work in.
        • Enhancing and developing skills that will be necessary to support and sustain all sectors.
        • Creation of new models of engagement and interaction within and between sectors and
          actors to support learning, knowledge transfer and collaboration that facilitates the growth
          and development of firms.
        • Internationalisation of firms through specific tailored initiatives, including utilisation of
          existing twinning arrangements and working with existing state agencies.
        • Clear sectoral plans to systematically structure, enhance and increase the intensity of
          collaboration with third level educational institutions to deal with skills development, knowledge
          transfer, research and development.
        • Clear focus on retaining and attracting the best talent to support the development of sectors.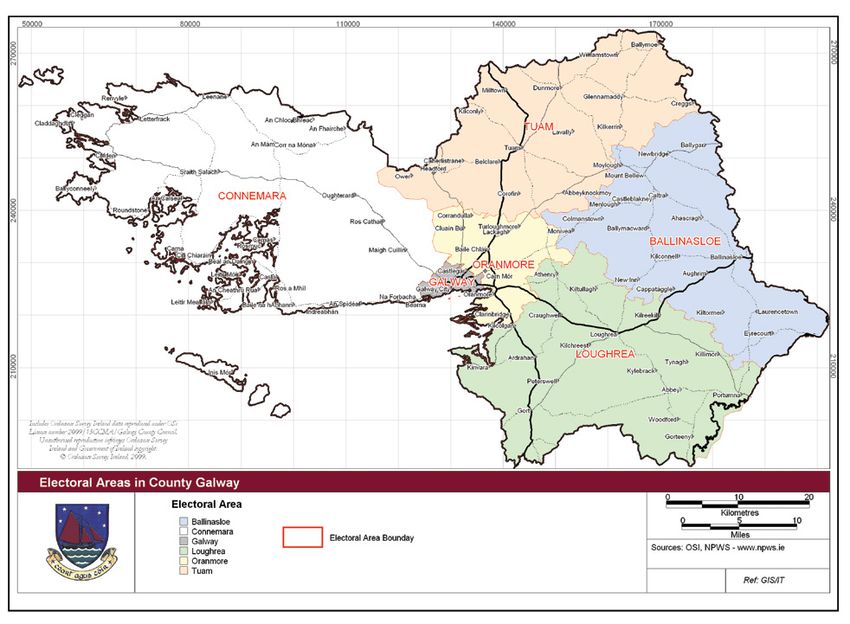
08   ECONOMIC BASELINE SUMMARY OVERVIEW - GALWAY COUNTY                                                                                                    HIGH LEVEL SUMMARY OF GALWAY COUNTY            09

     INTRODUCTION                                                                                    POPULATION

        Galway County can be separated into 5 electoral areas; Ballinasloe, Connemara, Loughrea,       Table 1 Population distribution by small area
        Oranmore and Tuam. Galway County (excluding the Galway City) has a population of
        175,029. 135,345 people in Galway County are over the age of 15 and 17,150 are retired.        			                 BALLINASLOE CONNEMARA            LOUGHREA      ORANMORE         TUAM
        There are over 77,000 residential dwellings in the area, the majority of which are owner
                                                                                                        People living
        occupied. There are 6,555 commercial organisations spread across the County Galway area,                                24,561         39,143         37,416         33,415       40,494
                                                                                                        in this area
        taken from Geodirectory data. According to the most recent CSO data available, there are
        69,152 people living in County Galway who are in employment. The Oranmore electoral area                                 5,180          8,105          8,876          8,299         9,224
                                                                                                        Aged under 15
        includes the large town of Oranmore. The largest town in the Connemara district is Clifden     				                       21%            21%            24%            25%           23%
        and Loughrea and Gort are the largest towns in the Loughrea electoral area. Tuam is the         People Aged 65+          3,771          5,281          4,720          2,920         5,286
        largest town in County Galway followed by Ballinasloe.                                         				                       14%            13%            13%             9%           13%

                                                                                                       The electoral area of Tuam has the largest population, with Tuam town the largest town in
                                                                                                       County Galway. Oranmore has the youngest population, with the highest percentage of people
                                                                                                       aged 15 years and less (25%) and the lowest percentage of over 65 year olds (9%). Ballinasloe
                                                                                                       can be seen to have the oldest population, with the highest percentage of people over the
                                                                                                       age of 65 (14%) and the lowest number of children under 15. Figure 1 shows the spread of
                                                                                                       ages for each of the five electoral areas. Ballinasloe has the least amount of people between
                                                                                                       the ages 0 and 60, by some degree. While there is a decrease for all five electoral areas in the
                                                                                                       number of 15 to 24 year olds, the sharpest decline is in the Oranmore district, followed by
                                                                                                       Loughrea. Connemara has the largest number of 50 to 65 year olds of the five districts.

                                                                                                       Figure 1 Population distribution by age groups
10   ECONOMIC BASELINE SUMMARY OVERVIEW - GALWAY COUNTY                                                                                           HIGH LEVEL SUMMARY OF GALWAY COUNTY       11

     POPULATION                                                                         POPULATION

        Figure 2 outlines the gender distribution in County Galway by electoral area.      Ethnic Background

        Figure 2 Breakdown of male and female population by electoral area                 Tables 2 and 3 below present the ethnic backgrounds and diversity of the five electoral areas.
                                                                                           Oranmore has the largest percentage of Polish nationals (3%) and Loughrea has the largest
                                                                                           percentage of nationals from outside the EU (3%). Connemara has the largest proportion of
                                                                                           residents with the ethnic background ‘White Irish.’

                                                                                           Table 2 Usually resident population by nationality
                                                                                           		                 BALLINASLOE      CONNEMARA         LOUGHREA      ORANMORE        TUAM

                                                                                            Ireland              25,118            34,632           38,027        22,794        35,490
                                                                                           		                    91.6%             91.4%            88.6%           89%         91.1%
                                                                                            UK                       741             1,210           1,428            592        1,226
                                                                                           		                      2.7%              3.2%            3.3%           2.3%         3.1%
                                                                                            Poland                   610               357             802            828          838
                                                                                           		                      2.2%              0.9%            1.9%           3.2%         2.2%
                                                                                            Lithuania                151                86             124             99          154
                                                                                           		                      0.6%              0.2%            0.3%           0.4%         0.4%
                                                                                            Other EU 27              222               600             758            440          455
                                                                                           		                      0.8%              1.6%            1.8%           1.7%         1.2%
                                                                                            Rest of World            358               689           1,401            668          563
                                                                                           		                      1.3%              1.8%            3.3%           2.6%         1.4%
                                                                                             Not stated             236                333             373            202          213
                                                                                             Total               27,436            37,907           42,913        25,623        38,939

                                                                                           Table 3 Usually resident population by ethnic or cultural background

                                                                                           		                 BALLINASLOE      CONNEMARA         LOUGHREA      ORANMORE        TUAM

                                                                                            White Irish          21,492            34,517           32,400        28,669        35,757
                                                                                           		                    88.1%             91.1%            87.4%         86.4%         88.7%
                                                                                             White Irish             714                32             418            398          913
                                                                                             Traveller             2.9%              0.1%            1.1%           1.2%         2.3%
                                                                                            Other White           1,558              2,361           2,895          2,797        2,792
                                                                                           		                     6.4%               6.2%            7.8%           8.4%         6.9%
                                                                                             Black or                109               119             204            385          171
                                                                                             Black Irish           0.4%              0.3%            0.6%           1.1%         0.4%
                                                                                             Asian or                140               264             351            250          237
                                                                                             Asian Irish           0.6%              0.7%            0.9%           0.8%         0.6%
              Galway County (excluding                                                       Other                  157                203             389            290          188
              the Galway City) has a                                                         Not stated             215                411             401            388          233
              population of 175,029.                                                         Total               24,385            37,907           37,058        33,177        40,291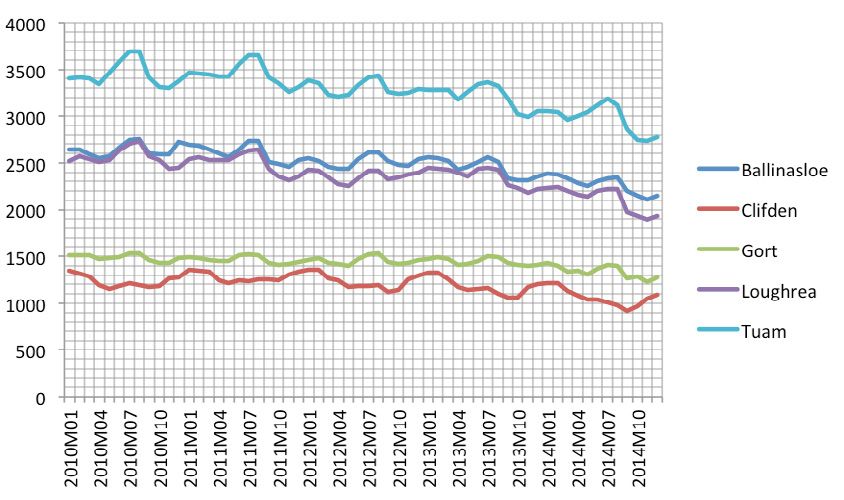
12   ECONOMIC BASELINE SUMMARY OVERVIEW - GALWAY COUNTY                                                                                                   HIGH LEVEL SUMMARY OF GALWAY COUNTY   13

     HOUSING                                                                                                   SOCIAL CLASS

                                                                                                                                                            Ballinasloe

        Oranmore has by far the largest percentage of houses built since 2000 (56%), followed                    Figure 4
        by Tuam (34%) and Loughrea (31%). These percentages are calculated using the data for                    Social class of populations
        occupied dwellings on census night, as presented in Table 5. Ballinasloe has the largest                 per local electoral area
        percentage of houses built before 1970 (31%), as well as the least amount of houses built from
        2000 on. 57% of houses surveyed in Oranmore are owner occupied with mortgage, as well as                 The charts shown in Figure 4 present
        having the highest percentage of private renting of the five districts. Private renting in the other     the breakdown in social class of
        four districts is at 11% on average, with Ballinasloe having just 10% of houses privately rented.        populations in the 5 electoral areas
                                                                                                                 of Galway County. The categories
        Table 4 Housing and ownership in small areas                                                             respondents could choose from              Connemara
                                                                                                                 were professional workers,
        		                    BALLINASLOE       CONNEMARA         LOUGHREA       ORANMORE         TUAM           managerial and technical, non-
         Built since 2000         2,165             3,568           4,717           4,818         4,757          manual, skilled manual, semi-skilled,
        		                         23%               26%             31%             56%           34%           unskilled, and all others gainfully
                                                                                                                 occupied and unknown. Managerial
         Built pre 1970s          3,001             3,781           3,432           1,506         4,073          and technical were the most
        		                         31%               28%             23%             18%           29%           common social class categories
         No. of occupied          9,615            13,604          15,233           8,585        13,989          in all five districts. Ballinasloe and
         dwellings                                                                                               Oranmore have the least amount of
         Owner occupier           2,890             4,150           4,871           4,872         5,486          unskilled workers.                          Loughrea
         with mortgage             30%               31%             32%             57%           39%
         Owner occupier           3,892             6,298           5,323           3,613         6,291
         with no mortgage          40%               46%             35%             42%           45%
         Private renting            954             1,723           1,725           2,168          1470
        		                         10%               13%             11%             25%           11%

        House Vacancy Rate
                                                                                                                                                             Oranmore
        Figure 3 presents the number of occupied and vacant houses from the 2011 census.
        Connemara has the largest house vacancy rate of 28%, followed by Loughrea (18%),
        Ballinasloe (17%) and Tuam (17%). Oranmore has the lowest house vacancy rate, at 11%.

        Figure 3 Occupied and vacant houses per small electoral area

                                                                                                                                                               Tuam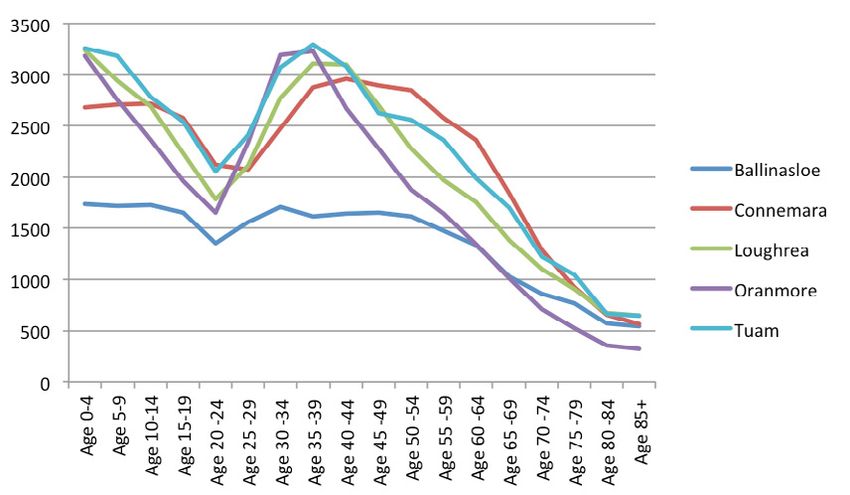
14   ECONOMIC BASELINE SUMMARY OVERVIEW - GALWAY COUNTY                                                                                                       HIGH LEVEL SUMMARY OF GALWAY COUNTY        15

     EDUCATION                                                                                      COMMUTING

        12% of the population of Tuam electoral area (of those who responded) ceased their            For all electoral areas in Galway County, commuting as the car driver is the primary means of
        education before the age of 15, compared to 8% in Oranmore and Loughrea. 75% of the           travel to work or school, with Oranmore having the largest percentage of car drivers (64%),
        Oranmore population were aged 17 and over when their education ceased, compared to only       as well as the highest percentage of car passengers (27%). On average, 8% of the population
        43% in Ballinasloe. 35% of the Oranmore population stayed in education until they were at     in each district travelled to work on foot or by bicycle. The highest percentage of bus or train
        least 21, with Connemara (24%) the area with the next highest figure.                         commuters is in the Oranmore electoral area (12%).

        Table 5 Population aged 15 years and over by age education ceased                             Table 6 Population aged 5 and over by means of travel to work or school

        		                  BALLINASLOE     CONNEMARA       LOUGHREA      ORANMORE       TUAM         		                    BALLINASLOE      CONNEMARA        LOUGHREA       ORANMORE        TUAM

        Total who                                                                                     Total who
        answered question      18,622          25,865        28,121         16,396      26,064        answered question       16,516            22,432         27,014          17,593       23,855
        Under 15 when           1,719           2,475         2,184          1,262       3,185         Car driver               6,164            9,609         10,412          11,186       10,773
        education ceased          9%             10%            8%             8%         12%         		                         37%              43%            39%             64%          45%
         16 or under            4,009           5,698         5,242          3,357       7,297         Car passenger            3,265            5,303           5,109          4,819         5,263
        		                       22%             22%           19%            20%         28%         		                         20%              24%             19%            27%           22%
        Aged 17                 7,946          12,765        13,053         12,256      14,478         On foot or bicycle       1,337            1,933           1,939          1,583         2,020
        or over                  43%             49%           46%            75%         55%         		                          8%               9%              7%             9%            8%
         21 and over            2,822           6,132         5,427          5,800       5,128         Bus/Train                1,429            2,236           2,257          2,053         2,671
        		                       15%             24%           19%            35%         20%         		                          9%              10%              8%            12%           11%
        Not stated              4,658           7,334         6,082          5,648       5,177
                                                                                                      Of the populations aged 5 and over in the five electoral areas, Connemara had the highest
                                                                                                      percentage of people leaving home for work between 8.30 and 9am. Tuam electoral area had
                                                                                                      the highest percentage of people leaving home before 7am (12%), with Connemara having
                                                                                                      only 7% leaving home before 7am. 41% of the Ballinasloe population have a journey time
                                                                                                      of under 15 minutes, the lowest of the five districts. Oranmore has the lowest percentage
                                                                                                      of people having a journey to work or school of over an hour (5%), compared to 7% in
                                                                                                      Connemara, and 8% in the other three electoral areas.

                                                                                                      Table 7 Population aged 5 and over by time leaving home and journey time

                                                                                                      		                       BALLINASLOE     CONNEMARA        LOUGHREA ORANMORE            TUAM

                                                                                                      Total who
                                                                                                      answered question          13,717            21,491         22,033        21,592       23,493
                                                                                                      Time Leaving Home            3,261            5,760          5,323          4,959       5,865
                                                                                                      8:30-9:00am                   24%              27%            24%            23%         25%
                                                                                                      Between 8:00am               7,757           12,165         12,164        11,433       12,561
                                                                                                      and 9:30am                    57%              57%            55%           53%          53%
                                                                                                       Before 7:00am               1,333            1,425          2,253          2,104       2,773
                                                                                                      		                            10%               7%            10%            10%         12%
            25% of Galway’s
                                                                                                      Journey Time                 5,570            7,624          7,948          6,698       8,073
            population has a
                                                                                                      Under 15 minutes              41%             35 %            36%            31%         34%
            third level education
                                                                                                       Over 1 hour                 1,035            1,466          1,712          1,003       1,945
            qualification.                                                                            		                             8%               7%             8%             5%          8%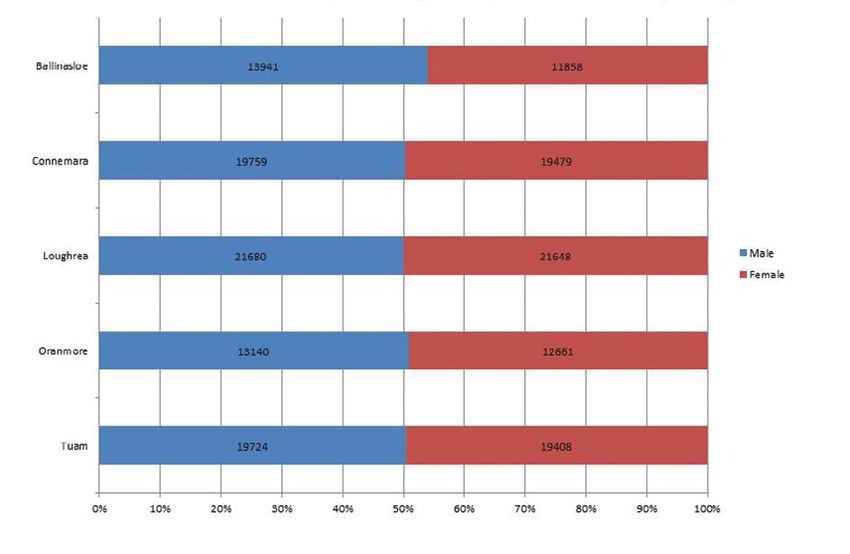
16   ECONOMIC BASELINE SUMMARY OVERVIEW - GALWAY COUNTY                                                                                            HIGH LEVEL SUMMARY OF GALWAY COUNTY    17

     PCS AND INTERNET ACCESS                                                                 INDUSTRIES

        Of those who answered               Figure 5 Respondents owning a household PC         Connemara has the largest number of commercial organisations in Galway County, according
        the question in the CSO                                                                to Geodirectory data, followed by Oranmore, Tuam, Loughrea and Ballinasloe.
        survey on household PC
        ownership, Ballinasloe had                                                             Figure 7 Industry distribution per electoral area
        the highest percentage
                                                                                               		                        GALWAY WEST          GALWAY CENTRAL         GALWA
        of households with no
        PC (34%), followed by
        Connemara (31%) and
        Tuam (30%). Ballinasloe
        also had the highest
        percentage of households
        with no internet access
        (36%). Oranmore
        district had the highest
        percentage of households            Figure 6 Types of internet access by household
        with PCs (79%) and
        internet access of some
        kind (78%).

        Table 8 PC ownership and internet access
        		                    BALLINASLOE   CONNEMARA     LOUGHREA    ORANMORE     TUAM

         Household PC
        		            5,464 9,005 9,239 8,909                                      9,851
         Ownership
        		             64%   68%   71%   79%                                        68%
         Yes

         No           2,928 4,088 3,576 2,181                                      4,342
        		             34%   31%   27%   19%                                        30%
        Internet access          4,146         7,425        7,463       7,675      8,168
        Broadband                 48%           56%          57%         68%        57%
         Other                   1,100         1,226        1,508       1,135      1,439
        		                        13%            9%          14%         10%        10%
         No internet access      3,100         4,429        3,818       2,255      4,559
        		                        36%           33%          29%         20%        32%
18 ECONOMIC BASELINE SUMMARY OVERVIEW - GALWAY COUNTY HIGH LEVEL SUMMARY OF GALWAY COUNTY 19
INDUSTRIES INDUSTRIES
Ballinasloe
Table 9 Top 5 Industry Categories Figure 8
Industry categories per
BALLINASLOE CONNEMARA LOUGHREA ORANMORE TUAM electoral area
1 Wholesale and Accommodation Wholesale and Wholesale and Wholesale and
retail trade; repair and food retail etc retail etc retail, etc
of motor vehicles service
and motorcycles activities
n=245 n=472 n=327 n=281 n=344
25% 28% 28% 20% 26% Connemara
2 Accommodation Wholesale and Accommodation Accommodation Accommodation
and food retail trade; repair and food and food and food
service activities of motor vehicles service services service
and motorcycles activities
n=129 n=314 n=202 n=147 n=166
13% 19% 17% 11% 13%
3 Other services Human health Other services Human health Other service
activities and social work activities and social work activities
activities activities Loughrea
n=100 n=146 n=141 n=118 n=132
10% 9% 12% 8% 10%
4 Human health Other Services Construction Construction Human health
and social work and social work
activities activities
n=90 n=111 n=121 n=110 n=130
9% 7% 10% 8% 10%
5 Construction Arts, Human health Other services Construction
Oranmore
entertainment and social work activities
and recreation/ activities
Construction
n=76 n=82 n=113 n=103 n=108
8% 5% 10% 7% 8%
Tuam20 ECONOMIC BASELINE SUMMARY OVERVIEW - GALWAY COUNTY HIGH LEVEL SUMMARY OF GALWAY COUNTY 21
EMPLOYMENT EMPLOYMENT
Table 10 and Figure 9 present the employment details of the population over 15 years of age The graph below presents the number of people on the live register in Galway County social
in the 5 electoral areas. Oranmore has the highest rate of employment (59%), followed by welfare offices by month from 2010 to 2014. The increases and decreases in live register numbers
Loughrea (53%) and Tuam (51%). Connemara has the lowest percentage of people employed, in the different offices in the county happen at approximately the same times, except for Clifden,
according to the 2011 census. Connemara has the highest percentage of students within their which is the social welfare office based in Connemara. Gort appears to have the steadiest numbers
population (12%), followed by 11% in Oranmore and 10% in Tuam, Ballinasloe and Loughrea. on their live register, with Ballinasloe the most varied. It should be noted that the Loughrea electoral
The percentage of over 65 year olds who are retired is highest in Connemara, followed by area has two social welfare offices, Loughrea and Gort, within its boundaries, and that Oranmore
Oranmore (78%), Ballinasloe (76%), Loughrea (76%) and Tuam (75%). doesn’t have a social welfare office, so its inhabitants must go their nearest office in another district.
Table 10 Employment status of population aged 15+
Figure 10 People on Live Register by Month and Social Welfare Office
BALLINASLOE CONNEMARA LOUGHREA ORANMORE TUAM
Population
aged 15+ 19381 31038 28540 25116 31270
Total employed 9205 14299 15139 14728 15781
48% 46% 53% 59% 51%
Unemployed having
2119 3290 2674 2183 3214
lost or given up
11% 11% 9% 9% 10%
previous job
Retired 2865 4430 3610 2271 3974
15% 14% 13% 9% 13%
People Aged 65+ 3771 5281 4720 2920 5286
14% 13% 13% 9% 13%
Figure 9 Employment status of population aged 15+
Source: CSO Live Register data, 2014
Oranmore has the
highest rate of
employment (59%),
followed by Loughrea
(53%) and Tuam (51%).22 ECONOMIC BASELINE SUMMARY OVERVIEW - GALWAY COUNTY HIGH LEVEL SUMMARY OF GALWAY COUNTY 23
OCCUPATIONS OCCUPATIONS
Table 12 Industries Top 3 and Lowest per gender
The tables below outline the most and least common occupation and industry categories BALLINASLOE
people in Galway County work in. The most common occupation category for Ballinasloe,
FEMALES MALES
Loughrea and Tuam is skilled services, whereas the top occupation in Connemara and
Oranmore is professional occupations. The least common occupation type for Ballinasloe, Professional Services: 1,819 Agriculture, forestry and fishing: 1,085
Connemara and Loughrea is sales and customer services; for Oranmore it is caring, leisure Commerce and Trade: 832 Commerce and trade: 874
and other services; and for Tuam, the least common occupation category is managers, Other: 637 Manufacturing industries: 865
directors and senior officials. Professional services is the most popular industry area for
women in all five electoral areas, with commerce and trade, on average, the most common Lowest Building and construction: 33 Lowest Public administration: 269
industry area for men. Transport and communications: 89 Transport and communications: 284
CONNEMARA
Table 11 Occupation of people at work or unemployed FEMALES MALES
BALLINASLOE CONNEMARA LOUGHREA ORANMORE TUAM Professional services: 2,967 Other: 1420
Total at work or unemployed Commerce and trade: 1,357 Commerce and Trade: 1,282
11,324 18,222 17,813 16911 18995 Other: 1,276 Professional Services: 1,126
Top Three Occupations Lowest Forestry, fishing: 60 Lowest Public administration: 442
Building and Construction: 80 transport and communications: 742
1 Skilled Trades Professional Skilled Trades Professional Skilled Trades
Occupations: occupations: Occupations: Occupations: Occupations: LOUGHREA
2,735 3,354 3,970 3,385 4,376
FEMALES MALES
24% 18% 22% 20% 3%
Professional services: 2,746 Commerce and Trade: 1,626
2 Professional Skilled Trades Professional Skilled Trades Professional
Occupations: Occupations: Occupations: Occupations: Occupations: Commerce and trade: 1,604 Agriculture, forestry and fishing: 1,457
1,622 3,229 3,033 2,777 2,550 Other: 973 Manufacturing Industries: 1,377
14% 18% 17% 16% 13% Lowest Forestry, fishing: 164 Lowest Public administration: 373
3 Process, Plant Professional Associate Professional Process, Plant Building and Construction: 73
and Machine and Technical Professional and Technical and Machine
ORANMORE
Operatives: Occupations: and Technical Occupations: Operatives:
Occupations: FEMALES MALES
1,017 1,627 1,690 1,879 2,124 Professional Services: 2,675 Commerce and trade: 1,729
9% 9% 9% 11% 11%
Commerce and Trade: 1,551 Manufacturing industries: 1,583
Lowest
Manufacturing industries: 970 Other: 929
Sales and Sales and Sales and Caring, Leisure Managers,
customer Customer customer and Other Directors and Lowest Forestry, fishing: 38 Lowest Public administration: 360
service Service service Service Building and Construction: 60
Occupations: Occupations: Senior Officials: TUAM
624 901 972 919 1,191
FEMALES MALES
6% 5% 5% 5% 6%
Professional Services: 2,724 Manufacturing industries: 1,718
Commerce and Trade: 1,592 Commerce and Trade: 1,625
Manufacturing industries: 1,084 Agriculture, forestry and fishing: 1,572
Lowest Forestry, fishing: 133 Lowest Public Administration: 387
Building and Construction: 5824 ECONOMIC BASELINE SUMMARY OVERVIEW - GALWAY COUNTY
Sectoral
Overview
Summaries26 ECONOMIC BASELINE SUMMARY OVERVIEW - GALWAY COUNTY SECTORAL OVERVIEW SUMMARIES 27
SUMMARY OVERVIEW OF THE AGRICULTURE SECTOR SUMMARY OVERVIEW OF THE AGRICULTURE SECTOR
13,445
farms
Global Overview Regional and Local Overview
615,877
• There are 1.5 billion indigenous farmers feeding the world’s population. total hectares • There are 13,445 farms in Galway, 14,730 average work units of labour
• There are more people engaged in farming than any other profession in the world. 25.8 units, €13,852 of average labour output and 615,877 total hectares.
hectares average farm size • Galway has the highest number of farms in the West of Ireland with an
• 32 hectares is the average farm size in Europe.
average farm size of 25.8 hectares.
• The global grain market is highly concentrated and dominated by four main companies.
11,247 • There is a trend in the number of large farms increasing while the number
• To meet the estimated crop needs of 2050, global production may need to increase cattle farms of small farms is decreasing.
between 60% and 70%.
• The global market for fertilizer is 180 million tonnes with growing industry consolidation.
420,205 • 65% of farms in Galway are for beef production.
cattle
• There has been a 55% decrease in specialist dairy farms since 2000 and
• The EU accounts for 16% of global meat production and the market is predicted to
grow at 14% over the next 10 years due to an increased demand for beef in the Middle
6.3% 33% decrease in mixed grazing livestock farms.
of Ireland’s cattle • The average output of farms in Galway (€13,852) is 54% less than the
East and Asia.
State’s average output (€30,726) in 2010.
• Some 620 billion litres of milk was produced in 2013, with 10 countries producing
57% of this milk production.
65% • The largest cohort of farm holders are over 65 years old and 34% of
for beef production farm enterprises do not generate sufficient income.
• There is a 5% increase in milk production predicted in the EU by 2024.
• Economically viable farms increased from 27% in 2010 to 35% in 2011.
• EU policies are focused on minimising market distortions, refraining from the use 24,928 • Some 380 farms produce cereals with 280 farms producing spring barley.
of export subsidies, sustainability and termination of EU sugar production. dairy cows
2.3% • Fertilizer spreading costs is greater in Galway than other counties.
of Ireland’s dairy cow stock • There were 11,247 cattle farms in 2010, with 420,205 cattle and
National Overview
24,928 dairy cows in County Galway.
151 • Galway has 6.3% of total cattle stock in Ireland, 2.3% of Ireland’s dairy
• Ireland is the most expensive country in the world to buy farmland. milk producers
cow stock and has the most cattle in the State after Cork.
• The operating surplus increased by 2% in 2013, with milk output increasing by
25.5% and cattle output decreasing by 1.1%. 380 • After Donegal, Galway has the most sheep in the State at 576,463 sheep.
farms produce cereals • Galway has the most goats in the State.
• Dairy (26%), food processing (15%) and beef (14%) are the top three primary areas
of business of Irish agribusinesses. 280 • There are 3,916 sheep farms, 60 pig farms and 810 poultry farms
• 80% of total dairy and beef production is exported, with the UK being the leading farms producing spring barley (largest number after Cork in the State).
export market, accounting for 69% of Ireland’s exports. • There are 151 milk producers in County Galway and the sixth largest
• The top 2 cereal productions are spring barley and winter wheat. 3,916 number of dairy cows in the sector.
sheep farms
• Ireland is the 4th largest beef exporter but the average cattle farm income has declined • There are 19 farmers’ markets in County Galway and 4 farmers’ markets
from €19,183 in 2011 to €15,667 in 2013. 576,463 in Galway City.
sheep
• Some 80% of a 5.4 billion milk pool is processed by five dairy companies and the • Agricultural education has been provided in Mountbellew Agricultural
average dairy income increased by 31% in 2013 compared to 2012. College since 1904.
810
poultry farms
60
pig farms
19
farmers markets28 ECONOMIC BASELINE SUMMARY OVERVIEW - GALWAY COUNTY SECTORAL OVERVIEW SUMMARIES 29
SUMMARY OVERVIEW OF THE AGRICULTURE SECTOR SUMMARY OVERVIEW OF THE CREATIVE SECTOR
Future Opportunities and Recommendations Global Overview
• County Galway has the sixth largest number of dairy cows in the country. With the • World exports of creative goods and services reached €624 billion in 2011.
abolishment of milk quotas, opportunities exist for higher levels of milk production and for
• The creative industry of the EU accounts for 3.3% of GDP and employs 6.7 million people.
the use of milk in developing new food products.
• Arts and crafts account for 6% of global value of creative goods market in 2011.
• Given the age profile of farm holders in County Galway, support needs to be given to new
farm holders and those considering leaving farming to ensure long-term sustainability and • The global music industry has been in decline for 14 years and total music sales for
viability of farm holdings. 2013 were down 3.9% from 2012.
• With the diversity of cereal production farms, opportunities should be explored relating to • Global sales for visual arts reached $65.4 billion in 2014, up 8% from 2013.
the development of value added products for industrial and consumer markets. • India was the leading film producing country in 2013 with 1,325 films. Ireland produced
• Given the size and number of cattle, sheep, pigs, goats and poultry, real opportunities exist 22 films in 2014.
to create and support the development of added value production to the primary • Major drivers of the global creative sector are technology, demand for creative goods
production within the City and County. and tourism.
• The 110 hectare state support organic farm in Athenry provides opportunities to support
the development of organic food producers.
National Overview
• With the scale and diversity of primary agriculture, the growth of farmer markets and
increasing customer demand for quality and artisan foods, consideration should be given to
• The creative sector for Ireland is worth €4.6 billion, composing approximately 2.8% of GDP.
creating a master food brand which includes primary producers. The Fuschia Brand in
West Cork is an exemplar of this concept. • Employment created by the creative industries amounts to 76,862 in Ireland.
• Development of specialised skills and early adoption of new technologies need to be • 3.7m overseas visitors engage in cultural and historical cultural activities.
continuously encouraged and supported for primary producers. • The performing arts sector of Ireland engages with 2.3 million Irish citizens a year,
• The location of educational training (Mountbellew) and state sectoral support and research which is 66% of the adult population.
(Teagasc Athenry) in Galway is a significant asset to the sector within the County and • The audio visual sector is estimated to be worth €550 million employing over 6,000 people
opportunities for more embedded collaboration between these institutions, primary in over 560 SMEs.
producers and food companies needs to be supported through formal and informal
sectoral networks. • The design sector is valued at €465 million employing 5,100 people, with 37% of
SMEs employing between 2 and 5 people.
• Development of more knowledge transfer networks among and between primary
producers and food producers. • The animation sector generated €326.8 million in 2011 while employing 2,321 people.
• The Irish music industry decreased by €79 million between 2005 and 2010.
• Tax incentives and art promotion charters are productive policies enhancing the sector.30 ECONOMIC BASELINE SUMMARY OVERVIEW - GALWAY COUNTY SECTORAL OVERVIEW SUMMARIES 31
SUMMARY OVERVIEW OF THE CREATIVE SECTOR SUMMARY OVERVIEW OF THE CREATIVE SECTOR
2,466
Regional and Local Overview creative companies • UNESCO City of Film international designation further validates the strength and potential of the
creative sector.
• The West of Ireland has 2,466 creative companies.1 in every €534m • A successful European Capital of Culture 2020 bid would further enhance the creative economy and
33 jobs in the Western Region is in the creative economy. annual turnover
provide a unique platform to showcase the array of talent, capabilities and dynamism within this sector.
• 3,878 people are employed in Galway in the creative sector, 3,878 • For the craft sector, GMIT’s Letterfrack National Centre for Excellence in Furniture and Design Technology
accounting for 3.4% of total employment in the County. employed
is a unique asset for Galway.
• Some 12% of businesses in the creative sector have more than 3.4% • With the size and distribution of heritage sites, museums and art galleries, there is potential to create
10 employees, 49% have between 2 and 10 employees and total County employment innovative cultural and educational products that appeal to local, regional, national and international
39% are sole traders. visitors and groups. For example, the creation of a mini ‘Atlantic Way’ product that provides a cultural trail
Creative technology companies
• Creative technology companies account for 7% of total number that links these sites could be explored.
of business, 25% of turnover and 15% direct employment. 7% • Creative technologies companies have the potential to grow and expand in the City and County and
total number of business
• The audio visual sector is worth €72 million employing over such an expansion needs to be supported through appropriate educational provision and promotion at
600 people and the employment rate is growing at 24.5%. 25% existing festivals.
• Connemara has a cluster of audio visual companies with the of turnover • Supporting the international scaling and orientation of the creative sector, as well as supporting the
success of TG4 influencing the establishment of 40 companies. audio visual sector business development aspects, is critical to the long-term development of creative companies and
individuals. The Creative Momentum project that involves NUI Galway and Western Development
• There are 162 design and craft businesses in Galway with €72m Commission with international partners can contribute to supporting strengthening and internationalising
the greatest concentration in textile making, wood working worth the creative sector.
and jewellery.
• There are 35 heritage sites, 32 museums and 10 art galleries in 600+ • The sustaining and growth of the Irish language is critical and integral to the identity of Galway.
the City and County. employed • Education provision needs to be in place to match the growth and opportunities within the sector and
• There were 83 festivals and events hosted in Galway in 2012, 24.5% a retention strategy should be put in place, in collaboration between industry and education providers,
to retain the best talent within Galway.
bringing in an estimated €62 million in expenditure. employment growth rate
• Galway has the potential to become a leading national location for visual arts.
• The estimated economic value of the Irish language is over
€136 million, of which €59 million accrues to Galway City. 162 • The audio-visual cluster needs to be promoted explicitly, nationally and internationally, to support the
design and craft businesses evolution and growth of the cluster. Different aspects of the audio-visual cluster should be replicated to
• 25,000 domestic and foreign students attend Irish colleges in
the Galway Gaeltacht each summer and contribute €24.3 35 support the development of sub-sector clusters within the creative sector.
million in added value to GNP each year. heritage sites • A growing concentration of textile making, wood working and jewellery exists within Galway and these
craft businesses have the opportunity for incremental growth and development around niche markets.
• Traditional Irish music is part of Galway’s cultural identity. 32 This will require different types of business supports.
• There is the potential for Galway to become the national flagship museums
• Festivals contribute significantly economically and socially to Galway City and County and it is important
for contemporary visual arts.
10 that they maintain novelty and originality, as well as being innovative in the manner they engage
• Galway is a UNESCO Creative City having been designated a art galleries audiences. More awareness of the variety, number and quality of festivals, as well as their importance,
UNESCO City of Film in 2014. should be communicated more systematically and form part of the unique selling points of Galway as a
• The sector generates an annual turnover of €534 million and
83 place. In addition, festivals are possible business-to-business events that provide for structured business
festivals and events development with national and international firms and buyers.
contributes 3% towards employment within Galway.
Irish language • Creative spaces and hubs for individuals and start-up businesses using public and private premises
Future Opportunities and Recommendations should be developed. This concept was piloted successfully in Northern Ireland in multiple locations as
€136m part of the Creative Edge project lead by NUI Galway and funded by the Northern Peripheries Programme.
worth
• This sector has significant potential to grow within Galway City
• Learning and knowledge transfer networks and community fora should be created to explore new ideas,
and County and to further increase the visibility of Galway as one 25,000 collaborations and networking, as well as knowledge acquisition and development.
of the major global hubs for creative industries. Irish college students32 ECONOMIC BASELINE SUMMARY OVERVIEW - GALWAY COUNTY SECTORAL OVERVIEW SUMMARIES 33
SUMMARY OVERVIEW OF THE EDUCATION SECTOR SUMMARY OVERVIEW OF THE EDUCATION SECTOR
Global Overview National Overview
• Each $1 spent on education gives rise to between $10 and $15 in economic growth over • Approximately 40 higher education institutions cater for a student population of 200,175,
a person’s lifetime in the form of higher earnings and wages. which is forecast to rise to over 250,000 by 2020.
• Global education expenditure is $4,450.9 billion. It has a compound annual growth rate • There are 3,300 primary schools that cater for 520,444 students and 700 secondary
of 7% between 2012 and 2017. schools that cater for 360,567.
• Some $2,227 billion was spent on primary school education (K-12) globally which is the • The strongest growth in the sector is among primary and nursery school teachers where
highest percentage of global education expenditure. the number increased by 9,115 to 39,998 between 2006 and 2011.
• There are 608.1 million potential students worldwide of age for third level education. • Secondary school teachers account for 31,829, up by 2,178. Third level teaching staff
increased from 10,831 in 2006 to 12,729 in 2011.
• Western Europe has 24.9 million students of age for primary education, 33.8 million for
secondary and 25.5 million potential students of age for third level education. • The number of caretakers, labourers and clerks all decreased, with the number of filing and
other clerks decreasing by 38%.
• An average of 82% of students within OECD countries complete secondary education
over their lifetime. • International student numbers in third level colleges grew by 2% to 32,000 in 2012.
• Only nine of the top global universities are not located within the United States, only three
• International education is valued at €1 billion to the Irish economy.
within the top 20.
• Ireland has a goal to raise the number of international students to 52,000 by 2015 and
• The largest university in the world, according to enrolment, is the Allama Iqbal Open
English language students to 125,000.
University in Pakistan with 1.9 million student enrolments.
• Expenditure per student in Ireland increased to €6,272 (16.4%) per student over the period
• E-learning is worth $56.2 billion with corporations considering it to be the second most
2003-2012.
valuable training method.
• Expenditure per student in secondary schools has increased by 11.6% over the period
• International student growth grew at a rate of 6.6% per annum between 2009 and 2011
2003-2012.
to 3.04 million.
• In reading literacy, Ireland had the second highest score in 2012 among participating
• China aims to host 500,000 international students by 2020, up from the current level
EU countries.
of 260,000.
• Ireland had the 8th highest mathematical literacy for 15 year old students in secondary
schools among participating EU countries in 2012.
• Ireland ranked sixth highest among EU countries for scientific literacy with a score of 522.
• The proportion of students aged 18-24 who left school with, at most, lower secondary
education in Ireland was 9.7% in 2012.
• In relation to third-level students, there was a decrease of 20.1% in expenditure per student
over the period 2003 to 2012.
• The number of full-time third-level students increased by 24.1% between 2003 and 2012,
while the number of part-time students increased slightly by 0.3%.
• There are 45,373 pupils attending Irish-medium schools outside of the Gaeltacht.
• A reform of the Junior Certificate seeks to promote active learning, creativity
and innovation.
• By 2016, full equality of provision and support will have been achieved in higher
education for all learners.34 ECONOMIC BASELINE SUMMARY OVERVIEW - GALWAY COUNTY SECTORAL OVERVIEW SUMMARIES 35
SUMMARY OVERVIEW OF THE EDUCATION SECTOR SUMMARY OVERVIEW OF THE EDUCATION SECTOR
25%
Regional and Local Overview population with third level qualification • Some 22% of primary school students in Galway attend a Gaelscoil.
• 25% of Galway City’s population are students indicating a 10,741 • Since the establishment of DEIS, literacy and numeracy rates in primary schools have been
improving steadily and secondary attainment levels are improving. Attendance, participation and
high level of education within the City. employed within the sector
retention levels have also improved.
• There are 10,741 individuals employed within the education 25% • There are 9 special schools in Galway with Rosedale School being the largest, catering for 67 pupils.
sector of Galway. Galway City’s population are students
• 62,389 people in Galway have a third level qualification, 57%
meaning that a quarter of Galway’s population has a third in University Future Opportunities and Recommendations
level education qualification. NUIG
• The education sector is a significant contributor to the local economy.
• In Galway, 57% of third level students were in a university,
which is 4.6% higher than the national average. 16,542 • Currently, there is a variety of educational provision at all levels and this needs to be
students including
maintained and developed further to meet future needs.
• NUIG has 16,542 students including 2,060 international
students from 92 countries, with 2,002 staff of which 86% 2,060 • The School Investment Programme has seen construction of five new schools, as well as
are full-time academic staff with PhD qualification. international students a range of school extensions.
• NUIG was the only Irish university to have increased its 86% • The presence of a growing and vibrant third level sector is a significant asset for Galway.
position in the QS World University Rankings 2014/2015, full-time academic staff with PhD
• The further enhancement of teaching and research programmes that support and underpin
rising four places to 280th. the future development of key sectors within the City and County is critical.
GMIT
• Some 87% of staff employed in GMIT are full-time • The level of collaboration between all sized firms in different industry sectors and the third
academic staff with Masters or higher, while some 20% 87% level sector should be increased, with respect to job placement, joint research programmes
have PhD qualifications. full-time academic staff and participation in national and European public funding programmes, such as Horizon
with Masters or higher
• Coláiste na Coiribe is currently under construction with a 2020 and Irish Research Council Employment Based Schemes.
total investment of €16 million. 20% • Technology transfer from the third level sector and public research organisations can
• The largest vocational school in Galway City is Galway PhD qualifications support firm level research and development within in the City and County.
Technical Institute (GTI) which has 1,175 pupils. • The usage of public research equipment infrastructure by firms within the City and County
Primary School
• Yeats College in Galway City was recently ranked as should be increased.
Ireland’s highest achieving school, sending 100% of pupils 287 • A webportal for firms and researchers that provides industry specific information in relation
to third level courses. teachers in Galway City
to R&D capabilities, equipment and facilities and professional development opportunities
• NUIG has in excess of 2,000 international students, 24.1 should be created. Metric Ireland is an example of this which is focused on the medical
accounting for 15% of the student population which is average class size device sector.
the highest number of international students out of all
Irish Universities. 902 • Opportunities exist for the sector to grow the international student market and to further
enhance sectoral skills based through niche programmes and learning approaches.
teachers in Galway County
• In Galway County, the number of secondary school pupils
has decreased by 162 during the period 2007 to 2014. 23 • Innovative retention approaches should be considered to ensure the retention of highly
skilled graduates within Galway. This will contribute to the growth and future development
average class size
• Galway City had an early school leaver percentage of 3.6% of key sectors.
compared to 2.2% in Galway County. 4 • Apprenticeships, training opportunities and mentoring should be used to ensure
multi-denominational schools
• Galway City has 287 primary school teachers with an employment pathways for early school leavers.
average class size of 24.1 pupils and Galway County has 22% • Training and development support should be provided for different sectors. Consideration
902 teachers teaching an average class size of 23 pupils. of primary school students at Gaelscoil should be given to utilise the existing education infrastructure to maximise participation and
• There are four multi-denominational schools in Galway. 9 reach throughout the City and County.
special schools36 ECONOMIC BASELINE SUMMARY OVERVIEW - GALWAY COUNTY SECTORAL OVERVIEW SUMMARIES 37
SUMMARY OVERVIEW OF THE FOOD SECTOR SUMMARY OVERVIEW OF THE FOOD SECTOR
Global Overview National Overview
• Global food retail sales are approximately $4 trillion annually and are expected to reach • The food and drinks industry of Ireland generates a turnover of almost €24 billion,
$5.3 trillion by 2017. contributing to 230,000 jobs.
• Supermarkets and hypermarkets account for half of annual food sales. • The speciality food sector was valued at approximately €615 million in 2012 with about
350 producers employing more than 3,000 people.
• Food retailing accounts for nearly 40% of all global retail sales.
• The value of food and drink exports in Ireland is valued at approximately €10 billion,
• The top 15 global supermarket companies account for over 30% of world supermarket sales.
representing a 40% increase since 2009 with revenues €3 billion higher.
• Fresh food and agriculture produce accounts for 52.6% of the $4 trillion and packaged foods
• Ireland’s most valuable food exports are meat and meat preparations, valued at €1.6 billion,
accounts for 47.4%.
and dairy products and bird’s eggs, valued at €901 million.
• Milk and rice are the most important food commodities with their productivity value in
• For the Irish food sector, 42% of food and drink exports, worth €4.1 billion, go to the UK.
international dollars being $187bn and $186bn respectively, followed by meats, beef, pork
and chicken.
• Exports to other EU markets increased by 11% in 2013 to €3.2 billion, with Germany,
• The top 10 food and drink manufacturers in the world have a combined revenue of $438.7 France and the Netherlands recording double digit growth.
billion and employ almost 1.3 million people.
• Irish households are spending €6,812 annually on food, accounting for 16% of their
• 13% of household spending in the US was on food, compared to 23% for households in spending.
Asia, 11.5% in Britain and 16 % in Ireland.
• Some 1.3% of Irish land is farmed organically while the E.U. average is 5.4%.
• The global market for organic produce in 2012 was nearly €64 billion with a total of
• €2.38 billion is spent annually on fast food which is 38% of the Irish ‘eating out’ budget.
1.9 million organic producers with approximately 80% of these producers being located in
In contrast only €687 million is spent in full service restaurants annually accounting for 11%
developing countries.
of Irish people’s ‘eating out’ budget.
• The global organic market in North America is expected to grow at a compound annual
• Surplus food or ‘food waste’ costs the Irish economy €4 billion annually.
growth rate (CAGR) of 12% up to 2015 while Europe is also expected to grow at 12% owning
the largest market share, valued at $28 billion.
• There is a combined total of 37.5 million hectares of organic farmland as of 2012, which is an
increase of 200,000 hectares from 2011.
• The traceability and ingredient origin of products influence the purchasing decision making of
today’s consumers.
• Although health and welfare are driving consumer spending habits, the global fast food
industry is valued at $551 billion with an annual growth rate of 3.5%, employing over 12
million people.
• China is on track to becoming the largest food and grocery market in the world by 2018, with
32% of the global share of food and grocery retailing.
• An estimated 1.3 billion tonnes of food is wasted annually or 30% of global food production
which is enough food to feed 2 billion people.
• The top three key changes in the business structure of global food manufacturers are the
addition of new products and services, improving operational efficiency of manufacturers and
expansion into emerging markets.38 ECONOMIC BASELINE SUMMARY OVERVIEW - GALWAY COUNTY SECTORAL OVERVIEW SUMMARIES 39
SUMMARY OVERVIEW OF THE FOOD SECTOR SUMMARY OVERVIEW OF THE FOOD SECTOR
Regional and Local Overview 30 Future Opportunities and Recommendations
market locations with food
• Galway City and County have a variety of farmers markets,
food festivals and other food promotion activities to benefit
19 • The sector offers significant future growth prospects for Galway and, combined with a
vibrant primary agricultural sector, provides a strong basis for its future development.
County farmers’ market
companies working in the food sector in Galway.
• There are 30 market locations in Galway City and County
4 • The state supported organic farm in Athenry a significant asset for food producers.
City farmers’ market • Tailored supports need to be put in place to support the development of the 320 small
where food is being sold. There are 19 Galway County
farmers’ markets and 4 in Galway City. 320 food producers, with respect to product development, international expansion and
business management.
small food producers
• Growing Galway Food is a new initiative aimed at developing
• Tailored education and training is required to enhance and to grow the skills base within
the food sector in Galway. The project identified 320 small 53% the sector and to support its future development.
food producers and 332 small food buyers. employ between 1 and 2 people
• A Galway food brand/label, similar to the Fuchsia brand for West Cork, should be created.
• 53% of these companies employ between 1 and 2 people,
including the founder/owner.
40% This would enhance the promotion of small food producers and give visibility to local
run their production from home buyers and local food produce. Such branding should also include primary producers in
• 40% of food producers run their production from home.
332 the agricultural sector.
• 70% of Galway food buyers surveyed by Growing Galway small food buyers • Shared food production facilities should be established so small food producers have
Food actively source local produce.
3,762 access to state of the art facilities to produce and scale production, as well as getting
access to expert advice and support. An exemplar of such an approach is the Ferbane
• There are 3,762 food and drink processing jobs based in the food and drink processing jobs
Food Campus.
western region.
• The first state backed organic farm is located in Athenry, it is
110 • Opportunities to collectively promote Galway food products at international fairs should be
hectare first state backed organic
systematically sought, as well as collaborations with key stakeholders in bringing
110 hectares in size. farm
international food buyers on an annual basis to Galway for selected food festivals and other
• There are 356 restaurants located in Galway City, the third
highest concentration after Dublin and Cork.
16 creative economy based festivals.
food festivals
• Additional supports should be put in place to promote, expand and enhance the farmers
• Galway has Fáilte Ireland nominated food ambassadors.
356 market experience. Creation of farmer market trails, coupled with primary production
offerings, can further enhance the sector and its visibility locally, nationally and internationally.
• 16 food festivals are held in Galway City and County annually. restaurants in City
• In conjunction with Bord Bia, training programmes, grants and 12 • The Connemara Food Trail model could be replicated in other parts of the City and County
to support primary production, food producers and restaurants.
the development of a strong food infrastructure and culture nominations for Ireland’s best
within Galway supports the development and success of artisan food and greengrocers in • Distinctly Galway food product(s), such as the Blaa in Waterford, could be created
new food producers. 2014.
and promoted.
• 12 nominations for Ireland’s best artisan food and • Learning and knowledge transfer networks and community fora should be created to
greengrocers came from Galway in 2014. explore new ideas, collaborations and networking, as well as knowledge acquisition and
development, particularly between food producers, food processers and buyers.You can also read