Cyber Security Skills Report - Greater Wellington Regional
←
→
Page content transcription
If your browser does not render page correctly, please read the page content below
Cyber Security Skills
Report
                              Wellington Regional Strategy Office:
                              Samantha Seath and Colin Drew
                              A review and identification of the issues in the development
                              of a cyber security workforce that is able to meet the demand
                              of the future and enable growth across the region.

Greater Wellington Regional
                    Council

       September 2016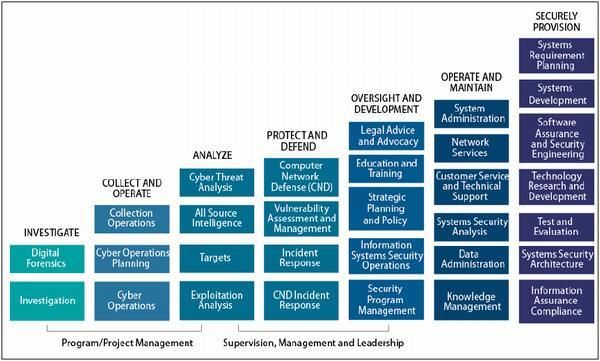
About the Wellington Region Strategy Office
The Wellington Regional Strategy Office is tasked with reporting, research and monitoring functions in
relation to the Wellington Regional Strategy. The strategy is set and governed by the Wellington Regional
Strategy Committee, on behalf of the councils in the region. Our role is to continually look for opportunities
to partner on research projects that have a clear application for councils’ and/or WREDA economic
development interests. We also provide regional economic data and research products.

      The Wellington Regional Strategy Office would particularly like to acknowledge the following
                                     contributions to this report:

     Eleanor Laban from Immigration NZ for immigration statistics and contribution to the research

  Kendra Ross of Duo Ltd for her ongoing contribution to the research and involvement of her business
                                              networks

 Tim Newman, Cliff Gibson and Steve Howard of KMatrix for profiling the sector and providing metrics

                 John Dow of Agenda Marketing for the initial interviews with businesses

              A full list of contributors and workshop participants is available in Appendix 2.

1|Page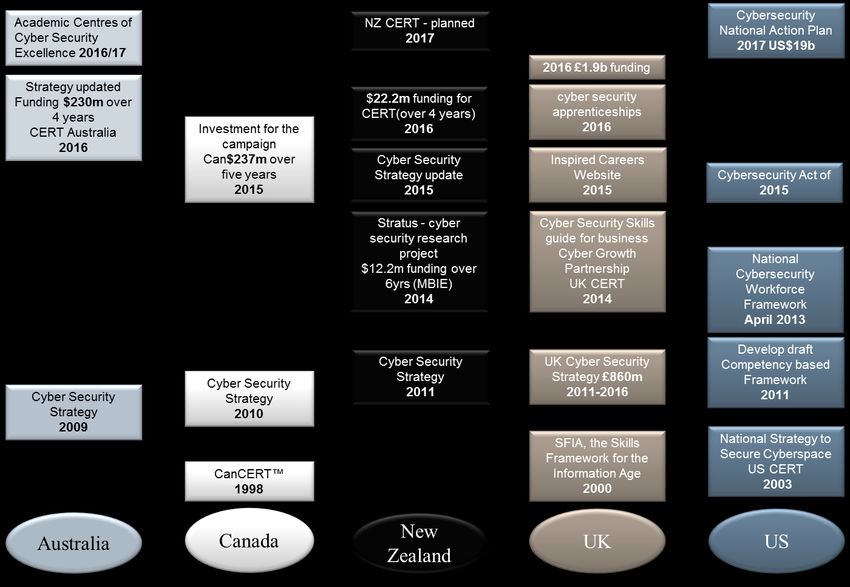
Contents
Executive Summary ........................................................................................................................................... 4
Recommendations......................................................................................................................................... 5
1. Introduction ............................................................................................................................................... 6
2. Context ...................................................................................................................................................... 7
2.1. Cyber Security is critical for New Zealand ......................................................................................... 7
Figure 1 – NZ Cyber Security Strategy ....................................................................................................... 8
2.2. Multiple points of interest................................................................................................................. 8
2.3. Understanding the sector .................................................................................................................. 9
3. Scope and Methodology ............................................................................................................................ 9
Figure 2: High level process ....................................................................................................................... 9
3.1. Starting point ................................................................................................................................... 10
3.2. Cyber security reports and analysis ................................................................................................. 11
3.3. Stakeholder engagement ................................................................................................................ 11
4. International ............................................................................................................................................ 12
Figure 3: International timeline ............................................................................................................... 12
Table 1: Government spending on Cyber Security (generally over 4 years) ........................................... 13
Table 2: Cyber Security Sales as a % of GDP – kMatrix............................................................................ 13
4.1. Skills shortages ................................................................................................................................ 14
4.2. Skills frameworks ............................................................................................................................. 15
4.2.1. United Kingdom (Appendix 3) ................................................................................................. 15
4.2.2. United States (Appendix 4) ...................................................................................................... 16
Figure 4: Cyber security sector model .................................................................................................... 18
5. Wellington Situation ................................................................................................................................ 18
5.1. Quantitative Information ................................................................................................................ 19
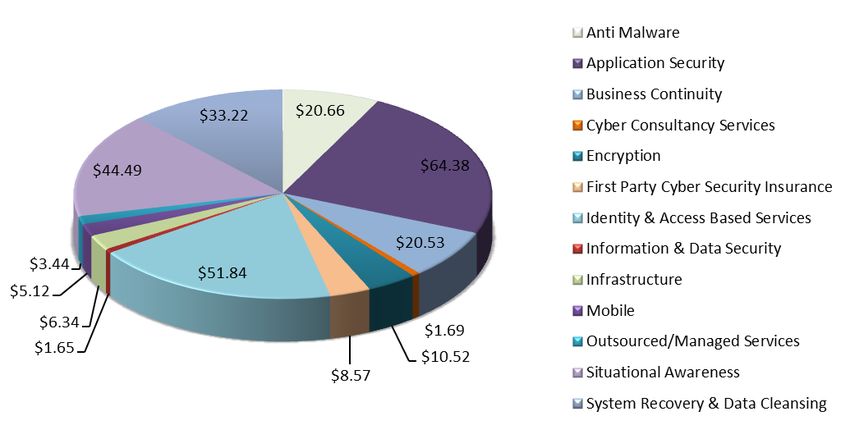
Figure 5: Wellington Cyber Sales (2015 $m) by category – kMatrix ....................................................... 19
Figure 6: Growth in Cyber Security Sales (%) for 2015 ............................................................................ 20
Table 3: Short-term employment forecasts: 2016-2019 ......................................................................... 20
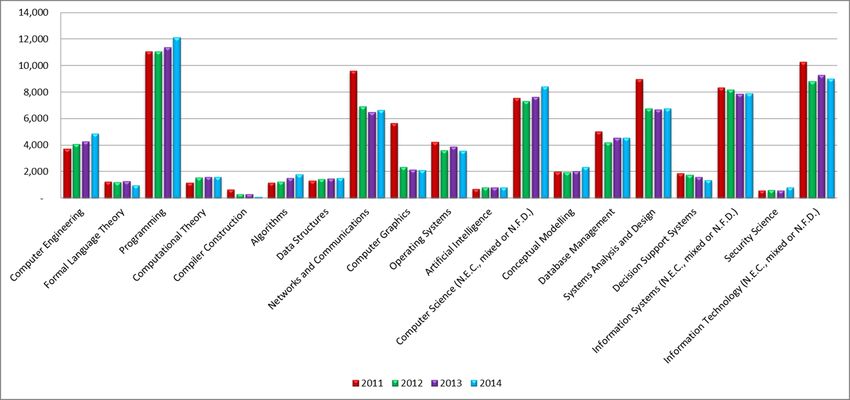
Figure 7: Student numbers by field of study (Enrolled - NZ) ................................................................... 21
Figure 8: Information Technology Graduates (NZ Domestic) .................................................................. 21
Table 4: Migrant arrivals Wellington & NZ .............................................................................................. 22
Table 5: kMatrix Job title statistics (Wellington) ..................................................................................... 23
5.2. Qualitative information ................................................................................................................... 24
6. Framework for Skills ................................................................................................................................ 26
Figure 9: US framework for cyber security workforce development ...................................................... 26
7. Summary of Findings ............................................................................................................................... 27
8. Key Wellington Recommendations ......................................................................................................... 29
Recommendation 1 ..................................................................................................................................... 29
2|Page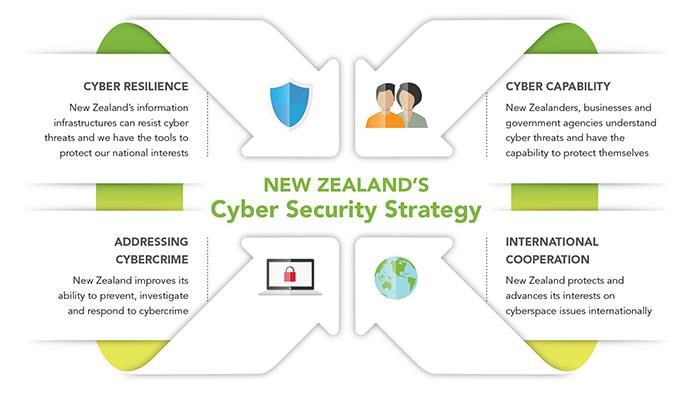
Recommendation 2 ..................................................................................................................................... 29
   Recommendation 3 ..................................................................................................................................... 29
   Recommendation 4 ..................................................................................................................................... 29
   Recommendation 5 ..................................................................................................................................... 29
   Summary of All Recommendations ............................................................................................................. 30
Appendix 1 – kMatrix information .................................................................................................................. 31
Appendix 2 – Engagement with experts.......................................................................................................... 35
Appendix 3 – UK International Framework ..................................................................................................... 37
Appendix 4 – US International Framework ..................................................................................................... 38
References ....................................................................................................................................................... 39

3|Page
Executive Summary
The aim of this report is to understand what opportunities there are for the Wellington Region in growing
the cyber security sector, and what skills constraints might exist in achieving this objective.

Research was focused on discussions with industry as well as analysing data from multiple sources.
Wellington was the prime focus for the research, however due to the national and global nature of this
sector most of the findings are relevant nationally. In 2015 cyber security transactional activity in New
Zealand was estimated at $1.67 billion, of which at least 16% was attributed to Wellington.

Growth in employment numbers in Wellington over the last two years was 19% and this is forecast to be at
38% over the next two years. This represents around 270 additional full time jobs in Wellington alone.

Initial industry discussions and information analysis identified skills as of primary importance if the cyber
security sector were to respond to workforce demands and growth pressures. Therefore this report
focuses on the systemic issues around skills and workforce development.

Research was based on the following factors:
•      Understanding the scope of the cyber security workforce pipeline;
•      Establishing a baseline of current cyber security capabilities and proficiencies; and
•      Identifying the general training needs of the cyber security workforce.

A collaborative approach was adopted in informing the report. This acknowledged a national imperative
driven by implementing the NZ Cyber Security Strategy, TechNZ’s Digital Nation work and momentum from
the private and tertiary sectors to be engaged in supporting the development of the industry. The need for
continued collaboration between government, business, training institutions and the regions was
continually reinforced in workshop discussions.

Traditionally, organisations have taken a reactive approach to cyber security – responding to threats as
they occur, rather than pro-actively protecting and managing cyber risk. To be fully effective there is a
need to move cyber security to a proactive demand-driven system. This will require information on where
the jobs are, what skills they require and what credentials are most relevant to in-demand occupations.
Timely and reliable information will be critical as will partnerships, articulation of careers ladders and using
research and evaluation to guide future development.

New Zealand is not alone. International evidence points to a huge gap in the skills required to fill cyber
security roles and this is predicted to increase further over the next few years. The 2015 Global Information
Security Workforce study1 identified a likely shortfall of 1.5 million professionals by 2020. By comparison,
tertiary student enrolment numbers in New Zealand across the technology sector has seen little if no
growth over the last 5 years and the number enrolled in cyber science for 2014 only represents 2% of the
total. And of those nearly 50% are international students. Furthermore the numbers graduating across the
sector have been declining.

A review of Immigration and the numbers coming into Wellington (and New Zealand) under a skilled
migrant visa identified a low number and a difficulty in being able to recruit for roles that are not identified
within the ANZSCO system. Recruitment based on job titles was also seen to be largely irrelevant as skills
were a much better measure of fit for purpose.

Such limitations on the skills supply side coupled with a skills gap among workers in their understanding of
the business itself (not just the technology issues) has significant workforce and training implications for
New Zealand.

4|Page
Businesses identified that the education for cyber security roles was falling short in what was needed in the
workplace. They supported a greater focus on training while on the job as the technical elements where
changing at such a pace that the traditional training regimes had difficulty remaining relevant to the sector.

Countries like the United Kingdom and the United States provide appropriate models and both have
invested heavily in skills and workforce programmes. Similarly they have moved their training and
development of individuals to be more focused on what industry is looking for with the introduction of
apprenticeships and internships. Professional qualifications are important for parts of the sector and more
emphasis is put on these than graduate qualifications. New movements are underway to develop the
school sector so that career pathways are obvious to secondary school aged pupils.

In light of the evidence provided, industry feedback and reviewing international practice a series of
recommendations is provided. The proposed approach to be adopted for cyber security could readily be
applied to other emerging technology sectors where ANZSIC and ANZCO based data is insufficient to be
meaningful from a skills and workforce development perspective.

Recommendations

Recommendations are presented on the basis of a process of firstly meeting information gaps, then
developing a framework for action and then delivering initiatives designed to address constraints to future
sector development as identified in this report.

The key recommendations are:

    1. That Wellington works with the central government agencies and business to develop an agreed
       skills framework for cyber security. The framework would be piloted in Wellington with the view of
       demonstrating effectiveness such that it is adopted nationally.

    2. That a project be undertaken to develop a skills-based demand profile for the cyber security sector
       in Wellington. This would include Statistics NZ looking at data collection options across the cyber
       security in addition to other data sources and business surveys.

    3. That Immigration New Zealand (MBIE) and Wellington use the skills framework to develop a skilled
       migrant pathway for the cyber security sector

    4. That Wellington works with business and education on delivering internships for the current
       Summer of Tech programme, with a focus on cyber security businesses. At the same time
       investigation on international intern exchange programmes as a potential option for bringing in and
       building local skills should be completed.

    5. That pilot programmes be developed with Wellington secondary schools to raise awareness of
       opportunities for employment; and with Victoria University and WelTec to develop the future
       pipeline of security professionals through shorter programmes with industry experience.

The above recommendations all require detailed planning and resourcing. Developing a skills and
workforce framework can be readily modelled on international examples and populated with the
information provided in the report. Information gaps have been identified and the WRS Office is currently
working with industry to collate further skills related data as a basis for informing future interventions.

5|Page
1. Introduction
This report presents insights into the cyber security sector in Wellington (and New Zealand). Its focus is on
skills and workforce development challenges and opportunities in building this growth sector. The report:
reviews the nature and scale of cyber security activity
identifies the key opportunities and issues across the sector
attempts to quantify potential skills demand and supply
researches international practice related to cyber security workforce frameworks and
provides recommendations to deliver on opportunities and help address constraints to growth
This exercise stemmed from a sector profiling project started in late 2014 looking at the Creative Digital
Industry (CDI) in Wellington. The aims of the research are to understand the growth opportunities for
Wellington region by having a broader range of business metrics at a deeper sector level that was available
through traditional statistical information.
Cyber security stood out as a potential area for investigation as it has a strong focus in Wellington.
Transactions for 2015 are estimated at around $300 million. Also it represented a business activity that was
relevant and embedded across all parts of the economy. Hence it presents challenges to how we classify a
“sector” in a traditional sense and attach metrics to this.
The investigation with industry identified a number of areas for consideration: sector capability, cyber
security awareness and innovation. Sector capability related to skills and workforce demand was identified
as a critical issue for growth and hence the focus on this report.
Both internationally and locally, cyber security is increasingly becoming a key concern. Expansion in
technology ecosystems has led to the emergence of several new segments such as big data, cloud
computing, social media and mobile services (apps etc.). This paradigm shift in technology and mobile
applications has created many new opportunities in cyber security. However the inadequate supply of
people with critical skills is emerging as a risk for organisations, making their networks and digital
information systems more vulnerable to cyber threats for example.
Cyber security is one of the most challenging aspects of risk management. According to the Global Risks
Report 2016 (World Economic Forum) cyberattacks and related incidents have been entering the global
risks landscape as among the most likely and most potentially impactful risks over the past two to three
years.2 In 2015 it was estimated that the average annual losses to companies worldwide now exceeds $7.7
million (a 19% increase on 2014), and the number of successful attacks per year per company showed a
46% increase over 4 years.3
These trends are significant in themselves but another related trend is the time to resolve these attacks
with the mean time in 2015 being 46 days, up from 14 days in 2010. It is predicted that global annual
cybercrime costs will grow from $3 trillion in 2015 to $6 trillion annually by 2021.4
Desktop research, industry discussions and the analysis of many data sources identified a range of
problems that this report attempts to highlight and suggest solutions to. Rapidly evolving information
technology jobs are often unique and therefore difficult to quantify and benchmark by traditional means.
The lack of standardised job titles and what technology professionals actually do on the job is a common
problem. The UK and US have tried to solve this for the Cyber Security sector, however part of the problem
remains that some skills command higher value than others and matching of job titles doesn’t necessarily
mean the same work is done. Understanding the skills required for roles is more important and will
become critical for companies entering into the market for cyber security specialists.
6|Page
A consideration for the immediate future will be the training and retraining of security professionals. The
objective of training is to prepare a person for future roles. This means adequate resources for training and
development need to exist.
The need to move into a demand-driven system where we have information on where the jobs are, what
skills business requires and what credentials are most relevant to in-demand occupations appears an
imperative. This will require timely and reliable information, the setting up of partnerships, articulation of
careers and using research and evaluation to guide future development and public interventions.
2. Context
The context for this report requires both a national and sector perspective. From a workforce development
angle, there is also a need to understand the baseline components that drives cyber security as a sector.
These are:
Awareness – knowing that businesses understand the risks posed from the boardroom through to a
staff level. There are many international consultancies operating in this field, including in
Wellington.
Sector capability (skill sets) – this is a complex and rapidly evolving sector that requires many skill
sets, many yet to emerge.
The tools – the technology that protects systems from cyber-attacks and ensures that information
is secure, yet accessible.
Analysis of the sector identified a New Zealand market of $1.7b as at Dec 2015.
2.1. Cyber Security is critical for New Zealand
Cyber security is at the forefront of protecting critical infrastructure, business and computer networks
from attack by foreign nations, criminal groups, hackers, and terrorist organisations.
The New Zealand Government has recognised this with the refreshed Cyber Security Strategy released
in December 20155 (figure 1) which is accompanied by an action plan. The budget announcement in
2016 of $22m being allocated to the establishment and running of a Computer Emergency Response
Team (CERT) facility within MBIE provides further support6. Steps have been taken to include industry
in the action plan by holding a summit which resulted in a number of actions and taskforces being
established7, including:
Cyber Credentials scheme
Cyber security workforce
Extend the content of Connect Smart messages and develop new tools
CERT set up
7|Page
Figure 1 – NZ Cyber Security Strategy

  To combat these global and local threats, Wellington, New Zealand, and the rest of the world depends
  on having a robust, agile, and highly trained cyber security workforce. However, the challenges facing
  cyber security professionals change rapidly. This means they must develop and constantly refine their
  knowledge and skills across a multitude of disciplines.

  New Zealand is exposed to the same cyber threats, however it does not have the scale to enable a
  workforce development programme like the US and UK for example. This means many of our
  professionals will need to be specialists across multiple areas unlike our counterparts where they may
  specialise in one particular area.

  2.2. Multiple points of interest

  Within the context of the Cyber Security Strategy there are multiple organisations with interest in
  looking at the issues and opportunities. The Department of Internal Affairs (DIA) is taking a broader
  look at the skills for technology roles across government and has identified cyber security as an
  immediate priority. Immigration New Zealand and the sector team at MBIE are also actively involved in
  working with the technology sector on skills supply and sector capability factors.

  TechNZ , the ICT peak body, has recently published their report “From Tech Sector to Digital Nation.”8
  While focusing on technology as a whole they have identified that cyber security is a critical part of
  this. More importantly understanding skills and workforce development is critical to advancing New
  Zealand in technology and its protection.

  Connect Smart9 provides an online portal to information on cyber security. It is led by Government’s
  National Cyber Policy Office (NCPO), part of the Department of the Prime Minister and Cabinet
  (DPMC). This is in partnership with a range of government agencies, non-government organisations
  and the private sector.

  With multiple agencies and organisations working on solutions, the need for a collaborative approach
  is evident.

8|Page

2.3. Understanding the sector

    To ensure that the cyber security workforce is properly equipped to respond to barriers and
    opportunities, it is important to first understand the current environment and what the barriers to
    growth might be. In the first instance this involves developing an evidence-base to understand skills
    supply and demand. Along with industry support, such understanding helps inform the nature of
    public interventions.

    Measurement of this sector is difficult due to the nature and collection of relevant data. The
    workforce information collected by Statistics NZ is at a higher level than cyber security, with only one
    ANZSCO (occupational classification) role being security related. There is limited ability to interrogate
    data and understand which jobs may have cyber security as their core function. Generic titles like
    network analysts, software testers and project managers are likely to involve a number of tasks.
    Therefore developing any clear understanding of what numbers are employed across this sector was
    not practical through ANZSIC based statistics.

    The Digital Nation report10 by NZTech also acknowledged the limitation of traditional statistics in the
    ability to fully understand the ICT sector (of which cyber security is part of) as easily as more traditional
    industries such as manufacturing.

3. Scope and Methodology
This cyber security report is the result of almost two years work looking at a new approach to quantifying
sector activity and opportunities. Cyber Security is but one of these sectors and has emerged as a national
priority. The area of skills supply and demand arose from industry engagement as the priority focus.

The process in compiling this report involved three stages:

    1. Gathering and analysing data from both traditional and non-traditional sources; and researching
       international models
    2. Commissioning reports on the scale of the sector in Wellington and New Zealand; and on current
       occupations
    3. Testing data and international thinking with industry, education and government and developing
       thought leadership for Wellington and New Zealand.

This is summarised in Figure 2. Findings from these stages are incorporated throughout this report.

Figure 2: High level process

         Labour
         market
                     International              Test
                                              concept/         Understand                      Final
                                                               needs/test
                                                idea
                                             generation          ideas                        report
       Immigration    kMatrix
       & Education

            Data gathering                           Workshops                           Idea development
9 | P a g e Qunatitative                             Qualitative
The scope of the report is limited to the labour market which includes workforce development, skills
requirements and supply, and sector capabilities. This approach is consistent with part of the New Zealand
strategy and issues in the Immigration area around identifying skill sets.
The focus of findings and industry discussions has been on Wellington however in the context of the
national strategy and national interests.
3.1. Starting point
Problem definition: ability to measure emerging sectors.
The ability to assess, measure and monitoring business activity in emerging sectors, or sectors that
were evident across much of the economy, was proving a challenge for government agencies,
universities and industry bodies. In early 2015 the Wellington Regional Strategy Office partnered with
Callaghan Innovation on a pilot to investigate a different way of profiling a sector and attribute
economic and employment metrics to the components of a sector.
The pilot was on the creative and digital industries (CDI) for Wellington and the story around the fusion
of creative and digital activities. For Callaghan Innovation the national priority was on high value
manufacturing and services (HVMS).
London based company kMatrix (Appendix 1) was contracted to develop a sector classification system
(taxonomy) that would measure the industries down to groups of like companies. Utilising the UK
developed taxonomy for the creative and digital industries; Wellington stakeholders were able to
refine the information to a New Zealand context. For CDI this resulted in 3000 lines of activity
describing the sector. For each of these activities, sales, exports and employment numbers were
attributed at a national and Wellington level. Equivalents for seven of our trading partners were also
purchased. This provided details on a number of sectors that were highlighted as opportunities for
growth in Wellington.
A key driver – to enable potential investment and identification of growth opportunities for the
Wellington Region
Subsequent analysis and industry discussions were conducted for gaming, design, film/screen
production and cyber security. This report focusses on the latter.
The initial data collected through kMatrix identified where New Zealand sat in the global market.
Desktop research was undertaken to identify what was already happening internationally that was of
relevance to NZ. The five-eyes partnership (an intelligence alliance comprising Australia, Canada, New
Zealand, the United Kingdom and the United States) was used as a base to review education and skills
development models already in place.
10 | P a g e3.2. Cyber security reports and analysis
Wellington already has a strong presence with large suppliers located within the region as well as
being the seat of Government. However to determine the size and status of the cyber security sector
it was important to source multiple data sources Our initial data collection built on work previously
completed with CDI.
Further reports were commissioned from kMatrix who are the official statistics provider for cyber
security to the UK Government. These included data on transactional activity for NZ and Wellington,
sector growth rates, occupation and export/import information. Some international comparisons were
also provided and are included in this report.
This sector data was complemented with NZ statistics on education and immigration as a basis for
reviewing skills supply through immigration and the tertiary sector.
3.3. Stakeholder engagement
The next phase was to test the data, assumptions and potential opportunities with industry and other
key stakeholders (Appendix 2). An initial targeted approach was made by phone. This was followed up
with individual face to face interviews to better understand the cyber security sector in Wellington,
what their key issues were and what the opportunities might be. This provided a qualitative view of
the sector to supplement and test the data gathered.
The key themes that emerged from these discussions were:
Skills and education
Collaboration and clusters
Awareness
These themes were workshopped, out of which emerged agreement that skills and education was the
priority activity for collective action.
A subsequent workshop was held with industry, education institutions and Government departments
to review the information collected. The workshop also focused on presenting in more detail the
information gathered through the data collection and analysis stage.
11 | P a g e4. International To understand the key issues likely to face New Zealand in the near future, international partners provide a useful baseline. The five-eyes has developed and been delivering in the cyber security space going back to 1998 in the case of Canada. All countries have recognised the need to focus on this emerging sector and the importance of the workforce component. Figure 2 provides a summary of each country’s key investments in support of the respective strategies and national CERT arrangements. Of particular note for this project are the skills and workforce areas developed in the UK and US. The timeline also shows that while there is work happening across these countries, the most significant progress over time has been in the UK and US. This is also evident with the amount of funding that has been earmarked by the respective Governments (Table 1). New Zealand’s current per head of population spend by comparison is low. Figure 3: International timeline Skills and workforce development underpin much of our future work in this area. However with 1 million cyber security job openings entering 201611 and a predicted demand for a cyber security workforce expected to rise globally to 6 million by 2019 with a 1.5 million shortfall, there are challenges ahead. This means for the new workforce to be developed and trained there needs to be a greater understanding of what is required, and by when. 12 | P a g e
Table 1: Government spending on Cyber Security (generally over 4 years)

                                                                            Per head of
    Country                          Population Government spending
                                                                            popultaion
    US                              322,762,018 $    19,000,000,000 $              58.87
    UK                               65,088,276 £     1,900,000,000 £              29.19
    Canada                           36,266,307 $       237,000,000 $               6.53
    Australia                        28,852,637 $       230,000,000 $               7.97
    NZ                                4,563,063 $        22,200,000 $               4.87

         Source: various articles

The data accessed through kMatrix identified New Zealand’s relative position to four other countries (Table
2) and how cyber sales as a percentage of GDP compare. Again, the level of activity suggests that New
Zealand is likely to see further growth and additional investment may be required to address sector
capability constraints.

    Table 2: Cyber Security Sales as a % of GDP – kMatrix

 Country                                                             Sales NZ $m    Cyber Sales % Share of
                                                          Year to December 2015                      GDP
 Australia                                                               $12,182                     0.7%
 New Zealand                                                              $1,697                     0.7%
 United Kingdom                                                          $47,431                     1.2%
 United States                                                          $212,519                     0.9%

Due to the size of the sector in the US and UK, the number of professional industry organisations and
government support there tends to be more international cyber security research. Desktop analysis of such
research helps inform what a national skills framework might entail and what constraints NZ could
experience.

The major global cyber security trends12 highlight a number of areas that need to be taken into account
when developing this sector. These are:

         1. The unintended consequences of state intervention – varying regulation and legislation
            potentially restricting activities of organisations as more policing of the internet is done
         2. Big data will lead to big problems – there is still a human element to big data and the ability to
            manipulate in secret will be of increasing concern
         3. Mobile applications and the Internet of Things (IoT) are creating a prime target for malicious
            actors
         4. Cybercrime causes the perfect threat storm – Cyberspace is an increasingly attractive hunting
            ground for criminals, activists and terrorists motivated to make money, cause disruption or
            even bring down corporations and governments through online attacks, and

         5. Skills gaps become an abyss for information security – While cybercriminals and
            hacktivists are increasing in numbers and deepening their skillsets, the "good guys"
            are struggling to keep pace

13 | P a g e
4.1. Skills shortages
Worldwide there is a skills shortage and it is predicted to get larger. Evidence from the ISC2 Global
Information Security Workforce study13 shows that 1.5m more cyber security professionals will be
needed to accommodate the global shortfall by 2019. Among other things it identifies top demand
and growth roles as well as top skills and competencies looked for across the sector.
Top roles in 2015 that were in strong demand were:
1. Security analyst
2. Security auditor
3. Security architect – products & solutions
4. Forensic analyst
5. Incident handler – organisation Top skill required
Top growth roles: over the next 3
1. Security analyst
2. Security Consultant – Management years is risk
3. CISO – Chief Information Security Officer
4. Security Auditor assessment and
5. Information assurance Manager
management
Top skills and competencies needed over the next three years
1. Risk assessment and management
2. Incident investigation and response
3. Governance, risk management & compliance
4. Analytical skills
5. Architecture
Matching these roles to the New Zealand market can best be done through qualitative information
since current statistics do not provide such detail. Generally the various roles above are strongly
represented in the Wellington cyber security sector (Table 5, p23)
International information was tested with industry to identify whether these trends were in fact
similar in New Zealand. While on the most part the trends do follow in New Zealand, the size of our
businesses means many of these roles are merged.
A recent report by Intel Security14 which reviewed 8 countries (including Australia) identified that
demand is outpacing the supply of qualified workers in all countries with Australia sitting at the top of
the list. The effect of this is pushing wages up internationally with some countries paying up to a 9%
premium for cyber professionals.
The study also identified that companies would like to see a bachelor degree as a minimum
requirement for entry into this field, however there is limited availability with only 7% of top
universities in the countries surveyed offering undergraduate majors or minors in cyber security.
While companies were keen to see a bachelor’s degree, only 23% of respondents thought that these
education programmes were preparing students to enter the sector. The results of the survey
identified that the degree was more of a signal of general competence and in fact hands on experience
with the addition of professional certifications was preferred.
Another issue which is causing concern globally is the lack of diversity across the sector with only 10%
of professionals’ being women15. This has led to conversations around how to widen the horizon and
look beyond technical skills alone as these skills while important are insufficient in resolving complex
14 | P a g erisk management. In the research women tend to take more of the roles that are focused on
governance, risk and compliance.
While industry is demanding new skilled workers with a greater emphasis on practical learning (as
opposed to theoretical) another issue is manifesting itself in academia. A recent IBM report looking at
cyber security education for the next generation16 has highlighted that while there is growth in the
programmes being offered, there are insufficient skilled and qualified instructors. This is coupled with
the issues of staying aligned with a fast changing area and therefore needing our education
organisations to deal with changing programmes to keep up.
New Zealand is not immune to such skill’s issues. In the global market we will be competing to attract
the required skills and likewise international companies will be trying to attract our graduates and
staff.
4.2. Skills frameworks
Both the UK and the US have invested in the development of skills frameworks to help address the
shortages across the cyber security sector. They have also built a number of support structures aimed
at creating a stronger sector.
4.2.1. United Kingdom (Appendix 3)
Through CESG17 (National Technical Authority for Information Assurance) a certification
framework for Information Assurance (IA) professionals that work in the UK public sector has
been developed. The framework has been aligned with the Skills Framework for the
Information Age (SFIA). The framework is also available to the private sector and encourages all
professionals to apply for certification. As this was built as a certification framework it focuses
more on the role and describes the competencies and skills needed for that role.
The SFIA framework18 requires businesses to buy a licence. SFIA does not attempt to cover all of
the things that an individual may be required to do, as it doesn’t describe any product or
technology-specific skills or knowledge, sector experience or qualifications.
Inspired Careers19 has been developed with the support of BIS (Department of Business
Innovation & Skills) and CREST to provide an interactive careers hub for people looking to enter
the Cyber Security sector straight from education; those who want to move into Cyber Security
from other industries; or those already working within the sector who want to further their
careers.
InfoSecSkills Cyber Career Academy (an information security training and education company)
has also developed a career path in a one page document20. This is again focused on roles but
provides a professional pathway and identifies the different certificates and development needs
at a high level.
The UK Government recently announced apprenticeships21 in security that sit alongside other
apprenticeships already up and running in the Tech sector. There is an emphasis on building the
sector from the ground up and has taken into account that there are multiple ways to create the
right skills i.e. apprenticeships, degrees, degree apprenticeships, accredited degrees and training
programmes.
The key is to get young school students interested in these career paths and to do that the Tech
Partnership has developed a number of tools for both teachers and students, including a careers
hub that takes kids on a journey of discovery.22
15 | P a g eHowever a recent industry survey in the UK, showed just 14 per cent of respondents said the
British education system was adequate in preparing IT professionals for cyber security with 75
per cent of professionals saying there was a shortage of talent in the UK.
Despite that, the country is ranked highest in current investment in cyber security education and
is thought to be best situated to institute educational reforms.23
The UK has a number of certification and training bodies including:
• The Chartered Institute for IT
• The Institute of Information Security Professionals (IISP)
• CREST (Council of Registered Ethical Security Testers) – Also has a chapter in Australia
• InfoSec Skills Cyber Career Academy
Immigration policy has enabled cyber security specialists to come into the country by adding the
occupation 'cyber-security specialist' to the official skills shortage list from November 2015. If
the business becomes a 'qualifying company' this would make them exempt from having to
advertise for 28 days to recruit non-EU workers. However this is still seen by many as too little
to fill the large gap currently in this sector.
Finally the UK Cyber Security Forum was created as a place for cyber security companies to
connect and share. Their focus is on small companies and over time they have developed into
regional clusters. The clusters are for providing valuable networking and knowledge exchange
opportunities for:
• Government, academia and industry
• Specialist cyber security professionals
• Start-ups and entrepreneurs
• SMEs and larger organisations
• Mentors and investors
4.2.2. United States (Appendix 4)
There is rising demand for qualified cyber security talent and industry is calling for a common
definition of the scope of work covered in cyber. The National Initiative for Cybersecurity
Education (NICE) led by the National Institute of Standards and Technology (a partnership
between government, academia, and the private sector) has developed a framework for skills
which is available freely to all on their website24.
The workforce framework provides a common language to describe cybersecurity work
regardless of organisational structures or job titles. It lists and defines 31 specialty areas of
cybersecurity work and provides a description of each. It also identifies common tasks and
knowledge, skills, and abilities associated with each specialty area. The Workforce Framework
provides a common language to describe cyber security work regardless of organisational
structures or job titles.
Apprenticeships have been introduced and in a recent article the following conclusions were
made “The use of apprenticeships to accelerate workers into the cybersecurity workforce so
that students can earn as they learn is an exciting and promising practice that employers and
academic organizations should explore.”25
16 | P a g eRecently the National Integrated Cyber Education Research Center26 which focuses on curriculum design,
professional development, and collaboration in K-12 education has been set up. An important part of their
function is to enable teachers to gain hands-on experience with projects and technology that provide new,
innovative ways to engage students in the classroom.
The Advanced Cyber Security Center27 is a cluster initiative that brings together industry, university, and
government partners to address the most advanced cyber threats. “We focus on sharing cyber threat
information, engaging in next-generation cybersecurity research and development, and creating education
programs that will address the shortfall in cyber talent.”
Their goal is to help establish New England as a major region for cybersecurity research and development,
education, and thought leadership by building on the considerable cyber security strengths already existing
in the region.
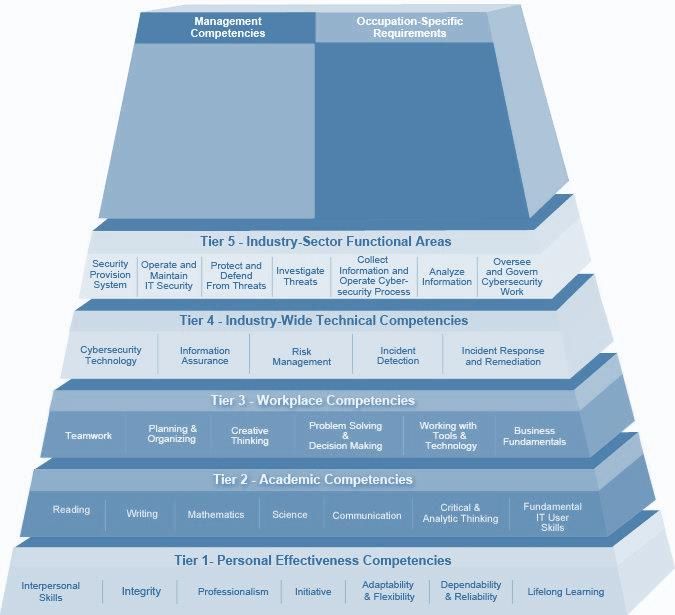
The development of a cyber security sector model28 was designed to represent the competencies needed
by individuals whose activities impact the security of their organisation. The model’s tapered shape (figure
4) represents the increasing specialisation and specificity of proficiencies covered. Its tiers are further
divided into blocks that represent competency areas i.e. groups of knowledge, skills, and abilities. These are
defined using critical work functions and technical content areas.
This type of model is used across a number of industries to allow employers and employees to understand
not just the technical skills that are required but also to identify the soft skills needed by individuals
working in these areas.
This model summarises quite neatly the issues that are seen across this sector. Mainly with ensuring that
people not only have the skill sets for their particular job but are also developing the mind-set to enable
them to be strategic and develop into senior roles.
More than 209,000 cybersecurity jobs currently sit unfilled in the US today and
often of those that apply for the jobs 75% are unqualified.
The US also has a number of certification and training bodies including:
• International Information System Security Certification Consortium (ISC)²
• Information Systems Security Association (ISSA)
• The SANS Institute
• ISACA (international and includes a Wellington Chapter)
• Software Engineering Institute (SEI)
17 | P a g eFigure 4: Cyber security sector model
Source: United States Department of Labor
While the size and scale of these markets is substantially different to New Zealand there is increasing
reliance on skills and qualifications that can be used globally. Much work has been done in understanding
new ways of identifying the cyber security sector and developing systems and policies that will support this
growth sector. By comparison, New Zealand is just starting this journey so learning from international
models provides a logical pathway.
5. Wellington Situation
As outlined in Section 3 Scope and Methodology section, information gathering has been done to identify
what the size of the Wellington market is in comparison to New Zealand and internationally. This
information has largely been of a quantitative nature.
However because of the exploratory nature of some of the information, it was tested with industry to gain
confidence that it represented a true picture of the scale and nature of cyber security activity, particularly
for Wellington.
18 | P a g e5.1. Quantitative Information
Data collection for Wellington was initially focused on understanding the different activities that make
up the sector and identifying where there may be potential growth opportunities for the region. Using
the kMatrix international taxonomy data to level 2 (Appendix 1 for definitions) was obtained showing
the size of each defined activity area. Figure 5 shows the different sector categories across cyber
security and the sales value for the year to December 2015 at $272m.
This sales figure represents 16% of the NZ total and 19% of national exports. The volume of
transactions supports the proposition that there is significant expertise in Wellington and potential for
further growth.
The full data set is included in Appendix 1.
Figure 5: Wellington Cyber Sales (2015 $m) by category – kMatrix
Comparisons by activity area for global, New Zealand and Wellington growth (figure 6) demonstrates
how the region is tracking. Wellington and New Zealand follow a similar pattern but the graph
identifies where global growth is happening at a much faster rate with some areas showing almost
25% growth in 2015.
This gives more reason for the development of a well resource strategy and the development of a skills
base to enable future development of the sector.
Understanding where the growth opportunities are led to further investigation into understanding the
skills supply and demand across these activities. This included employment projections and the supply
component from the tertiary sector and immigration.
19 | P a g eFigure 6: Growth in Cyber Security Sales (%) for 2015
Data was obtained from the short term employment forecasts, migration trends in specialist areas as
well as education enrolments and graduations across the technology sector.
Short term employment forecasts produced by MBIE (Table 3) are only broken down at a high level
and include only one area that is distinguishable as cyber security. This is ICT security specialist which
is added into a category that also includes Database and Systems Administrators. Potentially cyber
security roles will sit within other technology categories and in industries such as finance and data
storage. Thus the ability to measure skills in the cyber security is challenging with traditional
information sources.
Table 3: Short-term employment forecasts: 2016-2019
Wellington - March 2016 Update 2016-19 Changes
Regional Occupational Employment Levels 2016 2017 2018 2019 Levels Rates
135 ICT Managers 2,404 2,503 2,610 2,712 308 4.1%
261 Business and Systems Analysts, and Programmers 10,453 10,867 11,314 11,742 1,288 4.0%
262 Database and Systems Administrators, and ICT Security Specialists 1,603 1,634 1,669 1,699 97 2.0%
263 ICT Network and Support Professionals 1,612 1,674 1,740 1,803 190 3.8%
313 ICT and Telecommunications Technicians 1,588 1,567 1,550 1,528 - 61 -1.3%
Total 17,660 18,245 18,883 19,483 1,823 3.3%
New Zealand - March 2016 Update 2016-19 Changes
Regional Occupational Employment Levels 2016 2017 2018 2019 Levels Rates
135 ICT Managers 8,620 9,015 9,444 9,856 1,236 4.6%
261 Business and Systems Analysts, and Programmers 39,575 41,367 43,302 45,180 5,604 4.5%
262 Database and Systems Administrators, and ICT Security Specialists 7,244 7,447 7,671 7,877 633 2.8%
263 ICT Network and Support Professionals 7,522 7,842 8,189 8,523 1,001 4.3%
313 ICT and Telecommunications Technicians 9,080 9,048 9,043 9,008 - 71 -0.3%
Total 72,041 74,720 77,648 80,445 8,403 3.7%
Source: Ministry of Business, Innovation and Employment29
20 | P a g eThe granularity required to understand this sector from an employment perspective was not available.
As an example, taking the short term employment forecasts would assume a small 2% increase for
wellington in the only role identified as a security specialist. This does not correlate with the 5-12%
sector growth rates in 2015 nor what is predicted to 2018.
An indicator of future skills supply is the level of tertiary education enrolments across technology
based fields. This demonstrates a low proportion of enrolments in the security science relative to
other ICT qualifications (figure 7). There will be a need to understand what technology related skills
and disciplines outside security science are transferrable to cyber security activity before any relatively
between sector demand and graduate supply could be assessed.
Figure 7: Student numbers by field of study (Enrolled - NZ)
Source: Education Counts 2016, Ministry of Education
In the data obtained at graduate level the trend showed a decreasing number of graduates across the
technology field (figure 8). If we assume that this is a trend across all fields of study in technology our
focus on security (and technology) as a growth sector will be tested in the future.
Figure 8: Information Technology Graduates (NZ Domestic)
Source: Education Counts 2016, Ministry of Education
21 | P a g eData collection also includes the number of migrants arriving in New Zealand and Wellington on the
skilled visa category (table 4). These numbers are for the technology sector and only show one role for
cyber security as outlined above with the forecast growth numbers. This data also identifies that the
numbers coming in on skilled visas are both declining and low for Wellington relative to sector growth.
Number of people granted Number of approved SMC
Table 4: Migrant arrivals Wellington & NZ Essential Skills work visa and principal applicants working
working in tech jobs in tech jobs
Wellington Region only
Financial Year Decided Financial Year Decided
Occupation
2012/13 2013/14 2014/15 2012/13 2013/14 2014/15
ICT Business and Systems Analysts 21 21 19 31 30 19
Multimedia Specialists and Web Developers 339 328 75 17 28 20
Software and Applications Programmers 79 68 75 88 103 128
Database and Systems Administrators, and ICT Security Specialists 21 15 8 26 28 23
ICT Support and Test Engineers 28 35 28 31 21 35
Telecommunications Engineering and Computer Network 11 12 15 18 22 18
ICT and Telecommunications Technicians* 26 35 36 67 67 52
Total in "tech"-related occupations (Wellington only) 525 514 256 278 299 295
Note: *Due to small numbers, these two occupations have been grouped together.
New Zealand overall
Financial Year Decided Financial Year Decided
Occupation
2012/13 2013/14 2014/15 2012/13 2013/14 2014/15
ICT Business and Systems Analysts 94 100 74 353 427 391
Multimedia Specialists and Web Developers 401 396 151 128 200 183
Software and Applications Programmers 263 277 289 965 1241 1529
Database and Systems Administrators, and ICT Security Specialists 61 61 42 218 316 255
Computer Network Professionals 54 45 33 222 330 295
ICT Support and Test Engineers 67 90 74 253 246 380
Telecommunications Engineering Professionals 20 18 18 130 309 305
ICT Support Technicians 234 253 326 792 787 856
Telecommunications Technical Specialists 30 11 7 91 75 55
Total in "tech"-related occupations (New Zealand) 1,224 1,251 1,014 3,152 3,931 4,249
Source: Ministry of Business, Innovation and Employment
One of the issues around immigration is knowledge of what skills a sector requires. Currently cyber
security is an emerging sector with no developed and published skill base. It does not feature in the
ANZSCO codes in any detail and therefore not only is it hard to measure but the information needed to
make resourcing decisions is not apparent.
kMatrix was subsequently contracted to identify the numbers of people in Wellington undertaking
cyber security roles. These roles were based on international job titles and in particular those currently
showing high growth and demand. Industry tested these roles based on what they were currently
seeing in the workforce. This data provided the number of people employed (FTEs) across roles for
Wellington and New Zealand. The methodology (kMatrix) was also used to forecast growth across
these roles over the next 2 years (table 5). Growth figures are calculated from historical trends and
triangulating sales against people numbers.
The data identifies forecast growth rate that is consistent with what is happening internationally. The
average growth for the two years 2014-16 was around 20% while the forecast growth for the two
years 2016-18 is nearer to 40%. This is a strong indicator of future demand.
22 | P a g eTable 5: kMatrix Job title statistics (Wellington)
% Forecast Forecast %
Growth growth Forecast Growth Growth
Job Title
Heads Heads last 2 last 2 Heads over 2 over 2
2014 2016 years years 2018 years years
CISO – Chief Information Security Officer 18 22 4 22% 32 10 45%
Cryptographer/Cryptanalyst 11 14 3 27% 20 6 43%
Cyber Incident Response Specialist 14 17 3 21% 23 6 35%
Cyber Security Forensic analyst 14 17 3 21% 24 7 41%
Cyber Threat Intelligence Analyst 29 35 6 21% 45 10 29%
Database Security Manager 20 24 4 20% 36 12 50%
Deputy CISO/CIAO 9 10 1 11% 12 2 20%
Incident handler 29 34 5 17% 40 6 18%
Information assurance Manager 15 18 3 20% 30 12 67%
Network security administrator 29 35 6 21% 48 13 37%
Penetration tester 28 33 5 18% 51 18 55%
Project manager 35 40 5 14% 48 8 20%
Security advisor 22 25 3 14% 29 4 16%
Security analyst 47 56 9 19% 78 22 39%
Security Architect – Consulting 17 21 4 24% 33 12 57%
Security architect – products& solutions 12 14 2 17% 20 6 43%
Security Auditor 16 19 3 19% 25 6 32%
Security Consultant – Management 38 44 6 16% 60 16 36%
Security engineer 16 19 3 19% 26 7 37%
Security Operations Manager 11 13 2 18% 18 5 38%
Security Software Developer 54 65 11 20% 91 26 40%
Security strategist 18 22 4 22% 30 8 36%
Security systems administrator 14 16 2 14% 22 6 38%
Security tester 29 33 4 14% 43 10 30%
Technical security consultant 13 16 3 23% 27 11 69%
Web security 35 42 7 20% 58 16 38%
593 704 111 19% 969 265 38%
Roles were chosen as a measure due to no readily available skills classification for New Zealand in this
sector. Ultimately skills will be a better measure for future as:
Education sector “trains” skills not job titles
Employers “employ” for skills and experience
Skills can be measured better than titles
Job titles change across organisations
The challenge is that skills classifications need to be agreed across industry, education and government
before such an approach could be adopted.
Timing will be critical in delivering a new generation of skilled cyber security specialists. Currently
there is negative growth in students with technology qualifications and low numbers of migrants
coming into both the country and Wellington with specific security skills. This is against a backdrop of
predicted short term growth across the sector of around 40%. Identifying where these new workers
come from should be a priority for Wellington, and indeed NZ.
23 | P a g eYou can also read