Global Road Map for Health Care Decarbonization
←
→
Page content transcription
If your browser does not render page correctly, please read the page content below
Global Road Map
for Health Care
Decarbonization
A navigational tool
for achieving zero emissions
with climate resilience
and health equity

Health Care Without Harm
Climate-Smart Health Care Series

Annex A

Green Paper
Number Two

Produced in collaboration with ARUP

Annex A: Technical report

Contents
Introduction                                                                3

Deriving an emissions baseline for 2014                                     4
              Introduction                                                   4
              Findings                                                       4
              Inhalational anaesthetics and meter-dose inhalers              6
              Results review                                                 7
              United Kingdom comparison with results published by the NHS    7
              United States and Eckelman et al. study                       14
              Further checks on national results                            15
              Methodology for supply chain analysis                         17
              Structural path analysis                                      17
              Categorization and reporting of emissions                     20
              Expanding country coverage                                    27

Health sector emissions budgets                                             29
              Introduction                                                  29
              Methodology                                                   29
              Emissions budget                                              29
              Global emissions budget for the health care sector            31
              Emissions trajectories                                        32
              Results for nations grouped according to their trajectory     35

Future health sector growth                                                 38
              Data sources                                                  38
              Method                                                        38
              Conclusions                                                   38

Decarbonization trajectories across the global economy                      42
              Overview                                                      42
              Data sources                                                  43
              IEA Energy Technology Perspectives                            43
              Emissions from agriculture                                    44
              Decarbonization pathways                                      44

The future of health sector emissions                                       50
              Combining projected growth and decarbonization trends         50
              Modelling emissions interventions                             50

| Global Road Map for Health Care Decarbonization |
Interventions                                           50
              Reducing emissions from anaesthetic gases and MDIs      52
              Health system effectiveness                             53
              Assigning emissions reduction to pathways and actions   55
              Calculating emissions reduction potential of pathways   55
              Calculating emissions reduction potential of actions    57
              Characterizing the emissions gap                        57
              Highlighting emissions resulting from fossil fuels      58
              Key assumptions and limitations                         58

References                                                            63

| Global Road Map for Health Care Decarbonization |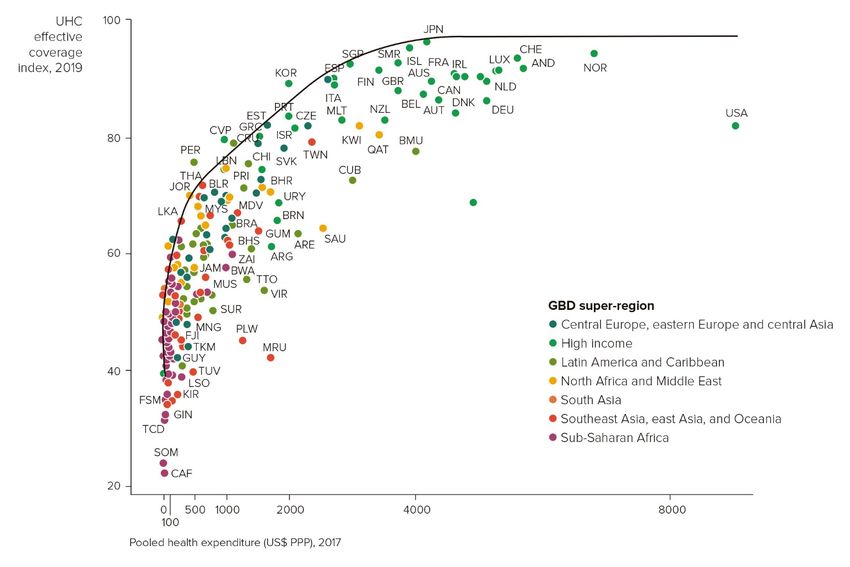
Health Care Without Harm
                                                                                                Annex A: Technical Report

Introduction

This technical report details the analytical methods used to prepare the Global Road Map for
Health Care Decarbonization.

The methodology for the following components is presented by the following:

             •             Modelling of the baseline
             •             Derivation and distribution of a global health sector emissions budget
             •             Projecting growth and decarbonization trends to predict future emissions
             •             Modelling the impact of key decarbonization actions

Additionally, there is a section highlighting the key assumptions and limitations used throughout
the study.

                                                                                                                       3
| Global Road Map for Health Care Decarbonization |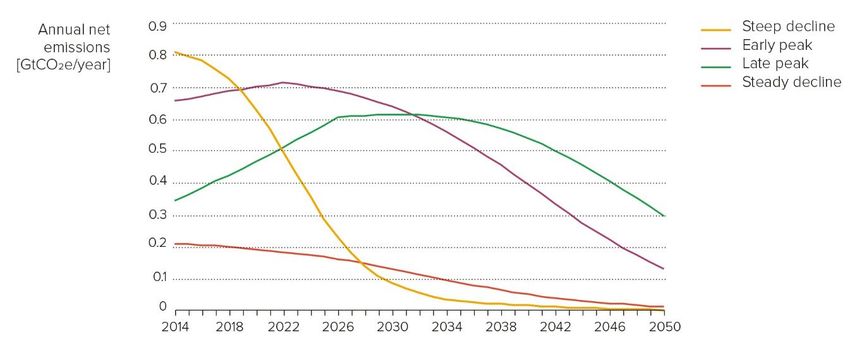
Health Care Without Harm
                                                                                    Annex A: Technical Report

Deriving an emissions baseline for 2014

Introduction
The goal of this aspect of the study was to gain insights into the Greenhouse Gas Protocol
(GHGP) Scope 3 emissions of the global health care sector beyond the findings contained in
Green Paper One (hereafter referred to as the Green Paper) 1. The method chosen was structural
path analysis, an advanced input-output (IO) modelling approach. This section covers the
methodology employed to conduct this analysis, a detailed validation of outputs against a peer-
reviewed assessment of the United Kingdom health sector footprint, and discussion of the wider
results with reference to further published national footprints.

Findings
Health care’s global emissions footprint is presented in terms of supply chain categories devised
for this study and by GHGP Scope 3 categories and sub-categories as defined in Section A.1.4.2,
Figure A.1, and Table A.3 respectively.

                                                                                                           4
| Global Road Map for Health Care Decarbonization |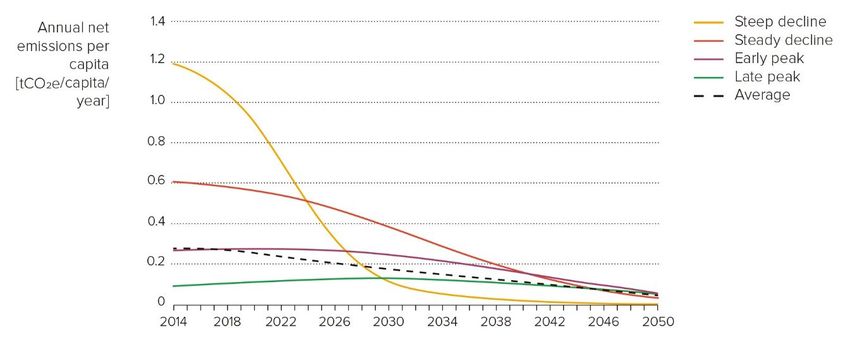
Health Care Without Harm
                                                                                                          Annex A: Technical Report

Figure A.1. Health care's global emissions footprint by supply chain categories devised for this study.

Figure A.2. Health care's global emissions footprint by GHGP supply chain categories and sub-categories.

                                                                                                                                 5
| Global Road Map for Health Care Decarbonization |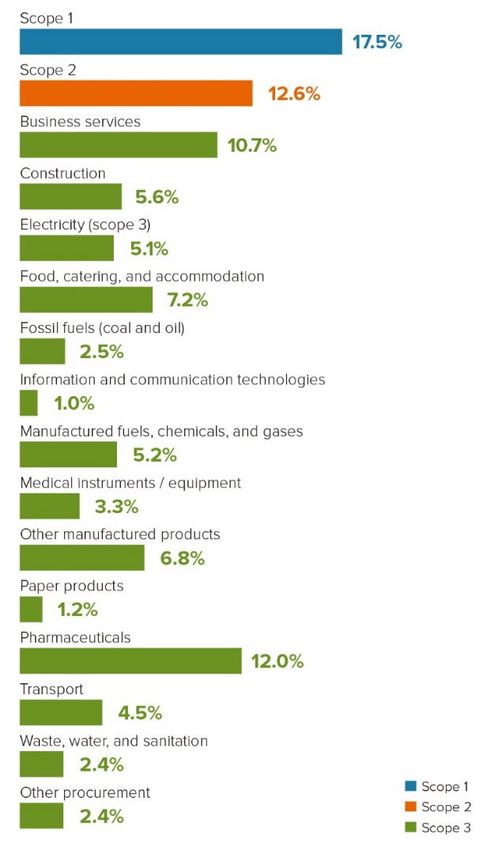
Health Care Without Harm
                                                                                         Annex A: Technical Report

Purchased health care: Second tier added to Scope 1, third tier electricity added to Scope 2, all
other impacts Scope 3

Where health care organizations buy health care services from each other, these transactions are
captured in the IO model as flows from the health and social work sector to the health and social
work sector. This means health care services appear in the supply chain for health care. A
limitation of the methodology used in Green Paper 1 is that Scope 1 emissions could only be
estimated through the IO model using the tier 1 emissions from the health and social work sector
as a proxy. This estimate therefore considers emissions from health care organizations in the
supply chain, as Scope 3, as they would be for a health care provider procuring those services
(e.g., the “other purchased health care” category in the NHS footprint). When footprinting the
entire health care system, all emissions from health care organizations should be considered as
Scope 1. The SPA allows us to transfer these emissions from Scope 3 to Scope 1, changing slightly
the estimate for Scope 1 health care emissions (for the United Kingdom, Scope 1 changes from
12.3% to 13.8%, with Scope 3 reducing by the same amount).

Inhalational anaesthetics and meter-dose inhalers

The gases used for anaesthesia are potent greenhouse gases. Commonly used anaesthetics
include nitrous oxide and the fluorinated gases sevoflurane, isoflurane, and desflurane. Global
Warming Potentials (GWPs) range between 130 kgCO2e/kg (sevoflurane) and 2540 kgCO2e/kg
(desflurane). At present, the majority of these gases enter the atmosphere after use. Similarly,
metered-dose inhalers (MDIs) use hydrofluorocarbons as propellants. These gases have warming
potentials between 1,480-2,900 times that of carbon dioxide.

These direct emissions are not included in World Input Output Database (WIOD), and there is
limited data available on the scale of the footprint associated with them. However, it is important
to attempt to represent the magnitude of these additional emissions in this study at a global scale
and explore the potential to mitigate these contributions to the climate emergency.

For anaesthetic gases, the following datasets were used:

      •      Nitrous Oxide: UNFCCC Annex 1 nations report emissions data for the use of nitrous oxide
             in the health setting, 2 which totalled 7.0 MtCO2e. Together, these nations accounted for
             15% of the global population, 57% of the global GDP, and 73% of global health expenditure
             in 2014.
      •      Fluorinated gases: A study by Vollmer et al. 3 found global emissions from these types of
             anaesthetics to atmosphere in 2014 to be 3.1±0.6MtCO2e. This study did not differentiate
             between emissions from human health care and veterinary uses, and it has not been
             possible to gather sufficient evidence to establish the proportions of these emissions
             associated with each. It has therefore been decided to report the full emissions footprint
             for these gases.

                                                                                                                6
| Global Road Map for Health Care Decarbonization |
Health Care Without Harm
                                                                                        Annex A: Technical Report

For MDIs, the following data is available:

      •      UNFCCC Annex 1 nations report emissions data for the use of MDIs,2 totalling 6.9MtCO2e.

From this data, covering the wealthiest and largest global health systems, a combined, order-of-
magnitude estimate of the global footprint has been established. Given that global data for nitrous
oxide use and MDIs was not available, this value is an underestimate.

Results review
Once the SPA was conducted for the 44 nations and regions in WIOD, a multi-step validation
process was followed. Initially, results were checked against the findings of the previous
assessment to ensure consistency with our previous work using the WIOD database.

Following this, a national comparison was conducted to benchmark the categorization of
emissions returned by the SPA against national results for the United Kingdom published by the
NHS Sustainable Development Unit. The aim of this was to assess the distribution of supply chain
emissions against previously observed results. The United Kingdom was chosen due to the
pioneering work of the NHS, which has characterized and reported emissions in detail.
Additionally, the reporting categories used by the NHS provided the starting point for the
categories used for this study.

It is noted from discussions with the leading academics in this field that making meaningful
comparisons between economic sector totals calculated by IO methods is difficult. The data
behind the IO model are calibrated to ensure the total model balances with expected values from
third parties; little is done to ensure agreement at the level of individual economic sectors. This
validation exercise therefore takes approximately +/-40% at the sector level as good agreement.
Any sectors that do not achieve good agreement are highlighted for further investigation.

In addition to the assessment for the United Kingdom, some more general checks and
comparisons of the per capita emissions breakdown across model nations was performed.
Countries where per capita emissions differed from the wider dataset were highlighted, and
where possible, checked against external data points.

United Kingdom comparison with results published by the NHS

Our modeling covers health care emissions in the United Kingdom for 2014. To derive
comparable results from the NHS data for the health and social care sector in the United
Kingdom, results for health care provision and public health were scaled up by population to
represent the whole country. Additionally, expenditure data confirms private health care

                                                                                                               7
| Global Road Map for Health Care Decarbonization |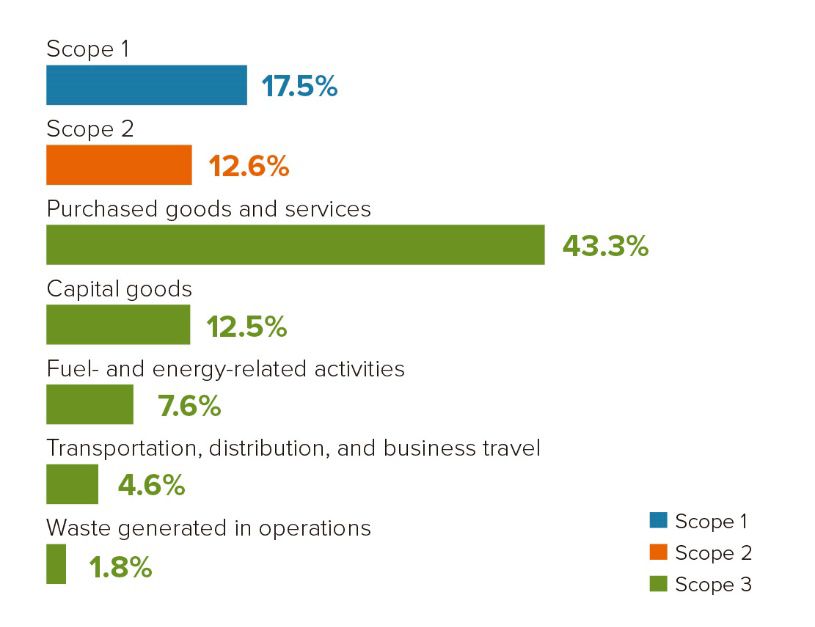
Health Care Without Harm
                                                                                       Annex A: Technical Report

represented 20% of the United Kingdom health sector in 2014, and so results were further scaled
to account for this. Based on the NHS analysis, and following this scaling process, the United
Kingdom health sector footprint was found to be 38.9 MtCO2e in 2014. Our modelling found the
United Kingdom health sector climate footprint to be 42.5 MtCO2e, meaning there was a
percentage difference of 9% between overall model totals.

The NHS methodology employed a mixture of bottom-up emissions and top-down assessment
using an IO model focused on the United Kingdom economy developed by the University of
Leeds. 4 This allowed for greater sectoral resolution in its modelling of the United Kingdom
economy than WIOD, which provides a global model structured using 56 sectors. One further
difference worth mentioning is that the IO used for the NHS had a single category for health care,
while WIOD has a combined category for health care and social work. The method ensures the
footprint reported by WIOD is for health care, and for many categories their distribution will be the
same. Yet in others, for example medical equipment and procured same-sector services, it is
possible that category-by-category breakdowns will not agree. Given the agreement between
overall model totals, and close alignment for many of the key procurement categories, this
difference is judged to be acceptable when considering differing modelling approaches and the
compromise between sectoral resolution and geographical coverage reached when WIOD was
selected for this study.

The NHS provide a detailed breakdown of their operational and supply chain emissions. Their
categorization and reporting style is widely recognized as sector-leading and has informed the
categorization system chosen for reporting the outputs of this study. Using the latest NHS
footprint update, 5 SPA outputs were aggregated to correspond with the NHS classification
system. The resulting comparison is shown in Figure A.3 and commentary is provided for each
category in the following pages. Overall, the models present a similar breakdown with emissions
focused in key procurement categories, like business services and pharmaceuticals. Taken in
combination with the close agreement in totals, the findings give confidence regarding the
accuracy of the SPA assessment as applied to the United Kingdom.

                                                                                                              8
| Global Road Map for Health Care Decarbonization |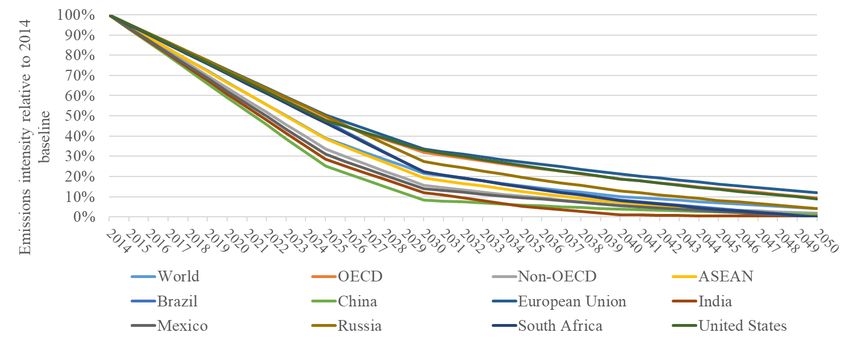
Health Care Without Harm
                                                                                                  Annex A: Technical Report

Figure A.3. Comparison between the United Kingdom’s health care emissions from the modelling and breakdowns
reported by the NHS for 2014. Emissions shown in MtCO2e, with the percentage contribution of each category to the
overall footprint also shown.

Scope 1 emissions

  Model                                           Emissions (ktCO2e)   Proportion (%)

  SPA                                             5236                 12.3

  NHS SDU                                         4937                 12.7

The two models match closely in their reporting for Scope 1 emissions. The NHS model is based
upon bottom-up data for energy use and transport, while our assessment uses top-down
estimates. Thus, agreement provides a high degree of confidence in this value from the SPA.

Scope 2 emissions

  Model                                           Emissions (ktCO2e)   Proportion (%)

  SPA                                             1953                 4.6

  NHS SDU                                         2444                 6.3

                                                                                                                         9
| Global Road Map for Health Care Decarbonization |
Health Care Without Harm
Annex A: Technical Report
Our modelling predicts a lower value for Scope 2 emissions than that reported by the NHS using
bottom-up data. It is good that WIOD gives a value within our range of expected agreement
between IO methods (percentage difference: -20%) in a comparison with bottom-up data.
Business services
Model Emissions (ktCO2e) Proportion (%)
SPA 5808 13.7
NHS SDU 4770 12.3
The models provide a good agreement for the business services category (percentage
difference: +22%), the largest supply chain category in both models. When combining WIOD
categories to match the NHS categorization, the “accommodation services” and “food services”
categories in the NHS IO model are within the same category in WIOD, “accommodation and food
services.” This sector was mapped to the business services sector, whereas the NHS model
maps the “food services” component to its “food and catering category” which will lead to a slight
inflation of the business services category in our modelling and may account for the difference
seen in the figure.
Construction
Model Emissions (ktCO2e) Proportion (%)
SPA 1738 4.1
NHS SDU 1374 3.5
There is agreement between the models in this category (percentage difference: +26%).
Electricity
Model Emissions (ktCO2e) Proportion (%)
SPA 2148 5.1
NHS SDU 372 1.0
There is divergence between the models for this category. The WIOD model includes full supply
chain emissions for electricity production in this value for Scope 3 emissions from electricity
generation. This includes emissions from high-intensity activities such as fossil fuel extraction and
processing. This is in contrast with the bottom-up data in the NHS reporting, which only covers
transmission and distribution losses in its Scope 3 electricity reporting. Transmission and
distribution losses cannot be considered on their own in the WIOD model, meaning a direct
10
| Global Road Map for Health Care Decarbonization |Health Care Without Harm
Annex A: Technical Report
comparison is not possible. For this reason, it is expected that the WIOD model will return a
higher value for this category.
Food and catering
Model Emissions (ktCO2e) Proportion (%)
SPA 2534 6.0
NHS SDU 2537 6.5
There is good agreement between the models in this category (percentage difference: -0.2%).
The WIOD value excludes emissions for food services, which due to aggregation within WIOD are
included in business services. In the NHS model, the food services sector has a value of 0.7
MtCO2e, meaning if it had been possible to directly align the WIOD and NHS categorizations,
good agreement would still be achieved.
Fossil fuels (coal and oil)
Model Emissions (ktCO2e) Proportion (%)
SPA 1019 2.4
NHS SDU 338 0.9
The two models differed in methodology with the NHS reporting bottom-up data on recorded
consumption. This suggests that WIOD is providing an overestimate in this category for the United
Kingdom. Due to the low magnitude of emissions from this sector, it is considered to have a minor
impact on model validity.
Information and communication technologies
Model Emissions (ktCO2e) Proportion (%)
SPA 357 0.8%
NHS SDU 552 1.4%
There is a good agreement between the two models for this low-emission category (percentage
difference: -35%).
Manufactured fuels, chemicals, and gases
Model Emissions (ktCO2e) Proportion (%)
SPA 1247 2.9
11
| Global Road Map for Health Care Decarbonization |Health Care Without Harm
Annex A: Technical Report
NHS SDU 4277 11.0
There is a significant disparity between the two models for this category. WIOD provides less
sectoral resolution in this category than the NHS model, which combines eight IO model sectors
to WIOD’s one. This increases the likelihood that the two IO models are considering different
sector boundaries and therefore accounting for activities in different ways.
Medical instruments/equipment
Model Emissions (ktCO2e) Proportion (%)
SPA 2664 6.3
NHS SDU 4520 11.6
The WIOD model provides a lower estimate for the emissions from the purchasing of medical
instruments and equipment than the NHS model. This may in part be due to the expenditure
profile within WIOD being for “health and social work activities,” whereas the NHS model is built
using an IO profile, which separates the demand from health and social care. Social care has a
lower proportion of capital expenditure on medical equipment than health care in the IO model
used by the NHS. The combination of these sectors in WIOD may reduce the expenditure
modelled in this procurement category and therefore the emissions returned.
Other manufactured products
Model Emissions (ktCO2e) Proportion (%)
SPA 1246 2.9
NHS SDU 872 2.2
There is reasonable agreement between the models for this low-emission category (percentage
difference: +43%).
Paper products
Model Emissions (ktCO2e) Proportion (%)
SPA 747 1.8
NHS SDU 1583 4.1
WIOD provides a lower estimate of the emissions from this category than the NHS estimate.
However, as this is a low-emission category, this is considered to have a minor impact on model
validity.
12
| Global Road Map for Health Care Decarbonization |Health Care Without Harm
Annex A: Technical Report
Pharmaceuticals
Model Emissions (ktCO2e) Proportion (%)
SPA 4224 9.9
NHS SDU 3195 8.2
There is a good agreement between the models for this high-emission category, with WIOD
showing a slightly raised contribution relative to the NHS value (percentage difference: +32%).
Transport
Model Emissions (ktCO2e) Proportion (%)
SPA 3217 7.6
NHS SDU 3321 8.5
There is a good agreement between the models for this category with WIOD showing a slightly
lowered contribution relative to the NHS value (percentage difference: -3%).
Waste, water, and sanitation
Model Emissions (ktCO2e) Proportion (%)
SPA 1790 4.2
NHS SDU 1887 4.9
Due to sewerage falling in a different category in WIOD, it was necessary to aggregate the “waste
products and recycling” and “water and sanitation” categories used by the NHS to draw a true
comparison between models. For this aggregated category, close agreement between the two
models was observed (percentage difference: -5%).
Other procurement
Model Emissions (ktCO2e) Proportion (%)
SPA 1068 2.4
NHS SDU 0 0.0
The expenditure profile within the NHS model returns zero expenditures within the sectors
included in this category (covering wholesale trade and including vehicles), which merits further
investigation. The WIOD model indicates that there is a small contribution to the emissions profile
from these sectors.
13
| Global Road Map for Health Care Decarbonization |Health Care Without Harm
Annex A: Technical Report
Other procured health services
Model Emissions (ktCO2e) Proportion (%)
SPA 5507 13.0
NHS SDU 1886 4.9
There is significant divergence between the models for this sector, which represents spending by
health sector organizations on goods and services from other areas of the health sector. This
difference is driven by the aggregation of the health and social work sectors within the WIOD
expenditure profile. In the IO model used by the NHS, 11% of health sector spending in 2014 was
on other areas of the health sector, whereas in WIOD the human health and social work sector
spends 30% of its own category. For this sector, the aggregation of health and social work within
WIOD means a greater proportion of total spending falls into this category when compared to the
NHS model.
United States and Eckelman et al. study
An in-depth comparison between the results of this study and a previously published study for the
United States 6 was undertaken following the completion of these results. This review highlighted
some disparities between the results of our modelling and the published results, which appeared
to be related to the scaling of emissions intensity from a 2008 base year in the previous study.
Since this review was completed, an update to this study has been published by Eckelman et al., 7
superseding the study that our model was originally compared against.
This update showed much closer alignment with the results of our modelling. The overall footprint
for 2014 was reported to be 518.6 MtCO2e, which is within 5% of the value returned by our model
of 546.5 MtCO2e. The update to the study also separates emissions by scopes.
Scope Unit Our National % Overall sector footprint shows good agreement
study paper difference between studies
Scope 1 Mt 118.3 35.3 -70% There is a large discrepancy between the Scope 1
emissions footprints for the two studies. Differing data sources and
system boundaries may contribute to this.
Scope 2 Mt 81.8 62.4 -24% Scope 2 makes up a similar proportion of the footprint
emissions for both studies (12% and 15%)
Scope 3 Mt 346.3 420.9 22% Our study has a lower Scope 3. It may be that the
emissions imbalance between Scope 1 and 3 is related to the
differing methods and data sources resulting in different
allocation of emissions between scopes.
Table A.1. Comparison between scope breakdowns of the U.S. footprint produced by our modelling and provided in
the updated U.S. national footprint study.
14
| Global Road Map for Health Care Decarbonization |Health Care Without Harm
Annex A: Technical Report
Further checks on national results
In addition to the reviews detailed in the previous sections, the wider body of results was
interrogated to identify trends and potential areas of divergence. Emissions per capita for each of
the SPA categories was investigated for the model nations. Histograms visualizing the range in
per capita values were produced for each sector, examples of which for “business services” and
“pharmaceuticals” are shown in Figure A.4 and Figure A.5 respectively.
Figure A.4. Distribution of per capita emissions associated with business services procured by the national health
system. The positions of Russia, Luxembourg, and the United States are shown as examples.
Figure A.5. Distribution of per capita emissions associated with pharmaceuticals procured by the national health
system. The positions of the United States, China, Japan, and Korea are shown as examples.
Following the plotting of these distributions on a category by category basis, a heatmap (Figure
A.6) was used to assess, by inspection, the overall variation in values seen across the model. If
the emissions per capita showed a significant difference in magnitude to those seen for other
nations they were marked in orange for further investigation. Efforts were made to identify the
causes and explanations for these differences from available data. For Russia and Turkey, the
WIOD team have identified a lack of reliable national accounts in their construction of input-output
tables, 8 which may cause some divergence in model results. For nations where national footprints
were available in the literature, further comparisons were made and these values are shown with
an orange box surrounding them. These comparison points are displayed in Table A.2.
15
| Global Road Map for Health Care Decarbonization |Health Care Without Harm
Annex A: Technical Report
Figure A.6. The heatmap is used to categorize the degree of variation in per capita emissions by category across the
WIOD nations. Green denotes nations where values correspond to behaviour observed across the model nations,
yellow is used for nations with emissions a short distance from levels seen more widely across the model nations,
and orange is used where emissions are substantially higher/lower than levels seen elsewhere. It is also indicated
when emissions are higher (H) or lower (L) than the observed distribution.
From this analysis, it was concluded that the results of this analysis for the 2014 baseline are
broadly consistent with the preceding work in this literature. Comparisons of studies in this field
are fundamentally a comparison of estimates provided by models building on differing datasets,
definitions of the health system, and modelling scope. The level of consistency found between
detailed, national studies and the global modelling approach employed in this study has provided
confidence in its suitability for our modelling of global health care sector emissions.
Points examined Unit This Other Difference Comment
study study
Japan 9 Total health care Mt 104 70 -32% Other study does not include medical
emissions retailers.
Pharmaceuticals Mt 20 13 -36% Exclusion of medical retailers could
explain lower pharmaceutical footprint,
proportion is consistent.
China 10 Total health care Mt 342 315 -8% Other study excludes imports, estimated
emissions at 6%. Good agreement at total footprint
level.
Pharmaceuticals Mt 113 173 54% Significantly higher pharma footprint in
other study, out-of-pocket seems to play
a significant role, recommend further
study to investigate pharmaceutical
emissions in China.
16
| Global Road Map for Health Care Decarbonization |Health Care Without Harm
Annex A: Technical Report
Points examined Unit This Other Difference Comment
study study
Scope 1 Mt 41.0 50.4 23% Our Scope 1 is smaller despite a larger
total footprint.
Australia 11 Total health care Mt 30.2 35.8 19% Our value falls within the quoted
emissions uncertainty range; assessments used
different IO models and expenditure
datasets.
Other kt 2.2 - N/A Other study does not give supply chain
manufactured results.
products
Austria 12 Total health care Mt 5.0 6.8 36% Other study is CO2 only, more variability is
emissions often seen for IO models of smaller,
wealthy nations.
Table A.2. Further comparison of model outputs against results reported in the literature.
Methodology for supply chain analysis
The following pages detail the approach taken to quantifying emissions from health sector supply
chains through structural path analysis (SPA). Following this, the approach taken to processing
SPA outputs into reporting categorization is detailed, with the logic behind the chosen categories
presented.
Structural path analysis
When analyzing the structure and associated emissions for an economic unit using input-output
(IO) modelling, SPA presents an advanced method for the direct quantification of the individual
components of a global, high-complexity supply chain.
Figure A.7 provides an illustrative example of a health sector supply chain. It is focused on the
direct provision of transport services, electricity, and catering services to the health care provider
at tier 1 of the structure. Also shown is a section of the catering provider’s supply chain, showing
the sectors involved indirectly in the servicing of health care’s demand for catering services.
17
| Global Road Map for Health Care Decarbonization |Health Care Without Harm
Annex A: Technical Report
Figure A.7. A simplified representation of a section of a health care provider’s supply chain.
The purpose of SPA is to break this supply chain tree structure into its component branches, or
paths, quantify the capital through each path, and derive the emissions associated. Examples of
paths in the example supply chain are shown in Figure A.8. Once the paths, and their emissions,
for a supply chain structure are known, then individual paths can be grouped based on the
sectors through which they flow. This allows for a wide range of insights to be gained into the
capital and emission flows through the supply chain, the tiers at which emissions occur, and the
goods and services with the greatest quantities of associated GHGs.
18
| Global Road Map for Health Care Decarbonization |Health Care Without Harm
Annex A: Technical Report
Figure A.8. Illustrative supply chain paths in the first, second, and third tiers. Also shown are how emissions
associated with each path are attributed to the sector driving demand for the supply chain path (in this case the
health care provider).
The mathematics behind SPA are relatively straightforward, covered in detail in Lenzen.30 To
calculate a path contribution, the capital flow associated with the path is first calculated from the
final demand profile of the health care sector (derived during the modelling for Green Paper 1) and
scaled according to the proportion of this expenditure associated with the path. This proportion is
found from the technical coefficients within WIOD that describe the relative scale of financial flows
between sectors of the global economy. Once the capital flow is found, it is multiplied by the
19
| Global Road Map for Health Care Decarbonization |Health Care Without Harm
Annex A: Technical Report
direct emissions intensity for the sector producing the emissions associated with the path (which
is the final sector of the path).
The complexity in performing a SPA comes through the sheer number of calculations required to
quantify all paths responsible for emissions in the supply chain. This is a computationally
exhaustive process. The number of paths to be calculated was managed using pruning
techniques as described by Lenzen and discussed in the “Limitations and assumptions” section of
this report.
Categorization and reporting of emissions
Following the execution of a SPA for all 44 nations and regions within WIOD, the presentation of
results and overall framing was undertaken using two categorization approaches:
• Health care provision perspective: Building upon the reporting employed by the NHS
SDU, this categorization groups emissions from the supply chain according to procurement
categories used by health care provider purchasers, like pharmaceuticals and medical
equipment.
• Greenhouse Gas Protocol perspective: Emissions are grouped in a manner consistent
with the terminology and methods presents in the GHGP corporate reporting standard.
Table A.3 shows the categorizations used for each of the above perspectives, while Table A.4
details the types of emissions covered in each category. When compiling emissions from
individual paths into both of these categorization schemes, the WIOD sectoral classification, which
is based upon the International Standard Industrial Categorization, was aligned with the target
lists of categories. The mapping of WIOD categories to the lists of categories below is shown in
Table A.5 and Table A.6.
Emission type Health provision categorization GHGP categorization
Scope 1 Direct emissions from health care Direct emissions from health care
facilities and the operation of fleet facilities and the operation of fleet
vehicles vehicles
Scope 2 Emissions from the generation of Emissions from the generation of
electricity purchased by the health electricity purchased by the health
sector sector
Scope 3 sub-categories: Business services Purchased goods and services
Construction Capital goods
20
| Global Road Map for Health Care Decarbonization |Health Care Without Harm
Annex A: Technical Report
Emission type Health provision categorization GHGP categorization
Electricity: Supply chain emissions for Fuel- and energy-related activities
the electricity sector and transmission not included in Scope 1 or Scope 2
and distribution losses
Food, catering, and accommodation Transportation, distribution, business
travel
Fossil fuels (coal and oil) Waste generated in operations
Information and communication
technologies
Manufactured fuels, chemicals, and
gases
Medical instruments/equipment
Other manufactured products
Paper products
Pharmaceuticals
Transport including freight and
business travel
Waste, water, and sanitation
Other procurement
Table A.3. Categorization schemes used to present findings of the SPA analysis.
SPA categories Definition of category coverage
Scope 1: Operation of Direct emissions from the operation of buildings, predominantly from boilers
buildings and incinerators
Scope 1: Transport Direct emissions from health sector-owned vehicle fleets as well as health
care professionals travelling for work (excluding regular commuting)
21
| Global Road Map for Health Care Decarbonization |Health Care Without Harm
Annex A: Technical Report
SPA categories Definition of category coverage
Scope 2 Emissions from the generation of electricity purchased by the health sector,
largely from the combustion of fossil fuels
Scope 3: Business services Emissions associated with professional services procured by the health
sector, like legal, accountancy, and consultancy services
Scope 3: Construction Emissions associated with the construction of buildings and infrastructure,
including the supply and manufacture of construction materials
Scope 3: Electricity Emissions associated with the transmission and distribution of electricity
purchased by the health sector, as well as the electricity generated within the
sector’s own supply chain
Scope 3: Food, catering, and Emissions associated with the food products and catering services provided
accommodation by the health system and accommodation required by health workers
Scope 3: Fossil fuels (coal and Emissions associated with the production of fossil fuel products procured by
oil) the health sector for uses including boilers, generators, and vehicles. These
emissions are those generated in the production of these fuels, and does not
include emissions from burning these fuels, which are included in Scope 1
Scope 3: Information and Emissions associated with IT and communication services procured by the
communication technologies health sector, including computer systems, telecoms, and publishing activities
Scope 3: Manufactured fuels, Emissions associated with the production of purchased chemicals, like soap
chemicals, and gases and detergents, and gases used in the health setting
Scope 3: Medical Emissions associated with purchased medical instruments and equipment,
Instruments/equipment including computers, electronics, and optical products
Scope 3: Other manufactured Emissions associated with purchased products including plastics, textiles,
products machinery, vehicles, and electrical equipment
Scope 3: Other procurement Emissions associated with goods purchased in bulk through wholesalers and
intermediaries
Scope 3: Paper products Emissions associated with the production of paper and cardboard products
procured by the health sector
Scope 3: Pharmaceuticals Emissions associated with the production of pharmaceuticals procured by the
health sector, encompassing the emissions associated with the energy,
materials, and transportation of pharmaceuticals
Scope 3: Transport Emissions from transport services purchased by the health sector, covering
freight and passenger transport
Scope 3: Waste, water, and Emissions associated with water collection, treatment, supply, and sewerage
sanitation and with waste disposal and recycling
Table A.4. Health sector emissions sources covered by the categorization scheme used in this study.
22
| Global Road Map for Health Care Decarbonization |Health Care Without Harm
Annex A: Technical Report
Arup categories WIOD categories
Business services Warehousing and support activities for transportation
Postal and courier activities
Financial service activities, except insurance and pension funding
Insurance, reinsurance, and pension funding, except compulsory social security
Activities auxiliary to financial services and insurance activities
Real estate activities
Legal and accounting activities, activities of head offices, and management
consultancy activities
Scientific research and development
Advertising and market research
Other professional, scientific, technical, and veterinary activities
Administrative and support service activities
Public administration and defence and compulsory social security
Education
Other service activities
Activities of households as employers, undifferentiated goods- and services-
producing activities of households for own use
Architectural and engineering activities, technical testing, and analysis
Activities of extraterritorial organizations and bodies
Human health and social work activities
Construction Construction
Repair and installation of machinery and equipment
Manufacture of other non-metallic mineral products
Manufacture of basic metals
Manufacture of wood and of products of wood and cork, except furniture, and
manufacture of articles of straw and plaiting materials
Manufacture of fabricated metal products, except machinery and equipment
Electricity Electricity, gas, steam, and air conditioning supply
Food and Catering Crop and animal production, hunting, and related service activities
Fishing and aquaculture
23
| Global Road Map for Health Care Decarbonization |Health Care Without Harm
Annex A: Technical Report
Arup categories WIOD categories
Manufacture of food products, beverages, and tobacco products
Accommodation and food service activities
Fossil fuels (coal and Manufacture of coke and refined petroleum products
oil)
Information and Publishing activities
communication
technologies Motion picture, video, and television program production, sound recording and
music publishing activities, and programming and broadcasting activities
Telecommunications
Computer programming, consultancy, and related activities, information service
activities
Manufactured fuels, Manufacture of chemicals and chemical products
chemicals, and gases
Mining and quarrying
Medical Manufacture of computer, electronic, and optical products
instruments/equipment
Manufacture of furniture and other manufacturing
Other manufactured Forestry and logging
products
Manufacture of textiles, wearing apparel, and leather products
Manufacture of rubber and plastic products
Manufacture of motor vehicles, trailers, and semi-trailers
Manufacture of other transport equipment
Manufacture of machinery and equipment n.e.c.
Manufacture of electrical equipment
Retail trade, except of motor vehicles and motorcycles
Paper products Manufacture of paper and paper products
Printing and reproduction of recorded media
Pharmaceuticals Manufacture of basic pharmaceutical products and pharmaceutical preparations
Transport Land transport and transport via pipelines
Water transport
Air transport
Waste, water, and Sewerage, waste collection, treatment and disposal activities, materials recovery,
sanitation remediation activities, and other waste management services
Water collection, treatment, and supply
Other procurement Wholesale and retail trade and repair of motor vehicles and motorcycles
24
| Global Road Map for Health Care Decarbonization |Health Care Without Harm
Annex A: Technical Report
Arup categories WIOD categories
Wholesale trade, except of motor vehicles and motorcycles
Table A.5. Allocation of WIOD categories to the health procurement sectors presented in this study.
GHGP GHGP sub- WIOD category
category category
Scope 1 Health care sector emissions
Scope 2 Electricity, gas, steam, and air conditioning supply
Scope 3 Purchased goods Postal and courier activities
and services
Accommodation and food service activities
Financial service activities, except insurance and pension funding
Insurance, reinsurance, and pension funding, except compulsory social
security
Activities auxiliary to financial services and insurance activities
Real estate activities
Legal and accounting activities, activities of head offices, and management
consultancy activities
Scientific research and development
Advertising and market research
Other professional, scientific, and technical activities, including veterinary
activities
Administrative and support service activities
Public administration and defence and compulsory social security
Education
Other service activities
Activities of households as employers and undifferentiated goods- and
services-producing activities of households for own use
Activities of extraterritorial organizations and bodies
Architectural and engineering activities, technical testing, and analysis
Crop and animal production, hunting, and related service activities
Fishing and aquaculture
Manufacture of food products, beverages, and tobacco products
25
| Global Road Map for Health Care Decarbonization |Health Care Without Harm
Annex A: Technical Report
GHGP GHGP sub- WIOD category
category category
Publishing activities
Motion picture, video, and television program production, sound recording
and music publishing activities, and programming and broadcasting
activities
Telecommunications
Computer programming, consultancy and related activities, and information
service activities
Manufacture of chemicals and chemical products
Manufacture of textiles, wearing apparel, and leather products
Manufacture of rubber and plastic products
Retail trade, except of motor vehicles and motorcycles
Manufacture of paper and paper products
Printing and reproduction of recorded media
Manufacture of basic pharmaceutical products and pharmaceutical
preparations
Water collection, treatment, and supply
Wholesale trade, except of motor vehicles and motorcycles
Water transport
Capital Goods Construction
Repair and installation of machinery and equipment
Manufacture of other non-metallic mineral products
Manufacture of basic metals
Manufacture of wood and of products of wood and cork, except furniture
and manufacture of articles of straw and plaiting materials
Manufacture of fabricated metal products, except machinery and equipment
Mining and quarrying
Manufacture of computer, electronic, and optical products
Manufacture of machinery and equipment n.e.c.
Manufacture of electrical equipment
Forestry and logging
Manufacture of motor vehicles, trailers, and semi-trailers
Manufacture of other transport equipment
26
| Global Road Map for Health Care Decarbonization |Health Care Without Harm
Annex A: Technical Report
GHGP GHGP sub- WIOD category
category category
Manufacture of furniture and other manufacturing
Wholesale and retail trade and repair of motor vehicles and motorcycles
Fuel- and energy- Electricity, gas, steam, and air conditioning supply
related activities
Manufacture of coke and refined petroleum products
Transportation, Warehousing and support activities for transportation
distribution, and
business travel Air transport
Land transport and transport via pipelines
Waste generated in Sewerage, waste collection, treatment and disposal activities, materials
operations recovery, remediation activities, and other waste management services
Table A.6. Allocation of WIOD categories to GHGP based break down.
Expanding country coverage
The 43 nations covered in detail in the WIOD input-output model skew toward higher income
nations. Other studies, making use of differing data sources and methodologies, have provided
estimates for other nations. One such study, from Lenzen et al., 13 has produced a global health
sector footprint based on Eora, a different input-output model, and provides the health sector
footprint for 25 nations not considered in detail in WIOD.
The additional nations are shown in Table A.10 and profiles are given in the country factsheets
that accompany this report. Integrating these published footprints for an additional 25 nations has
allowed the Road Map to be more expansive than Green Paper One.
Since these footprints were determined through a different methodology (Eora), taking a different
source for health sector expenditure, the sector definitions and activities covered have different
boundaries from those in the WIOD-based model. Additionally, the structure of the health care
sector footprint for these nations was not available. National health care emission reduction
trajectories and expenditure projections are available for all countries, allowing estimation of the
reference case scenario (BAU) and target trajectories for the additional national footprints. The
potential scale of emissions reduction for these nations is instead estimated using the global
mean reductions derived from the WIOD model. These estimates are shown to highlight the
potential savings if these health systems decarbonize in line with the global average and
therefore do not capture the expected variability associated with the national context. It is
27
| Global Road Map for Health Care Decarbonization |Health Care Without Harm
Annex A: Technical Report
recommended that these nations further investigate their national health system footprint and
potential to decarbonize to capture the national context in greater detail.
28
| Global Road Map for Health Care Decarbonization |Health Care Without Harm
Annex A: Technical Report
Health sector emissions budgets
Introduction
This section describes the approach followed to estimate the global health care sector emissions
budget and national emissions trajectories. The carbon budget for the health care sector is based
on a customized contraction and convergence method. i This method was tailored to fit the
analysis of the health care sector’s contribution to global emissions and the Paris Agreement. The
emissions trajectory for each country has been estimated based on four trajectory types.
This section is structured based on the following components:
• Section A.2.2.1 describes the approach followed to calculate the global emissions budget
and the calculated budget for the global health care sector.
• Section A.2.2.3 describes the approach followed to estimate the nations’ trajectories
based on the emissions budget.
• Section A.2.2.3 provides summary graphs for each trajectory type.
The emissions budget and trajectories have been estimated for greenhouse gas (GHG) emissions
(hereon referred to as emissions). The six main GHGs covered by the United Nations Framework
Convention on Climate Change (UNFCCC) / Kyoto Protocol have been considered. These are
carbon dioxide (CO2), methane (CH4), nitrous oxide (N2O), hydrofluorocarbons (HFCs),
perfluorocarbons (PFCs), and sulphur hexafluoride (SF6). 14 The results are expressed in carbon
dioxide equivalent (CO2e), which signifies the amount of CO2 which would have the equivalent
warming impact over 100 years. 14
Methodology
Emissions budget
This section describes the approach followed to calculate the health care sector’s portion of the
global emissions budget. It is divided into two subsections. The first subsection focuses on the
approach followed to determine the global emissions budget. The second subsection describes
the steps followed to allocate a portion of the global emissions budget to the health care sector,
splitting this across model nations.
i A similar method was used in for the C40 Deadline 2020 project. Available at: https://www.c40.org/other/deadline_2020
29
| Global Road Map for Health Care Decarbonization |Health Care Without Harm
Annex A: Technical Report
Global emissions budget
For the purposes of this study, the global emissions budget was set to achieve the aspirational
aim of the Paris Agreement. This is to limit global average temperature rise to no more than 1.5 °C
above pre-industrial levels.
The emissions budget considered in this study is the remaining cumulative GHG emissions from
2014 for a warming of 1.5 °C. In line with the IPCC Special Report Global Warming of 1.5 °C (SR15)
report, this has been estimated using the emissions scenarios developed as part of the Integrated
Assessment Modelling Consortium (IAMC). 15 Data was extracted for 36 scenarios corresponding
to 1.5 °C with no or limited overshoot ii reporting Kyoto GHG emissions.
The yearly iii emissions used to derive the emissions budget were estimated as the median from
all scenarios. The result is in line with the emissions reported in IPCC SR15 (see Table 2.4 in
Chapter 2 of the IPCC SR15). In these modelled scenarios, global net anthropogenic CO2 (note
that this does not include non-CO2 emissions) emissions decline by about 45% from 2010 levels
by 2030, reaching net zero around 2050.
Table A.7 shows the global emissions budget from 2014 obtained using this approach.
1.5 °C
scenario
Remaining emissions budget including CO2 and non-CO2 emissions from January 2014 (GtCO2e) 995
Table A.7. Remaining emissions budget (including CO2 and non-CO2 emissions) from January 2014 for the 1.5 °C
scenario.
Global emissions pathway
The global pathway was modelled using, as a reference, the median of the IAMC scenarios
representing a 1.5 °C with no or limited overshoot. Figure A.9 shows the modelled global
emissions pathway to achieve the emissions budget described above. The median of the IPCC
SR15 scenarios is shown for illustration purposes.
ii Pathways with overshoot are those where warming temporarily exceeds (‘overshoots’) 1.5°C and returns to 1.5°C either before or
soon after 2100. See also https://www.ipcc.ch/site/assets/uploads/sites/2/2018/11/SR15_Chapter 1_Low_Res.pdf page 60.
iii Note: The five yearly values obtained from the IAMC database were interpolated to yearly values in order to estimate cumulative
emissions.
30
| Global Road Map for Health Care Decarbonization |Health Care Without Harm
Annex A: Technical Report
Figure A.9. Estimated global emission pathway to limit global temperature to 1.5 °C and median of the IPCC SR15
IAMC emissions scenarios.
A modelled pathway was fitted to the IAMC scenarios instead of directly using the scenario data
with the purpose of obtaining a more realistic curve. In some years, the median obtained from the
IAMC scenarios leads to possibly unrealistic changes in emissions. This is due to the fact that the
curve has been estimated empirically from a number of scenarios (see for example around year
2060 in the curve for median of IAMC scenarios in Figure A.9). Still, it should be noted that both
curves lead to the same emissions budget.
Global emissions budget for the health care sector
Approach to allocating the global health care sector emissions budget
Using the global health care budget and pathway calculated we then applied a contraction and
convergence approach. This approach is a two-phase process developed by the Global
Commons Institute. 16 The convergence phase is an “adaptation” period during which regional
emissions per capita can linearly increase up or decrease down to the global average in the
convergence year (e.g., 2040). In the contraction phase, all regional emissions per capita
decrease to equal global per capita emissions for a specified year (e.g., 2100). The reader is
referred to Global Commons Institute for more information on the contraction and convergence
approach.16
31
| Global Road Map for Health Care Decarbonization |Health Care Without Harm
Annex A: Technical Report
In this study, we have tailored the method to reflect sectorial emissions rather than regional
emissions. For this purpose, we have used global domestic product (GDP) and total expenditure
in the health sector as a reference.16 In 2017, for example, we understand that the health care
sector represented 10% of total GDP. 17 The percentage of GDP that the health sector represents
from now to 2100 was used to scale the global pathway (shown in Figure A.9), leading to target
emissions of 0.11tCO2e by the convergence year (2040). The convergence year of 2040 was
selected because the starting point of health care emissions per GDP is lower than the global
average. Hence, a relatively late convergence year was selected which leads to a steady
decrease of emissions up to global average (an early convergence year would lead to a very
small or no reduction in emissions up to convergence year).
Results from allocating an emissions budget to the global health care sector
The contraction and convergence approach was applied to the emissions projected from the year
2014 to 2050 for the global health care sector. Data from Health care Without Harm’s Climate
footprint report was used as the baseline for this study. iv
Table A.8 summarizes the results of allocating a portion of the global emissions budget to the
global health care sector using the contraction and convergence approach. Emissions per capita
from health care are estimated to have to reduce by 39% up to convergence year and a further
45% by 2050 to reach almost near zero.
Value consistent
with 1.5 °C
Global health care sector emissions budget for 2014 – 2050 (GtCO2e) 50.3
Global health care sector emissions per capita in 2014 (tCO2e/capita) 0.28
Global health care sector emissions per capita in 2040 (tCO2e/capita) 0.11
Global health care sector emissions per capita in 2050 (tCO2e/capita) 0.05
Table A.8. Summary results of global health care sector emissions budgets and required emissions per capita in 2014
(baseline year), 2040 (convergence year), and 2050 for the 1.5 °C scenario.
Emissions trajectories
This section presents the emissions trajectories developed for each national health care sector
based on the emissions budget from 2014 to 2050 for the 1.5 °C scenario with no or limited
overshoot. This section is divided into two subsections, which briefly describe the approach used
to assign trajectories to each country and the model used to develop the trajectory curves.
iv Appendix A tabulated national health care emissions for the 43 WIOD nations available at:
www.noharm.org/ClimateFootprintReport
32
| Global Road Map for Health Care Decarbonization |Health Care Without Harm
Annex A: Technical Report
Approach to allocating trajectories
A country’s trajectory is defined as a plausible emissions pathway a country must follow to remain
within the global emissions health care sector budget. The approach involves two main steps: 1)
definition of trajectory types and 2) identification of criteria for trajectory allocation to nations.
Definition of trajectory types
Table A.9 describes the four trajectories used in this study. The trajectory types used here are
based on those used in the C40 work to define city trajectories and developed as part of
Deadline 2020. 18
Trajectory Description Peak Trend up to Rate of emission
year peak year decrease
Steep Nations are required to immediately begin a steep - Steep
decline decrease in emissions per capita
Steady Nations are required to immediately follow a steadier - Steady
Decline decline in emissions per capita than the steep decliners
Early Peak Nations are allowed to increase emissions up to a peak 2022 Linear Steady, as per
year of 2022 before steadily declining steady decline
Late Peak Nations are allowed to increase emissions up to peak 2026 Linear Steady, as per
year of 2026 before steadily declining steady decline
Table A.9. Description and main characteristics of the four trajectories.
Trajectory curve modelling
The trajectory curves were calculated using a mathematical function that governs the overall
shape of the trajectory, namely:
Steep and steady decline: The trajectory follows a logistic negative growth function (S-curve).
Early and late peak: The trajectory follows a period of linear growth up the peak year, after which
it is modelled using a logistic negative growth function to meet the target emissions level.
The process to develop the final trajectories was iterative whereby the parameters of the curves
were adjusted to respond to requirements of the trajectory description (e.g., steepness was
realistic) while ensuring that the sum of the trajectories was within the global health care sector
emissions budget.
33
| Global Road Map for Health Care Decarbonization |Health Care Without Harm
Annex A: Technical Report
Identification of criteria and thresholds
For this study, per capita GDP was identified as the key criteria to assign trajectories as it offers a
proxy for each country’s capacity to reduce emissions and is also a proxy for nations’ current
contribution to total health care emissions. The findings show a strong linear relationship between
nations’ GDP and emissions per capita. Figure A.10 shows this correlation. Three nations (United
States, Norway, and Luxembourg) stand out as outliers as they have considerably higher (United
States) or lower (Norway, Luxembourg) emissions than expected based on their GDP.
Thresholds were defined to group nations into the different trajectories. These thresholds were
selected based on the range of GDP per capita across nations and their typology. Four GDP
levels were defined: up to US $5,000, $5,000 – $20,000, $20,000 – $43,000, and higher than
$43,000.
Figure A.10. Emissions per capita compared to their GDP for the nations covered in this study according to their
typology and threshold used to allocate the four trajectories to nations (dashed gray line).
Table A.10 presents the trajectory types assigned to nations.
Steep decrease Steady decrease Early peak Late peak
Australia Cyprus Brazil India
Austria Czech Republic Bulgaria Indonesia
Belgium Estonia China Georgia
Canada Greece Croatia Kenya
Denmark Korea Hungary Kyrgyzstan
34
| Global Road Map for Health Care Decarbonization |You can also read