John C. Lincoln Medical Center Community Health Needs Assessment 2015 - HonorHealth
←
→
Page content transcription
If your browser does not render page correctly, please read the page content below
2015
  John C. Lincoln Medical Center
Community Health Needs Assessment

      Approved by the Board Strategic Planning Committee
                         October 2015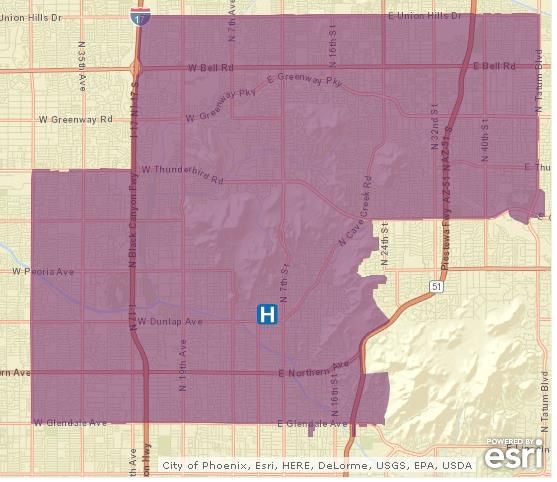
Table of Contents
Table of Contents ........................................................................................................................................... i
Table of Figures ............................................................................................................................................ iv
Table of Tables .............................................................................................................................................. v
I. Executive Summary.................................................................................................................................... 1
   Executive Summary................................................................................................................................... 2
       Key Findings .......................................................................................................................................... 2
II. Introduction & Definition of Community .................................................................................................. 4
       Who We Are .......................................................................................................................................... 6
           Hospital Overview ............................................................................................................................. 7
           Definition of Community .................................................................................................................. 7
       Current Efforts ...................................................................................................................................... 8
III. Methodology.......................................................................................................................................... 10
       Primary Data Sources .......................................................................................................................... 11
       Secondary Data Sources...................................................................................................................... 12
IV. Demographics & Social Determinants of Health ................................................................................... 15
       Demographics ..................................................................................................................................... 17
           Race ................................................................................................................................................. 18
           Age .................................................................................................................................................. 19
           Sex ................................................................................................................................................... 19
       Social Determinants of Health ............................................................................................................ 20
           Education ........................................................................................................................................ 20
           Country of Birth and English Proficiency ........................................................................................ 21
           Income ............................................................................................................................................ 22
           Poverty ............................................................................................................................................ 23
           Health Insurance ............................................................................................................................. 24
           Housing ........................................................................................................................................... 25
           Transportation ................................................................................................................................ 25
           Birth Outcomes ............................................................................................................................... 26

                                                                                                                                                   i|Page
John C. Lincoln Medical Center
Behavioral Indicators .......................................................................................................................... 30
Nutrition .......................................................................................................................................... 30
Obesity ............................................................................................................................................ 31
Physical Activity............................................................................................................................... 32
Tobacco Use .................................................................................................................................... 33
Alcohol Abuse ................................................................................................................................. 35
Substance Abuse ............................................................................................................................. 35
Physical Environment .......................................................................................................................... 36
Food Insecurity................................................................................................................................ 36
Parks and Recreation ...................................................................................................................... 36
Air Quality ....................................................................................................................................... 37
Healthcare Resources ......................................................................................................................... 37
Health Professional Shortage Areas................................................................................................ 37
Medically Underserved Areas and Populations .............................................................................. 38
Federally Qualified Health Centers ................................................................................................. 39
Other Acute Care Hospitals............................................................................................................. 39
V. Morbidity & Mortality ............................................................................................................................ 40
Cancer ............................................................................................................................................. 41
Heart Disease and Stroke ................................................................................................................ 44
Diabetes .......................................................................................................................................... 45
Respiratory-related Diseases .......................................................................................................... 46
Unintentional Injuries ..................................................................................................................... 48
Liver Disease ................................................................................................................................... 49
Mental Health ................................................................................................................................. 50
Alzheimer’s Disease ........................................................................................................................ 51
Parkinson’s Disease ......................................................................................................................... 51
Violence........................................................................................................................................... 52
Oral Health ...................................................................................................................................... 53
Infectious Disease ........................................................................................................................... 53
VI. Focus Groups and Key Informants ......................................................................................................... 55
VII. Prioritization of Community Needs ...................................................................................................... 58
2015-2017 John C. Lincoln Medical Center Needs ................................................................................. 59
ii | P a g e
John C. Lincoln Medical CenterMental Health ..................................................................................................................................... 59
Substance Abuse ................................................................................................................................. 60
Geriatric Services ................................................................................................................................ 60
Chronic Disease Prevention and Management .................................................................................. 61
Social Determinants of Health ............................................................................................................ 61
Other Needs ........................................................................................................................................ 61
Conclusion ........................................................................................................................................... 62
VIII. Appendices .......................................................................................................................................... 63
Appendix A: Key Terms and Data Sources ............................................................................................. 64
Appendix B: Focus Group Questions ...................................................................................................... 65
Appendix C: Focus Group Demographic Questions ................................................................................ 66
Appendix D: Key Informant Interview Questions ................................................................................... 69
Appendix E: ICD-9 and ICD-10 Codes ...................................................................................................... 71
IX. Bibliography ........................................................................................................................................... 72
iii | P a g e
John C. Lincoln Medical CenterTable of Figures
Figure 2.1 Determinants of Health ............................................................................................................... 5
Figure 2.2 Community Health Needs Assessment Methodology ................................................................. 6
Figure 2.3 John C. Lincoln Medical Center Service Area ............................................................................... 8
Figure 4.1 Determinants of Health ............................................................................................................. 16
Figure 4.2 John C. Lincoln Medical Center Service Area ............................................................................. 17
Figure 4.3 John C. Lincoln Medical Center Service Area Population by Race/Ethnicity, 2014 ................... 18
Figure 4.4 HonorHealth Service Area Population by Race/Ethnicity, 2014 ................................................ 18
Figure 4.5 Maricopa County Population by Race/Ethnicity, 2014 .............................................................. 18
Figure 4.6 Population by Age Group and Service Area, 2014 ..................................................................... 19
Figure 4.7 John C. Lincoln Medical Center Service Area by Educational Attainment ................................. 20
Figure 4.8 HonorHealth Service Area by Educational Attainment.............................................................. 21
Figure 4.9 Maricopa County by Educational Attainment............................................................................ 21
Figure 4.10 John C. Lincoln Medical Center Service Area English Proficiency ............................................ 22
Figure 4.11 Median Income by Service Area, 2014 .................................................................................... 22
Figure 4.12 Poverty Rate by Educational Attainment by Service Area, 2013 ............................................. 24
Figure 4.13 John C. Lincoln Medical Center Service Area Births by Mother’s Race/Ethnicity, 2010-2012 26
Figure 4.14 Teen Birth Rate by Service Area, 2010-2012 ........................................................................... 27
Figure 4.15 Prenatal Care in First Trimester by Service Area, 2010-2012 .................................................. 27
Figure 4.16 Adequacy of Prenatal Care by Service Area, 2010-2012 ......................................................... 28
Figure 4.17 Low Birth Weight Births by Service Area, 2010-2012 .............................................................. 29
Figure 4.18 Maricopa County Weight Status by Sex, Race and Age ........................................................... 31
Figure 4.19 Arizona Youth Weight Status by Federal Poverty Level (FPL), 2011/2012 .............................. 32
Figure 4.20 Adult Physical Activity for Maricopa County by Selected Population, 2011 ........................... 33
Figure 4.21 Current Smoking Rates in Maricopa County, Arizona, and United States by Sex, Race and Age
.................................................................................................................................................................... 34
Figure 5.1 Age-Adjusted Death Rates for Cancer and Lung Cancer by Service Area, 2010-2012 ............... 43
Figure 5.2 Age-Adjusted Death Rate for Heart Disease and Stroke by Service Area, 2010-2012 .............. 45
Figure 5.3 Age-Adjusted Death Rates for Diabetes by Service Area, 2010-2012 ....................................... 46
Figure 5.4 Inpatient Discharge Rates for Pneumonia and Asthma by Service Area, 2013 ......................... 47
Figure 5.5 Age-Adjusted Death Rates for Chronic Lower Respiratory Disease by Service Area, 2010-2012
.................................................................................................................................................................... 48
Figure 5.6 Age-Adjusted Unintentional Injury Death Rate by Mechanism and Service Area, 2012 ........... 49
Figure 5.7 Age-Adjusted Liver Disease Death Rates by Service Area, 2010-2012 ...................................... 50
Figure 5.8 Age-Adjusted Death Rate for Parkinson’s Disease by Service Area, 2010-2012 ....................... 52
Figure 5.9 Age-Adjusted Death Rate for Homicide by Service Area, 2010-2012 ........................................ 52
iv | P a g e
John C. Lincoln Medical CenterTable of Tables
Table 2.1 John C. Lincoln Medical Service Area ZIP Codes ........................................................................... 8
Table 4.1 John C. Lincoln Medical Center, HonorHealth and Maricopa County Population and Growth
Estimate, 2014 and 2019 ............................................................................................................................ 17
Table 4.2 Population by Sex and Service Area, 2014 .................................................................................. 19
Table 4.3 John C. Lincoln Medical Center, HonorHealth and Maricopa County Household Income
Distribution, 2014 ....................................................................................................................................... 23
Table 4.4 Poverty Rate by Age, Sex, and Selected Race/Ethnicities by Service Area, 2013 ....................... 23
Table 4.5 Infant Mortality Rate by Service Area, 2010-2012 ...................................................................... 29
Table 4.6. Primary Care Health Professional Shortage Areas for Geographical Areas and Populations,
2015 HRSA................................................................................................................................................... 38
Table 4.7 Medically Underserved Areas and Population by Service Area, 2015 HRSA .............................. 39
Table 5.1 John C. Lincoln Medical Center Service Area Cancer Primary Sites by Sex, 2005-2011.............. 41
Table 5.2 HonorHealth Service Area Cancer Primary Sites by Sex, 2005-2011 .......................................... 42
Table 5.3 John C. Lincoln Medical Center Service Area Age-Adjusted Death Rates for Selected Cancer
Sites, 2010-2012.......................................................................................................................................... 43
v|Page
John C. Lincoln Medical CenterI. Executive
Summary
1|Page
John C. Lincoln Medical CenterExecutive Summary
HonorHealth completed the 2015 Community Health Needs Assessment for the John C. Lincoln Medical
Center to identify the unmet needs of the community served by the facility.
The 2015 John C. Lincoln Medical Center Community Health Needs Assessment identified the following
needs to focus on for the next three years:
Mental Health
Substance Abuse
Geriatric Health
Chronic Disease Prevention and Management
Social Determinants of Health
Key Findings
1. Residents living within the John C. Lincoln Medical Center service area were more likely to be
Hispanic and more likely to speak a language other than English:
About 58 percent of service area residents were white non-Hispanic compared to 63
percent for HonorHealth and 56 percent in Maricopa County.
A language other than English was spoken by 27.7 percent of residents compared to 24
percent for HonorHealth and 27 percent for Maricopa County.
2. John C. Lincoln residents had poorer outcomes related to behavioral health and substance
abuse:
John C. Lincoln residents had higher rates of hospital discharge related to mental health
compared to Maricopa County, 503.9 discharges per 100,000 versus 314.0 discharges.
The suicide rate in John C. Lincoln was higher than the suicide rate in Maricopa, 18.5
deaths per 100,000 compared to 13.9 deaths per 100,000.
John C. Lincoln had a higher death rate due to unintentional poisonings* than
HonorHealth and Maricopa County, with 16.2 deaths per 100,000.
HonorHealth staff acknowledged a need to increase behavioral health services within
the community.
3. Outcomes for seniors were worse in the John C. Lincoln service area compared to HonorHealth
and Maricopa County:
Death rates due to falls were higher in the John C. Lincoln service area.
John C. Lincoln had a higher crude death rate for Alzheimer’s disease compared to
HonorHealth and Maricopa County.
4. John C. Lincoln residents experienced poor outcomes for chronic diseases:
The death rate for cancer was higher than HonorHealth and Maricopa County.
John C. Lincoln had a higher death rate and discharge rate for diabetes compared to
HonorHealth and Maricopa County.
John C. Lincoln residents had higher age-adjusted death rates for chronic lower
respiratory disease compared to HonorHealth and Maricopa County.
2|Page
John C. Lincoln Medical CenterJohn C. Lincoln had higher discharge rates for pneumonia and asthma compared to
HonorHealth and Maricopa County.
5. John C. Lincoln Medical Center residents experienced more barriers related to the social
determinants of health compared to other residents:
Median income for John C. Lincoln was $43,060 which was less than the median income
for HonorHealth, $48,801 and Maricopa County, $49,595.
More adults lived in poverty in John C. Lincoln (20.5 percent) compared to HonorHealth
(17.1 percent) and Maricopa County (16.7 percent).
Nearly 1 in 10 households in the John C. Lincoln service area did not own a car.
About 50 percent of renters spent more than 30 percent of their household income on
housing.
6. Discussions with community members and HonorHealth staff identified several gaps in services:
Focus groups participants talked about difficulty arranging transportation for both
emergencies as well as for scheduled appointments
Both HonorHealth staff and community members noted a need for transitional care
after discharge to prevent readmissions
HonorHealth staff noted a need for care coordination while community-based key
informants noted a need for better continuity across the continuum of care
With the aging population, key informants noted the need for the development of a
geriatrics department within the organization to meet the challenging needs of an older
population.
The prioritized needs identified in this Community Health Needs Assessment align with Healthy People
2020 Goals from the Department of Health and Human Services.
*Unintentional poisoning deaths include deaths from legal (e.g. prescription) and illegal (e.g. heroin) substances where the
intent was not intentional (e.g. suicide or homicide).
3|Page
John C. Lincoln Medical CenterII. Introduction &
Definition of
Community
4|Page
John C. Lincoln Medical CenterThe mission of HonorHealth is to improve the health and well-being of those we serve. The 2015
Community Health Needs Assessment identified gaps in services and unmet needs where new strategies
and programs can be developed to incorporate the mission into every aspect of HonorHealth.
A few years ago, the HonorHealth hospitals conducted a Community Health Needs Assessment to
identify the priority health needs of the communities. At that time, HonorHealth existed as two
separate health networks, John C. Lincoln Health Network and Scottsdale Healthcare. The Community
Health Needs Assessments conducted by the two health networks had similarities but focused on
different methods to achieve optimal health and wellness. For the 2015 Community Health Needs
Assessment, HonorHealth had the opportunity to utilize the strengths of each legacy organization to
develop the most detailed Community Health Needs Assessment for each individual hospital. The
findings in this assessment will be utilized to identify and adopt strategies that will help us, working
together with you, to create the healthiest lives possible for everyone.
This Community Health Needs Assessment includes a focus on the Determinants of Health, indicators
that drive health inequities within a community. These determinants acknowledge that health goes
beyond access to good health care to include where we live, work and learn. Our social and physical
environments work together to influence behaviors and our ability to make healthy changes. Public
health research has broken down how the different determinants of health influence well-being
(McGinnis, Williams-Russo, & Knickman, 2002). While medical care receives a lot of attention, it is
considered to only comprise 10 percent of what influences overall health. An estimated 30 percent of
health is influenced by genetics, 15 percent by social circumstances, and 5 percent from environmental
factors. Forty percent of health determination is under our own influence and is considered behavioral
influence. This 40 percent
includes diet, exercise, Figure 2.1 Determinants of Health
alcohol and tobacco
consumption, and other
choices we make as
Social
individuals. Circumstances
15% Genetics
“Social circumstances” 30%
include an individual’s
income, education and
poverty status. Environmental
“Environmental” refers to 5%
Behavior
the physical surroundings,
40%
such as crime and food Medical Care
security. These factors 10%
also affect each other.
Social circumstances may
limit an individual’s ability
to make healthy behavior McGinnis J.M., et.al., Health Affairs, 21 (2), 79-93
decisions and may keep
5|Page
John C. Lincoln Medical Centerthem from living in a safe community. Modification of these determinants requires both changes from
the individual and from the community.
Figure 2.2 is adopted from the County Health Rankings (2015 County Health Rankings, 2015). The figure
demonstrates that factors such as health behaviors, clinical care, socioeconomic status and physical
environment impact health outcomes. Health outcomes include the conditions and illnesses that
prevent an individual from living a long, quality life. This Community Health Needs Assessment will look
at key indicators for each health factor and identify health disparities related to morbidity and mortality.
Figure 2.2 Community Health Needs Assessment Methodology
Demographics
Morbidity
Health Outcomes
Mortality
Health Behavior
Clinical Care
Health Factors
Social and Economic Factors
Physical Environment
Adopted from County Health Rankings
Who We Are
In 2015, John C. Lincoln Health Network and Scottsdale Healthcare merged, creating a five acute care
hospital system that includes a specialty surgical center, a rehabilitation hospital, a free-standing
emergency center, and more than 40 primary care locations throughout the Phoenix metropolitan area.
Covering a geographical area of more than 1,370 square miles, including the Salt River Pima-Maricopa
6|Page
John C. Lincoln Medical CenterIndian Community and the cities of Scottsdale, Carefree, Cave Creek, and north Phoenix, the network
serves a population of 1.6 million residents. The five acute care hospitals include:
Deer Valley Medical Center
John C. Lincoln Medical Center
Scottsdale Osborn Medical Center
Scottsdale Shea Medical Center
Scottsdale Thompson Peak Medical Center
This Community Health Needs Assessment explores the needs of the patients served by John C. Lincoln
Medical Center and those residing in the ZIP codes defining its service area.
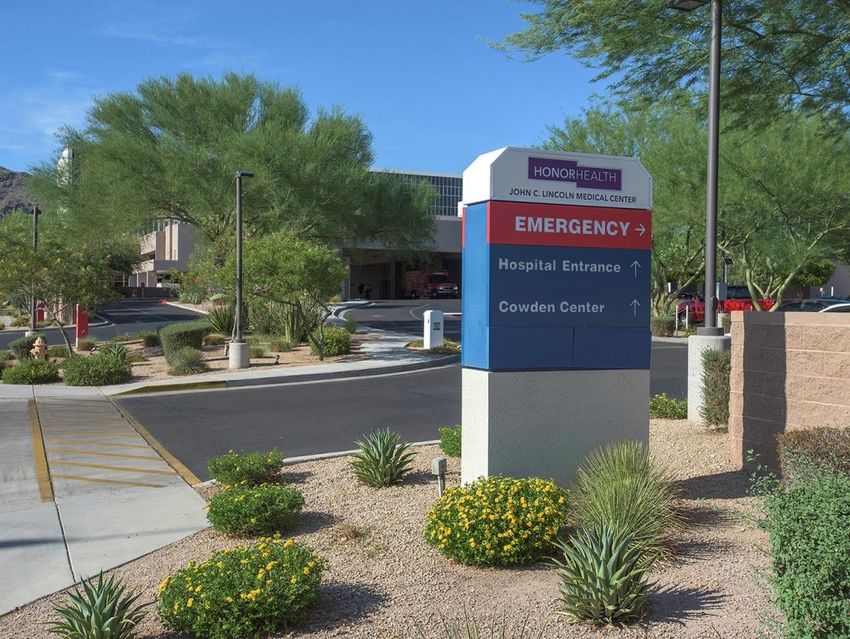
Hospital Overview
The history of John C. Lincoln Medical Center begins in 1927, with the creation of Desert Mission that
provided convalescent care to individuals suffering from tuberculosis and other respiratory ailments.
The original hospital opened in 1951 with 23 beds. Today, John C. Lincoln Medical Center operates 266
beds, of which 44 are critical care beds. The medical center includes an integrated cardiac diagnostic
and therapeutic care program and a breast care center. It’s designated as a Level I Trauma Center by the
Arizona Emergency Medical System and the American College of Surgeons as well as certified as a
Primary Stroke Center and Chest Pain Center. The medical center also has earned Magnet designation
three times for excellence in nursing.
Definition of Community
HonorHealth has chosen to define each hospital’s community based on ZIP codes. Other geographical
definitions considered by HonorHealth included using either a city or county to define the service area.
Potential cities in the community definition included Phoenix, Scottsdale, Tempe, and Glendale. Due to
both the size of the cities and HonorHealth‘s presence in different neighborhoods within each city, it
was determined that the city definition did not represent the community served by HonorHealth
hospitals. The same reasons apply to why Maricopa County was not used for the community definition.
The John C. Lincoln Medical Center community encompasses the ZIP codes where 50 percent of hospital
inpatient discharges reside. This resulted in a service area containing seven ZIP codes with a population
exceeding 300,000 people. The HonorHealth service area included the ZIP codes where 70 percent of
discharges from all HonorHealth hospitals reside. This resulted in a service area of 47 ZIP codes with a
population of more than 1.6 million people. Figure 2.3 shows a map of the service area for John C.
Lincoln Medical Center.
7|Page
John C. Lincoln Medical CenterFigure 2.3 John C. Lincoln Medical Center Service Area
The John C. Lincoln Medical Center service area includes an area that is diverse in age, race and
ethnicity. In defining John C. Lincoln Medical Center’s service area, HonorHealth avoided the exclusion
of medically underserved, low income or minorities. The following ZIP codes comprise the John C.
Lincoln Medical Center service area.
Table 2.1 John C. Lincoln Medical Service Area ZIP Codes
85020 85021 85022 85023
85029 85032 85051
Current Efforts
John C. Lincoln Medical Center completed its previous Community Health Needs Assessment in 2012,
before the merger between the HonorHealth legacy organizations, John C. Lincoln Health Network and
Scottsdale Healthcare. The methodology related to the identification of community needs was different
between the two legacy organizations.
John C. Lincoln Medical Center identified 11 community needs in the 2012 Community Health Needs
Assessment.
Stable Housing Affordable Health Health Care Primary Care
Care Coverage Services
Prevention Chronic Disease Behavioral Health Dental Health
Management
Transition Care Family Caregiver Tools for Personal
Education Responsibility
8|Page
John C. Lincoln Medical CenterSince completion of the last Community Health Needs Assessment, John C. Lincoln Medical Center has
made efforts to address the needs. The merger between John C. Lincoln Health Network and Scottsdale
Healthcare has expanded the network of providers, increased the number of programs and services
available to patients and community members, and kept medical care affordable. The merger also
allowed the identification of best practices across the continuum of care to help patients and
community members prevent chronic diseases, manage existing chronic diseases, and, after a
hospitalization, return to optimal health.
One highlight is the development of the Transition Specialist program. This program connects a
transition specialist with a recently discharged, high-risk Medicare beneficiary with the goal of
preventing readmission to the hospital. The transition specialist works with the patient to ensure they
follow discharge instructions and receive any support for mental and emotional health. They also help
motivate the patient to return to a healthy state and stay out of the hospital. This program has
successfully decreased the readmission rate for John C. Lincoln Medical Center.
One other area that John C. Lincoln Medical Center actively sought to improve was in the access to
primary care. The Desert Mission Health Center, in conjunction with HonorHealth, applied and received
approval to designate the health center as a federally-qualified health center. This process was
completed in September 2015, and allows Desert Mission to expand affordable health care services to
impoverished community members.
9|Page
John C. Lincoln Medical CenterIII. Methodology
10 | P a g e
John C. Lincoln Medical CenterThe Community Health Needs Assessment is the result of an analysis of primary and secondary data
gathered to identify the health needs within John C. Lincoln Medical Center’s community. Primary data
included information collected specifically for the Community Health Needs Assessment, including focus
groups and key informant interviews. Secondary data included information originally collected for a
different purpose, such as health statistics analyzed and reported by the Maricopa County Department
of Public Health for public health purposes.
Primary Data Sources
HonorHealth solicited assistance with the collection of primary data from Saguaro Evaluation Group
(SEG). The decision to collect primary data using a third party was made to eliminate any potential bias
that may occur during data collection and analysis on the part of HonorHealth staff as well as to protect
the anonymity of participants.
1. Discussions with hospital executive staff:
Community Benefit staff met with executive staff (CEO, CMO, CNO, etc.) from John C. Lincoln
Medical Center to develop an understanding of the perceived strengths and weaknesses of the
hospital as well as to learn what they perceive as needs within John C. Lincoln Medical Center’s
community. During these meetings, executive leaders identified key informants, existing
programs and existing gaps.
2. Focus group interviews:
Saguaro Evaluation Group conducted eleven focus groups throughout the HonorHealth network,
including two specifically within the John C. Lincoln Medical Center service area. The duration of
the focus groups was approximately one hour, and participants received incentives for
participation. The goal of the focus groups was to understand the perceptions of the
community regarding their needs as well as how well HonorHealth is helping to meet those
needs.
Recruitment of participants involved the distrubtion of flyers to patients at the hospitals, asking
volunteers, case managers, and social workers to hand out flyers to patients, and distributing
flyers at schools, community centers and other locations.
The original goal was to conduct a total of 15 focus groups, two at each acute care hospital and
one at each of the clinic locations of the federally qualified health center, NOAH. Despite
extensive efforts to recruit participants, the number of participants for four of the planned focus
groups at the hospitals was too low to conduct the focus group. However, due to the same
themes occurring in the completed focus groups, it was decided that any additional focus groups
would not identify new themes, and the four remaining focus groups did not need to occur.
See Appendices B and C for questions and demographics from the focus groups.
11 | P a g e
John C. Lincoln Medical Center3. Key informant interviews:
SEG conducted 31 key informant interviews, with four interviews from staff from John C. Lincoln
Medical Center. Key informants included HonorHealth staff, individuals from police/fire/EMS,
public health, and individuals from other local non-profits.
Interviews were scheduled to last about 30 minutes, but interviewees were willing to speak
longer. The interviews posed questions pertaining to the needs of the community and how John
C. Lincoln Medical Center and HonorHealth are meeting or not meeting the needs.
The goal was to interview at least 30 individuals both internally and externally of HonorHealth.
Email invites were sent to 60 participants identified as potential key informants requesting a
date and time for interviews. Several attempts were made through emails to arrange interviews
for each participant. Phone calls also were placed to several potential participants in an attempt
to arrange an interview.
See Appendix D for a list of questions asked and organizations represented in the interviews.
Secondary Data Sources
Secondary data is defined as information that is collected by another person or organization. For the
Community Health Needs Assessment, secondary data included emergency department utilization and
inpatient hospitalizations, vital statistics (birth and death), communicable disease, cancer registry, and
behavioral health survey data. These data come from numerous sources, including HonorHealth,
Maricopa County Department of Public Health, Arizona Department of Health Services, and federal
agencies under the Department of Health and Human Services. See Appendix A for more information on
the secondary data sources.
1. Demographics:
Demographic data came from several locations. Population data, including demographic
breakdowns by sex, age, race/ethnicity, and income came from MedAssets Inc. 2014. Additional
demographic data came from the U.S. Census Bureau’s American Community Service 2009-2013
5-Year Estimates and included information on poverty, employment, health insurance status,
primary language and education. Data analysis was conducted at the levels of state, county, and
service area for both HonorHealth and John C. Lincoln Medical Center.
2. Vital Statistics:
Vital Statistics data included data collected from birth and death certificates analyzed at the
hospital service level, HonorHealth service level, county level, and state level. Maricopa County
Department of Public Health provided the service area data and the county-level data was
pulled from the annual health status report. State-level data was collected from Arizona
Department of Health Services annual health status report.
12 | P a g e
John C. Lincoln Medical Center3. Communicable Disease:
Communicable, or infectious, disease data includes cases of selected infectious disease that may
indicate needs within a community. Maricopa County Department of Public Health provided the
service area data for vaccine-preventable, foodborne and sexually transmitted diseases.
County-level and state-level data were provided by Maricopa County Department of Public
Health and Arizona Department of Health Services.
4. Cancer Registry:
The Arizona Department of Health Services provided cancer incidence data at the HonorHealth
and John C. Lincoln Medical Center service area. County and state-level cancer incidence was
collected using the Cancer Registry Query Module. Only counts are reported to show which
cancers are more common. Therefore, cancer incidence data cannot be compared.
5. Hospital Inpatient and Emergency Department Utilization:
HonorHealth hospital data included inpatient and Emergency Department discharges from John
C. Lincoln Medical Center. Inpatient data also included hospitalizations from non-HonorHealth
hospitals where the patient lived within John C. Lincoln Medical Center’s service area.
6. Behavioral Risk Factor Surveillance Survey:
The Behavioral Risk Factor Surveillance Survey has
collected data on different health-related
Sources of Secondary Data
questions for more than 30 years. Administered as
Maricopa County Department
a telephone-based survey, each state asks a
of Public Health
random sample of residents a series of questions
Arizona Department of Health
regarding health-related risk behaviors, chronic
Services
health conditions, and preventative services. Data
Departments of Health and
is available at the national, state, county, and
Human Services
selected Metropolitan/Micropolitan statistical
Arizona Department of
areas. The reports produced by the Centers for
Criminal Justice
Disease Control and Prevention, Arizona
Department of Health Services, and Maricopa
County Department of Public Health provided information for the national-, state- and county-
level respectively.
7. Youth Risk Behavior Surveillance System:
Similar to the Behavioral Risk Factor Surveillance Survey, this survey asks high school students
about their behaviors that contribute to the leading causes of death and disability in youth. In
Arizona, the survey is administered through the Arizona Department of Education, where it is
then combined with national data at the Centers for Disease Control and Prevention. Data are
only available at the state and national levels.
13 | P a g e
John C. Lincoln Medical Center8. Other Data:
The needs assessment utilized data collected by other sources related to substance use, criminal
activity and children’s health. This included the Arizona Criminal Justice Commission, the Data
Resource Center for Child and Adolescent Health, and the Substance Abuse and Mental Health
Services Administration. Data were based on surveys, vital statistics, and criminal data.
14 | P a g e
John C. Lincoln Medical CenterIV. Demographics &
Social Determinants
of Health
15 | P a g e
John C. Lincoln Medical CenterThe health of an individual is a result of more than medical care accessed and received. It includes the
behavioral choices (e.g. smoking or not smoking), the physical environment (e.g. access to parks and
exposure to crime), and the social issues (e.g. income and education) where the individual lives. To fully
understand the health needs of the John C. Lincoln Medical Center community, this Community Health
Needs Assessment will look at key indicators related to each contributor of health. As a leader in
healthcare within the community, HonorHealth can play a role in improving the health in each of these
areas.
Public health experts estimate about 30 percent of the population’s health is related to genes and
biology, while more than half is associated with behaviors and the social environment (McGinnis,
Williams-Russo, & Knickman, 2002). Only 10 percent is believed to be related to medical care.
Figure 4.1 Determinants of Health
Social
Circumstances
15% Genetics
30%
Environmental
Behavior
5%
40%
Medical Care
10%
McGinnis J.M., et. al., Health Affairs, 21 (2), 79-93
Understanding the current status of key indicators related to health can help identify not just the
medical needs of the population, but also basic needs that, when not met, result in poor health
outcomes.
16 | P a g e
John C. Lincoln Medical CenterFigure 4.2 John C. Lincoln Medical Center Service Area
Demographics
The demographics of a population can indicate different needs based on the age, sex and race of the
population. For example, older populations tend to use healthcare resources at a greater rate due to
the multiple chronic health conditions that are often present. Females of childbearing age, 15 to 44
years of age, may require healthcare services related to reproductive health while a younger population
may require services directed at pediatrics, such as immunizations and injury prevention. Finally, racial
health disparities may exist in the community and understanding where minority populations live in the
community can help target programs and interventions in the appropriate neighborhoods.
In 2014, John C. Lincoln Medical Center had a population of 301,076 people living within the seven ZIP
codes that define its primary service area based on 50 percent of inpatient discharges. As shown in
Figure 4.2, the John C. Lincoln Medical Center service area covers 61.2 square miles and has a
population density of 4,920 people per square mile. In comparison, the HonorHealth primary service
area had a population of 1,633,981, and Maricopa County had a population of 4,051,453. The five-year
growth projection for John C. Lincoln Medical Center is 3 percent, which is less than HonorHealth’s
growth of 5 percent and Maricopa County’s growth of 6.9 percent. John C. Lincoln Medical Center
service area encompasses an area of the Phoenix metropolitan area that has been mostly developed.
Most parts of the service have an expected growth rate less than 2 percent, and all areas are expected
to grow at a lower rate than the HonorHealth service area.
Table 4.1 John C. Lincoln Medical Center, HonorHealth and Maricopa County Population and Growth Estimate, 2014 and
2019
Total Population Population Estimate Percent Growth
2014 2019 2014-2019
John C. Lincoln 301,076 310,240 3.0%
HonorHealth 1,633,981 1,715,029 5.0%
Maricopa County 4,051,453 4,322,082 6.9%
MedAssets, 2014
17 | P a g e
John C. Lincoln Medical CenterRace
The racial breakdown in the service area for John C. Lincoln Medical Center compares to HonorHealth
and Maricopa County, with white non-Hispanics making up the majority of the population, followed by
Hispanics, blacks, Asian/Pacific Islanders, American Indians, and individuals of two or more races. John
C. Lincoln Medical Center has a lower percentage of white, non-Hispanics compared to HonorHealth and
Maricopa County, resulting in a slightly greater percentage in Hispanic individuals. Figures 4.3, 4.4 and
4.5 show a more detailed breakdown of each by race/ethnicity.
Figure 4.3 John C. Lincoln Medical Center Service Area Population by Race/Ethnicity, 2014
John C. Lincoln Medical Center
White, non-Hispanic
31.0% Hispanic
57.6% Black
American Indian
4.1% Asian/Pacific Islander
2.1% 2 or More
2.0% 3.1%
MedAssets, 2014
Figure 4.4 HonorHealth Service Area Population by Race/Ethnicity, Figure 4.5 Maricopa County Population by Race/Ethnicity,
2014 2014
HonorHealth Maricopa County
25.0% 30.9%
63.6%
56.8%
3.6% 4.7%
1.7%
2.2% 1.9% 2.2%
3.6% 3.7%
MedAssets, 2014
MedAssets, 2014
18 | P a g e
John C. Lincoln Medical CenterAge
Figure 4.6 shows the breakdown by age group in the service areas for John C. Lincoln, HonorHealth, and
Maricopa County. The hospital’s service area has a lower dependency ratio compared to HonorHealth
and Maricopa County. The dependency ratio compares the number of people outside of the workforce
(children 0-14 and older adults 65 and over) to those in the working population (15-64 years old). A
ratio closer to 1 may indicate that there is less economic support within the community to fund schools
or provide medical care to an aging population. For this calculation, the population outside of the
workforce included those younger than 18 and over 65. The dependency ratios were 0.55, 0.58 and
0.64 respectively.
Figure 4.6 Population by Age Group and Service Area, 2014
20%
15%
10%
5%
0%
0 to 4 5 to 17 18 to 24 25 to 34 35 to 44 45 to 54 55 to 64 65 to 74 75+
Years Years Years Years Years Years Years Years Years
John C. Lincoln HonorHealth Maricopa County
MedAssets, 2014
Sex
The service area populations for John C. Lincoln Medical Center, HonorHealth, and Maricopa County
have a slightly more dominant female population, with about 50.4 percent being female. In addition,
women of childbearing age, 15 to 44 years, make up 20 percent of the population. Table 4.2 shows the
population for each service area by sex.
Table 4.2 Population by Sex and Service Area, 2014
Male Percent Females Percent Childbearing Females
(15 to 44 Years)
John C. Lincoln Medical Center 149,214 49.6% 151,862 50.4% 61,040 20.3%
HonorHealth 810,435 49.6% 823,546 50.4% 332,657 20.4%
Maricopa County 2,005,610 49.5% 2,045,843 50.5% 838,625 20.7%
MedAssets, 2014
19 | P a g e
John C. Lincoln Medical CenterSocial Determinants of Health
Social Determinants of Health indicators portray areas of need based
Education
on social conditions that seemingly are unrelated to health. They
Country of Birth
include educational attainment, income, unemployment, health English Proficiency
insurance status, car and home ownership, food security, Income
Poverty
transportation, substance abuse, and social support and exclusion.
Health Insurance Status
These indicators all drive health outcomes and health disparities by Housing
preventing individuals from accessing health resources or from living Transportation
Birth Outcomes
a healthful life. The social determinants of health are recognized by
the federal government as key indicators and contributors to health
status.
Education
Educational attainment impacts many of the different factors related to health and social determinants.
The more education achieved, the higher the income, and the lower the risk for being uninsured, living
in poverty, and being unemployed.
The majority of John C. Lincoln Medical Center service area adults 25 years and older attained at least
some college education as seen in Figure 4.7 (U.S. Census Bureau, 2015). Males had a greater
percentage of college graduates than females, 26.2 percent and 25.1 percent respectively.
Figure 4.7 John C. Lincoln Medical Center Service Area by Educational Attainment
Some College,
Associate's Bachelor'
Degree s or
34% Higher
26%
Less than High
High School School
Degree 14%
26%
2009-2013 American Community Survey 5-Year Estimates
A greater percentage of adults attained a college degree in the HonorHealth service area compared to
the John C. Lincoln service area, and individuals were more likely to complete high school (12 percent
versus 14 percent). Males had a greater percentage of adults achieving a bachelor’s degree or greater
than women (34.6 percent versus 32.4 percent).
20 | P a g e
John C. Lincoln Medical CenterFigure 4.8 HonorHealth Service Area by Educational Attainment
Bachelor's or
Some College, Higher
Associate's 34%
Degree
32% Less than High
High School School
Graduate 12%
22%
2009-2013 American Community Survey 5-Year Estimates
The John C. Lincoln service area had the same percentage of adults that did not complete high school as
Maricopa County. As seen in the John C. Lincoln Medical Center and HonorHealth service areas, males
had a greater percentage of adults achieving a bachelor’s degree or higher than compared to females,
31.2 percent and 28.5 percent respectively.
Figure 4.9 Maricopa County by Educational Attainment
Some College, Bachelor's or
Associate's Higher
Degree 30%
33%
Less than High
High School School
Graduate 14%
23%
2009-2013 American Community Survey 5-Year Estimates
Country of Birth and English Proficiency
The service area for John C. Lincoln Medical Center had 17.5 percent of the population born in a foreign
country, greater than the percent of the populations in HonorHealth (14.5 percent) and Maricopa
County (14.9 percent) (U.S. Census Bureau, 2015).
The ability to communicate effectively can impact an individual’s ability to access resources and obtain a
quality education. In the hospital’s service area, about 27.7 percent of the population five years and
over spoke a language other English, and 11.5 percent of the population spoke English “less than well.”
About 20.4 percent of the John C. Lincoln population spoke Spanish, making it the most common non-
English language. Of the Spanish speakers, about 4 percent spoke English “less than well.” Figure 4.10
shows the languages spoken in John C. Lincoln Medical Center, regardless of English proficiency.
21 | P a g e
John C. Lincoln Medical CenterFigure 4.10 John C. Lincoln Medical Center Service Area English Proficiency
20.4% 3.7%
72.3% 27.7%
1.9%
1.7%
English Only Spanish Other Indo-European
Asian Pacific Islander Other Language
2009-2013 American Community Survey 5-Year
The HonorHealth and Maricopa County populations had a lower percentage of the population speaking
a language other than English. About 24 percent of the HonorHealth and 26 percent of Maricopa
County spoke a language other than English. About 10 percent in both populations spoke English “less
than well.” As seen in John C. Lincoln Medical Center, the most common language spoken was Spanish.
Income
In 2014, the John C. Lincoln Medical Center service area had a lower median income compared to the
HonorHealth service area and Maricopa County at $43,060, $48,801, and $49,595 respectively.
Figure 4.11 Median Income by Service Area, 2014
$48,801 $49,595
$60,000 $43,060
$50,000
$40,000
$30,000
$20,000
$10,000
$0
John C. Lincoln HonorHealth Maricopa County MedAssets, 2014
Table 4.3 shows the household income distribution in the service areas for John C. Lincoln Medical
Center, HonorHealth, and Maricopa County. The John C. Lincoln Medical Center service area had the
greatest percentage of households having an income less than $25,000, while HonorHealth and
Maricopa County had the greatest percentage of household income between $25,000 and $49,999.
22 | P a g e
John C. Lincoln Medical CenterTable 4.3 John C. Lincoln Medical Center, HonorHealth and Maricopa County Household Income Distribution, 2014
degree lived in poverty compared to only 6.4 percent of adults with a Bachelor’s degree. Figure 4.12
shows the poverty rate based on education for John C. Lincoln Medical Center, HonorHealth, and
Maricopa County.

Figure 4.12 Poverty Rate by Educational Attainment by Service Area, 2013

      35.0%
      30.0%
      25.0%
      20.0%
      15.0%
      10.0%
       5.0%
       0.0%
                  Less than High         High School         Some College,    Bachelor's Degree
                      School              Graduate         Associate's Degree     or Higher
                              John C. Lincoln     HonorHealth        Maricopa County
                                                       2009-2013 American Community Survey 5-Year Estimates

Health Insurance

The lack of health insurance can have a detrimental impact on the health of an individual. It reduces a
person’s ability to seek care in a timely manner and can bankrupt an individual when expensive
emergency care is necessary. The Affordable Care Act requires that everyone maintain health
insurance. It also offers subsidized plans for lower income populations to assist with the payment of
premiums.

The most recently available health insurance data includes data collected before the requirements of
the Affordable Care Act were instituted, meaning that the reported uninsured rate is most likely higher
than the current rate.

The 2009-2013 5-Year Estimates from the American Community Survey estimated that 28.3 percent of
adults 18 to 64 years of age in the service area for John C. Lincoln Medical Center were uninsured (U.S.
Census Bureau, 2015). Males had a higher uninsured rate compared to females, 24.6 versus 19.3
percent. White non-Hispanic had a rate of 15.4 percent, giving them the lowest uninsured rate for
race/ethnicity. Asian/Pacific Islander had a rate of 17.8, Blacks 25.2 percent, American Indians 40.2
percent and Hispanics 36.2 percent. A health disparity existed between the locations of birth. Native-
born individuals had an uninsured rate of 16.9 percent versus a rate of 45.5 percent for foreign-born.
Foreign-born individuals who became naturalized citizens fared better compared to the non-citizens
with rates of 20 percent and 57.3 percent respectively.

Within the HonorHealth service area, 22.2 percent of adults 18 to 64 years of age were uninsured. Males
had a higher uninsured rate compared to females, 19 versus 15 percent. White non-Hispanic had the
lowest rate by race with an uninsured rate of 11.1 percent. Asian/Pacific Islanders had a rate of 14.9

                                                                                                       24 | P a g e
John C. Lincoln Medical Center
percent, Blacks 21.7 percent, American Indians 35.7 percent, and Hispanics 31.5 percent. A health
disparity existed due to the locations of birth. Native-born individuals had an uninsured rate of 13.3
percent versus a rate of 38.6 percent for foreign born. Foreign-born individuals who became naturalized
citizens fared better compared to the non-citizens with rates of 15.8 percent and 51.2 percent
respectively.
In Maricopa County, 22.6 percent of adults reported being uninsured. Males had a higher uninsured
rate compared to females, 19 percent versus 15.4 percent. Disparities also existed between races.
White non-Hispanics had the lowest rate of 10.5 percent, Blacks 16.9 percent and Asians/Pacific
Islanders 15.3 percent. American Indians had the highest uninsured rate at 32.7 percent uninsured.
Hispanics also had a higher uninsured rate at 30.1 percent. As seen in John C. Lincoln Medical Center
and HonorHealth, native-born individuals had a much lower uninsured rate compared to foreign-born,
13.1 percent and 40.5 percent respectively. Naturalized citizens also had a lower uninsured rate
compared to non-citizen residents, 17.8 percent versus 52.8 percent.
The most recent Gallup poll reported that the uninsured rate for Arizona was 17.5 percent in 2014. This
was only a slight decrease from 20.4 percent in 2013 (Witters, 2015).
Housing
Housing has the potential to have an impact on the health of the individual. Healthier lives exist with
stable and affordable housing.
In the John C. Lincoln Medical Center service area, 46.5 percent of residents lived in rented property,
more than HonorHealth (40.2 percent) and Maricopa County (37.4 percent) (U.S. Census Bureau, 2015).
The Department of Housing and Urban Development recommends that no more than 30 percent of
household income be spent on housing. Households that spend more may experience difficulties
affording other necessities such as food, clothing, transportation and medical care. In the hospital’s
service area, 32.9 percent of property-owned households spent more than 30 percent of their income,
with 26 percent spending more than 35 percent of their household income. If the owned property had
an existing mortgage, the percent was greater, 39.5 percent of households spending more than 30
percent of their income on housing and 31.2 percent spending more than 35 percent. More than 50
percent of renters in the John C. Lincoln Medical Center service area spent more than 30 percent of their
income on housing, with 42.7 percent spending more than 35 percent.
Transportation
Transportation, or the lack of it, can contribute to an individual’s inability to access resources such as
healthy food, employment and healthcare. Individuals who do not own a personal vehicle often must
rely on public transportation or friends and family for transportation to and from medical appointments
as well as every day trips like the grocery store and work. ValleyMetro, the public transportation
provider for Maricopa County, currently has several public transportation options in the John C. Lincoln
Medical Center service area. Several bus lines operate both North/South and East/West in the
25 | P a g e
John C. Lincoln Medical CenterYou can also read