Impact Fee Capital Improvements Plan 2021-2027 City of Santa Fe, New Mexico - City of ...
←
→
Page content transcription
If your browser does not render page correctly, please read the page content below
Impact Fee
Capital Improvements Plan
          2021-2027
for Roads, Parks, Fire/EMS and Police

City of Santa Fe, New Mexico

  Adopted by the Governing Body
        December 9, 2020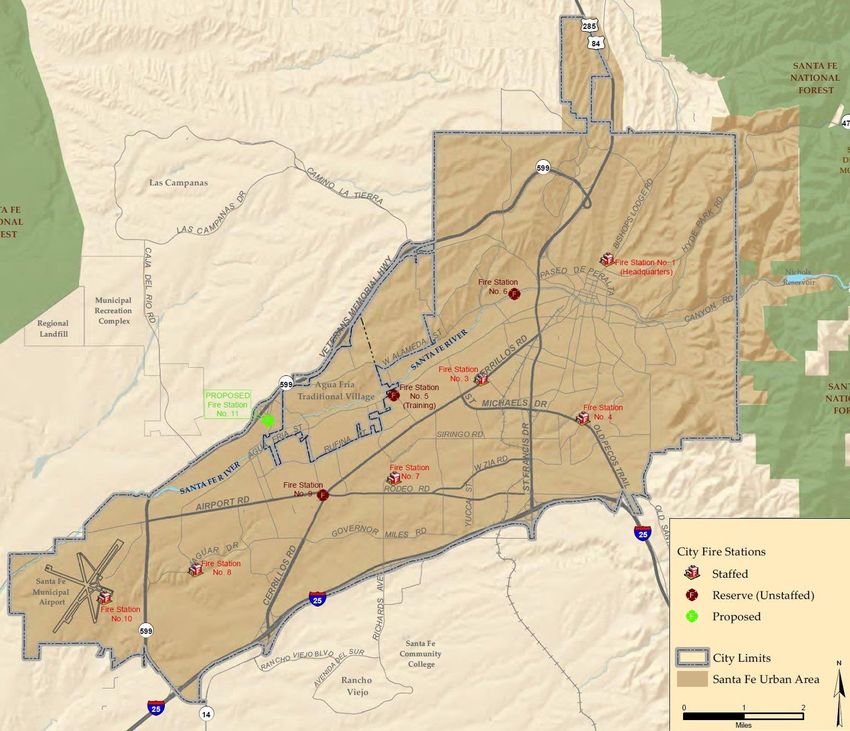
Table of Contents
EXECUTIVE SUMMARY ................................................................................................................ 1
LEGAL FRAMEWORK ................................................................................................................... 6
SERVICE AREAS............................................................................................................................... 8
LAND USE ASSUMPTIONS ........................................................................................................ 11
METHODOLOGIES ...................................................................................................................... 12
ROADS ............................................................................................................................................... 14
PARKS/TRAILS ............................................................................................................................... 28
FIRE/EMS ......................................................................................................................................... 36
POLICE .............................................................................................................................................. 42
APPENDIX A: ROAD INVENTORY ....................................................................................... 48
APPENDIX B: AVERAGE HOUSEHOLD SIZE .................................................................. 53
APPENDIX C: FUNCTIONAL POPULATION ..................................................................... 56
APPENDIX D: PARK/TRAIL INVENTORY......................................................................... 60
APPENDIX E: FINANCIAL DATA .......................................................................................... 64
APPENDIX F: LAND USE ASSUMPTIONS........................................................................... 69
APPENDIX G: CAPITAL FACILITY PLANS ......................................................................... 73

                                      Clancy Mullen, Principal and Project Manager
                                        17409 Rush Pea Circle, Austin, TX 78738
                                     512-423-0480 ● clancy@duncanassociates.com
List of Tables
Table 1. Maximum Impact Fees Calculated in 2014 Study ........................................................... 1
Table 2. Adopted Impact Fee Schedule........................................................................................... 2
Table 3. Updated Maximum Impact Fees ....................................................................................... 2
Table 4. Percentage Change from 2014 Study Fees....................................................................... 3
Table 5. Potential Impact Fee Revenue, 2021-2027 ...................................................................... 4
Table 6. Example of Different Adoption Rates by Fee Type ...................................................... 5
Table 7. Projected Revenue for Adoption Rate Example, 2021-2027 ........................................ 5
Table 8. Land Use Assumptions Summary, 2021-2027 .............................................................. 11
Table 9. Affordable Housing Waivers ........................................................................................... 11
Table 10. Existing Road Level of Service...................................................................................... 16
Table 11. Traffic Signal Level of Service ....................................................................................... 17
Table 12. Single-Family Trip Generation Rates ........................................................................... 18
Table 13. Expected Vehicle-Miles of Travel ................................................................................. 19
Table 14. Local Trip Length Adjustment Factor ......................................................................... 20
Table 15. Average Trip Length by Trip Purpose ......................................................................... 20
Table 16. Travel Demand Schedule ............................................................................................... 21
Table 17. Road Segment Cost per Service Unit ........................................................................... 22
Table 18. Traffic Signal Cost per Service Unit ............................................................................. 22
Table 19. Total Road Cost per Service Unit ................................................................................. 22
Table 20. Total Daily Travel Demand, 2021-2027....................................................................... 23
Table 21. Major Road Capital Needs, 2021-2027......................................................................... 23
Table 22. Road Federal/State Funding Credit.............................................................................. 24
Table 23. Road Grant Credit ........................................................................................................... 25
Table 24. Road Debt Credit ............................................................................................................ 25
Table 25. Road Net Cost per Service Unit .................................................................................... 25
Table 26. Road Net Cost Schedule................................................................................................. 26
Table 27. Change in Road Impact Fees ......................................................................................... 26
Table 28. Potential Road Impact Fee Revenue, 2021-2027 ........................................................ 27
Table 29. Park/Trail Equivalent Dwelling Unit Multipliers ....................................................... 29
Table 30. Park/Trail Service Units, 2021-2027 ............................................................................ 30
Table 31. City Share of MRC/Golf Course Facilities.................................................................. 31
Table 32. Park/Trail Replacement Cost ........................................................................................ 32
Table 33. Park/Trail Cost Per Service Unit .................................................................................. 32
Table 34. Park/Trail Capital Needs, 2021-2027 ........................................................................... 33
Table 35. Park/Trail Debt Credit ................................................................................................... 33
Table 36. Park/Trail Grant Funding Credit .................................................................................. 34
Table 37. Park/Trail Net Cost Per Service Unit .......................................................................... 34
Table 38. Park/Trail Net Cost Schedule ....................................................................................... 35
Table 39. Change in Park/Trail Impact Fees................................................................................ 35
Table 40. Potential Park/Trail Impact Fee Revenue, 2021-2027 .............................................. 35
Table 41. Fire/EMS Facility Replacement Cost........................................................................... 38
Table 42. Fire/EMS Cost Per Service Unit .................................................................................. 38
Table 43. Fire/EMS Capital Needs, 2021-2027 ........................................................................... 38
Table 44. Fire/EMS Debt Credit ................................................................................................... 39
Table 45. Fire/EMS Net Cost Per Service Unit........................................................................... 39
Table 46. Fire/EMS Net Cost Schedule........................................................................................ 40
Table 47. Fire/EMS Impact Fee Comparisons ............................................................................ 40
Table 48. Potential Fire/EMS Impact Fee Revenue, 2021-2027 ............................................... 41
Table 49. Police Facility Replacement Cost .................................................................................. 43
Table 50.   Police Equipment Replacement Cost ........................................................................... 43
Table 51.   Police Cost Per Service Unit .......................................................................................... 43
Table 52.   Police Capital Needs, 2021-2027 ................................................................................... 44
Table 53.   Police Debt Credit ........................................................................................................... 44
Table 54.   Police Grant Funding Credit Per Service Unit............................................................ 45
Table 55.   Police Net Cost Per Service Unit .................................................................................. 45
Table 56.   Police Net Cost Schedule ............................................................................................... 46
Table 57.   Change in Police Impact Fees ....................................................................................... 46
Table 58.   Potential Police Impact Fee Revenue, 2021-2027 ...................................................... 47
Table 59.   Major Roadway Inventory .............................................................................................. 48
Table 60.   Average Household Size, City of Santa Fe, 2014-2018.............................................. 53
Table 61.   Average Household Size, Santa Fe County, 2014-2018 ............................................. 53
Table 62.   Average Household Size, City of Santa Fe .................................................................. 54
Table 63.   Average Household Size by Unit Size, Western U.S. ................................................. 55
Table 64.   Average Household Size by Unit Size .......................................................................... 55
Table 65.   Average Household Size Summary ............................................................................... 55
Table 66.   Time Usage Survey Data ................................................................................................ 57
Table 67.   Residential Functional Population per Unit ................................................................ 57
Table 68.   Nonresidential Functional Population per Unit ......................................................... 58
Table 69.   Functional Population Multipliers................................................................................. 59
Table 70.   Functional Population, 2021-2027 ................................................................................ 59
Table 71.   Inventory of Existing Parks and Open Space ............................................................. 60
Table 72.   Existing Trail Inventory.................................................................................................. 63
Table 73.   Impact Fee Revenues/Expenditures, FY 2014-2019 ................................................. 64
Table 74.   Outstanding Non-Utility Debt Summary .................................................................... 64
Table 75.   Distribution of Debt by Facility Type .......................................................................... 65
Table 76.   Outstanding Debt by Facility Type............................................................................... 65
Table 77.   2004A Gross Receipts Tax Bond Projects .................................................................. 66
Table 78.   2008 Gross Receipts Tax Bond Projects...................................................................... 67
Table 79.   2012A Gross Receipts Tax Bond Projects .................................................................. 68
Table 80.   Planned Major Road Improvements, 2021-2027 ........................................................ 73
Table 81.   Planned Park/Trail Improvements, 2021-2027 .......................................................... 74
Table 82.   Planned Fire/EMS Improvements, 2021-2027 .......................................................... 74
Table 83.   Planned Police Improvements, 2021-2027 .................................................................. 75

List of Figures
Figure 1.   Santa Fe City Limits Map .................................................................................................. 9
Figure 2.   Functional Classification Map ........................................................................................ 15
Figure 3.   Road Impact Fee Formula .............................................................................................. 17
Figure 4.   Existing Parks, Open Space and Trails ......................................................................... 28
Figure 5.   Existing Fire Stations ....................................................................................................... 36
Figure 6.   Nonresidential Functional Population Formula .......................................................... 58
EXECUTIVE SUMMARY

Duncan Associates has been retained by the City of Santa Fe to update the City’s capital improvements
plans, land use assumptions and impact fees for roads, parks/trails, fire/EMS and police facilities.
This study calculates maximum impact fees that Santa Fe can charge based on the existing levels of
service.

Report Layout

The report begins with four chapters that have general applicability to all impact fees: legal framework,
service areas, land use assumptions, and methodologies. The last four chapters address the four types
of facilities: roads, parks/trails, fire/EMS and police. Appendices provide more detailed data and
analysis to support the individual fee calculations. The final appendix contains the list of planned
improvements, which may be amended between comprehensive impact fee updates. To make the
calculations easier to follow, number that are inputs into another table are highlighted in red.

Current Fees

The last comprehensive update of the City’s impact fees was based on a study that was adopted by
the City Council in 2014. The maximum fees calculated in the current Impact Fee Capital
Improvements Plan are summarized in Table 1.

                     Table 1. Maximum Impact Fees Calculated in 2014 Study
       Land Use Type                     Unit             Roads       Parks          Fire      Police      Total
       Single-Family Detached (avg.)* Dwelling            $3,009      $1,552        $247        $104      $4,912
           1,500 sq. ft. or less      Dwelling            $2,706      $1,381        $220         $92      $4,399
           1,501-2,000 sq. ft.        Dwelling            $2,949      $1,443        $230         $97      $4,719
           2,001-2,500 sq. ft.        Dwelling            $3,059      $1,583        $252        $106      $5,000
           2,501-3,000 sq. ft.        Dwelling            $3,207      $1,661        $265        $111      $5,244
           More than 3,000 sq. ft.    Dwelling            $3,395      $1,769        $282        $119      $5,565
       Accessory Unit                 Dwelling            $1,617      $1,180        $187         $79      $3,063
       Multi-Family                   Dwelling            $1,855      $1,350        $214         $90      $3,509
       Mobile Home Park                 Space               $974      $2,154        $343        $144      $3,615
       Retail/Commercial             1,000 sq. ft.        $5,723          $0        $384        $161      $6,268
       Office                        1,000 sq. ft.        $3,431          $0        $180         $76      $3,687
       Industrial                    1,000 sq. ft.        $2,651          $0         $78         $33      $2,762
       Warehouse                     1,000 sq. ft.        $1,383          $0         $34         $14      $1,431
       Mini-Warehouse                1,000 sq. ft.          $535          $0         $31         $13        $579
       Public/Institutional          1,000 sq. ft.        $2,086          $0        $162         $68      $2,316
        * square feet is heated living area; includes mobile home not in mobile home park
        Source: Impact Fee Capital Improvement Plan 2020, adopted by Santa Fe City Council, August 27, 2014.

City of Santa Fe, NM
Impact Fee Capital Improvements Plan                       1                                            December 9, 2020
Executive Summary
The City Council adopted fees at 70% of the calculated maximum amounts, except for accessory units
(adopted fee is one-half the adopted fee at 70% for a 1,500 sq. ft. or smaller single-family detached
unit) and mobile home park (that fee was not adopted). The current impact fee schedule is
summarized in Table 2.
Table 2. Adopted Impact Fee Schedule
Land Use Type Unit Roads Parks Fire Police Total
Single-Family Detached*
1,500 sq. ft. or less Dwelling $1,894 $967 $154 $64 $3,079
1,501-2,000 sq. ft. Dwelling $2,064 $1,010 $161 $68 $3,303
2,001-2,500 sq. ft. Dwelling $2,141 $1,108 $176 $74 $3,499
2,501-3,000 sq. ft. Dwelling $2,245 $1,163 $186 $78 $3,672
More than 3,000 sq. ft. Dwelling $2,377 $1,238 $197 $83 $3,895
Accessory Unit Dwelling $947 $483 $77 $32 $1,539
Multi-Family Dwelling $1,299 $945 $150 $63 $2,457
Retail/Commercial 1,000 sq. ft. $4,006 $0 $269 $113 $4,388
Office 1,000 sq. ft. $2,402 $0 $126 $53 $2,581
Industrial 1,000 sq. ft. $1,856 $0 $55 $23 $1,934
Warehouse 1,000 sq. ft. $968 $0 $24 $10 $1,002
Mini-Warehouse 1,000 sq. ft. $375 $0 $22 $9 $406
Public/Institutional 1,000 sq. ft. $1,460 $0 $113 $48 $1,621
* square footage ranges refer to heated living area; includes mobile home not in mobile home park
Source: Santa Fe City Code, Sec. 14-8.14/E(a).
Updated Fees
The maximum fees calculated in this update of the Santa Fe Impact Fee Capital Improvements Plan
are summarized in Table 3.
Table 3. Updated Maximum Impact Fees
Land Use Type Unit Roads Parks Fire Police Total
Single-Family Detached (avg.) Dwelling $3,403 $2,935 $559 $141 $7,038
1,500 sq. ft. or less Dwelling $3,208 $2,700 $514 $130 $6,552
1,501-2,500 sq. ft. Dwelling $3,381 $2,906 $554 $140 $6,981
2,501-3,000 sq. ft. Dwelling $3,553 $3,111 $592 $150 $7,406
more than 3,000 sq. ft. Dwelling $3,748 $3,346 $636 $161 $7,891
Accessory Unit Dwelling $1,673 $1,849 $352 $89 $3,963
Multi-Family Dwelling $1,961 $2,201 $420 $106 $4,688
Mobile Home Park Space $1,802 $4,491 $855 $216 $7,364
Retail/Commercial 1,000 sq. ft. $4,670 $0 $624 $158 $5,452
Office 1,000 sq. ft. $3,986 $0 $303 $77 $4,366
Industrial 1,000 sq. ft. $1,592 $0 $131 $33 $1,756
Warehouse 1,000 sq. ft. $825 $0 $61 $15 $901
Mini-Warehouse 1,000 sq. ft. $403 $0 $12 $3 $418
Public/Institutional 1,000 sq. ft. $1,808 $0 $140 $36 $1,984
Source: Updated fees from Table 26 (roads), Table 38 (parks), Table 46 (fire/EMS) and Table 56 (police).
City of Santa Fe, NM
Impact Fee Capital Improvements Plan 2 December 9, 2020Executive Summary
The changes in fees by land use and facility type are summarized in Table 4. The major increase in
residential fees is from the park fees, which account for 65%, of the $2,126 increase for an average
single-family unit from the previous maximum fees. Fire fees are increasing by a higher percentage,
but are much smaller fees.
The picture is mixed for nonresidential uses, with an increase in total fees for office uses and a decline
for other uses. Road fees are the dominant fee for nonresidential uses, and the change in the road fee
largely determines the change in the total fee. The differential changes between nonresidential land
uses largely reflect changes in trip generation rates from the updated Trip Generation Manual.
Table 4. Percentage Change from 2014 Study Fees
Land Use Type Unit Roads Parks Fire Police Total
Single-Family Detached (avg.) Dwelling 13% 89% 126% 36% 43%
1,500 sq. ft. or less Dwelling 19% 96% 134% 41% 49%
1,501-2,000 sq. ft. Dwelling 15% 101% 141% 44% 48%
2,001-2,500 sq. ft. Dwelling 11% 84% 120% 32% 40%
2,501-3,000 sq. ft. Dwelling 11% 87% 123% 35% 41%
more than 3,000 sq. ft. Dwelling 10% 89% 126% 35% 42%
Accessory Unit Dwelling 3% 57% 88% 13% 29%
Multi-Family Dwelling 6% 63% 96% 18% 34%
Mobile Home Park Space 85% 108% 149% 50% 104%
Retail/Commercial 1,000 sq. ft. -18% n/a 63% -2% -13%
Office 1,000 sq. ft. 16% n/a 68% 1% 18%
Industrial 1,000 sq. ft. -40% n/a 68% 0% -36%
Warehouse 1,000 sq. ft. -40% n/a 79% 7% -37%
Mini-Warehouse 1,000 sq. ft. -25% n/a -61% -77% -28%
Public/Institutional 1,000 sq. ft. -13% n/a -14% -47% -14%
Weighted Avg. Increase n/a 4% 73% 99% 20% 31%
Source: Percentages represent changes from 2014 study fee in Table 1 to updated fee in Table 3; weighted
average increase is change from projected 7-year revenue under current maximum fees from Table 5 below.
The reasons for the significant increase in park fees, which as noted is primarily driving the residential
fee increases, warrant some explanation. Overall, the total replacement value of existing park facilities
increased by about 20%, which is the same as the increase in the Engineering News Record Construction
Cost Index since the previous study estimates were made. However, a significant increase in average
household size, the exclusion of unincorporated area housing units (including in the Agua Fria
Traditional Community), and a major reduction in outstanding park debt resulted in the park fees
increases ranging from 57% to double what was calculated in the 2014 study depending on the housing
type and unit size.
City of Santa Fe, NM
Impact Fee Capital Improvements Plan 3 December 9, 2020Executive Summary
Based on the land use assumptions, the adopted current fees at 70% would generate about $17.1
million in total impact fee revenue over the next seven years. If the current fees had been adopted at
100%, they would generate $24.7 million. If the updated fees are adopted at 100%, they would be
expected to generate about $32.2 million over the next seven years. Most of the revenue increase over
current fees would come from the updated road and park impact fees.
Table 5. Potential Impact Fee Revenue, 2021-2027
Current 2014 Max. 2020 Max. % Change 2020 to:
Fee Type Fees (70%) Fees (100%) Fees (100%) Current 2014 Max.
Roads $10,634,926 $15,300,859 $15,884,699 49.4% 3.8%
Parks/Trails $5,138,111 $7,419,050 $12,832,988 149.8% 73.0%
Fire/EMS $968,446 $1,395,997 $2,777,060 186.8% 98.9%
Police $407,363 $587,229 $703,392 72.7% 19.8%
Total $17,148,846 $24,703,135 $32,198,139 87.8% 30.3%
Source: 2014 and 2020 maximum fee revenue projections from Table 28 (roads), Table 40 (parks), Table 48
(fire/EMS) and Table 58 (police); revenue from current fees is 2014 maximum fee revenue divided by 70%;
the percentage changes are from the current and 2014 maximum fee revenues to the 2020 maximum fee
revenue.
Implementation Options
Adoption Rates. The adoption rate for the current fees is set at 70% for all four fees. Setting the
implementation rates differently by land use type (e.g., residential versus nonresidential) is to be
avoided, because it breaks the nexus between the impact of the development and the amount of the
fee. A key requirement of impact fee case law is that the fee needs to be proportional to the impact
of the development. If the City desires to assess a lower fee for a specific development or for a specific
land use type, it should instead use City funds to buy down the fees shown in the fee schedule for
qualifying developments.
However, the City could set different adoption rates for roads, parks, fire and police fees. An example
of adoption rates that would keep single-family fees from increasing too dramatically, while ensuring
that total revenues for all four types of facilities increase somewhat compared to current fees, is shown
in Table 6 and Table 7 on the following page. Accessory dwelling units have largest percentage
increase in the total fee. The amount of the increase for an accessory unit would be $652, compared
to a $906 increase for a typical 2,001-2,500 square foot single-family unit.
Interim Fee Increases. Ways to mitigate large fee changes between 5-year comprehensive impact
fee updates include annual incremental increases to the adoption rates or annual adjustments for
construction cost inflation. These fee adjustments can be made by the City Council amending the
ordinance each year, or by amending the ordinance when the updated fees are adopted to either (1)
set out a phased schedule of adoption rates for the next four years or (2) include a provision for staff
to follow to adjust the fees annually by a specified construction cost index.
City of Santa Fe, NM
Impact Fee Capital Improvements Plan 4 December 9, 2020Executive Summary
Table 6. Example of Different Adoption Rates by Fee Type
Land Use Type Unit Roads Parks Fire Police Total
Updated Fees by Adoption Rate: 72% 43% 38% 64%
Single-Family Detached
1,500 sq. ft. or less Dwelling $2,310 $1,161 $195 $83 $3,749
1,501-2,500 sq. ft. Dwelling $2,434 $1,250 $211 $90 $3,985
2,501-3,000 sq. ft. Dwelling $2,558 $1,338 $225 $96 $4,217
more than 3,000 sq. ft. Dwelling $2,699 $1,439 $242 $103 $4,483
Accessory Unit Dwelling $1,205 $795 $134 $57 $2,191
Multi-Family Dwelling $1,412 $946 $160 $68 $2,586
Mobile Home Park Space $1,297 $1,931 $325 $138 $3,691
Retail/Commercial 1,000 sq. ft. $3,362 n/a $237 $101 $3,700
Office 1,000 sq. ft. $2,870 n/a $115 $49 $3,034
Industrial 1,000 sq. ft. $1,146 n/a $50 $21 $1,217
Warehouse 1,000 sq. ft. $594 n/a $23 $10 $627
Mini-Warehouse 1,000 sq. ft. $290 n/a $5 $2 $297
Public/Institutional 1,000 sq. ft. $1,302 n/a $53 $23 $1,378
Change from Current Fees
Single-Family Detached
1,500 sq. ft. or less Dwelling 22% 20% 27% 30% 22%
1,501-2,000 sq. ft. Dwelling 18% 24% 31% 32% 21%
2,001-2,500 sq. ft. Dwelling 14% 13% 20% 22% 14%
2,501-3,000 sq. ft. Dwelling 14% 15% 21% 23% 15%
more than 3,000 sq. ft. Dwelling 14% 16% 23% 24% 15%
Accessory Unit Dwelling 27% 65% 74% 78% 42%
Multi-Family Dwelling 9% 0% 7% 8% 5%
Mobile Home Park Space n/a n/a n/a n/a n/a
Retail/Commercial 1,000 sq. ft. -16% n/a -12% -11% -16%
Office 1,000 sq. ft. 19% n/a -9% -8% 18%
Industrial 1,000 sq. ft. -38% n/a -9% -9% -37%
Warehouse 1,000 sq. ft. -39% n/a -4% 0% -37%
Mini-Warehouse 1,000 sq. ft. -23% n/a -77% -78% -27%
Public/Institutional 1,000 sq. ft. -11% n/a -53% -52% -15%
Source: Updated fees are maximum fees from Table 3 times adoption rate; percentage changes are from current
fees in Table 2.
Table 7. Projected Revenue for Adoption Rate Example, 2021-2027
Roads Parks Fire Police Total
Adoption Rate for Updated Fees 72% 43% 38% 64%
Projected Revenue from Updated Fees $11,436,983 $5,518,185 $1,055,283 $450,171 $18,460,622
Projected Revenue from Current Fees $10,634,926 $5,138,111 $968,446 $407,363 $17,148,846
Total Revenue Change, 2021-2027 8% 7% 9% 11% 8%
Source: Projected revenue from updated fees by adoption rates are 2020 (100%) revenue projections from Table 5 times adoption rate;
projected revenue from current fees from Table 5.
City of Santa Fe, NM
Impact Fee Capital Improvements Plan 5 December 9, 2020LEGAL FRAMEWORK Impact fees are a way for local governments to require new developments to pay a proportionate share of the infrastructure costs they impose on the community. In contrast to traditional “negotiated” developer exactions, impact fees are charges that are assessed on new development using a standard formula based on objective characteristics, such as the number and type of dwelling units constructed. The fees are one-time, up-front charges, with the payment usually made at the time of building permit issuance. Impact fees require each new development project to pay its pro-rata share of the cost of new capital facilities required to serve that development. Impact fees were pioneered by local governments in the absence of explicit state enabling legislation. Consequently, such fees were originally defended as an exercise of local government's broad “police power” to protect the health, safety and welfare of the community. The courts gradually developed guidelines for constitutionally-valid impact fees, based on a "rational nexus" that must exist between the regulatory fee or exaction and the activity that is being regulated. To date, 28 states have adopted impact fee enabling legislation. These acts have tended to embody the constitutional standards that have been developed by the courts. Impact fees in New Mexico are governed by the New Mexico Development Fees Act (Sec. 5-8-1, et. seq., New Mexico Revised Statutes). Service Area The New Mexico Development Fees Act requires that Land Use Assumptions and Capital Improvements Plans must be prepared for each “service area.” A service area is a geographic area within which a set of capital facilities provides roughly equivalent benefit to all development located within the area. In general, impact fees collected within a service area will be spent within the same service area, although there may be instances where the facility that serves development in the service area is actually physically located outside the service area. Land Use Assumptions An impact fee update must include land use assumptions (growth projections) for each service area. The Development Fees Act defines land use assumptions as “projections of changes in land uses, densities, intensities and population in the service area over at least a five-year period.” Because the Capital Improvements Plan that must be prepared for each service area must identify improvement needs for a period not to exceed ten years, a 5-to-10-year time-frame is appropriate for an impact fee study. A seven-year time frame is used for the land use assumptions and capital improvements plans in this study. The Land Use Assumptions prepared by the City are provided in Appendix F. Capital Improvements Plan According to the Development Fees Act, impact fees can only be spent on improvements identified in the Capital Improvements Plan. The Capital Improvements Plan required by the Development Fees Act is somewhat different from the traditional capital improvements program. Like a traditional capital improvements program, the Capital Improvements Plan required by the Development Fees Act must include a list of capital projects, their costs and anticipated sources of funding. However, the similarity stops there. Elements required in the Capital Improvements Plan but not found in a typical capital improvements program include an inventory of existing facilities, including an analysis of current usage and capacity of such facilities; a determination of the portion of the cost of planned improvements, as well as existing improvements with remaining excess capacity, that is attributable to growth; an equivalency table that estimates the service demand generated by different land use types; City of Santa Fe, NM Impact Fee Capital Improvements Plan 6 December 9, 2020
Legal Framework

and the projected growth in service demand based on the recommended Land Use Assumptions over
a period not to exceed ten years. In essence, the impact fee Capital Improvements Plan is the impact
fee study.

Capital Facilities Plans
While the Capital Improvements Plan includes much more than a list of planned projects, the project
list has special relevance. Impact fees can only be spent on projects that are listed in the adopted
Capital Improvements Plan. In addition, credits against the impact fees in return for dedications of
land or improvements made by developers are only allowed if the dedication or improvement is listed
in the Capital Improvements Plan. In order to distinguish between the full Capital Improvements
Plan and the list of projects, the list of projects will be referred to as the Capital Facilities Plan. The
Capital Facility Plans for each of the four fee types are provided in Appendix G.

Level of Service
The Act requires “an analysis of the total capacity [and] the level of current usage” of existing facilities,
a relationship that is often referred to as “level of service” (although this term does not appear in the
Act). The impact fee principle that is being referred to here is that new development should not be
charged for a higher level of service than is being provided to existing development. If facilities are
currently deficient with respect to the capacity standard that is being used to calculate the impact fees,
a credit should be provided to new development to acknowledge tax or rate payments that will be
made by new development and used to remedy the deficiency. The necessity of providing a deficiency
credit is avoided by basing the impact fees on the current level of service.

Service Unit
Both demand and capacity need to be expressed in terms of the same “service units” – defined by the
Act as “a standardized measure of consumption, use, generation or discharge.” The service unit for
parks, for example, might be acres of park land. In order to translate land use projections into
additional demands for service, the Capital Improvements Plan must include “an equivalency or
conversion table establishing the ratio of a service unit to various types of land uses, including
residential, commercial, and industrial.” Such a table, which relates various land use categories and
the service demands associated with them, is the basis for the fee schedule. The equivalency table for
road impact fees, for example, would specify the typical travel demand generated by a single-family
unit, 1,000 square feet of office space, etc.

Fee Schedule
The fee schedule brings together all of the fee calculation components. These include the land use
categories, service demands associated with a unit of development, cost per service unit and revenue
credits. Although the Act does not specifically mention credits for other revenue contributions (e.g.,
gross receipts taxes used to pay debt service on the same facility), established case law clearly indicates
that double-charging must be avoided and that such contributions must be credited in the impact fee
formulation.

Updates
The Development Fees Act requires that the land use assumptions and capital improvements plan be
updated within five years from the date that the last capital improvements plan was adopted.

City of Santa Fe, NM
Impact Fee Capital Improvements Plan                 7                                     December 9, 2020
SERVICE AREAS
The New Mexico Development Fees Act defines “service area” as:
the area within the corporate boundaries or extraterritorial jurisdiction of a municipality or the
boundaries of a county to be served by the capital improvements or facility expansions specified in the
capital improvements plan designated on the basis of sound planning and engineering standards.
The current service area for all the City’s impact fees is the Santa Fe Urban Area. The Urban Area is
the geographic area that includes the City’s incorporated area as well as some additional
unincorporated area that may be annexed into the city at some time in the future. However, the Agua
Fria Traditional Historic Community, containing an estimated 1,527 single-family units, is located
within the urban area but is expected to remain unincorporated. City impact fees are charged only
within the corporate limits and unincorporated areas within the Urban Area where the City has
building permit authority.
The City has completed annexation of most of the land within the urban area, with the exceptions of
the Agua Fria Traditional Historic Community, an unincorporated island of County-owned land north
of Rodeo Road that contains the County Fairgrounds, and a phase 2 annexation area of just over 1,000
acres that contained 322 dwelling units in 2010. Section 5-8-12 of the Development Fees Act says
“Any new development for which an impact fee has been paid is entitled to the permanent use and
benefit of the services for which the fee was exacted and is entitled to receive prompt service from
any existing facilities with actual capacity to serve the new service units.” New development in areas
outside the city limits could be assessed impact fees, and would have immediate access to City parks
and major roads, but would not have access to City fire and police service. It appears that the City
should not collect impact fees outside the city limits under its extra-jurisdictional planning and zoning
authority unless it is currently providing fire/EMS and policing services. Based on these
considerations, it is recommended that the incorporated area, rather than the urban area, be the service
area for all the City’s impact fees, with one exception.
This update utilizes the incorporated area as the service area for the road, fire/EMS and police impact
fees. For reasons discussed in the Parks chapter (see text preceding Table 31), the park impact fee
service area also includes the roughly 1,200-acre City-owned property occupied by the Municipal
Recreation Center and Marty Sanchez Golf Course. The updated land use assumptions are prepared
for the incorporated area (which works for parks as well, because there is no existing or anticipated
residential development in the MRC/golf course land). Major roadways that determine the estimated
traffic demand generated by existing development exclude any that are located outside the city limits.
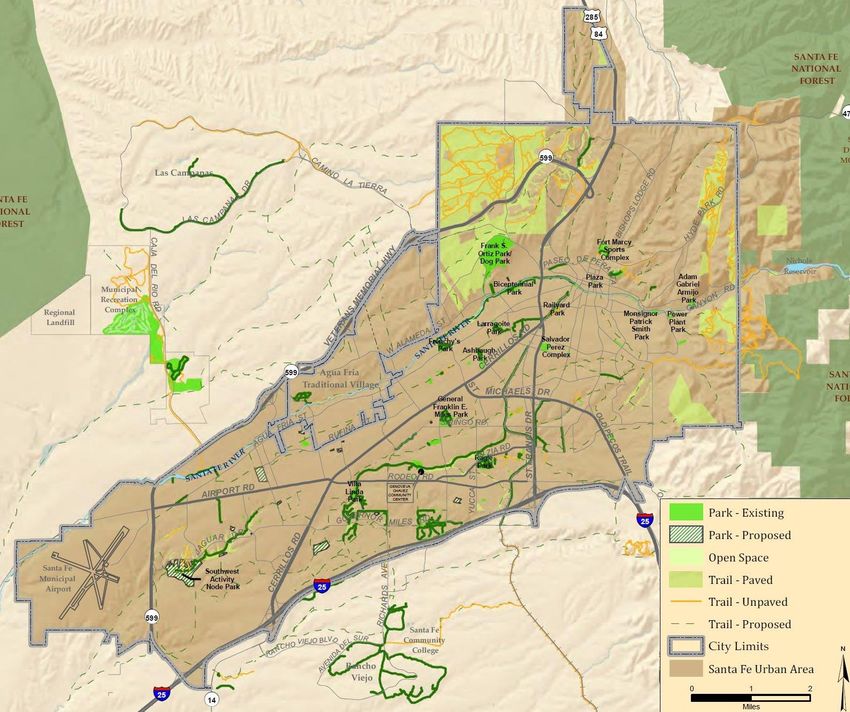
The current City limits are illustrated in Figure 1 on the following page.
City of Santa Fe, NM
Impact Fee Capital Improvements Plan 8 December 9, 2020Service Areas
Figure 1. Santa Fe City Limits Map
City of Santa Fe, NM
Impact Fee Capital Improvements Plan 9 December 9, 2020Service Areas The City currently has a single service area for all of the fees. In general, multiple service areas should be avoided where possible. Each service area requires the preparation of separate land use assumptions, facility inventories, impact fee calculations and capital improvements plans. In addition, multiple service areas limit the City’s ability to accumulate sufficient funds to make improvements. Multiple service areas are sometimes used to create fee differentials as an incentive to steer development to desired locations. Impact fee differentials by area, however, are unlikely to be large enough to have any significant effect on the location of development. The City’s road impact fees fund improvements to the major roadway system, defined as arterial and collector roadways within the City’s incorporated area, excluding expressways (I-25, NM 599, and US 285 north of NM 599) that mostly carry traffic around the city. Because the major roadway system facilitates travel throughout the community, a single service area continues to be appropriate for road impact fees. The City’s park/trail impact fees fund improvements to the system of recreational facilities, including regional parks, neighborhood parks and trails. Regional parks and trails tend to serve relatively large areas, while neighborhood parks have more localized benefit. As long as the City makes a good faith effort to ensure that park/trail impact fees used to fund neighborhood park improvements are in areas that are experiencing residential development, a single service area will continue to be appropriate for park/trail impact fees. As discussed above, the updated service area for park fees includes some City- owned property in the unincorporated area used for recreational purposes. A single service area continues to be appropriate for fire and police facilities. Police facilities tend to be centralized, and police protection is provided throughout the city from roving patrol cars. While fire facilities are by necessity more decentralized, responding units are not always located at the nearest station, and units respond to major incidents from all over the city. The City’s fire and police facilities and equipment thus form integrated systems, and single service areas are appropriate. City of Santa Fe, NM Impact Fee Capital Improvements Plan 10 December 9, 2020
LAND USE ASSUMPTIONS

Land Use Assumptions for the impact fees are provided in Appendix F. The land use assumption
report provides growth projections for the City of Santa Fe, a unified service area within which the
City may expend impact fee monies for eligible capital improvement projects. The New Mexico
Development Fees Act (§§ 5-8-1 through 5-8-43, NMSA 1978), specifies that land use assumptions
must be adopted for a period of at least five years. The land use assumptions cover a period of seven
years from 2021 to 2027.1 Over this period, the land use assumptions anticipate that the service area
will gain 5,540 new dwelling units with approximately 7,162 new residents and 0.926 million square
feet of new nonresidential development. The growth projections for housing, population, and
nonresidential floor area over the next seven years are summarized in Table 8.

                         Table 8. Land Use Assumptions Summary, 2021-2027
                                                                   2020           2027          Increase
                    Population                                    85,403         92,565           7,162
                    Housing
                    Single-Family Detached                        27,831         29,815          1,984
                    Accessory Dwelling Units                       3,274          3,508            234
                    Multi-Family                                  12,225         15,547          3,322
                    Total Housing Units                           43,330         48,870          5,540
                    Nonresidential
                    Retail/Commercial (1,000 sf)                  13,790         14,176            386
                    Office (1,000 sf)                              5,526          5,681            155
                    Industrial (1,000 sf)                          2,450          2,519             69
                    Warehouse (1,000 sf)                           2,754          2,831             77
                    Mini-Warehouse (1,000 sf)                      1,283          1,319             36
                    Public/Institutional (1,000 sf)                7,261          7,464            203
                    Total Nonresidential (1,000 sf)               33,064         33,990            926
                     Source: City of Santa Fe Long Range Planning Division, Impact Fee Land Use
                     Assumptions 2021-2027, (see Appendix F - forthcoming).

The City waives or reduces impact fees for qualifying affordable housing units. Based on recent
history, such waivers over the next seven years are estimated in Table 9.

                                    Table 9. Affordable Housing Waivers
                                                                    Single-           Multi-
                                      Calendar Year                 Family            Family
                                            2015                       12                0
                                            2016                       12                0
                                            2017                       37                0
                                            2018                       22                0
                                            2019                        4               87
                                        2020 (est.)                    14               65
                              Total, Last 6 Years                     101              152
                              AverageWaivers per Year                  17               25
                              7-Year Estimate                         119              175
                               Source: City of Santa Fe Long-Range Planning Division, October
                               15, 2020.

1Years may refer to a point in time during a year or to a full calendar year. 2020-2027 refers to the 7-year interval between
a point in time in those years, while 2021-2027 refers to the increase during those seven full calendar years.

City of Santa Fe, NM
Impact Fee Capital Improvements Plan                         11                                            December 9, 2020
METHODOLOGIES This chapter reviews the existing methodologies for all four facility types, identifies potential alternatives and makes recommendations for changes. There are a variety of methodologies that can be employed to calculate impact fees. Any methodology, however, must comply with the fundamental principle of impact fees, which is that new development should not be charged for a higher level of service than existing development. Impact fees can be based on a higher level of service than currently exists, but if they are based on a higher level of service a funding plan must be put in place to remedy the existing deficiencies and a credit must be provided for the portion of the funding used to remedy the deficiencies that will be generated by new development. Alternative Methodologies There are two basic types of impact fee methodologies: “standards-based” and “plan-based.” Standards-based methodologies use a generalized, system-wide level of service measure, such as the number of park acres per 1,000 residents. With such a standard, appropriate impact fees can be calculated based on the cost of maintaining the existing level of service without a master plan specifying specific improvements to be constructed. This approach gives the City flexibility to modify its capital facility plans to respond to changing conditions without triggering the need for a comprehensive impact fee update. A plan-based methodology relies on a list of planned capital improvements, and is basically calculated by dividing the cost of needed improvements over a period of time by the anticipated new service units over the same time period. The essential requirement for a plan-based fee is that it must demonstrate the nexus between the cost of the planned improvements and the amount of anticipated development. Some plan-based fees use a long-range master plan to establish this nexus. The master plan approach is generally based on an improvement-specific or geographically-based level of service standard, such as “all major roadways shall operate at LOS D or better,” and often results in the identification of existing deficiencies. Other plan-based fees are based on a build-out plan or list of capital improvements that are not based on a master plan. These non-master plan approaches must generally be combined with a standards-based analysis that demonstrates that the plan-based fee does not exceed the existing level of service, in order to establish the nexus between the planned improvements and the amount of development to be served by those improvements. Current Methodologies The City’s current impact fees are all based on a standards-based methodology, as described below. No changes from the basic methodologies are proposed. Roads The standards-based methodology for road impact fees is generally referred to as a “consumption- based” approach. In the standard consumption-based approach, the total cost of a representative set of improvements is divided by the capacity added by those improvements in order to determine an average cost per vehicle-mile of capacity (VMC). This cost per VMC is then multiplied by the vehicle- City of Santa Fe, NM Impact Fee Capital Improvements Plan 12 December 9, 2020
Methodologies

miles of travel (VMT) generated by a unit of development of a particular land use type to determine
the gross impact fee (i.e., before credits). A variant is the modified consumption-based approach,
which uses a system-wide VMC/VMT ratio higher than the 1:1 ratio implicit in the standard approach.

The City’s current road impact fees are based on the standard consumption-based methodology. This
is a relatively conservative approach, because most roadway systems require a VMC/VMT ratio
greater than one to operate effectively, due to the fact that vehicular travel does not always go where
excess road capacity is located. Nevertheless, it is a widely-used, reliable approach to the calculation
of road impact fees.

Parks
The standards-based methodology is sometimes referred to as “incremental expansion,” because it
uses the existing level of service to determine the cost required to serve future development. It is
based on the reasonable assumption that facilities will need to be expanded proportional to the amount
of growth that occurs. This approach is appropriate for facilities that do not have a significant amount
of excess capacity to serve future development.

Park impact fees are typically only assessed on residential development, because the need for parks is
related to the number of people residing in the community. Some park impact fees use the ratio of
park acres to population as the level-of-service measure. However, rather than using population as
the service unit for parks, the current fees use Equivalent Dwelling Units (EDUs). A typical single-
family home is 1.00 EDU, while the EDUs for other housing types are based on the average household
size relative to a typical single-family unit. Using EDUs rather than population has the advantage of
taking volatile occupancy rates out of the equation.

While a ratio of acres to population may be a useful level-of-service measure for park planning
purposes, it is less appropriate as the basis for impact fee calculations. An acre developed with ball
fields represents a much lower capital investment than an acre developed with a community center or
a swimming pool. The current park methodology uses the inventory of actual improvements and
current replacement costs to quantify the capital investment in existing facilities. The existing LOS is
defined in terms of capital investment per EDU.

Fire and Police
The current fire and police impact fees are also based on the incremental expansion approach, based
on the existing city-wide level of service. The level of service is quantified in terms of the capital
investment per service unit. The service unit for fire and police fees is “functional population.” A
functional person is similar to the concept of a full-time equivalent worker, and represents the
equivalent of a person being present at the land use for 24 hours a day. The functional population
approach is appropriate for fire and police services, since the demand for such services is strongly
related to the number of people present at a land use.

City of Santa Fe, NM
Impact Fee Capital Improvements Plan              13                                   December 9, 2020
ROADS

The New Mexico Development Fees Act authorizes local governments to impose impact fees for
“roadway facilities,” including traffic signals. In the 2008 update, the arterial impact fee was expanded
to include collector roads and was combined with the traffic signal impact fee into comprehensive
road impact fee. In this update, the service area is changed from the urban area to the incorporated
area.

Service Unit

In impact fee analysis, capital costs, revenue credits and net costs are calculated on the basis of a
“service unit,” which is a common unit of measurement of facility demand and capacity. An
appropriate service unit for roadway capital cost analysis is vehicle-miles of travel (VMT). Vehicle-
miles is a combination of the number of vehicles traveling during a given time period and the distance
(in miles) that these vehicles travel. The two time periods most often used in traffic analysis are the
24-hour day (average daily trips or ADT) and the single hour of the day with the highest traffic volume
(peak hour trips or PHT). Since available traffic counts are in the form of daily volumes, the impact
fees will continue to be based on ADT.

Major Road System

The New Mexico Development Fees Act limits the use of transportation impact fees to “roadway
facilities,” which are defined as:

        …arterial or collector streets or roads that have been designated on an officially adopted roadway plan of the
        municipality or county, including bridges, bike and pedestrian trails, bus bays, rights of way, traffic signals,
        landscaping and any local components of state or federal highways.

The City’s land development code defines the major road system as all collector and arterial roads.
However, the major road system has always excluded I-25, and the 2014 study excluded NM 599 as
well. This update also excludes US 285 north of NM 599, because this is also a limited-access facility
that largely functions to move traffic around the city. The functional classification system is illustrated
in Figure 2.

An inventory of the major roadway system was prepared as part of this update and is presented in
Table 59 in Appendix A. The update removes segments of US 285 north of NM 599, arterials and
collector outside the city limits, and other roads not classified as arterials or collectors on the current
functional classification map. The major purpose of the inventory is to determine the total amount
of travel on the major road system, expressed in vehicle-miles of travel (VMT), and system-wide
capacity, expressed as vehicle-miles of capacity (VMC). The system-wide VMT is used to calibrate
national travel demand factors to local conditions.

City of Santa Fe, NM
Impact Fee Capital Improvements Plan                      14                                        December 9, 2020
Roads
Figure 2. Functional Classification Map
Source: Functional classification map from Santa Fe Metropolitan Planning Organization website.
City of Santa Fe, NM
Impact Fee Capital Improvements Plan 15 December 9, 2020Roads
Methodology
As with the previous road impact fee calculation, the methodology for determining the road segment
component of the road impact fee is based on a “consumption-based” model, which basically charges
a new development the cost of replacing the capacity that it consumes on the major road system. That
is, for every vehicle-mile of travel (VMT) generated by the development, the road impact fee charges
the net cost to construct an additional vehicle-mile of capacity (VMC).
Since travel is never evenly distributed throughout a road system, actual road systems require more
than one unit of capacity for every unit of demand in order for the system to function at an acceptable
level of service. Suppose, for example, that the City completes a major arterial widening project. The
completed arterial is likely to have a significant amount of excess capacity for some period of time. If
the entire system has just enough capacity to accommodate all of the vehicle-miles of travel, then the
excess capacity on this segment must be balanced by another segment being over-capacity. Clearly,
road systems in the real world need more total aggregate capacity than the total aggregate demand,
because the traffic does not always precisely match the available capacity. Consequently, the standard
consumption-based model generally underestimates the full cost of accommodating new development
at the existing level of service.
In most rapidly growing communities, some roads will be experiencing an unacceptable level of
congestion at any given point in time. One of the principles of impact fees is that new development
should not be charged for a higher level of service than is provided to existing development. In the
context of road impact fees, this has sometimes been interpreted to mean that impact fees should not
be spent on roads that are already over-capacity. However, it is not necessary to address existing
deficiencies in a consumption-based system, which, unlike an improvements-driven system, is not
designed to recover the full costs to maintain the desired LOS on all road segments. Instead, it is only
designed to maintain a minimum one-to-one overall ratio between system demand and system
capacity. Virtually all major road systems have more capacity (VMC) than demand (VMT) on a
system-wide basis. Consequently, under a consumption-based system, the level of service standard is
really a system-wide VMC/VMT ratio of one.
The existing system-wide VMC/VMT ratio is considerably higher than one, as shown in Table 10.
Because the City’s major road system currently operates at better than a one-to-one ratio, there are no
existing deficiencies on a system-wide basis.
Table 10. Existing Road Level of Service
Arterials Collectors Total
Daily Vehicle-Miles of Capacity (VMC) 1,904,404 710,429 2,614,833
÷ Daily Vehicle-Miles of Travel (VMT) 1,087,610 192,241 1,279,851
System-Wide Capacity/Demand Ratio 1.75 3.70 2.04
Source: Table 59 in Appendix A.
The road impact fee formula is presented in Figure 3.
City of Santa Fe, NM
Impact Fee Capital Improvements Plan 16 December 9, 2020Roads
Figure 3. Road Impact Fee Formula
FEE = VMT X NET COST/VMT
Where:
VMT = TRIPS x % NEW x LENGTH x ADJUST
TRIPS = 1/2 average daily trip ends during weekday
% NEW = Percent of trips that are primary trips
LENGTH = Average length of a trip
ADJUST = Local travel demand adjustment factor
NET COST/VMT = COST/VMT - CREDIT/VMT
COST/VMT = COST/VMC X VMC/VMT
COST/VMC = Average cost per new VMC
VMC/VMT = Ratio of vehicle-miles of capacity to vehicle-miles of travel
CREDIT/VMT = Credit per VMT based on revenues generated
The traffic signal portion of the road impact fee is based on the ratio of existing traffic demand to
existing signals. The current traffic signal level of service is shown in Table 11.
Table 11. Traffic Signal Level of Service
Existing Vehicle-Miles of Travel (VMT) 1,087,610
÷ Existing Traffic Signals 123
Existing VMT per Signal 8,842
Source: Existing VMT from Table 10; existing signals from
City of Santa Fe Long Range Planning Division, July 27,
2020.
Travel Demand
The travel demand generated by specific land use types is a product of three factors: 1) trip generation,
2) percent new trips and 3) trip length. The first two factors are well documented in the professional
literature, and the average trip generation characteristics identified in studies of communities around
the nation should be reasonably representative of trip generation characteristics in Santa Fe. In
contrast, trip lengths are much more likely to vary between communities, depending on the geographic
size and shape of the community and its major street system.
Trip Generation
Trip generation rates are based on information published in the most recent edition of the Institute
of Transportation Engineers’ (ITE) Trip Generation Manual. Trip generation rates represent trip ends,
or driveway crossings at the site of a land use. Thus, a single one-way trip from home to work counts
as one trip end for the residence and one trip end for the workplace, for a total of two trip ends. To
avoid over-counting, all trip rates have been divided by two. This places the burden of travel equally
between the origin and destination of the trip and eliminates double-charging for any particular trip.
City of Santa Fe, NM
Impact Fee Capital Improvements Plan 17 December 9, 2020You can also read