District health boards' response to asset management requirements since 2009 - Office of the ...
←
→
Page content transcription
If your browser does not render page correctly, please read the page content below
B.29 [16k]

District health
boards’ response
to asset
management
requirements
since 2009
B.29[16k]

District health
boards’ response to
asset management
requirements since
2009

Presented to the House of
Representatives under section 20 of
the Public Audit Act 2001.

June 2016                             ISBN 978-0-478-44240-3
Octobe2015   Contents

    Auditor-General’s overview                                                                               3
    Our recommendations                                                                                      6
    Part 1 – Introduction                                                                                   7
     Purpose and objective of this report                                                                    7
     District health board asset management roles and responsibilities                                       7
     The context for our report                                                                              8
     How we did our work                                                                                    12
     Our expectations of DHB asset management                                                               13
     Structure of this report                                                                               15

    Part 2 – Our previous work on asset management in the health sector                                     16
     From 2009 to 2011: Putting service levels at the centre of asset management planning requirements      16
     In 2012 and 2013: District health board asset management from a health and public sector perspective   18
     From 2012 to 2015: Asset management from the perspective of financial statement information            20

    Part 3 – Managing buildings and clinical equipment to maintain health services                          23
     What do we know about the condition and remaining useful lives of existing buildings and clinical
     equipment?                                                                                             24
     How is asset performance measured?                                                                     28
     How is asset management information captured and integrated with financial information?                31
     Who gets information about the condition and performance of assets?                                    33
     How do district health boards assess their own current asset management practice?                      34

    Part 4 – Asset investment decision-making                                                               41
     How do funding arrangements for DHBs deal with capital investment decisions?                           41
     Managing capital expenditure                                                                           46

    Figures
      1 – Population of regional council areas in 2013 and projected population in 2043                     10
      2 – Census percentage change in age groups by district health board, 2006-2013                        11
      3 – Major influences on the health systems and what needs to happen for asset management to
         support the Health Strategy Update                                                                 14
      4 – Health asset classes by value, 2008-2018                                                          25
      5 – Through-life of buildings and clinical equipment, by district health board                        26
      6 – Asset performance dimensions that district health boards most commonly measure                    29
      7 – Case study 1: The Productive Operating Theatre                                                    31
      8 – Information Systems Maturity Index                                                                32
      9 – District health board self-assessments of asset management maturity for current practices and
          the target maturity state                                                                         35
     10 – Characteristics of intermediate and advanced asset management for the aspects of weakest
           current practice and largest gap to target maturity for district health boards                   36
     11 – Case study 2: Auckland District Health Board’s asset management practices                         38
     12 – Capital expenditure by district health board, 2008/09 to 2014/15                                  42
     13 – 10-year forecast capital expenditure, by district health board                                    43
     14 – Capital expenditure measures by district health board, 2008/09 to 2014/15                         47
     15 – Average capital expenditure to depreciation for district health boards compared with local
          authorities and tertiary education institutions, 2008/09 to 2014/15                               48
     16 – Average actual to budgeted capital expenditure for district health boards compared with local
          authorities and tertiary education institutions, 2008/09 to 2014/15                               50
     17 – Average net operating cash flow to capital expenditure for district health boards compared to
          local authorities and tertiary education institutions, 2008/09 to 2014/15                         52

2
Auditor-General’s overview
All of us will have contact with the services of a district health board (DHB) at
some time in our lives, many of us at numerous times throughout our lives. We
depend on health services and expect them to be available to us when and where
we need them.
Physical assets (such as hospital buildings and clinical equipment) are integral to
the health services DHBs deliver. Sound management of DHBs’ physical assets is
critical to New Zealand’s future, as well as to each of us individually. In 2015, DHBs
had $5.7 billion invested in physical assets and were planning more than $6 billion
of capital expenditure during the next 10 years.
We first reported on DHB asset management in 2009/10. DHBs produced
asset management plans in 2009 in response to the Ministry of Health’s
requirements for DHBs to document their approach to asset management in
asset management plans. In Managing public assets (2013), we looked at asset
management practices in 340 public entities. Health assets had some of the
lowest condition ratings of all public sector assets. Therefore, we decided that it
was important to keep a focus on DHBs’ asset management.
Throughout the focus we have had on DHB asset management, we have expected
each DHB to:
• know how well its mix of assets meets its service delivery needs now, and in
the future;
• understand, respond to, and manage demand for its assets and the related
risks;
• ensure that there are good links between its asset management planning and
its other service and financial planning, with clear responsibility for planning
and for having an up-to-date documented plan; and
• have information about its assets and their condition that is reliable enough to
support its planning for long-term service delivery.
Because DHBs are part of our national health system, we have also expected to
see the same knowledge, linking, and understanding at levels appropriate for
effective regional and national planning.
Societal and technological changes continue to be major influences on the health
system. These influences are a significant challenge in managing pressure on
health services and budgets. We have illustrated in this report what we think
needs to happen for asset management to put delivery of service to people today
and in the future at the core.
3Auditor-General’s overview
The results of our work for this report show that:
• About two-thirds of DHBs are unlikely to have substantively updated their
asset management plans since 2009.
• DHBs tend not to specify the levels of service they expect from their assets. As
a result, reporting on asset performance is generally weak.
• Many DHBs have asset management information systems with advanced
functionality but often do not use the full range of that functionality.
• DHBs generally do not systematically collect, maintain, analyse, and use asset
information – such as about age, condition, and performance – particularly for
clinical equipment.
• More than half of the DHBs do not regularly reconcile the information held in
their asset management and financial information systems.
• There is limited reporting to governors and senior managers about asset
performance and condition.
We looked at measures of capital expenditure management drawn from DHBs’
financial statements from 2008/09 to 2014/15. It is important to note that the
quality of the underlying asset management information can have a significant
effect on these financial measures.
For all the seven years we reviewed, fewer than half of the DHBs had indicators
at levels that I would characterise as representing good financial and asset
management. For instance:
• There has been sizeable over-budgeting or underspending of capital,
suggesting that DHBs might not be investing the capital needed to continue to
deliver their services in the future.
• Almost half of DHBs’ capital expenditure is funded externally rather than from
operating cash flows, indicating that DHBs rely heavily on funding from the
Crown to renew or replace assets.
• It appears that some DHBs are renewing or replacing assets over time but that
others are not.
These results lead me to question how well positioned DHBs are to support future
service delivery.
Our audit work since 2009 shows a sector strongly focused on delivering
short-term results within a challenging operating environment and financial
constraints. But I am concerned that DHB asset management does not seem to
have gained much traction in this time.
4Auditor-General’s overview
The public health system faces serious challenges from a rising demand
for services and for access to better technologies, exacerbated by an ageing
population. To deal with these challenges, the health sector and each DHB will
need to take a longer-term perspective on health services and the associated
capital investment and asset management.
I expect each DHB to give more attention in the future to its management of
the assets we all depend on for health services. I have been reassured by the
number of DHBs that, in commenting on the draft of this report, told me of their
commitment to good asset management and what they are doing to improve it.
My auditors will continue to monitor DHBs’ asset management.
I would like to see more effort made to identify, share, and implement lessons
from the leaders of DHB asset management. DHB asset management
practitioners told me that the Health Asset Management Improvement Group,
formed in 2015, aims to do this.
I also expect the Ministry of Health and the Treasury to provide support to help
DHBs to improve their asset management practices. I have been assured that
this will done by implementing the 2015 Cabinet Office Circular on Investment
Management and Asset Performance in the State Services. My Office will keep an
active interest in that implementation.
Lyn Provost
Controller and Auditor-General
3 June 2016
5Our recommendations
We recommend that each DHB:
• understand, respond to, and manage demand for its assets and the related
risks (Recommendation 1);
• know how well its mix of assets meets its service delivery needs, now and in
the future (Recommendation 2);
• has reliable information about its assets and their condition that supports its
planning for long-term service delivery (Recommendation 3); and
• link its asset management planning to its other service and financial planning.
(Recommendation 5).
We recommend that the Ministry of Health and the Treasury:
• provide support to help DHBs to improve their asset management practices,
including making more effort to identify, share, and implement the lessons
from the leaders of DHB asset management (Recommendation 4); and
• review the interaction of service, funding, and asset planning, with the aim of
providing incentives for DHBs to balance short-term results with longer-term
service and asset management needs (Recommendation 6).
6Introduction 1
Purpose and objective of this report
1.1 The Ministry of Health (the Ministry) required district health boards (DHBs) to
prepare asset management plans in 2009. At that time, our auditors looked at
how DHBs responded to the requirements. Since then, we have reported concerns
about whether DHBs have the asset management information they need to
support the delivery of health services that depend on assets.
1.2 In this report, we describe the results of the work we have carried out in response
to our concerns. We looked at the 20 DHBs collectively to provide an overview
of the state of DHB assets and the approach that DHBs are taking to managing
them.
1.3 We took this approach because DHBs are the providers and purchasers for most
public health services, which must operate as a national network of health
services. However, because the circumstances and practices of DHBs vary, not
every finding or comment we make applies to every DHB.
District health board asset management roles and
responsibilities
1.4 DHBs have primary responsibility for making decisions about capital investment
and asset management.
1.5 DHBs are grouped into four regions – Northern, Midland, Central, and the South
Island. The DHBs in each region have established regional capital committees to
guide regional capital investment.
1.6 Nationally, until March 2016, the National Health Board, supported by the
Ministry, was responsible for matters such as funding and monitoring DHBs,
overseeing their planning, and providing guidance on which services should be
planned, funded, and provided nationally, regionally, and within each district.1
1.7 A specialist Capital Investment Committee is responsible for a centrally led
process for the national prioritisation and allocation of capital investment in the
health sector in future years.
1.8 The Treasury and the Ministry require DHBs to prepare 10-year capital intentions
for projects worth $10 million and or more ($500,000 for projects related to
information and communication technology (IT)). Preparing these intentions
includes obtaining endorsement from regional capital committees and the Capital
Investment Committee, and approval from the DHB’s Board and the Ministers of
Health and Finance for capital expenditure proposals.
1 On 18 March 2016, Health Minister Hon Dr Jonathan Coleman announced that the National Health Board and
National Health Committee would be disestablished and their functions streamlined into the Ministry of Health.
See https://www.beehive.govt.nz/release/changes-health-advisory-committees. 7Part 1
Introduction
1.9 DHBs are also required to comply with the Treasury’s Better Business Cases
process and the Capital Investment Committee’s Capital Assessment Guidelines for:
• all capital investments in fixed assets that require Crown equity or new debt
support;
• investment projects or programmes totalling $10 million or 20% of total assets,
whichever is lesser; and
• investments that could strategically affect the performance of DHBs or
investments that the State Services Commission has identified are of high risk.2
The context for our report
How societal and technological changes affect asset management
in the health sector
1.10 During the period we were writing this report, the Ministry was leading an update
of the Minister of Health’s health strategy. The Ministry published a consultation
draft – Update of the New Zealand Health Strategy: All New Zealanders live well,
stay well, get well: Consultation draft (the Health Strategy Update) – and our
references in this report are to the consultation draft. The updated strategy was
published in April 2016.
1.11 The Health Strategy Update says that global challenges are shaping, and will
continue to shape, New Zealanders’ experience of health services.3 The Health
Strategy Update identifies the following challenges:
• providing health and social services to increasing numbers of older people who
are living longer;
• a growing burden of long-term health conditions, such as heart disease,
diabetes, depression, and dementia;
• how to afford new technologies and drugs, and meet rising expectations;
• a highly mobile global workforce;
• the emergence of new infections and antibiotic resistance; and
• the health and social consequences of climate change.
1.12 Good information for decision-making is becoming increasingly important for the
health system, which faces rapid technological development alongside increased
and changing demands from New Zealand’s ageing and urbanising population.
1.13 DHBs have significant physical assets, mainly buildings and clinical equipment.
These are significant because they are needed to provide critical health services
2 See Ministry of Health (2105), Operational Policy Framework 16/17, section 12.30.
3 Ministry of Health (2015), Update of the New Zealand Health Strategy: All New Zealanders live well, stay well, get
8 well: Consultation draft, page 5.Part 1
Introduction
and because of their high monetary value. DHBs’ physical assets were valued at
$5.7 billion as at 30 June 2015.
How technology is changing health service delivery and asset needs
1.14 As part of preparing the Health Strategy Update, the Ministry commissioned an
independent review of capability and capacity within the health system. This
review emphasised the effect of digital technology on New Zealand consumers
and the health system:
By 2025 the majority of the world’s population will in one generation have
gone from having virtually no access to unfiltered information to accessing
most of the world’s information through a device that fits in the palm of their
hand. Further, all 13-year olds and younger are mostly digital natives and do
not know a world without the Internet and its connected devices. This change
will have profound and likely positive effects on the New Zealand health system,
the roles of providers (both organisations and individual providers), and on the
knowledge and demands of our consumers. Digital technology will change
health institutions of all sizes and in all sectors from within and without. The
most significant impact of the spread of communication technologies will be the
way they help re-allocate the concentration of power away from the traditional
power brokers in the system (i.e. DHBs, provider groups, individual providers), to
consumers.
1.15 One theme (Smart system) of five strategic themes in the Health Strategy Update
consultation draft was about:
• information being reliable, accurate, and available at the point of care;
• individual online health records that people are able to access and contribute
to;
• data and smart information systems that improve evidence-based decisions,
management reporting, and clinical audit;
• standardised technology that allows us to easily make efficient changes; and
• being able to take advantage of opportunities of new and emerging
technologies.4
1.16 The Deloitte Centre for Health Solutions sees technology as a means of
integrating hospital and community care, with hospital doctors and nurses
running clinics and delivering care in the community and primary care staff
providing services to community and specialist hospitals.
1.17 How health services are delivered affects the assets needed for these services.
Overall, technology is expected to make contact between doctors and patients
4 Ministry of Health (2015), Update of the New Zealand Health Strategy: All New Zealanders live well, stay well, get
well: Consultation draft, page 24. 9Part 1
Introduction
more virtual. It will also make more specialist complex and acute care possible,
which will require more sophisticated equipment and facilities.
How social change is affecting health service delivery and asset needs
1.18 Figure 1 shows the 2013 Census results for the 16 regional council areas of
New Zealand. All regions will have more people in 2043 than in 2013 to varying
degrees.
Figure 1
Population of regional council areas in 2013 and projected population in 2043
Northland
Auckland
Waikato
Bay of Plenty
Gisborne
Hawke’s Bay
Taranaki
Manawatu-Whanganui
Wellington
Tasman
Nelson
Marlborough
West Coast
Canterbury
Otago
Southland
0.0 0.5 1.0 1.5 2.0 2.5
Million
2013 2043
Source: Statistics New Zealand
1.19 The Thirty Year New Zealand Infrastructure Plan 20155 forecasts that, between
2013 and 2043, the West Coast, Southland, Gisborne, and Manawatu-Wanganui
regions will have the lowest rate of population growth at 1%. In contrast,
Auckland’s population is expected to grow by 33% during this period.
10 5 Issued by the National Infrastructure Unit of the Treasury.Part 1
Introduction
1.20 Generally, the number and percentage of people at older ages is expected to
increase throughout the country. Even for areas with growing populations, the
growth rate will slow during the projection period, as the population ages and
deaths increase relative to births. However, Statistics New Zealand says that
there will be considerable variation between areas, largely because of each area’s
current population age structure and different fertility and migration patterns.6
1.21 Because different age groups have different needs from public health services,
future scenarios of population change matter for each DHB and for DHB services
regionally and nationally. It is interesting to compare the overall percentage
change with the percentage change by age group between the 2006 Census and
the 2013 Census in each DHB district.
1.22 Figure 2 shows that populations in every DHB are getting older (the green blocks
above the red line). Populations are also “hollowing out” in terms of younger people
(the blue blocks below the red line), particularly people aged 30-44. The movements
for each age group are stacked in a single bar for each DHB and do not indicate
the total overall population change.
Figure 2
Census percentage change in age groups by district health board, 2006-2013
80
60
40
20
% change
0
-20
-40
-60
d
ta
d
au
to
es
ty
iti
aki
y
i
l
tt
ast
a
gh
ast
ry
ry
ern
nu
tra
Ba
rap
lan
an
Hu
rbu
rbu
len
wh
ma
ika
Lak
uk
rou
ran
Co
Co
ga
uth
en
ckl
e’s
rth
ira
an
Wa
fP
ira
ite
nte
nte
an
dc
bo
nd
st
Ta
Au
wk
So
Wa
No
s-M
yo
Ta
Wa
We
Wh
Mi
arl
Ca
Ca
al a
Ha
Ba
nM
tie
uth
pit
un
Ca
lso
So
Co
Ne
0–14 years 15–29 years 30–44 years
45–59 years 60–74 years 75 years and over
Source: Statistics New Zealand, 2013 Census district health board tables
6 Statistics New Zealand (2015), Subnational Population Projections 2013 (base) 2043. 11Part 1
Introduction
1.23 The total populations in each region grew where the black dot is above the red
(zero) line and reduced where the dot is below the red line. The coloured bars in
Figure 2 show the percentage change in age composition for each DHB. Between
2006 and 2013, the change in population groups was largest for those aged 60
and over. The population growth in other age groups has fallen in all DHBs for
those aged 30-44, and in many DHBs for those aged 0-14.
1.24 DHBs need to use sound asset management principles when planning their
operating and capital expenditure on health services. Effective asset management
begins with a good understanding of the DHB’s population, current asset base,
and future service needs – and a sound asset management plan that supports
future service delivery.
How we did our work
1.25 To inform our work, we analysed all DHBs’ reported financial results and forecasts
that were relevant to how they manage their assets.
1.26 As part of our 2013/14 annual audits, we collected and analysed specific
information about how DHBs manage two classes of assets: their buildings and
clinical equipment.
1.27 Our auditors applied a set of standard asset management questions to record
information about the condition, performance information, financial forecasts,
valuations, and management information systems for these classes of assets.
1.28 DHBs have other asset classes as well as buildings and clinical equipment, such
as IT assets. We chose to focus on the buildings and clinical equipment used
to deliver services in hospitals operated by DHBs. As a whole, these assets are
intended to provide an ongoing service, even if individual assets or components
within them are replaced or upgraded.
1.29 These assets make up a large proportion of each DHB’s balance sheet. Property,
plant, and equipment, which includes buildings and clinical equipment, makes
up 78% of DHBs’ total assets. Buildings are mainly the various hospitals each
DHB provides services from. Clinical equipment is used for diagnosis or to provide
medical procedures to treat disease or for rehabilitation. Clinical equipment does
not include implantable, disposable, or single-use medical devices.
12Part 1
Introduction
1.30 We analysed information from recent initiatives to improve asset management
that the Ministry and the Treasury provided to us. This information included the
results of:
• asset management maturity self-assessments completed in 2014 by all DHBs
using a Treasury Asset Management Maturity Assessment Tool; and
• expert review of nine of the asset management maturity self-assessments that
the Ministry and the Treasury commissioned from Architecture, Engineering,
Construction, Operations, and Management (AECOM), a large international
company that specialises in asset management.
1.31 We held a workshop on the findings underpinning this report in September
2015. DHB asset and financial management practitioners and advisers, and
representatives from the Treasury and the Ministry, attended this workshop.
Our expectations of DHB asset management
1.32 An integrated approach to service levels, assets, and financing within and
between DHBs is becoming increasingly important.
1.33 To plan and manage their investments in their health assets, DHBs need to
anticipate wider societal and technological changes. Investments also need to
support the delivery of health services as they adapt to these changes. This is
putting pressure on the health budgets of governments around the world.
1.34 We expected each DHB to:
• knows how well its mix of assets meets its service delivery needs, now and in
the future;
• understands, responds to, and manages demand for its assets and the risks
related to them;
• has reliable information about its assets and their condition that supports its
planning, for long-term service delivery; and
• links its asset management planning to its other service and financial planning.
1.35 Because DHBs are part of our national health system, we also expected to see the
same knowledge, linking, and understanding at levels appropriate for regional and
national planning.
1.36 Figure 3 shows the major influences on the health system and where asset
management needs to manage and support effectively the intentions of the
Health Strategy Update.
13Part 1
Introduction
Figure 3
Major influences on the health systems and what needs to happen for asset
management to support the Health Strategy Update
Societal trends Technology trends Current state of Managing
buildings and investment
clinical equipment priorities
Ageing population More use of IT Older clinical National, regional,
applications equipment and local forecast
Growing and
and investment
declining More sophisticated Risk of asset
priorities
communities equipment obsolescence
High investment in
Increased Robotics Uncertainty about
assets
expectations condition and
Specialist complex
performance
Service delivery and acute care
through health
Devolving of more
NGOs
routine tasks
Asset
management
improvement
areas
Clarify national, regional, and district priorities for the short to long term.
Explore and cost service-level options.
Establish processes for determining service levels and information needs.
Regularly monitor asset performance, including asset condition and assessments.
Report the condition and performance of assets at appropriate levels.
Synchronise financial and asset management information systems.
Develop investment forecasts alongside funding implications.
Increase focus on preventative maintenance and retire underperforming assets.
Optimal asset
management
to put service
at the core
Identify and assess the extent of any deferred maintenance and renewals, and implement
realistic plans to address these.
Record reliable long-term information on asset values and remaining useful lives.
Combine asset maintenance, condition, and age information to optimise replacement
decisions.
Carry out optimal maintenance that maximises preventative rather than reactive
maintenance.
Whole-of-life-based asset costing to achieve lowest life-cycle costs while meeting service
levels.
14Part 1
Introduction
Structure of this report
1.37 The rest of this report has the following structure:
• Part 2 sets out the work we have done on DHB asset management since 2009
and the results of this work.
• Part 3 sets out the results of our analysis of the specific information we
collected about building and clinical equipment, and of the other information
we looked at about how DHBs manage their assets.
• Part 4 sets out our analysis of financial statements in DHBs’ annual reports
and what these statements tell us about how DHBs manage their capital
expenditure.
152
Our previous work on
asset management in
the health sector
2.1 In this Part, we set out the work we have reported to Parliament on DHB asset
management since 2009.
2.2 This information in this Part is primarily drawn from the following reports of the
Auditor-General to Parliament:
• Health sector: Results of the 2012/13 audits, May 2014;
• Regional services planning in the health sector, November 2013;
• Managing public assets, June 2013;
• Health sector: Results of the 2011/12 audits, April 2013;
• Health sector: Results of the 2010/11 audits, March 2012; and
• Central government: Results of the 2009/10 audits (Volume 2), March 2011.
2.3 As a result of our ongoing work in the sector, we remain concerned about
whether:
• appropriate levels of service drive asset management planning;
• asset management planning is integrated with financial and service forecasts
and intentions to meet the needs of each DHB’s population; and
• asset management information is maintained and updated to reflect the
current asset base (asset type, age, size, location, performance, monitoring
and condition, maintenance history, and cost) and to improve the asset
management life-cycle approaches when making decisions about asset
management.7
From 2009 to 2011: Putting service levels at the centre of
asset management planning requirements
2.4 In 2009, the Ministry required DHBs to formally document their approach to asset
management in an asset management plan. In response to that requirement, all
DHBs produced an asset management plan in 2009. At the same time, regional
asset management plans were also produced.
2.5 As part of our 2008/09 and 2009/10 annual audits of DHBs, we looked at each
DHB’s asset management plan. Most plans met or largely met the Ministry’s
requirements.
7 The International Infrastructure Management Manual (2011 edition) defines life-cycle as “the time interval
that commences with the identification of the need for an asset and terminates with the decommissioning
of the asset or any liabilities thereafter”. It defines life-cycle asset management as encompassing “all asset
management strategies and practices associated with an asset or group of assets that result in the lowest life
16 cycle cost”.Part 2
Our previous work on asset management in the health sector
2.6 However, we had concerns about whether plans were up to date and connected
to the service and financial intentions of DHBs. Our auditors’ recommendations to
DHBs on their asset management planning included:
• ensuring that appropriate levels of service drive asset management planning;
• ensuring that asset management plans contain financial forecasts;
• updating asset management plans to reflect the current asset base and
planned hospital redevelopments;
• reviewing asset information for asset type, age, size, location, performance,
monitoring and condition, maintenance history, and cost; and
• improving the asset management life-cycle approaches when making
decisions about asset management.
2.7 After our 2010/11 audits, we looked for evidence that DHBs had changed their
practices in response to our auditors’ recommendations. There were discernible
improvements in some DHBs (Auckland, MidCentral, Capital and Coast, and Hutt
Valley DHBs). However, most DHBs had not improved how they plan to manage
their assets.
2.8 Few DHBs documented their policy on the level of sophistication they seek for
their asset management practices, in proportion to the scale and risk of their
assets, to support their services effectively.
2.9 Links between asset management planning and DHBs’ other service and financial
planning were variable. Many still relied on planning from 2009, and the links
between the assets, models of care, demand for health services, and outcomes
sought were typically either not documented or out of date.
2.10 Most asset management plans provided a summary of assets owned. This
typically focused on the age and a description of assets, without information
about their condition and performance. The approach to managing risk or dealing
with disaster was not clear.
2.11 We concluded that two factors typically hampered asset management planning:
• DHBs held information on different assets in separate systems – for example,
buildings information held separately from clinical equipment and vehicle
information – making it difficult to consider asset management planning as a
whole.
• Most DHBs’ data contained information about equipment that had been fully
depreciated and was beyond the end of its (theoretical) useful life but that
remained in use, which suggested that DHBs did not have a good knowledge of
the condition of their assets.
17Part 2
Our previous work on asset management in the health sector
2.12 Overall, the plans did not put intended service levels at the heart of asset
management planning. They focused on capital planning rather than considering
all the types of expenditure needed on the assets. Also, some plans did not set out
a sustainable approach to funding the work the assets needed.
2.13 We recommended that links between asset management plans and other
planning needed to be strengthened – in particular, planning cycles needed to be
better aligned.
2.14 We considered that there was scope for the Ministry to:
• encourage and support DHBs to see asset management planning as a core part
of their service and financial planning, and to produce regional “joined-up”
asset management plans; and
• ensure that business cases for capital investment are fully integrated with
service planning for the individual DHB, between DHBs, throughout a region,
and nationally.
2.15 Amendments to the New Zealand Public Health and Disability Act 2000 in
2010 and 2011, and new regulations under the Act, brought new DHB planning
requirements into force from 1 June 2011. The amendments and regulations:
• created a National Health Board, supported by specialist advisory committees,
to deal with matters such as workforce, information services, and capital
investment;
• required DHBs to plan sub-regionally or regionally;
• required DHBs to put in place the governance and support arrangements to
deliver those plans; and
• gave the Minister of Health the power to direct DHBs on matters to do with
delivering regional services.
In 2012 and 2013: District health board asset
management from a health and public sector perspective
2.16 In 2012, the Capital Investment Committee asked each region to agree a list of
intended capital spending for the next 10 years, based on a notional budget for
each region. The Capital Investment Committee is a specialist committee that
advises the Minister of Health on capital funding for all projects that cost more
than $10 million, regardless of the source of funding Health. Slow progress on a
National Asset Management Plan and gaps in the base information from DHBs
and private health-care providers made it difficult for the Capital Investment
Committee to prioritise spending.
18Part 2
Our previous work on asset management in the health sector
2.17 A National Asset Management Plan has been in draft form since 2012. The
Ministry told us that an annual update was now part of its work plan, but the
Capital Investment Committee reported difficulty with agreeing a long-term
capital plan. The Capital Investment Committee’s difficulties included setting
priorities for investment without a long-term service plan for health.
2.18 In June 2013, we published Managing public assets, which reported information
about the asset management practices of 340 public entities (those owning
assets worth more than $2 million). This included all DHBs. We gathered
information about how regularly the public entities reported information
about the condition of their assets to decision-makers, the extent of deferred
maintenance or deferred renewals,8 and whether the entities had asset
management plans.
2.19 Ninety percent of DHBs checked the condition of their buildings regularly and had
documented information on their significant assets and on the maintenance and/
or renewal profiles for their buildings. However, health assets had some of the
lowest condition ratings in the public sector, and only 80% of DHBs were actually
carrying out their planned maintenance and renewal of buildings.
2.20 We published Regional services planning in the health sector in November 2013.
In that report, we said that there are big demands on capital for major repairs
to buildings that are beyond their useful life, to upgrade them to meet seismic
standards and support modern standards of care.
2.21 We reported that capital investment in buildings based on regional services
planning was at an early stage. Capital expenditure planning often took place
before service planning. We saw and were told of tensions between getting on
with these repairs and waiting to decide the best use of assets arising from new
ways of working (based on clinical pathways and new models of care).
2.22 The regional capital committees were beginning to understand the full range of
assets held throughout their regions. However, the links to capital planning were
not clear, and the committees were not yet influencing or setting priorities for
major investment in buildings based on regional services planning. Occasionally,
the regions agreed collective priorities, but, in our view, the regional lists looked
more like a summation of the separate DHB plans.
2.23 We concluded that, overall, meeting the needs of all agencies involved in
preparing and approving business cases is difficult and that the needs of decision-
makers are not always well met. Too few people have the skills for preparing
robust business cases, and the unpredictable availability of capital funding makes
it difficult to set up core capacity. This means that decision-makers rely heavily on
consultants, advisors, and experts.
8 Renewals is the replacement or refurbishment of existing assets. 19Part 2
Our previous work on asset management in the health sector
2.24 National capital funding cuts across regions, complicating the process of making
regional decisions. There were concerns that DHBs could not afford their share of
the capital needed for all these projects and initiatives, and that regional plans did
not always reflect the effects of the national initiatives.
From 2012 to 2015: Asset management from the
perspective of financial statement information
2.25 As part of our annual audits for 2011/12, we followed up on our
recommendations (see paragraph 2.6) to individual DHBs. We reported that nine
DHBs still needed to update their asset management plans. We recommended
that three other DHBs improve their asset management plans.
2.26 We also looked at DHB asset management through the lens of financial
statement results. We reported the total deficit, for all DHBs, from 2006/07 to
2011/12, including a breakdown by the four regions. The Central and South Island
Regions had increasing deficit levels.
2.27 During this period, the Canterbury earthquakes affected Canterbury DHB,
damaging facilities and disrupting services, displacing sections of the population,
and affecting residents’ health needs. Canterbury DHB recognised in its financial
statements impairments of its buildings and equipment of $33.8 million in
2010/11 and $14.3 million in 2011/12. The DHB also identified $28.9 million of
specific additional costs as a result of the earthquakes.
2.28 Other DHB buildings were recorded as impaired or potentially impaired after
DHBs considered their compliance with building codes and the seismic strength
of their buildings. Examples included:
• Hutt Valley DHB – a potential impairment of $21 million, with uncertainties
about the carrying value of certain buildings because of seismic-strengthening
issues;
• Nelson Marlborough DHB – $6.4 million impairment, mainly because of low
seismic-strength assessment; and
• West Coast DHB – impairment of $2.6 million for buildings that are
earthquake-prone.
2.29 We noted trends of increasing total assets, liabilities, and debt accompanied by
consistently negative levels of retained earnings. As a result, we concluded that
some indications of risk might warrant further consideration. These indications
included:
• the negative levels of retained earnings as a result of deficits incurred in
previous years;
20Part 2
Our previous work on asset management in the health sector
• some DHBs’ (apparently) limited financial ability to respond to unexpected
events in the medium term by using their own financial resources – for
example, on average, current assets cover only 59% of current liabilities;
• the consistent underspending against budget for capital expenditure; and
• the reasonably high variability of results throughout the health sector,
suggesting inconsistency in the financial ability of some DHBs to manage
potential short-, medium-, and longer-term financial risks.
2.30 With increasing and repeated evidence of a range of issues in asset management
in the health sector since 2009, we repeated our financial analysis in our reporting
on the results of our 2012/13 audits.9 We have updated this analysis for this
report so that it covers the seven-year period from 2008/09 to 2014/15.
2.31 For all the seven years we reviewed, fewer than half of the DHBs had indicators
at levels that would represent good financial and asset management. There are
sizeable over-budgeting or underspending of capital, low levels of working capital,
and moderate to high liabilities compared to assets.
2.32 Depreciation is an accounting estimate of the consumption of, or the cost of
using up, an asset. We looked at whether DHBs were likely to be underinvesting
in their assets by comparing capital expenditure to depreciation. Because there
had been significant capital investment in recent years, with several hospital
redevelopments, we expected a result of more than 100% (of capital expenditure
over depreciation). Capital expenditure includes not only replacing existing assets
but also spending on new assets, and the health sector has high capital needs.
2.33 The comparison resulted in an average of 100% to 150%, indicating a low to
moderate risk of underinvestment in DHBs’ capital assets. However, without good
information about the split between capital expenditure on renewals and on new
capital assets, the extent of underinvestment in replacement capital expenditure
is clouded.
2.34 Our auditors also reported that many DHBs still did not have up-to-date asset
management plans and that more than half of the DHBs needed to update or
improve their asset management practices. Some were delaying carrying out this
work until regional asset management plans and a national asset management
plan had been developed.
2.35 In reporting our 2012/13 audits, we said that DHBs were working to improve their
financial performance and to “live within their means” by focusing on delivering
short-term results, particularly in planning and budgeting for operational
activities. However, we warned that many of the longer-term results also
suggested that the adequacy and alignment of financial resources might limit the
9 Controller and Auditor-General (2014), Health sector: Results of the 2012/13 audits, Part 4. 21Part 2
Our previous work on asset management in the health sector
ability of DHBs to respond to unexpected events or exploit future opportunities
without recourse to the Crown.
2.36 The sector trends we noted in 2010/11 of increasing total assets, liabilities, and
debt have continued during the time that DHBs have been required to have asset
management plans. There have also been consistently negative levels of retained
earnings, suggesting there is little money available from operating surpluses to
reinvest in DHB assets.
223
Managing buildings and clinical
equipment to maintain health
services
3.1 In this Part, we set out the results of our analysis of the specific information about
building and clinical equipment asset management we collected as part of our
2013/14 audits of DHBs. For each of these two classes of assets as a whole, we
discuss:
• their age and condition;
• their levels of service for, and the performance;
• the management information systems used; and
• performance information reporting.
3.2 We also present the results of the self-assessments that all DHBs carried out
at the request of the Ministry and the Treasury in 2014 and of Architecture,
Engineering, Construction, Operations, and Management’s (AECOM’s) review of
nine of these self-assessments.
3.3 The results of our work on asset management practices showed that:
• Levels of service for assets tend not to be well defined, which means that
reporting of asset performance is generally weak.
• Many DHBs have asset management information systems with advanced
functionality but often do not use this functionality.
• DHBs generally do not systematically collect, maintain, analyse, and use asset
information – such as about age, condition, and performance, particularly for
clinical equipment.
• More than half of the DHBs do not regularly reconcile their asset management
and financial information.
• There is limited reporting to governors and senior managers about asset
performance and condition.
• Based on AECOM’s review, up to two-thirds of DHBs might not have
substantively updated their asset management plans since 2009, when asset
management requirements were introduced.
3.4 This raises questions about how well DHBs are positioned to support future
service delivery and financial decision-making.
3.5 Our results are reinforced by the DHBs’ self-assessments. These self-assessments
suggest that DHBs could improve many aspects of their asset management with
moderate effort. The weakest aspects of current practice, and the aspects with
the largest gaps between current practice and target maturity, are those assessing
how well asset management is integrated and embedded into the DHB’s overall
processes and practices.
23Part 3
Managing buildings and clinical equipment to maintain health services
What do we know about the condition and remaining
useful lives of existing buildings and clinical equipment?
3.6 Effective asset management means knowing the condition of assets, their likely
remaining useful lives, and the potential for critical assets to fail. Knowing and
planning for asset management needs can make a significant difference to the
financial operations and likely future costs of a DHB.
3.7 Most DHBs gather information about the condition of their assets, especially
critical assets. However, there are wide variations in how formally and regularly
they assess and report this information. Only 12 DHBs have formal approaches to
recording asset condition in an asset management information system (AMIS).
3.8 Asset revaluations are important for asset management because they necessarily
include reassessing the best estimate of an asset’s remaining useful life. Regularly
reassessing the remaining useful lives of assets helps to forecast and plan asset
replacements and renewals. Assessments of the remaining useful life of an
asset can change over time, and assets can be impaired (such as those of the
Canterbury DHB because of the Canterbury earthquakes) or become obsolete.
3.9 Even where information is available, DHBs do not always use it well – for example,
to update asset management forecasts and expectations. The practice of regularly
updating asset management plans did not seem to be well embedded in DHBs.
Many asset management plans have not been substantively reviewed since 2009.
3.10 Overall, DHBs appear to have better asset management information for buildings
than for clinical equipment. DHBs carry out regular revaluations (at least every
five years) to determine the fair value of their building assets. Thirteen DHBs have
buildings that are less than halfway through their useful lives.
3.11 Clinical equipment is valued on the basis of historical cost. DHB asset and
financial management practitioners told us that the useful lives of many clinical
equipment assets would not be reassessed from the initial expected life that was
assigned when the assets were acquired, even though actual lives might have
exceeded initial expected lives.
24Part 3
Managing buildings and clinical equipment to maintain health services
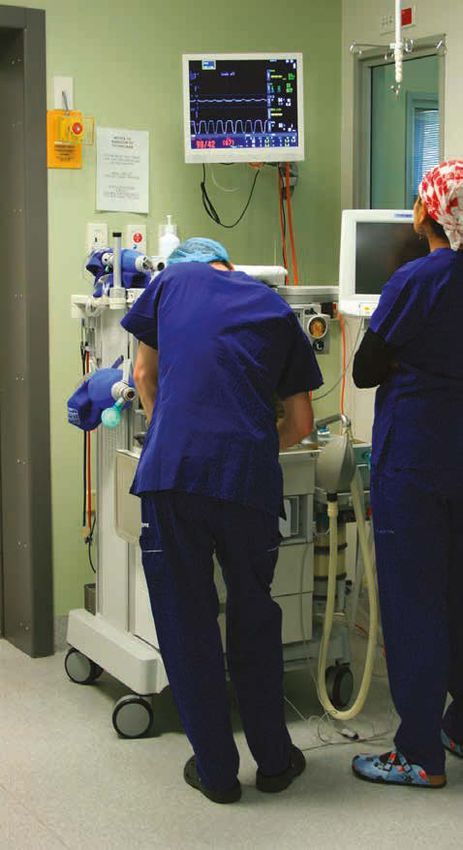
3.12 Figure 4 shows that buildings make up most of DHBs’ assets.
Figure 4
Health asset classes by value, 2008-2018
2018
2013
2008
0.0 1.0 2.0 3.0 4.0 5.0 6.0 7.0
$billion
Land Buildings Plant and equipment Intangible assets Other
Source: The Treasury, 2014 Investment Statement, page 59. The 2018 values are forecast.
3.13 Our auditors estimated that buildings that are currently valued at $24 million
have remained in use past the end of their theoretical useful lives. Figure 4 shows
that this represents a small proportion of the total value of DHBs’ building assets.
3.14 Clinical equipment is included in plant and equipment. Figure 4 shows that, in
2013, plant and equipment made up less than $500 million of DHBs’ total assets.
Our auditors estimated that more than $300 million of clinical equipment has
remained in use past the end of its theoretical useful life. Figure 5 shows the
through-life10 of buildings and clinical equipment by DHBs.
10 The through-life is the proportion of the expected total useful life of an asset that has already been consumed. 25Part 3
Managing buildings and clinical equipment to maintain health services
Figure 5
Through-life of buildings and clinical equipment, by district health board
District Health Board Through-life of buildings Through-life of clinical
(%) equipment (%)
Northern Region
Auckland 34 73
Counties Manukau 11 79
Northland 38 83
Waitemata 42 69
Midland Region
Bay of Plenty 41 64
Lakes 35 66
Tairāwhiti 40 53
Taranaki 68 76
Waikato 7 66
Central Region
Capital and Coast 42 68
Hawke’s Bay 66 53
Hutt Valley 41 66
MidCentral 53 66
Wairarapa 24 67
Whanganui 40 69
South Island Region
Canterbury 69 76
Nelson Marlborough 42 68
South Canterbury 58 76
Southern 64 65
West Coast 84 72
Note: Through-life of buildings is calculated as 100% less the age profile of depreciated replacement cost divided by
replacement cost. The replacement cost may apply to different years as the revaluation process takes place at least
every three years. [More complicated than previously.]
3.15 Overall, clinical equipment appears to be a long way through its useful life. No
DHB has clinical equipment that is less than halfway through its useful life, and
several DHBs have clinical equipment more than 75% through its useful life.
3.16 These results do not mean that DHBs are not investing in clinical equipment on
an ongoing basis. Nor does it mean, given the changes outlined in Part 1 about
the effect of technology on health assets that existing clinical assets should be
26Part 3
Managing buildings and clinical equipment to maintain health services
replaced on a like for like basis. However, as an asset class, the average age of
clinical equipment appears to be increasing. This means that DHBs will need to
plan how to keep delivering services for many clinical equipment assets reaching
the end of their useful lives in the medium term. It might also mean that DHBs
are not regularly reassessing the useful lives of clinical equipment and so might
be depreciating clinical equipment assets too quickly.
3.17 In commenting on the draft of the report, some DHBs noted that the lack of up-
to-date information about the useful life of their assets did not mean that they
lacked a good knowledge of the condition of their assets. They observed that
assets will often be suitable and safe for use beyond their initial useful life.
3.18 We agree with this observation. We consider that it reinforces the need to
maintain good information about the actual performance and lives of assets.
This allows DHBs to make practical and realistic plans for renewing and replacing
those assets. It also allows them to plan for and manage the associated funding
implications.
3.19 Our concern is that, at present, it is not clear that all DHBs are maintaining this
information. DHBs need to improve their information about, and understanding
of, these assets to manage the performance, maintenance, and eventual renewal
or replacement of the assets.
3.20 Given the nature and range of clinical equipment assets, it might not be as cost-
effective or useful to reassess their useful lives as it is for buildings. However,
we consider that DHBs should reassess the useful lives of high-value and critical
individual assets or of networks of assets.
Recommendation 1
We recommend that each DHB understand, respond to, and manage demand for
its assets and the related risks.
Recommendation 2
We recommend that each DHB know how well its mix of assets meets its service
delivery needs now, and in the future.
27Part 3
Managing buildings and clinical equipment to maintain health services
How is asset performance measured?
3.21 Asset performance relates to the ability of the asset to provide the agreed levels of
service or service standards. In other words, is the asset “fit for purpose”?
3.22 Measuring asset performance involves three elements:
• agreeing on and defining the service required from using the asset;
• regularly comparing the actual performance of the asset with the defined
service standards; and
• reporting this performance to the people responsible for decision-making.
3.23 DHBs should know what measures and targets about the performance of their
critical assets are important to them, then monitor and report that performance
regularly. As well as having asset management teams that monitor the
performance of assets, DHBs do other kinds of monitoring – for example, clinical
departments check that equipment meets clinical standards and have warrants of
fitness that they are operating safely.
3.24 DHB asset and financial management practitioners and advisors told us that,
although quite specific and demanding specifications are set when assets are
purchased or commissioned, this rigour is often not maintained in monitoring the
ongoing performance of assets.
3.25 Only half of the DHBs have systems for recording asset performance information
about buildings, and 11 have systems for recording information about clinical
equipment.
3.26 We looked at whether DHBs measured performance in what we considered would
likely be important dimensions for health-related assets. The dimensions we
reviewed were:
• capacity or utilisation;
• safety;
• legislative or regulatory compliance;
• risk of asset failure or outages; and
• cost efficiency.
3.27 Figure 6 sets out the five dimensions of asset management that DHBs most
commonly measure. It shows that “not applicable” responses have the least
variation. This reflects that not all DHBs have systems for recording asset
performance. Asset managers of DHBs without systems for measuring and
28Part 3
Managing buildings and clinical equipment to maintain health services
monitoring assets tend to rely on clinical departments to alert them to asset
performance concerns or issues.
3.28 On average, the DHBs that use systems to record asset performance measure
seven performance dimensions (for both building and clinical assets). The two
most commonly measured dimensions are safety and legislative or regulatory
compliance.
Figure 6
Asset performance dimensions that district health boards most commonly
measure
20
18
16
14
Number of DHBs
12
10
8
6
4
2
0
Capacity or Safety Legislative or Failure or Cost efficiency
utilisation regulatory outage risk
compliance
Measured Not measured Not applicable
Note: Some sections in Figure 6 are not whole numbers because the numbers are an average of DHBs’ performance in
respect of buildings and their performance in respect of clinical assets.
29Part 3
Managing buildings and clinical equipment to maintain health services
3.29 We looked at DHBs’ annual reports since 2010 to see what sort of performance
measures and targets they include that would give readers an understanding of
the services and results related to assets. Although we found limited information
of this nature, some DHBs include information about operating theatre use.
3.30 Operating theatres are one of the most service-intensive and expensive assets in a
typical major hospital. One DHB estimated that it costs an average of $1,121 each
hour to operate a theatre, excluding the cost of surgical personnel.
3.31 In the past, the Ministry required DHBs to report operating theatre use in their
annual reports, but it no longer does so. Some DHBs have continued reporting
operating theatre use, but others have not. In 2013, 14 DHBs reported operating
theatre use.
3.32 We looked at publicly available information, primarily DHB annual reports from
2010 to 2014, to see what they said about the measurement of, monitoring of,
and results achieved in operating theatre use.
3.33 Where results were reported, the rates for operating theatre use between 2010
and 2014 look impressive:
• The average operating theatre use was 85% of the time, and the rates ranged
from 72% to 99%.
• The rates were usually very close to the “base” or budgeted use and generally
increased during the period.
3.34 There are catches. The principal issue is that the rates are for “resourced” use of
the theatre (in other words, staff resource is assigned to the theatre). It does not
include theatre sessions not allocated because of planned leave or maintenance.
There also appeared to be some differences in how DHBs assessed “use”.
3.35 One of the important aspects of measuring performance is the trend over time,
so we are surprised that the Ministry did not maintain its expectation that DHBs
report the measure.
30You can also read