Sociodemographic Statement - Kilkenny Children and Young People's Services Committee - Children and Young People's ...
←
→
Page content transcription
If your browser does not render page correctly, please read the page content below
Sociodemographic Statement

                                                                   Kilkenny

Kilkenny Children and Young
People’s Services Committee
Sociodemographic Statement

Prepared by The Institute for Action Research 2018
                                                                             1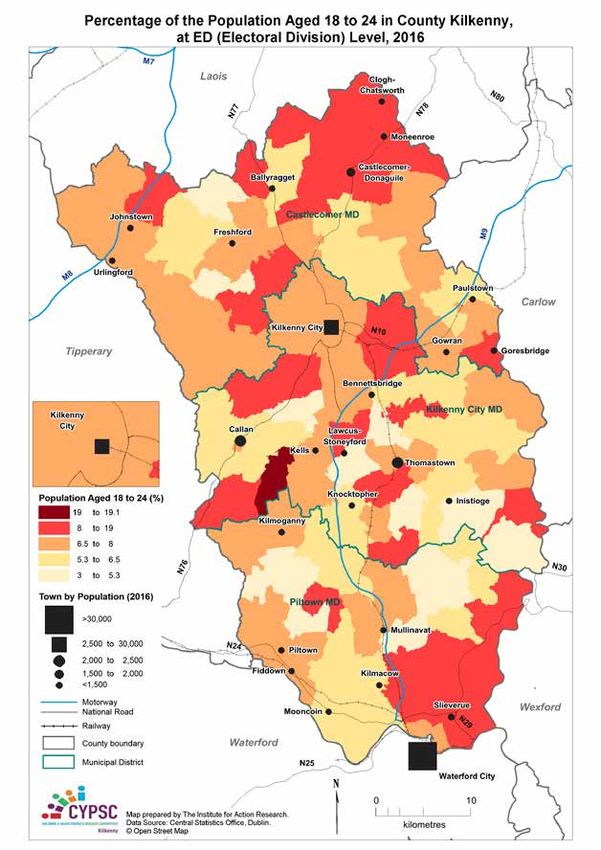
2
Sociodemographic Statement

TABLE OF CONTENTS

Chairperson’s Foreword                                      i
Executive Summary                                           ii

1. INTRODUCTION 1

2.   METHODOLOGY                                            3

3.   PRESENTATION OF PROFILE                                5

     3.1 Demographics                                      6
     3.2 Health                                           14
     3.3 Education                                        21
     3.4 Safety                                           25
     3.5 Economic / Financial Security                    29
     3.6 Support and Participation                        36

4.   CONCLUSION                                           37

                                                       Kilkenny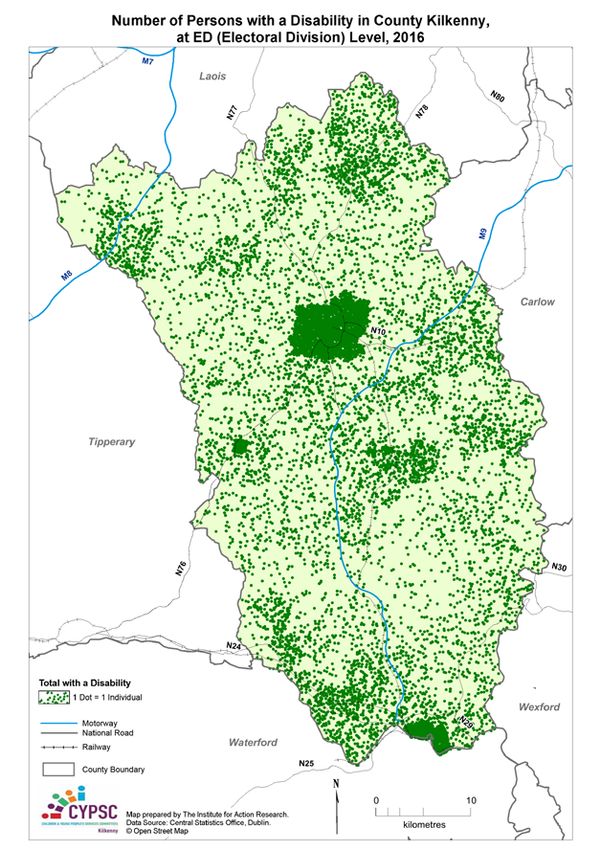
List of Tables

 1.    Number of Children and Young People, by Age Cohort in County Kilkenny and the South-East       6
       Region, 2016
 2.    Percentage of Families in each of the Standard Sequential Family Phases, in County Kilkenny,   7
       2016
 3.    Electoral Divisions with the Youngest Average Ages in County Kilkenny, 2016                    8
 4.    Population Levels and Percentage Change in Kilkenny the Southeast Region and The State,        9
       2002 – 2016
 5.    Electoral Divisions recording the Greatest Increases (10) and Greatest Losses (10) in County   9
       Kilkenny, 2002 – 2016
 6.    Membership of Ethnic Minorities in Absolute Numbers and as a Percentage of the Population      11
       in County Kilkenny, Regionally and Nationally, 2016
 7.    Travellers in County Kilkenny by Age Cohort, 2016                                              11
 8.    Languages other than Irish or English, spoken in County Kilkenny, by Local Authority Area,     12
       2016
 9.    Number of Persons by Nationality and Age Cohort in County Kilkenny, 2016                       13
 10.   Percentage of Persons whose Self-Declared Health Status is ‘Fair,’ ‘Bad’ or ‘Very Bad’ in      15
       selected ED in County Kilkenny, 2016
 11.   Types of Disabilities among Children and Young People in County Kilkenny, 2016                 15
 12.   Percentage of Infants who were Breastfed (either exclusively or combined) on Discharge         17
       from Hospital, 2015
 13.   Levels of Immunisation among Primary and Second-Level School Pupils in County Kilkenny,        18
       2015 – 2017
 14.   Children’s and Infants’ Interactions with Hospital and Other Health Services in County         18
       Kilkenny, 2015
 15.   Number of Persons with a Medical Card by Card Type and as Proportion of the Population in      20
       CHO Area 5 by LHO Area, 2016
 16.   PCRS - GMS Medical Cards: Number of Eligible Persons in the Carlow/Kilkenny LHO, Gender        20
       and Age Group, 2016
 17.   Number of Eligible Persons per Scheme in CHO Area 5 by LHO, 2016                               20
 18.   Educational Attainment Levels by Gender, as measured by the Proportion of Persons with         21
       Primary Education Only and Persons with a Third Level Qualification
 19.   The Ten Electoral Divisions with the Highest Levels of Persons (aged 15+) whose highest        22
       level of educational attainment is Primary Education
 20.   The Ten Electoral Divisions with the Highest Levels of Persons (aged 15+) with a Third Level   22
       Qualification
 21.   Number and Percentage of Children by County and Educational Attainment of Mother, 2011         23
 22.   DEIS Schools in County Kilkenny, 2018                                                          23
 23.   Percentage of Pupils / Students either suspended or expelled from school during the            24
       Academic Year 2016 / ’17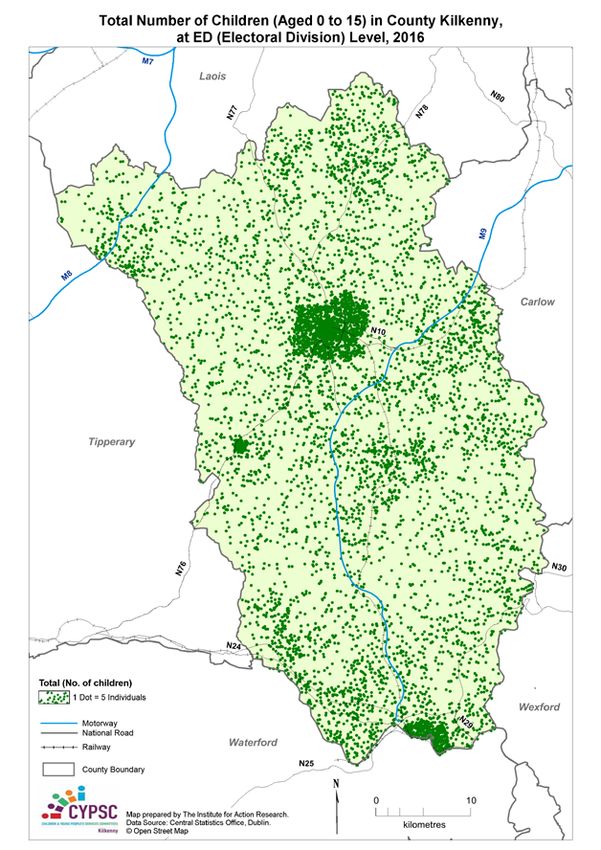
Sociodemographic Statement

 24.   Percentage of School Children / Students who were absent from school for 20 days or more     24
       year in the school year 2013 – 2014
 25.   Statutory Measures taken (by number) to address School Absenteeism in County Kilkenny,       25
       2015 – 2017
 26.   Percentage of Households living in Rented Accommodation by Type, in The South-East           25
       Region, at County Level, 2016
 27.   Selected Offences Committed by Children and Young People in the Kilkenny Division, 2015      26
       – 2017
 28.   Numbers of Children and Young People accessing Treatment for Substance Misuse in County      27
       Kilkenny in 2015/16 and Substance treated
 29.   Number of Children by Frequency of Referrals to Tusla in Carlow and Kilkenny, 2016           27
 30.   Reasons for Child Referrals to Tusla in Carlow and Kilkenny, 2016                            28
 31.   Sources of Child Referrals to Tusla in Carlow and Kilkenny, 2016                             28
 32.   Persons in Receipt of Unemployment Benefit in County Kilkenny, by DSP Office, November       30
       2012 to November 2017
 33.   Uptake Levels in respect of Family-related State supports for Low-Income Households, 2016    31
 34.   Number of Children aged under 15 years in Lone Parent Families and All Families in County    31
       Kilkenny, 2016
 35.   Absolute and Relative Scores on the Haase-Pratschke Index for County Kilkenny, in            32
       comparative context, 2006, 2011 and 2016
 36.   Most Affluent and Most Deprived EDs (ten of each) in County Kilkenny, based on Relative      33
       Scores on the Haase-Pratschke Index, 2016
 37.   Small Area Analysis in respect of Deprivation in County Kilkenny, as Measured by the Haase   35
       Index of Affluence and Deprivation, 2016

List of Figures

 1.    Sub-County Geographies at which Census of Population data are recorded                        4
 2.    Nationality Groupings by Age Cohort in County Kilkenny, 2016                                 14
 3.    Number of Babies Born to Mothers resident in County Kilkenny, 1985 – 2016                    16
 4.    Average Age of All Mothers and First-Time Mothers in County Kilkenny, 1985 –2016             17
 5.    Electoral Divisions in South County Kilkenny that pertain to the Waterford LHO               19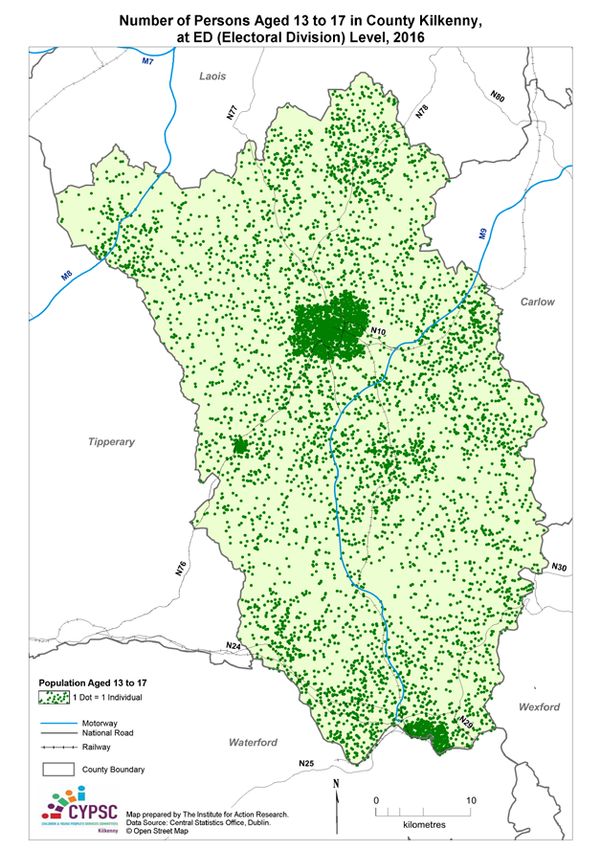
CHAIRPERSON’S FOREWORD
     As chairperson of Kilkenny Children and Young People’s Services Committee
     (CYPSC), I welcome the Kilkenny CYPSC Evidence Baseline Report, 2017, as a
     resource to inform evidence-based planning for the CYPSC, and indeed, for other
     agencies over the next period.

     The report, drawing on the findings of the 2016 Census and other databases,
     provides an up-to-date socio-demographic profile of the population of Kilkenny,
     with particular focus on the 0-24 years’ age cohort. It highlights key indicators
     across the five areas of Demography; Economy; Education; Health and Security,
     which are aligned to National Outcomes of Better Outcomes, Brighter Futures1 -
     the National Policy Framework. The data for the county are presented within a
     comparative context at inter-county, regional and national levels, as well as being
     mapped within the county boundaries, to highlight the county’s distinctive features,
     patterns and trends.

     I would like to thank all who have contributed to the wealth of information contained
     in this report, especially the HSE, Garda, Dept. of Social Protection, Educational
     Welfare and Tusla staff who provided data and the to the Central Statistics Office
     who provided some particularly detailed information in relation to County Kilkenny

     I would like to acknowledge the expertise, commitment and professionalism of Dr
     Brendan O’Keeffe and Dr Noreen O’Mahony of The Institute for Action Research in
     undertaking this research, and their dedication and patience in bringing this report
     to its conclusion.

     Marie Kennedy
     Chairperson, Kilkenny Children and Young People’s Services Committee

     May 2018

     1   Department of Children and Youth Affairs (2014). BETTER OUTCOMES BRIGHTER FUTURES - The
         national policy framework for children & young people 2014 – 2020. Dublin: The Stationery Office.

i6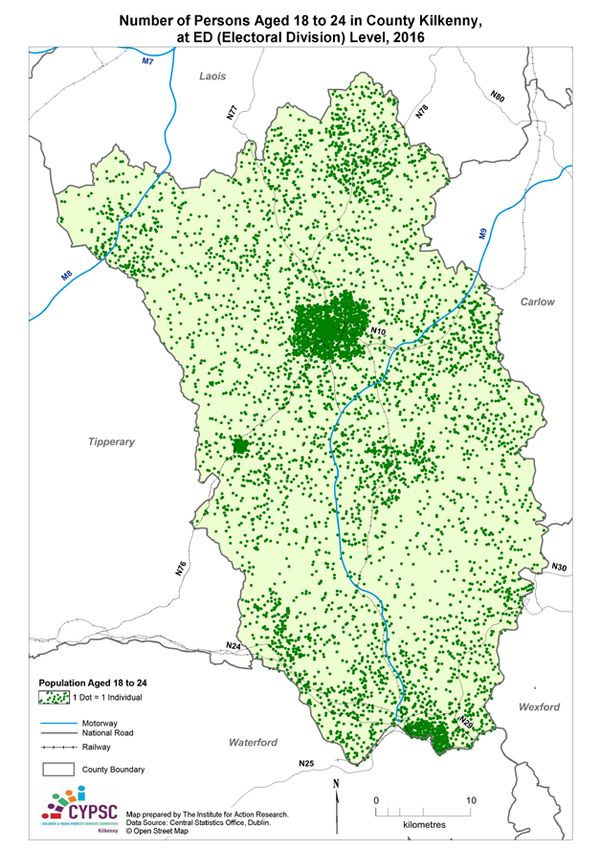
Sociodemographic Statement

                 EXECUTIVE SUMMARY
This socio-economic statement represents one strand of a multi-pronged approach
on the part of The County Kilkenny Children and Young People’s Services Committee
(CYPSC) to informing its strategic plan 2018-2020. It is largely quantitative, and
draws mainly on data recorded by the Central Statistics Office (CSO) and public
bodies. These data provide signposts and indicators, and they offer baselines
against which progress can be measured over the coming years. In addition, the
socio-economic statement contains a series of maps. These allow for a detailed
spatial analysis of the lives of children and young people. This examination of the
meso- and micro-level geographies within County Kilkenny proved to be integral to
informing the CYPSC strategy, as it identified specific areas of need and potential.

The socio-economic statement reveals that children and young people represent
a very sizeable population cohort in County Kilkenny. Relative to the State and
the South-East Region, the county has an above average proportion of persons
aged up to 18 years. Over one-quarter of the population (26.1%) is aged under 18
years. There are relatively fewer persons aged 18 to 24 years, as most young people
attending Higher Education Institutes (HEIs) are obliged to leave the county.

County Kilkenny’s current demographic composition is such that one can anticipate
further and sustained growth in the number of children across the county over the
next decade; the demographic vitality ratio is stronger than the regional average.
The current and anticipated spatial distribution of children and young people across
the county is such that agencies ought to be active in urban, rural and intermediate
zones. The needs analysis, based on the socio-economic data, points to the
importance of accessible services and enhanced public transport in rural areas in
particular. Indeed, the data reveal a myriad of issues with strong local features and
determinants, such that there is, in many communities, a need for local level and
bespoke interventions. Thus, while County Kilkenny, as a unit, may record better
outcomes than the South-East Region, the more fine-grained geographical analysis
shows that considerable needs exist, and increased investments are required in
many areas.

While County Kilkenny and the South-East Region are not as diverse as other parts
of Ireland in respect of nationality and ethnicity, there are significant clusters of non-
Irish nationals in several locations. These are mainly in the more urbanised parts
of the county. Children are proportionately over-represented among the migrant
populations, and over one-in-four (323 children) of these, does not declare his/
her nationality – thus indicating, in many cases, the challenging backgrounds
and circumstances from which they have come. Non-Irish nationals can face
considerable barriers in integrating into Irish society, and language barriers
frequently prevent them from accessing services. In County Kilkenny, the most
widely-spoken minority languages are Polish and French.

There has been a significant increase in the population of Irish Travellers in County
Kilkenny, and an age-level analysis of this population reveals that over half are
under twenty years of age.

Health-related variables are integral to understanding the lives of children and young
people. Data on ability / disability reveal that just over five percent of children (aged
up to 14) have a defined disability. This figure increases to just under ten percent

                                                                                                 ii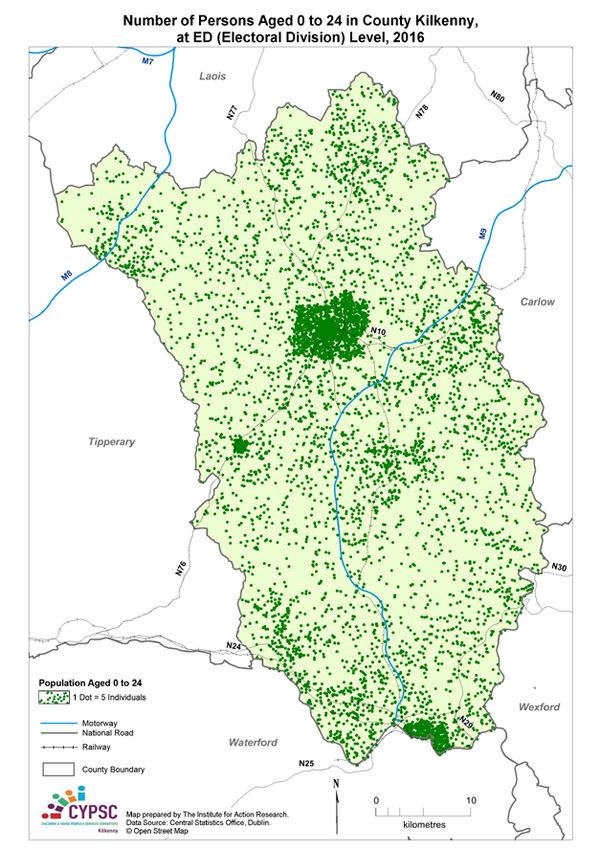
(9.6%) for persons aged 15 to 19 years. The most common forms of disability are
      intellectual ones and difficulties in learning, remembering and concentrating.
      Of those children and young people who have disabilities, several have more than
      one, thus emphasising the importance of holistic, child-centred and family-centred
      approaches.

      Since the advent of the most recent recession (in 2010), the birth rate – nationally
      and in County Kilkenny - has been steadily declining, after several years of growth.
      Meanwhile, the average age of mothers has been increasing consistently over recent
      decades. It now stands at 31 years for first-time mothers. Rates of breastfeeding
      are broadly in line with the national average, but are below international norms.
      The proportion of domiciliary births is low, relative to other European countries.
      Meanwhile, the percentage of mothers visited by Public Health Nurses (PHNs)
      is above the national average, as is the proportion of babies screened. The data
      on immunisation reveal the successes achieved by the HSE in promoting uptake,
      particularly in respect of the MMR and 4-in-1 vaccines. However, they reveal a drop
      (since 2015) in the numbers presenting for the HPV vaccine.

      Educational attainment is a significant determinant of a child’s life trajectory.
      The data in this regard reveal below average levels of educational attainment in
      County Kilkenny and in the South-East Region, relative to the rest of Ireland. This
      is particularly the case in respect of the proportion of the population with a third-
      level qualification. The areas with the highest levels of educational disadvantage
      are the rural north-east, north-west and south-west of the county. Inter-
      generational underperformance in education appears to be a feature here, thus
      indicating a need for interventions to break the cycle of disadvantage in tandem with
      promoting social inclusion and community development. Access to high-quality
      and affordable childcare is important in promoting educational attainment – for
      early child socialisation and in enabling parents to access education, training and
      employment. The community and voluntary sector locally has been to the fore in
      providing childcare services. However, the data on affordability reveal a year-on-year
      increase in the cost of sessional childcare. The county’s DEIS (Delivering Equality
      of Opportunity in School) schools and those offering the SCP (School Completion
      Programme) do very valuable work in enabling young people to remain in
      education and to secure a qualification. However, the education landscape has
      changed very considerably since DEIS allocations were decided, such that it is time
      to revisit the criteria and associated coverage, so that these are more reflective of
      contemporary realities.

      Housing tenure and security affect student well-being and progression. While the
      overall proportion of children and young people living in rented accommodation is
      below the regional average, there are several villages and urban neighbourhoods
      which have considerable concentrations of families, who are renting from the local
      authority or private landlords. These are among the neighbourhoods with the
      highest levels of deprivation and social exclusion in the county.

      Agencies such as An Garda Síochána, Tusla, the HSE and Probation Services
      engage with youth-at-risk, and the data from these bodies show that referral rates
      are similar over time which, in the context of declining agency budgets over the
      past decade, imply pressures on service providers. It is noteworthy that over

8
iii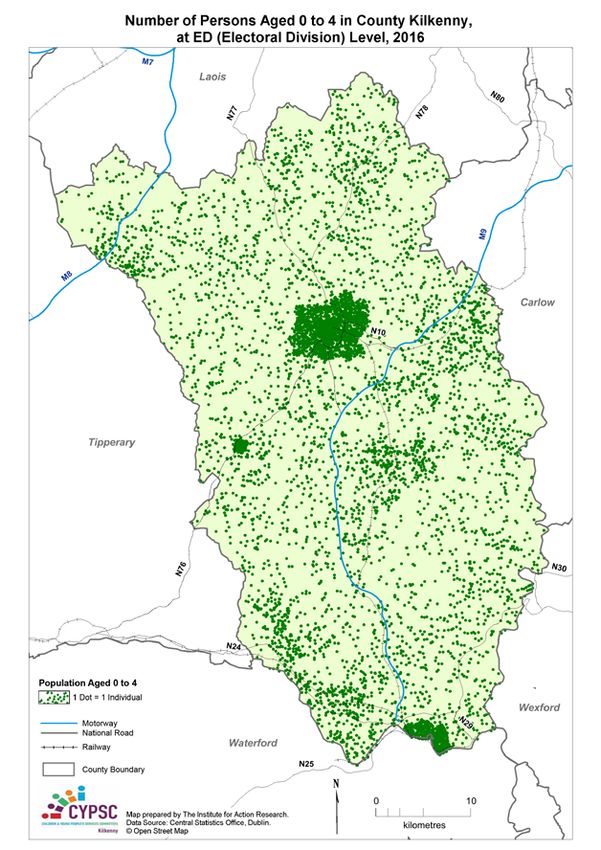
Sociodemographic
Socio-Economic Statement
one-quarter of children referred to Tusla were referred more than once, with the
most common reason for referrals being ‘child welfare.’ Referrals to Tusla are also
associated with children engaging in substance abuse.
Kilkenny’s economy, as measured by labour force participation rates, performs
stronger than that of the South-East Region. However, there are several areas
with persistent unemployment, many of them rural. The data suggest that the
rural economy is stronger in South Kilkenny than in the north of the county and
that changes in the nature and structure of the farming sector have had a negative
impact on rural villages and small towns. As these villages come under economic
pressure, their ability to be attractive to families and young people declines.
Family composition also determines the well-being and quality of life of children
and young people. Just over one-in-five families is headed by a lone parent – the
vast majority by a lone mother.
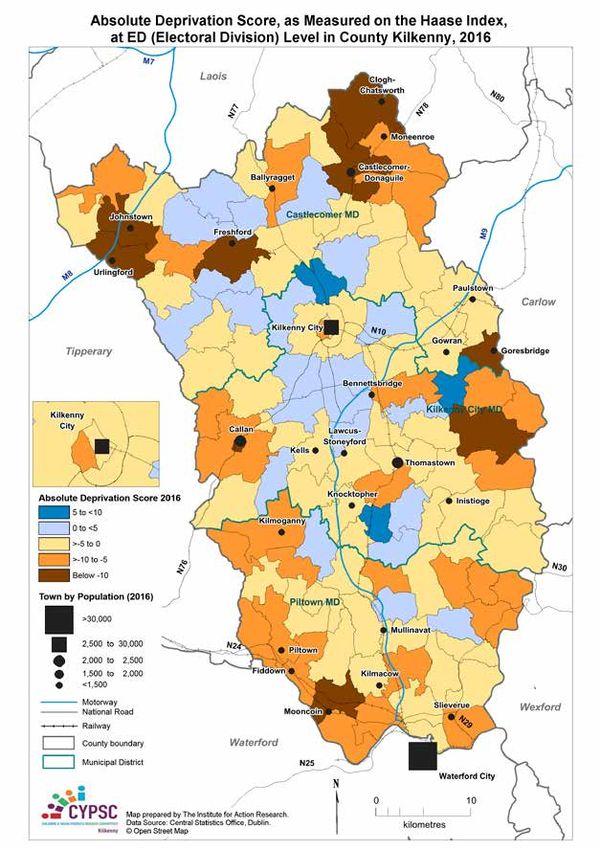
The Haase-Pratschke Index of Affluence and Deprivation provides a composite
measure of socio-economic status in respect of particular geographies, and can be
computed at Electoral Division (ED) and Small Area (SA) levels, using data from the
Census of Population. The Index presents data at points in time, and is widely used to
inform decision-making in respect of public policy and local development strategies.
It incorporates multiple variables including employment / unemployment, housing
tenure, age dependency, population change, lone parent ratios and accessibility.
It reveals that County Kilkenny is slightly more deprived than the State as a
whole, which may run counter to the popular perception of the county. That said,
Kilkenny’s overall score indicates that the county is more affluent than other
counties in the South-East Region. The Haase-Pratschke computation shows that
within the county, the most affluent areas are in the commuter belt immediately
surrounding Kilkenny City. On the other hand, the areas with the highest levels
of deprivation are the villages in the north-east and north-west of the county,
the east of the county along the Carlow – Wexford border and the south-west
of the county. When the Haase-Pratschke data are mapped for Kilkenny and the
surrounding counties, there is evidence of a ‘border effect,’ with areas of deprivation
straddling county boundaries, particularly with Tipperary and Wexford. This spatial
pattern points to the need for increased inter-county collaboration in addressing
social exclusion and in enabling places to fully realise their development potential.
This comprehensive socio-economic statement reveals that the phenomena and
variables that affect and shape the lives of children and young people are multi-
varied and inter-related. Improving their lives and promoting better outcomes and
brighter futures require inter-agency collaboration and partnership. Enhancing
children’s lives also behoves agencies to work in partnership with local stakeholders
including schools, community bodies, youth services, the private sector and other
social partners. Above all, it requires systematic engagement and consultation with
children and young people – both directly and through intermediate structures. As
the CYPSC strategy is rolled-out over the next three years, and as partners use the
data presented here, they will be better able to monitor the outputs and impacts
of their actions, and continue to be responsive to the needs of children and young
people.
9iv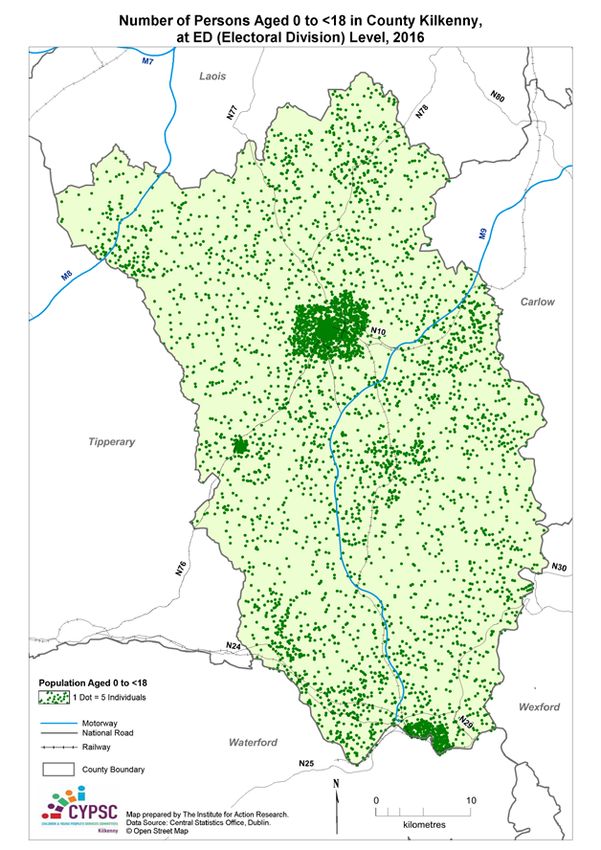
1   Introduction

10
Sociodemographic Statement

1. INTRODUCTION
This profile of children and young people in County Kilkenny forms an integral component of the Kilkenny
Children and Young People’s Services Committee (CYPSC) Strategic Plan, 2018 – 2020. It seeks to:
    • Identify particular cohorts of children and young people2 and the issues they face;
    • Inform needs’ analysis;
    • Unearth opportunities for collaboration and development;
    • Provide baseline indicators against which progress on implementation can be measured;
    • Understand the dynamics of particular geographies;
    • Consider the potential for bespoke interventions; and
    • Situate issues in Kilkenny in the regional and wider context.

The CYPSC has undertaken parallel scoping research and consultations, including a consultation with
agencies, which was based on the data presented in this profile. Those complementary exercises bring
a qualitative dimension to bear on the strategic plan, and they help to engender collaboration and joint
working. This profile adds value to those efforts by bringing quantitative data and spatial analysis to the
planning process.

The data presented in this profile are drawn from three sources in the main:
   • The Census of Population;
    •   State of the Nation’s Children Report (2016); and
    •   Data provided by agencies that are represented on the CYPSC.

Other data were provided by state agencies and community organisations, while some come from European
databases.

This profile is organised under five headings, in alignment with the themes set out in Better Outcomes –
Brighter Futures: The national policy framework for children and young people, 2014 – 2020. These are:
    3 Health;
    4 Education;
    5 Safety;
    6 Financial security; and
    7 Support and Participation.

In advance of the thematic presentation of data, this report begins with a demographic overview of the
County, with a particular focus on children and young people. Given the centrality of spatial analysis to this
profile, it refers throughout to several maps. These are all listed and presented in an annex (Annex 1)

2   In line with the national policy framework, Child: A ‘child’ is defined as any person under the age of 18 years, in line with the
    United Nations Convention on the Rights of the Child. Young Person: A ‘young person’ is defined as any person under 25 years
    of age in line with the upper age threshold of the Youth Work Act 2001 and in line with the definition used by the United Nations.

                                                                                                                                    2
2 Methodology 3
Sociodemographic Statement

2. METHODOLOGY
This profile is based largely on quantitative data extracted from the Census of Population, as published
by the Central Statistics Office. The CSO conducts the census every five years. The most recent was in
April 2016. Most census data are published (as absolute numbers) at several spatial scales (including
region, county, municipal district), the smallest of which are Electoral Divisions (EDs), although data on
some demographic variables are also available at Small Area (SA) level, since 2006. The following figure
shows the delineation of EDs, of which there are 113 in County Kilkenny3. The figure also shows the main
settlements in County Kilkenny, as these are referred to throughout the document.

Fig. 1: Sub-County Geographies at which Census of Population data are recorded

Due to reasons of confidentiality, some census data, particularly in respect of defined cohorts, are not
published at sub-county level. In such cases, where data are relevant to the lives of young people, they
are presented here at county and regional levels, and this report situates the Kilkenny data in the context
of the South-East Region. This socio-economic and demographic profile also draws on data kindly
provided by several agencies, many of them members of the CYPSC. These personnel have brought their
expertise and insights to bear on the analysis presented in this report. In addition to its own internal
working through the data, the CYPSC convened a dedicated consultation workshop on March 22nd. Over fifty
people attended, representing statutory agencies, community organisations, NGOs and young people. The
workshop discussions and deliberations fed directly into the CYPSC’s review and planning processes, while
also enabling a further interrogation of the data presented here.

3   The names of all EDs are presented in the annex (Annex 2).

                                                                                                         4
Socio-Economic Statement
3 Presentation
of Profile
5 5Sociodemographic Statement
3. PRESENTATION OF PROFILE
This section begins by profiling children and young people in respect of relevant demographic variables.
It enumerates persons by age cohort, examines inter-censual change, identifies the nationalities and
ethnic groups in the population and lists the languages spoken in homes across County Kilkenny. These
demographic data provide several insights into the lives of children and young people, and they reveal
the growing diversity of the population. The elaboration of the key demographic variables is followed by
a presentation of data in respect of the following themes: health, education, safety, financial security and
support & participation. The data under these headings enable a more in-depth analysis, and they show
how social and economic variables are interrelated, thus underscoring the importance of inter-agency and
collaborative approaches to ensuring better outcomes and brighter futures for children and young people
in County Kilkenny.
3.1 Demographics
This section looks at the composition of Kilkenny’s population. It focuses specifically on age composition,
inter-censual change, nationality, ethnicity and language, given the relevance of these demographic
variables to the delivery of services for children and young people.
Age Composition
According to the most recent Census of Population, County Kilkenny has a total population of 99,232.
Children and young people represent one-third of the population. The following table presents the total
number of persons in age cohorts, and expresses these as a percentage of the total population. It does so
for County Kilkenny and for the South-East Region4.
Table 1: Number of Children and Young People, by Age Cohort in County Kilkenny and the South-East
Region, 2016.
Aged 0 Aged 5 Aged 13 Aged 18 Aged 0 Aged 0
to 4 to 12 to 17 to 24 toand Ferrybank) and the many smaller towns and villages across the county. These maps, as well as many
of the maps presented throughout this profile, demonstrate the dispersed nature of settlements throughout
Kilkenny. Unlike in other counties in which settlement is more concentrated in particular locations and /
or there are peripheral areas, Kilkenny is more spatially balanced and has a better demographic and social
mix. Thus, agencies need to continue to have a presence, and services need to be provided across urban,
peri-urban and rural areas.
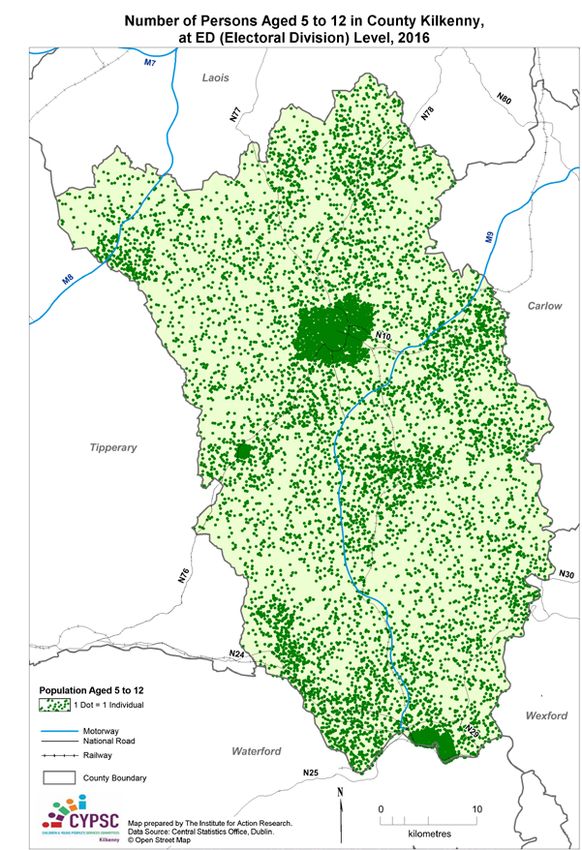
The dot density maps present the absolute numbers of children and young people across the county. These
are followed by six choropleth maps that show each age cohort as a percentage of the total population at
Electoral Division (ED) level (Maps 7 to 12). Taken together, the maps (1 to 12) provide useful pointers with
regard to providing services and meeting the needs of children and young people. The first choropleth map
(Map 7) shows above average proportions of infants and toddlers (children aged up to 4 years) in the environs
of Kilkenny City, Ferrybank and Mooncoin. The map also shows (as indicated by the dark brown shading)
that the areas with the highest proportions of children aged under four are rural communities, rather than
any of the towns or larger villages, and that, these are scattered across the county. This implies a need
for rurally-based services such as parent and toddler groups and pre-school facilities. Furthermore, the
choropleth map (Map 8) presenting data on primary school-aged children shows the significance of rural
areas. The spatial pattern in respect of children / young people (12 to 17 year olds) in the second-level school
aged cohort exhibits a patchwork effect – in that there are no notable above or below average geographical
clusters. The spatial patterns in these three maps underscore the importance of transport service provision
(e.g., public transport connectivity and school transport), outreach work and rural-proofing in ensuring the
effective delivery of services to children and young people across County Kilkenny.
Map 10, which shows the proportion of persons aged 18 to 24 in each ED, illustrates how, as indicated by
the lighter shading that the county has a slightly lower proportion of persons in this age cohort than is the
case regionally and nationally. However, there are two notable clusters with above average proportions of
persons in this cohort. These are in the northeast and southeast of the county. The former, which includes
Castlecomer and the surrounding areas, emerges (as later maps in this profile show) as having higher
levels of socio-economic deprivation, which is, inter alia, associated with lower levels of transition from
second-level to third-level education. The pattern that the map presents in respect of South-East Kilkenny
is more similar to that of Wexford (the adjoining county), rather than to Kilkenny as a whole. This feature
may be associated with Wexford having among the lowest levels of progression to third-level education
of any county, and fewer job opportunities in the knowledge economy and the service sector, relative to
other parts of Ireland. The data presented in this map, and the patterns displayed in the aggregate maps
in respect of persons aged 0 to 18 years and 0 to 24 years (Maps 11, 12 and 13) show a healthy presence of
children throughout the county, including in many rural areas. The maps suggest however, a need to make
the county more attractive to young adults.
The following table shows that pre-family Households and those with pre-school children represent 17.3%
of families in County Kilkenny.
Table 2: Percentage of Families in each of the Standard Sequential Family Phases,
in County Kilkenny, 2016.
Pre- Early Pre- Empty
Pre-school Adolescent Adult Retired
family school adolescent Nest
% of families 7.6% 9.7% 12.0% 11.6% 13.1% 25.0% 10.8% 10.2%
The accompanying map (Map 14) shows that the areas with the highest proportions of households classified
as pre-family and pre-school are in and around Kilkenny City, especially its immediate environs, and in
dispersed locations across the county, including Urlingford, Callan, Knocktopher, Thomastown and
Paulstown. These data suggest an ongoing need for family-related services in these communities, including
schools and childcare.
7Sociodemographic Statement
The patchwork pattern that tends to characterise demographic spatial patterns in County Kilkenny is
further evident in the maps that present data on dependency ratios. The first of these (Map 15) deals with
Youth Dependency Ratio. Youth Dependency Ratio refers to the number of young people (aged 0 to 14 years)
in relation to the number of persons in the ‘working age cohort’ (aged 15 to 64 years). In statistical terms,
County Kilkenny records Youth Dependency Ratio of 34.3%. This compares with the national value of 32.3%.
Map 16 again underscores the need for rural services and the rural-proofing of strategies and actions, as
it shows several rural areas with values in excess of 38%. The following map (Map 17), which presents
the Elderly Dependency Ratio illustrates that some parts of the county have above average proportions of
both young (aged 0 to 14) and older (aged 65+ years) people. These include rural areas between Freshford
and Johnstown, the area between Mooncoin and Waterford City and areas east of Thomastown and
Bennetsbridge. Thus, there may be a basis for inter-generational projects in these communities.
The Census of Population also reveals further data on the age composition of the population. It shows that
in 2016, the average age of persons in Ireland was 37.4 years, an increase of 1.4 years since the previous
census in 2011. In terms of county6 rankings, Kilkenny stands fourteenth in terms of the oldest population
(or eighteenth in respect of the youngest population). In 2016, the average of the population in County
Kilkenny was 37.7 years, up from 36.6 years, five years earlier. The following table identifies the ten EDs
with the youngest populations in the county. These EDs are distributed across the county.
Table 3: Electoral Divisions with the Youngest Average Ages in County Kilkenny, 2016.
Electoral Division Average Age
Kiltorcan 32.3
Kilculliheen (part) 32.5
Jerpoint West 32.9
Bramblestown 33
Tiscoffin 33.7
Paulstown 33.8
Coolaghmore 34.4
Kilkieran 34.8
Rathealy 35
Urlingford 35.3
Inter-Censual Change
Between 2002 and 2016, the population of the State increased by over one-fifth (20.8%), from 3.94 million to
4.76 million. This gives Ireland one of the fastest rates of population growth in the EU, and it is associated
with an above average birth rate and with in-migration. The growth rate during the most recent inter-
censual period (2011 – 2016) was 3.78%. As the following table shows, Kilkenny’s level of population increase
exceeded the national and regional levels.
6 Data for Fingal, South Dublin, Dún Laoghaire-Rathdown, Dublin City, Cork City & County and Galway City & County are
disaggregated separately.
8Table 4: Population Levels and Percentage Change in Kilkenny the Southeast Region and The State,
2002 – 2016.
Population Population Population Population % Change % Change
2002 2006 2011 2016 2002 to 2016 2011 to 2016
County Kilkenny 80,339 87,558 95,419 99,232 23.5% 4.0%
Carlow 46,014 50,349 54,612 56,932 23.7% 4.2%
Waterford City and County 101,546 107,961 113,795 116,176 14.4% 2.1%
Wexford 116,596 131,749 145,320 149,722 28.4% 3.0%
South-East 344,495 377,617 409,146 422,062 22.5% 3.2%
Ireland 3,942,078 4,239,848 4,588,252 4,761,865 20.8% 3.8%
Maps 18 and 19 provide geographical detail on inter-censual population change. These show percentage
population change at ED level since 2002. The first provides the longitudinal perspective (2002 to 2016), and
it reveals that the areas with the highest levels of population growth are Ferrybank, the environs of Callan,
and Goran and surrounding areas. All have witnessed population increases in excess of fifty percent. Such
increases inevitably bring opportunities in terms of vitality, but they can also put pressures on existing
infrastructure and services. Therefore, investment in public service provision in line with demographic
trends or more importantly, in guiding sustainable and balanced demographic growth, is essential.
Above average population increases are also very notable within a 5km radius of Kilkenny City, with growth
levels in the City itself being much more moderate. While Kilkenny County Council and local stakeholders
have worked to ensure that Kilkenny City does not suffer the same fate as other towns in respect of a
hollowing out of the City Core (the so-called donut effect), the population change data suggest a need
to keep suburbanisation in check. Suburbanisation can have a negative effect on the ability of children
and young people to access services, as it increases car dependency. This can have particular negative
consequences for lower-income families.
The inter-censual data also show that some parts of the county have actually bucked the broader trend, and
have lost population since 2002. The following table lists the EDs that have recorded the largest gains and
largest losses (10 of each) between 2002 and 2016.
Seven of the ten EDs listed above as having the highest levels of population increase are also listed in Table
2, as having the youngest average age in the county7.
Table 5: Electoral Divisions recording the Greatest Increases (10) and Greatest Losses (10) in County
Kilkenny, 2002 – 2016.
EDs % Increase EDs % Decrease
Kilculliheen (part) 144.57% Baunmore -13.55%
Jerpoint West 120.49% Tullaroan -10.51%
Paulstown 105.00% Ballyconra -9.81%
Tiscoffin 87.69% Rathpatrick -9.05%
Bramblestown 68.32% Johnstown -7.60%
Callan Rural 58.09% Outrath -6.77%
Gowran 53.33% Killahy -6.47%
Coolaghmore 52.62% Mallardstown -5.97%
Burnchurch 48.39% Goresbridge -5.51%
Fiddown 43.42% Freshford -5.39%
7 Those seven EDs are Kilculliheen (part), Jerpoint West, Paulstown, Tiscoffin, Bramblestown, Callan Rural and Coolaghmore.
9Sociodemographic Statement
The data presented over the preceding pages show that children and young people are a sizeable population
cohort throughout County Kilkenny – across all geographies. Strong youth demographics are associated
with demographic vitality, thus indicating an ongoing need for investment in family-oriented supports and
services. The demographics also indicate a need for discussions at county-level on the implications of
Kilkenny not having a third-level institute. While it can be to Kilkenny’s benefit that young people go elsewhere
to gain knowledge, skills and experiences, which they can subsequently bring back to their native county,
the obligation to travel can represent a barrier to education, among those from low-income families. In
addition, as third-level institutes are associated with preferred locations for knowledge-economy activities,
Kilkenny’s economic competitiveness would likely benefit from a stronger third-level presence in the county.
The following pages provide further insights into the changing composition of the 0 to 24 year old age
cohort. They present data in respect of nationality, ethnicity and language, all of which are relevant to
enabling more equitable access to services. The principle of equality is at the core of Better Outcomes,
Brighter Futures. The policy framework commits to ensuring that:
“Inequalities are addressed across all sectors, including health, education and justice.
Children and their parents do not face discrimination of any kind, irrespective of
membership of the Traveller community, race, colour, gender, sexual orientation, gender
identity, civil status, language, religion, political or other opinion, national, ethnic or
social origin, property, disability, birth or other status. All children in need have equality
of access to, and participation in, a range of quality public services” (2014: 20).
Nationality, Ethnicity and Language
Irish society has become more ethnically diverse over the past two decades. Non-Irish and non-UK nationals
now account for over nine percent of the State’s population. The corresponding figures for the South-East
Region and for County Kilkenny are lower, at 6.67% and 6.37% respectively. While in-migration is manifest
across Ireland, it is more pronounced in urban, rather than in rural areas, as migration is associated with
the expansion of the urban labour force. This phenomenon is evident in County Kilkenny, as indicated in Map
19. This reveals that areas with the highest proportions of non-Irish and non-UK nationals are Ferrybank
(16%) and Kilkenny City (15%). Among rural areas, the highest value is recorded in Mallardstown (16.5%) –
the highest of any ED in the county. Urlingford also records a relatively high level (10.2%), associated with
employment in transport and haulage. Rosbercon, which adjoins the town of New Ross, records a value
of nine percent. Apart from these locations, the proportion of non-Irish and non-UK nationals is generally
below the national average, with the lowest values tending to be in rural communities in South Kilkenny.
The Central Statistics Offices records and publishes a breakdown of the data on ethnicity at ED level in
respect of selected ethnicities. The following table presents these data in respect of County Kilkenny, the
SE Region and the State.
10Table 6: Membership of Ethnic Minorities in Absolute Numbers and as a Percentage8 of the Population
in County Kilkenny, Regionally and Nationally, 2016.
White Other Black or Asian or Other
Irish White Black Asian
Traveller Irish Irish
County Kilkenny No. 554 7271 730 979 935
% 0.6% 7.5% 0.8% 1.0% 1.0%
Carlow No. 511 5192 590 721 690
% 0.9% 9.4% 1.1% 1.3% 1.2%
Waterford City and County No. 517 9250 1531 1877 1324
% 0.5% 8.3% 1.4% 1.7% 1.2%
Wexford No. 1508 12214 414 1046 1454
% 1.0% 8.4% 0.3% 0.7% 1.0%
South-East No. 3093 33927 3265 4623 4403
% 0.8% 8.3% 0.8% 1.1% 1.1%
Ireland No. 30987 446727 64639 98720 70603
% 0.7% 9.8% 1.4% 2.2% 1.5%
LA Divisions within Kilkenny
Castlecomer No. 67 880 38 115 139
% 0.3% 3.9% 0.2% 0.5% 0.6%
Kilkenny City East No. 200 2428 211 275 314
% 0.8% 9.4% 0.8% 1.1% 1.2%
Kilkenny City West No. 190 2287 262 466 334
% 0.8% 9.2% 1.1% 1.9% 1.3%
Piltown No. 100 1676 219 123 148
% 0.4% 7.1% 0.9% 0.5% 0.6%
As the table shows, there are 10,469 persons resident in County Kilkenny, who consider themselves
as belonging to one or other of the minorities listed above. These people represent ten percent of the
population. Maps 20 to 24 (inclusive) present the spatial distribution of the above ethnicities at ED-level.
According to the Census of Population, there are 554 Irish Travellers in County Kilkenny. This figure has increased
by 63 since 2011. As Map 21 shows, Travellers live in several communities throughout the county, but there are
particular concentrations, most notably in the EDs of Kilkenny Rural, Kilkenny No. 1 Urban, Rosbercon Rural,
Callan Rural, Urlingford, Thomastown, Castlecomer, Jerpoint West, Callan Urban, Coolcraheen and Pollrone.
As the following table shows, Irish Travellers have a much younger age profile than the sedentary population.
Almost two-thirds of Travellers resident in County Kilkenny are aged under 24 years.
Table 7: Travellers in County Kilkenny by Age Cohort, 2016
Age Cohort 0 to 4 5 to 9 10 to 14 15 to 19 20 to 24 25 to 29 30 to 64 65+
Number 92 85 59 60 60 37 149 12
Percentage 17% 15% 11% 11% 11% 7% 27% 2%
The data presented in the table (above) illustrate the lower life expectancy experienced by Irish Travellers,
relative to the rest of the Irish population. Indeed, extensive research undertaken by the Health Research
Board and among academics consistently demonstrates that Irish Travellers continue to face widespread
prejudice in Irish society and have difficulties accessing essential public services. Information supplied
by schools also reveals lower levels of educational attainment among Travellers, with the transition from
primary to post-primary level often associated with dropping out from education, especially among males.
8 Persons whose ethnicity was ‘not stated’ were excluded in the calculation of the percentage values.
11Sociodemographic Statement
Thus, given the multiplicity of their needs, Irish Travellers ought to be among the specific beneficiaries of
the CYPSC strategy and those of other agencies.
The category entitled ‘other white persons,’ as presented in Map 22, includes many of the so-called ‘new
Irish,’ and non-Irish nationals, who have migrated to this country. These represent 7.52% of County Kilkenny’s
population. This figure is below the regional and national levels of 8.28% and 9.78% respectively. As Map
21 shows, their distribution across the county is not uniform, with the highest concentrations being around
Kilkenny City and in the West and South-West of the County, where economic activity is more buoyant.
Across the four local authority divisions, ‘other white persons’ are represented in the population as follows:
Castlecomer, 3.91%; Kilkenny City East, 9.45%; Kilkenny City West, 9.22% and Piltown, 7.10%. The CSO
uses the following classifications in respect of other ethnicities: ‘Black’ or ‘Black Irish,’ ‘Asian or Asian
Irish’ and ‘Other.’ In County Kilkenny, 2,644 people classify themselves as belonging to one of these. This
equates to 2.74% of the county’s population. As Map 23 clearly shows, Black and Black Irish persons are
predominantly concentrated in and around the main urban centres – Kilkenny City and Ferrybank. Asian
and Asian Irish persons are also more likely to reside in urban and peri-urban areas, although as Map 24
shows, they are more widely dispersed across the county than are Black and Black Irish persons. Areas
such as Urlingford, Johnstown, Thomastown, Callan and Kilmogany also have notable numbers of Asian
and Asian Irish persons. The CSO category in respect of ‘Other Ethnicities’ encompasses, among others,
those from The Americas and Oceania. As Map 25 shows, these are more likely to reside in the urban areas
and adjoining communities, and they are more prevalent generally in the north, rather than in the south of
the county.
The data presented here in respect of ethnicity and the spatial distribution of ethnic minorities across County
Kilkenny are important in enabling agencies to make decisions regarding the direction of interventions.
As non-Irish nationals may face barriers in accessing services, and as prejudices and intolerance are,
unfortunately, features of our society, interventions need to focus on working with host communities, as
well as with newcomers. One of the most constructive ways in which agencies and communities can
better engage with newcomers and support them is through acknowledging Ireland’s current and growing
linguistic diversity and through taking concrete steps to promote multi-lingualism; through staff training,
the translation of information material and the provision of adequate interpretation services. As the
following table shows, there are over 9,000 people, in County Kilkenny, who speak a language other than
Irish or English at home:
Table 8: Languages other than Irish or English, spoken in County Kilkenny, by Local Authority Area,
20169.
Other
LA Area Polish French Lithuanian (incl. not Total
stated)
Castlecomer 179 193 18 540 930
Kilkenny City East 982 274 141 1,574 2,971
Kilkenny City West 749 284 142 1,985 3,160
Piltown 648 209 124 1,090 2,071
Total 2,558 960 425 5,189 9,132
Polish-speakers represent the single largest foreign-language community in County Kilkenny, with French-
speakers being the second largest cohort. French-speakers are predominantly of North and West-African
origin, and come to Ireland from counties such as Morocco, Niger and The Congo. The CSO database shows
that there are over two-hundred persons from Africa living in County Kilkenny.
9 The figures presented here are derived from the responses to Question 15 on the Census of Population: Do you speak a language
other than English or Irish at home? Those who respond ‘yes’ to this question are asked to specify the language(s) spoken.
Use of the Irish language is dealt with separately (Question 14). This asks: Can you speak Irish. Those who respond ‘yes’ to
this question are then asked how frequently they use Irish. The data for County Kilkenny reveal that 39% of the population can
speak Irish. However, the majority only use the language occasionally.
12The following table provides further elucidation of Kilkenny’s population in respect of nationality. It shows
that among the non-Irish, Poles represent the single largest nationality, followed by UK nationals and
persons from elsewhere in the EU, most notably Lithuania, Romania and Latvia. The table also reveals
that over one-in-ten cases, foreign nationals have no nationality assigned to them. In many cases, this is
associated with a person being stateless or having been born in a State that has failed to recognise his / her
nationality e.g., Kurds (born in Turkey, Syria or Iraq) or Kosovars (born in Yugoslavia or Serbia). Of the non-
Irish nationals resident in County Kilkenny, 1,429 are children, while a further 942 are aged 15 to 24 years.
These represent a sizeable population cohort and one that needs to be represented in all aspects of Irish
life, including community development and local decision-making.
The data presented in the table also suggest that the migration trajectory and experience of children differs
from that of adults. The table shows that children are three times more likely not to have an assigned
nationality. While this may be associated with having parents with two different nationalities, it is also
associated with children coming from societies that are affected by conflict, political instability and scant
regard for the rights of children and minorities.
Table 9: Number of Persons by Nationality and Age Cohort in County Kilkenny10, 2016.
All Ages 0 to 14 15 to 24 25 to 34 35 to 44 45 to 54 55 to 64 65+
French 82 9 12 16 27 14 4 0
German 130 8 28 13 24 28 17 12
Italian 136 23 18 28 32 21 9 5
Latvian 323 67 32 90 79 41 10 4
Lithuanian 402 63 35 145 111 34 11 3
Polish 2,310 416 226 693 694 181 81 19
Romanian 377 48 40 133 107 39 9 1
Spanish 100 15 16 34 26 7 2 0
UK 2,122 128 195 196 337 522 336 408
Other EU28 1,051 139 111 256 359 120 48 18
Other European 106 6 8 36 33 9 10 4
African 232 45 38 55 67 19 3 5
Indian 74 15 0 19 27 11 1 1
Other Asian 389 58 52 120 88 46 19 6
American (US) 130 17 16 20 19 24 16 18
Brazilian 54 6 8 17 15 6 1 1
Other American 45 4 4 9 11 8 2 7
Other nationalities 156 39 19 19 47 21 5 6
Not stated 972 323 84 94 101 100 82 188
TOTAL 9,191 1,429 942 1,993 2,204 1,251 666 706
The following bar graph illustrates the significance of European nationalities among younger age cohorts.
10 Due to confidentiality reasons, the CSO does not provide any breakdown of these data below county level.
13Sociodemographic Statement
Fig. 2: Nationality Groupings by Age Cohort in County Kilkenny, 2016
The following pages present demographic and socio-economic data in respect of the five themes
set out in the national policy framework – Better Outcomes, Brighter Futures.
Thematic Analysis
In line with the five themes set out in national policy, this Socio-Economic and Demographic Statement
presents data and analysis under the following headings: Health; Education; Safety; Financial Security; and
Support and Participation.
3.2 Health
This section draws on data from multiple sources, including The Census of Population, other CSO databases,
the Health Service Executive (HSE), Tusla – the Child and Family Agency and the Department of Social
Protection.
The Census of Population includes three questions on health-specific variables. These include self-
assessment of health status, disability and care giving. On the first of these, respondents indicate how
they perceive their health on a Likert scale, ranging from ‘Very Good’ to ‘Very Bad.’ The vast majority of
people regard their health as being either ‘Very Good’ or ‘Good,’ with younger people and those living in
rural areas most likely to do so. Persons in County Kilkenny are more likely to make a positive assessment
of their health than are those in the rest of the South-East Region. The percentage of persons who regard
their health as ‘Very Good’ or ‘Good’ is as follows: Kilkenny, 90.36%; Carlow, 89.25%; Waterford, 89.79%
and Wexford 89.01%. Just under one-in-ten persons in County Kilkenny (9.64%) regards their health to be
‘Fair,’ ‘Bad’ or ‘Very Bad.’ This compares with the rest of the region as follows: Carlow, 10.75%; Waterford,
10.21% and Wexford, 10.99%. Map 26 shows the spatial distribution of persons with relatively poor health.
Such persons are more prevalent in the north, rather than in the south of the county, with the largest
concentration being in the Castlecomer area. The following table lists the ten EDs with the highest levels
of self-declared poor health status:
14Table 10: Percentage of Persons whose Self-Declared Health Status is ‘Fair,’ ‘Bad’ or ‘Very Bad’ in
selected ED in County Kilkenny, 2016.
ED % ED %
Boolyglass 15.67% Castlecomer 13.16%
Goresbridge 14.88% Moneenroe 13.15%
Scotsborough 14.20% Kilkenny No. 1 Urban 13.13%
Freshford 13.62% Pollrone 13.06%
Kilkenny No. 2 Urban 13.24% Clogh 12.54%
As later sections of this profile demonstrate, poor health in these locations is likely to be associated with
economic deprivation, as much as with having an older population.
The Census of Population data also reveal that there are 13,332 persons with a self-declared disability in
County Kilkenny. The majority are aged over 65 years, and their disabilities are generally due to reduced
mobility. Maps 27 and 28 present the spatial distribution of persons with a disability. Map 27 shows the
absolute distribution, with a clustering effect in and around the main population centres. Map 28 deals
with proportionality, and reveals that the areas with the highest proportions of persons with disabilities are
in the northeast of the county, and specifically in Castlecomer, Clough and Moneenroe. In addition, the
following areas emerge as having proportions of persons with disabilities that are notably above the county
and regional average: Kilkenny City, Callan, Johnstown, Freshford, Thomastown and Goresbridge. As the
map shows, the proportion of persons with a disability is higher in the north than in the south of the county,
with Mooncoin and Kilmacow the only areas in the south with above average levels.
The following table presents specific data on children and young people with disabilities. It shows that
there are 1,137 children with a disability. The proportion of teenagers and young adults with a disability is
considerably higher than among children.
Table 11: Types of Disabilities among Children and Young People in County Kilkenny, 2016.
0 - 14 years 15 to 19 20 to 24
Total persons 21,766 6,548 4,663
Total persons with a disability 1,137 627 418
% with a Disability 5.2% 9.6% 9.0%
Blindness or a serious vision impairment 68 33 29
Deafness or a serious hearing impairment 81 31 24
A condition that substantially limits one or more basic physical activities 206 77 60
An intellectual disability 354 173 119
Difficulty in learning, remembering or concentrating 572 320 167
Psychological or emotional condition 244 158 127
Other disability, including chronic illness 362 170 124
Difficulty in dressing, bathing or getting around inside the home 304 72 51
Difficulty in going outside home alone 333 147 87
Difficulty in working or attending school/college 293 212 145
Difficulty in participating in other activities 367 186 112
Total disabilities 3,184 1,579 1,045
15Sociodemographic Statement
Among children and young people, the most prevalent form of disability is ‘difficulty in learning, remembering
or concentrating.’ In responding to this, agencies with a brief in mental health and psychological services
have a particularly important role to play. Support groups and community-level interventions may also be
beneficial, particularly for parents / guardians. As the data in the table show, the number of disabilities is
almost three times that of children, thus revealing that several children have multiple forms of disability.
Therefore, they may need access to multiple and varied types of support, and in such scenarios, inter-
agency collaboration, including information sharing and the application of a holistic and family-centred
approach, are essential.
Map 29 shows the spatial distribution (in absolute numbers) of carers across County Kilkenny. The pattern
here is very similar to that shown in respect of persons with disabilities, with the clustering focusing on
the main population centres. There are 4,321 carers in the county, of whom thirty-nine percent are male
and sixty-one percent are female. The proportion of males devoting themselves to caring duties has been
increasing steadily over recent decades.
Tusla, The HSE and medical practitioners provided specific data in respect of general health and the health of
children and young people, all of which have informed the CYPSC strategy, and many of which are presented
in this profile. These include data on giving birth, breastfeeding, immunisation and children’s use of, and
access to medical services and health-related supports. These reveal a high, but declining birth rate,
the rising age of mothers, challenges associated with promoting immunisation and persistent structural
issues in respect of access to some services. There are also gaps in respect of health service data, not
least mental health services. This may be associated with, among other factors, recording systems and the
sensitivities associated with data protection.
Childbirth, Babies and Infants
As the following graph shows, the number of persons born in Kilkenny (as defined by mothers being
domiciliary in the county) increased considerably from the mid-1990s to 2010, but has fallen every year
since then. This is reflective of the national trend.
Fig. 3: Number of Babies Born to Mothers resident in County Kilkenny, 1985 – 2016.
County Kilkenny also reflects the national trend in respect of the increased age of mothers. The following
graph shows the rise year-on-year since the mid-1980s. Over a thirty-year period, the mean age for mothers
giving birth has increased from 29.5 years to 32.9 years. During the same timeframe, the mean age of first-
time mothers increased from 26.7 years to 31 years.
16Fig. 4: Average Age of All Mothers and First-Time Mothers in County Kilkenny, 1985 – 2016.
While the average age of mothers is rising, teenage births remain a reality. Last year (2017), there were
nine births to mothers aged 17 or younger. This represents a rate of 7.4 per 1,000, and is well in excess of
the national rate of 4.6 per 1,000.
In Ireland, most babies (64.1%) have a birthweight of between 3.5 and 4kg. Unfortunately, due to a range of
factors, some of which are linked to the mother’s health and wellbeing, a number of babies have particularly
low birth weights. The percentage of babies born weighing less than 2.5kg (live and still births), in 2015 in
County Kilkenny was 5.1%. This is below the national average of 5.9%.
Ireland has a poorly developed domiciliary homebirth service, and as a result, the proportion of babies born
at home is well below that in other European countries. In The Netherlands, for example, one-third of
babies are born at home. Yet in County Kilkenny there were just eight home births in 2017, the same as in
2016, but up from just two home births in 2015.
Systematic efforts by the HSE and Department of Health have resulted in Ireland having high levels of baby /
infant screening. On average, ninety-five percent of babies in Community Healthcare Organisation (CHO511),
which includes County Kilkenny, are screened by the time they reach ten months. Kilkenny has a slightly
above average success rate in respect of Public Health Nurse visits to mothers; the percentage new-born
babies visited by a PHN within 72 hours of hospital discharge is 99.7% in Carlow/ Kilkenny, compared with
97.5% nationally.
The following table shows that the majority of babies are being breastfed when they and their mothers are
discharged from hospital. While this has, thanks to positive promotion by health professionals and mothers
themselves (e.g., via La Leche League), the levels remain well below the norms in other OECD countries.
Table 12: Percentage of Infants who were Breastfed (either exclusively or combined) on Discharge from
Hospital, 2015.
Exclusive Combined Total
Ireland 47.7% 10.3% 58.0%
Kilkenny 57.6% 0.7% 58.3%
11 Community Healthcare Organisation (CHO) 5 includes Counties Waterford, Wexford, Carlow, Kilkenny, and South Tipperary.
17Sociodemographic Statement
Children’s Engagement with Healthcare Providers
Levels of immunisation among school-aged children in County Kilkenny are similar to those for Ireland as
a whole, and while they are high relative to many other countries, they remain somewhat below the World
Health Organisation (WHO) target of 95% per cohort. As the following table shows, rates are highest in
respect of the MMR (Measles, Mumps and Rubella) and 4-in-1 vaccines, with rates approximating universal
coverage. Rates also exceed ninety percent in respect of the TDAP (Tetanus, Diphtheria and Pertussis) and
Men C (Meningococcal C) vaccines, although as the following table shows, there has been a slight decline in
uptake year-on-year between 2015/16 and 2016/17. However, as the table clearly shows, the lowest uptake
rates and the greatest levels of decline are manifest in respect of the HPV (Human Papilloma Virus) vaccine.
These are associated with parental concerns regarding side effects and adverse publicity surrounding the
vaccine. The table shows a fall-off in uptake from the first to the second HPV dose, as well as the decline
over time. This is not just a Kilkenny phenomenon. It is prevalent across Ireland and beyond12.
Table 13: Levels of Immunisation among Primary and Second-Level School Pupils in County Kilkenny,
2015 – 2017.
2015 /2016 2016/2017
Primary School
HPV Dose 1 88.1% HPV Dose 1 61%
HPV Dose 2 80.6% HPV Dose 2 54%
Tdap 93.3% Tdap 92%
Men C 92.4% Men C 90%
Secondary School
MMR 97.4% MMR 96.1%
4-in-1 97.3% 4-in-1 96.5%
Children are more frequent users of hospitals than are adults aged up to 60 years. The following table
presents the data for County Kilkenny in respect of children’s discharges from hospital.
Table 14: Children’s and Infants’ Interactions with Hospital and Other Health Services13
in County Kilkenny, 2015.
Type of Service Interaction Number of Children
Hospital Discharges 3,211 or 128.4 per 1,000 children
Hospital Discharges with a Diagnosis of ‘External Causes’ 293 or 11.7 per 1,000 children
Admissions to Psychiatric Hospital 6
Self-harm Admissions 341 or 2.8 per 1,000
The following are the 2015 levels of particular service registrations in comparative context:
Registrations County Kilkenny Ireland
Children Registered with a Physical or Sensory Disability 189 or 7.6/ 1,0001 6,230 or 5.4 /1,000
Children Registered with an Intellectual Disability 179 or 7.2 / 1,000 9,066 or 7.9 / 1,000
12 Reports from HSE staff indicate that there is a slight increase (to about 60%) this year – locally and nationally.
13 The numbers presented in the table refer to number of interactions (e.g., discharges), rather than number of children.
Discharges refer to in-patient and day cases.
18You can also read