Naselle-Grays River Valley - Risk and Protection Profile for Substance Abuse Prevention in
←
→
Page content transcription
If your browser does not render page correctly, please read the page content below
Risk and Protection Profile
for Substance Abuse Prevention in
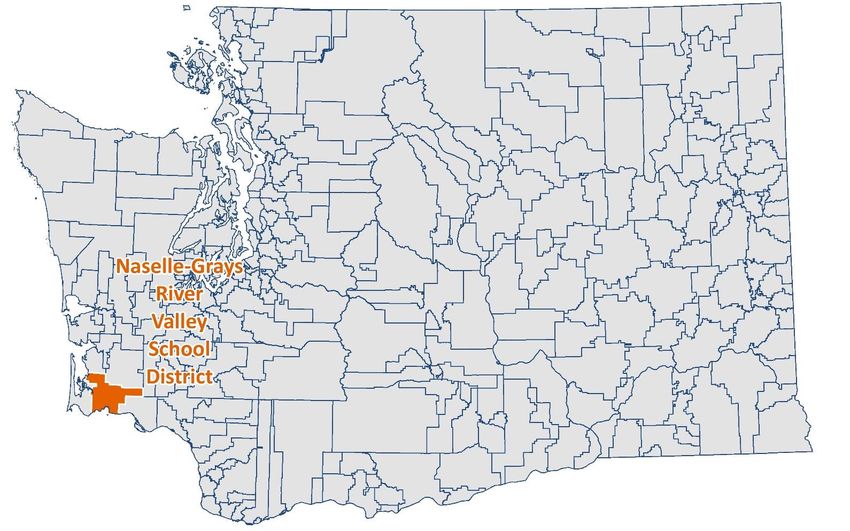
Naselle-Grays River Valley
Pacific County
Getty Images/Purestock
Jul 2021
4.53-25153:2021
4.53-25153:2021
Aaron Starks, MA, Irina V. Sharkova, PhD
David Mancuso, PhD
In conjunction with the
Washington State Health Care Authority
Division of Behavioral Health and Recovery
Michael Langer, Deputy Director
Research and Data Analysis Division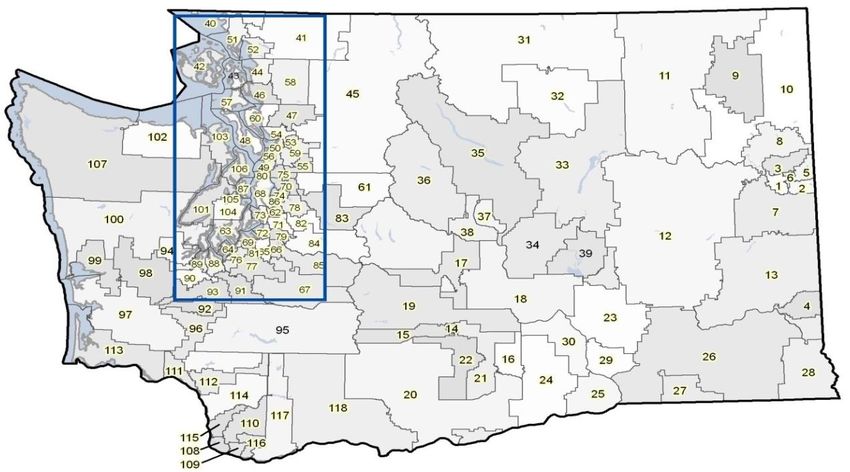
These tables provide a comprehensive update of data published in previous Profiles. They are among the timeliest data available to
planners for understanding the risks of substance abuse among youth in their communities. Community, family, peer, and school-
related factors are presented within the Hawkins and Catalano risk and protective factor framework that is used by many substance
abuse prevention planners across the country.
For more information about the data, framework, definitions, and other topics, see the 1997 Profile on Risk and Protection for
Substance Abuse Prevention Planning in Washington State, (Report 4.15-40). That report and subsequent years’ Profiles are available
on the RDA website at: https://www.dshs.wa.gov/ffa/rda/core-profile-archive.

              Naselle-Grays River Valley

Table of contents:
              Cover page
              Introduction
              Interpreting Indicator Profiles:
              Interpreting Annual Trend Charts:
              Indicator Comparison Profiles: (A comparison of standardized five-year rates at county,
                                                         locale, and school district levels by domain, factor, and indicator)
                           1. Indicator Profile 1
                           2. Indicator Profile 2
                           3. Indicator Profile 3
                           4. Indicator Profile 4

              Community:
                             5. Availability of Drugs
                             7. Extreme Economic & Social Deprivation
                             11. Transitions & Mobility
                             14. Antisocial Behavior of Community Adults
                             19. Low Neighborhood Attachment and Community Disorganization

              Family:
                             22. Family Problems

              Schools:
                             24. Academic Achievement
                             35. School Climate

              Individual/Peer:
                            38. Early Criminal Justice Involvement

              Problem Outcomes:
                          41. Child and Family Health
                          49. Criminal Justice
                          55. Substance Use

              Appendices
                             59. Technical Notes
                             71. Understanding Locales
                             74. Populations Subtracted for Police Agencies not Reporting Arrests to UCR
                             75. Police Agencies that did not Report Arrests to UCR

July, 2021 Notes:
Unexcused Absences is included in this report through 2017 but is no longer being updated.
Regular Attendance replaces Unexcused Absences moving forward. Five years of data are now available.

                                                                                                                                i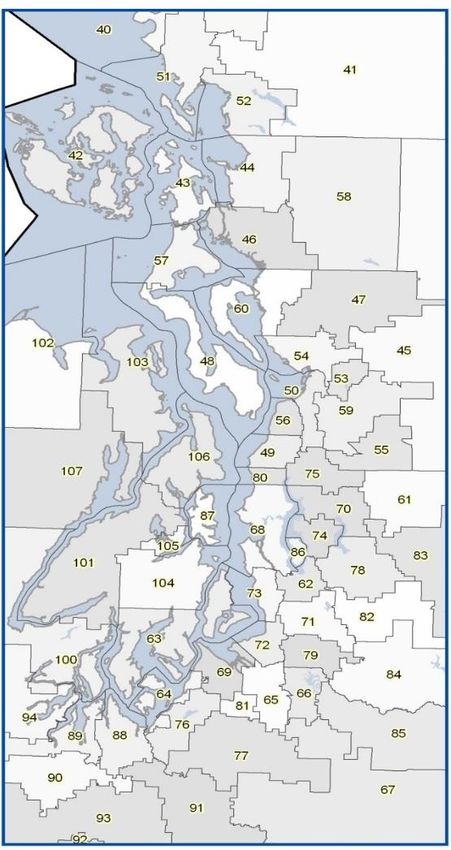
Community Definition

This school district is associated with the county in which it is primarily located and the locale(*) to which the district has been assigned.
A locale covers an area large enough to provide a stable population for rates and minimize the choppiness caused by small number
issues. The locale and the district areas are the same for districts of sufficient size. For districts too small to get reliable rates for
analysis, the locale grouping can provide a helpful picture of your community's change over time and a way to compare your area to
other larger districts. Your locale contains the districts most like your district which share your geographic area, in essence, your
neighbors in the prevention effort. (*) To learn more about locales, see Technical Notes, section/tab "Understanding Locales."

                                                                                         School District: Naselle-Grays River Valley
                                                                                                County: Pacific County

Locale 113             113
                                                                                113                                  District        Total Locale
  County District                                                                                                   Population       Population
      Code                              School District                                   County                  (Census 2010)     (Census 2010)
25153                  Naselle-Grays River Valley S.D.                          Pacific County                              2,235             15,466
25169                  Ocean Beach S.D.                                         Pacific County                             10,082
35271                  Wahkiakum S.D.                                           Wahkiakum County                            3,149

      Washington State Department of Social and Health Services
      Research and Data Analysis,
      Community Outcome and Risk Evaluation Geographic Information System (CORE-GIS). County Reports, Jun 2021.                              ii
Interpreting Indicator Profiles

         The Indicator Profile compares rates for County, Locale, and School District to the state. The Profile displays
         standardized scores to allow comparison between indicators. See Technical Notes for a definition of a standardized
         score.

         Domain/Factor               Indicators                                         VALUES ON THIS PAGE ARE EXAMPLE DATA
                                                                                           USED FOR DISPLAY PURPOSES ONLY
         Community Domain                                                              My County      My Locale     My District

         Availability of Drugs       Alcohol Retail Licenses                                           -0.25
                                                                                                                 0.56
                                                                                                                0.32
                                     Tobacco Retail and Vending                                        -0.26
         Availability of Drugs
                                     Machine Licenses                                                              1.06
                                                                                                                 0.51
         Extreme Family              Food Stamp Recipients                                            -0.54
         Economic Deprivation        (All Ages)                                                                      1.20
                                                                                                                     1.12
                                     Temporary Assistance to Needy
         Extreme   Family titles
             Hyperlinked                                                                             -0.82
                                     Families (TANF), Child
         Economic    Deprivation
              will take you to                                                                                       1.29
                the annual
                                     Recipients
                                                                                                                     1.31
              indicator data.
         Extreme  Family
                (Excel only)
                                     Unemployed Persons             (Age                               -0.22     Some Indicators are
         Economic Deprivation        16+)                                                                        only available at the
                                                                                                                 county level
         Transitions and                                                                              -0.75
                                     Net Migration
         Mobility

         Transitions and                                                                               -0.12
                                     Existing Home Sales
         Mobility

         Transitions and                                                                              -0.71
                                     New Residence Construction
         Mobility                                                                How to read this chart:
                                                                                 The center line represents the
         Antisocial Behavior of                                                  state rate for each measure.
                                                                                                       -0.14 The
                                     Alcohol- or Drug-Related Deaths             bars show the difference  above
                                                                                                       -0.04
         Community Adults                                                        or below the state rate.
                                                                                                       -0.03

                                                                                                       -0.22
                                     Clients of State-Funded Alcohol
         AOD Problems                                                                                           0.34
                                     or Drug Services (Age 18+)                                                 0.20
                                                                                State rate
                                                                                                                Interpretation: My district
              Each risk factor is                                              My County            -1.24
                                     Arrests, Alcohol-Related (Age                                              has a lower rate of Alcohol-
              described by 1 to                                                My Locale             -1.07
                                     18+)                                                                       Related Arrests(18+) than
                   8 indicators                                                My District          -1.16       the state as a whole and is
                                                                                                      -0.63     similar to the county and
                                     Arrests, Drug Law Violation (Age                                           locale
                                                                                                                  0.76 rate.
         AOD Problems
                                     18+)                                                                        0.57

                                                                                                                     1.47
                                     Arrests, Violent Crime                                                                 3.67
                                     (Age 18+)                                                                              3.76

                                                                            lower                       state rate                       higher

Washington State Department of Social and Health Services
Research and Data Analysis,
Community Outcome and Risk Evaluation Geographic Information System (CORE-GIS). County Reports, Jun 2021.                                      iii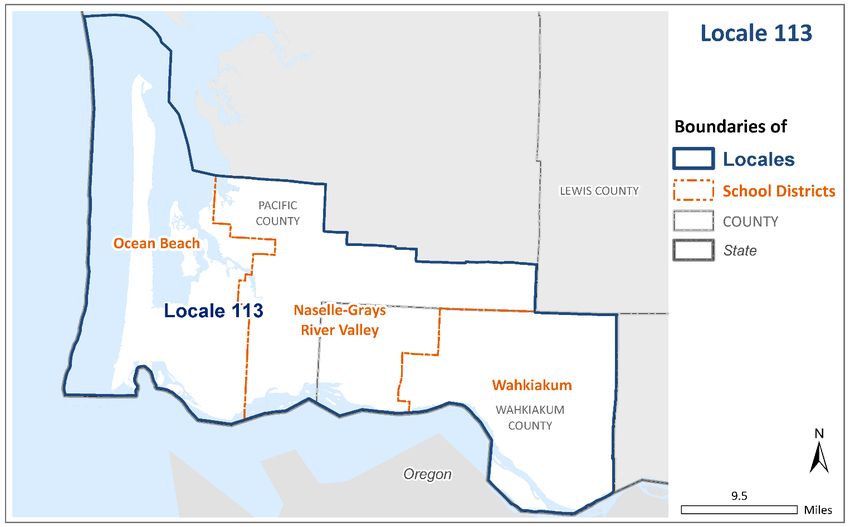
Interpreting Trend Charts

                                       Understanding the CORE Trend Charts and Tables
The presentation of risk factor data in the CORE reports is organized by domain (Community, Family, School, and Individual/Peer)
and by risk factor within domains. Each risk factor may include one or more indicators

These data are reported by school district with comparisons to the county and locales for that district. Locales are single school
districts or groups of school districts. If school districts are grouped into a single locale, the following rules were used:
   i. The total population within the grouping had to be at least 20,000 people.
  ii. The school districts grouped were part of a single Educational Service District.
  iii. The school districts grouped were similar in character (for example, they had similar proportions of students
       receiving school lunches).

To see the school districts included into your locale, go to the tab "Community Definition." You may want to check out CORE
reports prepared for these school districts and their counties.

Please note these IMPORTANT ISSUES:

If viewing the report as an XLSX, the worksheet tabs are labeled with the name of the risk factor. Each risk factor may in turn
include several indicators. Be sure to scroll down the worksheet page to review all of the available indicators for a given risk
factor. The workbook is designed to print with one indicator on each page.

If viewing the report as a PDF, the risk factor is listed in the page heading. Each indicator is displayed on a separate page. There
may be several pages of indicators for a given risk factor.

Understanding the chart scales:

Users should be careful to interpret the chart scales correctly. The chart scales are automatically adjusted to enhance differences
between the indicators. Users should consider whether the differences they observe between geographic areas or across years
are significant. The unit of measurement is displayed at the left of each chart scale. Often the unit of measurement is a rate
expressed as the number of events or a count of individuals per 100 population (or, "percent"), or sometimes per 1,000 or
100,000 population.

Review the example:

On the following page (below, scroll down) is an example indicator for Alcohol Retail Licenses in "Your District" . The number of
alcohol retail licenses is expressed as a rate per 1,000 population.

   Washington State Department of Social and Health Services
   Research and Data Analysis,
   Community Outcome and Risk Evaluation Geographic Information System (CORE-GIS). County Reports, Jun 2021.                           iv
Interpreting Trend Charts
Each risk factor may include several indicators, so remember to page down. For example, the risk factor Availability of Drugs has
two indicators: Alcohol Retail Licenses (shown below) and Tobacco Retail And Vending Machine Licenses
Back to Table of Contents Hyperlinks will take you back to the Table of
Contents or to the Indicator Profile page.
(Excel only)
Go To Standardized Five-Year Rate Indicator Comparison Profile
Alcohol Retail Licenses
7
Pay close attention to these scales. The differences between the rates
6 may appear more or less important depending on the scale used.
Rate Per 5
1,000
4
This is the factor. 3
Different rates use
different factors- 2
some per 100
1
(percent), 1,000 or
100,000. 0
My School District Locale 999 Cascadia County State
2008 2009 2010 2011 2012 2013 2014 2015 2016 2017 2018 2019
State 1.55 1.67 1.89 1.90 2.03 2.05 2.07 1.91 1.89 1.78 1.66 1.59
Cascadia County 2.12 2.06 2.03 2.01
A suppression code is listed for suppressed rates. 1.96
2.01 2.01 2.00 1.98 1.91 1.91 1.91
Locale 999 3.27 3.12 NR 3.08 2.98 3.00 2.96 2.88 2.77 3.17 3.17 3.17
These codes are explained in Technical Notes.
My School District 5.08 5.23 NR 5.22 5.29 5.35 4.86 4.99 4.32 5.93 5.85 5.89
Be aware that these values do not indicate a zero value.
Licenses 32 34 35 36 37 38 35 35 31 43 43 43
All Persons 6,295 6,497 6,703 6,899 7,000 7,103 7,198 7,012 7,177 7,250 7,350 7,298
Note: The rates are the annual number of alcohol retail licenses active during the year, per 1,000 persons Each indicator
(all ages). Retail licenses include restaurants, grocery stores, and wine shops but do not include state liquor graph is followed by
stores and agencies. Retail alcohol facilities on military bases and reservations are not licensed by the State data source and
and therefore are not included in these data. Policies on licensing distributors, taxing the proceeds, and rate definitions as
determining who can sell alcohol varies substantially from state to state. Consequently, there is no well as any special
consistent comparable source for national data. Data from 1999 to present is now geocoded from the facility information for the
address, rather than apportioned from zip code. This results in a more accurate, but different data total per data.
county.
State Source: Washington State Liquor Control Board, Annual Operations Report
Population Estimates: Washington State Office of Financial Management, Forecasting Division
Rate Formula
Rate = (numerator / denominator) x factor
When the data source for this Example in 2008: (32 / 6,295) x 1,000 = 5.08
measure was last updated. Read the rate as 5.08 licenses per 1,000 people.
Updated
1/27/2020
Washington State Department of Social and Health Services
Research and Data Analysis, v
Community Outcome and Risk Evaluation Geographic Information System (CORE-GIS). County Reports, Jun 2021.Standardized Five-Year Indicator Profile
Domain/Factor Indicators Pacific County Locale 113 Naselle-Grays River Valley
Community Domain 1.10
1.73
Availability of Drugs Alcohol Retail Licenses 0.42
0.96
Extreme Family Economic Tobacco Retail and Vending 1.18
Deprivation Machine Licenses 0.66
1.40
Extreme Family Economic Supplemental Nutritional
0.89
Deprivation Assistance Program (SNAP) -0.22
Temporary Assistance to Needy 1.72
Extreme Family Economic 1.40
Families (TANF),
Deprivation -0.27
Child Recipients
1.54
Unemployed Persons
(Age 16+)
1.35
Free or Reduced Price Lunch 0.62
Transitions and Mobility
Eligibility -0.01
0.21
Transitions and Mobility Net Migration
1.87
Transitions and Mobility Existing Home Sales
Antisocial Behavior of 0.57
New Residence Construction
Community Adults
Antisocial Behavior of -1.32
Alcohol- or Drug-Related Deaths -0.91
Community Adults
Clients of State-Funded Alcohol or 1.55
Antisocial Behavior of
Drug Services 0.63
Community Adults -0.14
(Age 18+)
Arrests, Alcohol-Related -1.15
-1.37
(Age 18+)
Antisocial Behavior of Arrests, Drug Law Violation -0.11
-0.12
Community Adults (Age 18+)
Arrests, Violent Crime -0.92
-0.77
(Age 18+)
lower state rate higher
Washington State Department of Social and Health Services
Research and Data Analysis,
Community Outcome and Risk Evaluation Geographic Information System (CORE-GIS). County Reports, Jun 2021. 1Standardized Five-Year Indicator Profile
Domain/Factor Indicators Pacific County Locale 113 Naselle-Grays River Valley
Community Domain (continued)
Low Neighborhood 0.64
Prisoners in State Correctional
Attachment and
Systems (Age 18+)
Community Disorganization
-0.80
Population Not Registered to Vote
-0.53
Registered and Not Voting in the
November Election
Family Domain -1.66
Family Problems
Divorce
Victims of Child Abuse and Neglect in 1.24
2.35
Accepted Referrals 0.48
School Domain
Academic Achievement 0.83
Poor Academic Performance, Grade 0.27
10 (Age 15) -0.02
1.03
Poor Academic Performance, Grade 0.40
7 (Age 12) -0.29
Poor Academic Performance, Grade 1.19
0.76
4 (Age 9) 0.71
High school Cohort (Cumulative) 0.62
Academic Achievement -0.96
Dropouts -1.44
1.91
Annual (Event) Dropouts 2.41
6.48
Academic Achievement: 0.00
On-time Graduation 0.51
Protective Factors -0.43
-1.22
Extended Graduation 0.98
-1.44
lower state rate higher
Beginning with the Dec. 2015 report series, On-time and Extended Graduation are shown as protective factors. In previous reports, standardized rates
above indicated a negative factor: risk of not graduating (see Technical Notes for details).
Washington State Department of Social and Health Services
Research and Data Analysis,
Community Outcome and Risk Evaluation Geographic Information System (CORE-GIS). County Reports, Jun 2021. 2Standardized Five-Year Indicator Profile
Domain/Factor Indicators
Pacific County Locale 113 Naselle-Grays River Valley
School Domain (Continued)
School Climate -1.27
Weapons Incidents at School -1.23
-0.72
Unexcused Absence -1.11
Replaced by Regular Attendance -1.19
-0.91
Regular Attendance
-0.23
(Protective Factor)
-0.38
New Jul-2020 0.34
Individual/Peer Domain
Early Criminal Justice -0.31
Arrests, Alcohol- or -0.17
Involvement Drug-Related (Age 10-14)
-0.27
Arrests, Vandalism (Age 10-14) -0.08
-0.47
Total Arrests (Age 10-14) 0.25
Problem Outcomes
0.20
Child and Family Health -1.98
Child Injury and Accident Hospitalizations
2.18
Infant Mortality (Under 1 Year) -0.02
0.16
Child Mortality (Ages 1-17) -0.95
-0.58
0.75
Births to School-Age (10-17) Mothers -0.03
-0.87
-0.45
Sexually Transmitted Disease Cases (Birth-
19)
-0.60
Suicide and Suicide Attempts (Age 10-17) -0.93
-0.99
1.18
Low Birth Weight Babies 3.03
0.81
Women Injury and Accident 0.92
Hospitalizations 0.41
lower state rate higher
Washington State Department of Social and Health Services
Research and Data Analysis,
Community Outcome and Risk Evaluation Geographic Information System (CORE-GIS). County Reports, Jun 2021. 3Standardized Five-Year Indicator Profile
Domain/Factor Indicators Pacific County Locale 113 Naselle-Grays River Valley
Problem Outcomes
-0.71
-0.24
Offenses,
Criminal Justice Domestic Violence
Criminal Justice -0.73
-0.02
Total Arrests,
(Age 10-17)
Criminal Justice -0.84
-0.75
Arrests, Property Crime
(Age 10-14)
Criminal Justice -0.67
-0.13
Arrests, Property Crime
(Age 10-17)
Criminal Justice -1.28
-0.72
Arrests, Property Crime
(Age 18+)
Criminal Justice -1.44
-0.72
Arrests, Violent Crime
(Age 10-17)
-0.19
Alcohol-Related Traffic Fatalities
Substance Use Per All Traffic Fatalities
-0.37
-0.41
Note: Check other Domains Arrests, Alcohol Violation
for substance use of (Age 10-17)
community adults and -0.21
early teens. -0.14
Arrests, Drug Law Violation
(Age 10-17)
Substance Use 3.42
Clients of State-Funded Alcohol or 2.77
Drug Services 1.99
(Age 10-17)
lower state rate higher
Washington State Department of Social and Health Services
Research and Data Analysis,
Community Outcome and Risk Evaluation Geographic Information System (CORE-GIS). County Reports, Jun 2021. 4Community Domain: Availability of Drugs
Alcohol Retail Licenses
6
5
Rate Per 4
1,000
3
2
1
0
Naselle-Grays River Valley Locale 113 Pacific County State
2009 2010 2011 2012 2013 2014 2015 2016 2017 2018 2019 2020
State 1.98 2.15 2.03 2.22 2.20 2.23 2.21 2.15 2.14 2.07 2.11 2.08
Pacific County 4.65 4.92 4.40 4.67 4.67 4.65 4.77 4.11 3.96 3.32 3.56 3.62
Locale 113 4.88 4.98 4.41 4.51 4.51 4.49 4.47 3.89 3.79 3.62 4.05 4.13
Naselle-Grays River Valley2.70 2.68 2.67 2.67 2.66 2.70 2.71 2.25 2.24 2.65 2.64 3.04
Licenses 6 6 6 6 6 6 6 5 5 6 6 7
All Persons 2,224 2,235 2,249 2,246 2,258 2,221 2,211 2,218 2,236 2,262 2,274 2,304
Note: The alcohol retail licenses active during the year, per 1,000 persons (all ages). Retail licenses include on-premises
consumption such as restaurants, taverns, bars and off-premises vendors such as grocery stores, liquor stores and deli marts.
Retail locations with multiple privileges, such as a grocery store with both spirits and beer/wine privileges, are only counted once.
Retail alcohol facilities on military bases and reservations are not licensed by the State and therefore are not included in these
data. Non-retail licensees, such as distributors, distillers, and wineries are not included.
Effective March 1, 2012, Initiative 1183 privatized liquor sales in Washington State. Prior to privatization, the sale of spirits was
limited to 330 liquor stores regulated by the LCB, none of which were included in the data. This change may account for minor
shifts at smaller geographies as local markets adjusted to those store closures or their conversion to privately-run businesses
which were then counted in this report. Adding the sale of spirits to existing licensees who had previously been limited to beer
and wine sales would not show up as an increase in the number of licenses.
Policies on licensing distributors, taxing the proceeds, and determining who can sell alcohol vary substantially from state to state.
Consequently, there is no consistent comparable source for national data.
State Source: Washington State Liquor and Cannabis Board, Annual Operations Report
Population Estimates: Washington State Office of Financial Management, Forecasting Division
Updated: 02/03/2021
Washington State Department of Social and Health Services
Research and Data Analysis,
Community Outcome and Risk Evaluation Geographic Information System (CORE-GIS). County Reports, Jun 2021. 5Community Domain: Availability of Drugs
Tobacco Retail and Vending Machine Licenses
3
Rate Per 2
1,000
2
1
1
0
Naselle-Grays River Valley Locale 113 Pacific County State
2009 2010 2011 2012 2013 2014 2015 2016 2017 2018 2019 2020
State 1.00 1.02 1.01 0.94 0.94 0.90 0.89 0.87 0.86 0.82 0.78 0.77
Pacific County 1.58 1.91 1.91 1.67 1.81 1.61 1.60 1.37 1.22 1.26 1.16 1.15
Locale 113 1.43 1.88 1.75 1.55 1.80 1.54 1.53 1.28 1.26 1.37 1.17 1.15
Naselle-Grays River Valley1.35 2.24 2.22 1.78 1.77 1.80 1.81 1.35 1.34 1.33 1.32 1.30
Licenses 3 5 5 4 4 4 4 3 3 3 3 3
All Persons 2,224 2,235 2,249 2,246 2,258 2,221 2,211 2,218 2,236 2,262 2,274 2,304
Note: The tobacco retailer and vending machine licenses active during the year, per 1,000 persons (all ages). Tobacco sales
licenses include tobacco retailer licenses (stores that sell tobacco products), vapor retailers, and tobacco vending machines.
Tobacco retailers on military bases and reservations are not licensed by the State and therefore are not included in these data.
Non-retail licensees, such as tobacco and vapor wholesalers and tobacco and vapor product manufacturers are also excluded. No
source of comparable national data was obtained.
State Source: Department of Health (from the Department of Licensing), Tobacco Prevention Program, Tobacco Statistics
Population Estimates: Washington State Office of Financial Management, Forecasting Division
Updated: 02/03/2021
Washington State Department of Social and Health Services
Research and Data Analysis,
Community Outcome and Risk Evaluation Geographic Information System (CORE-GIS). County Reports, Jun 2021. 6Community Domain: Extreme Family Economic Deprivation
Supplemental Nutritional Assistance Program (SNAP)
40
30
Percent
20
10
0
Naselle-Grays River Valley Locale 113 Pacific County State
2008 2009 2010 2011 2012 2013 2014 2015 2016 2017 2018 2019
State 12.60 15.11 18.00 20.44 21.35 21.45 20.95 19.80 18.58 17.38 16.26 15.09
Pacific County 36.36 20.54 23.54 25.84 27.49 27.95 27.61 27.75 27.48 26.77 25.50 24.07
Locale 113 21.19 19.05 21.39 23.36 24.75 25.40 25.09 25.62 25.48 25.04 24.23 22.84
Naselle-Grays River Valley16.53 16.14 17.00 16.23 16.61 17.80 20.40 15.97 16.55 15.52 14.77 14.86
Recipients 363 359 380 365 373 402 453 353 367 347 334 338
All Persons 2,196 2,224 2,235 2,249 2,246 2,258 2,221 2,211 2,218 2,236 2,262 2,274
Note: Persons (all ages) receiving Supplemental Nutritional Assistance Program (SNAP), formally called food stamps in the fiscal
year, per 100 persons (all ages). Suppression code definitions for yearly rates and a comparison of economic indicators are
explained in Technical Notes.
State Source: Department of Social and Health Services, Research and Data Analysis, Automated Client Eligibility System and
Warrant Roll.
Population Estimates: Washington State Office of Financial Management, Forecasting Division
Updated: 09/15/2020
Washington State Department of Social and Health Services
Research and Data Analysis,
Community Outcome and Risk Evaluation Geographic Information System (CORE-GIS). County Reports, Jun 2021. 7Community Domain: Extreme Family Economic Deprivation
Temporary Assistance to Needy Families (TANF), Child Recipients
20
15
Percent
10
5
0
Naselle-Grays River Valley Locale 113 Pacific County State
2008 2009 2010 2011 2012 2013 2014 2015 2016 2017 2018 2019
State 8.78 9.72 10.28 10.99 9.58 8.25 7.41 6.15 5.58 5.16 4.56 4.16
Pacific County 12.77 14.25 14.29 15.43 14.44 14.58 12.18 10.27 10.29 10.37 8.46 8.22
Locale 113 9.53 12.11 11.77 12.47 11.88 12.83 11.66 9.53 9.69 9.59 8.61 8.13
Naselle-Grays River Valley6.52 9.54 7.63 5.57 4.43 7.35 9.35 3.76 4.81 3.93 4.76 4.18
TANF Children 33 48 38 27 21 35 43 17 22 18 22 19
Children, birth-17 506 503 498 485 474 476 460 452 457 458 462 455
Note: The children (age birth-17) participating in Aid to Families (AFDC/TANF) programs in the fiscal year, per 100 children (age
birth-17). The population used is for the calendar year which ends the fiscal period. Suppression code definitions for yearly rates
are explained in Technical Notes.
State Source: Department of Social and Health Services, Research and Data Analysis, Automated Client Eligibility System and
Warrant Roll.
Population Estimates: Washington State Office of Financial Management, Forecasting Division
Updated: 09/15/2020
Washington State Department of Social and Health Services
Research and Data Analysis,
Community Outcome and Risk Evaluation Geographic Information System (CORE-GIS). County Reports, Jun 2021. 8Community Domain: Extreme Family Economic Deprivation
Unemployed Persons (Age 16+)
14
12
10
Rate Per
8
100
6
4
2
0
State Pacific County
2009 2010 2011 2012 2013 2014 2015 2016 2017 2018 2019 2020
State 8.90 9.61 9.17 8.16 7.01 6.24 5.65 5.43 4.76 4.50 4.25 8.41
Pacific County 12.19 12.77 12.41 11.34 10.66 10.05 9.12 8.30 7.04 6.88 6.93 11.19
Information for this rate is not available for areas smaller than a county.
Note: The persons (age 16 and over) per 100 persons in the civilian labor force. Unemployed persons are individuals who are
currently available for work have actively looked for work, and do not have a job. The civilian labor force includes persons who
are working or looking for work. The monthly numbers are a snapshot in time done approximately the 12th of each month. A
yearly estimate is then produced by averaging the monthly numbers. Historical data has been updated. The last year of data
should be considered preliminary. Suppression code definitions for yearly rates are explained in Technical Notes.
State Source: Employment Security Department, Labor Market and Economic Analysis, County Unemployment File
Updated: 05/21/2021
Washington State Department of Social and Health Services
Research and Data Analysis,
Community Outcome and Risk Evaluation Geographic Information System (CORE-GIS). County Reports, Jun 2021. 9Community Domain: Extreme Family Economic Deprivation
Students Eligible for Free or Reduced Price Lunch
80
70
60
50
Percent
40
30
20
10
0
Naselle-Grays River Valley Locale 113 Pacific County State
2009 2010 2011 2012 2013 2014 2015 2016 2017 2018 2019 2020
State 39.04 42.22 43.75 45.17 45.87 45.50 45.60 44.51 43.49 42.50 43.16 44.34
Pacific County 62.28 60.74 55.85 53.93 57.52 59.67 58.64 67.28 66.67 63.60 64.24 58.84
Locale 113 56.55 58.22 58.18 49.07 48.65 51.23 57.40 56.98 54.37 55.20 60.02 52.84
Naselle-Grays River Valley40.00 39.00 41.25 25.20 21.23 28.30 42.82 43.91 39.16 43.54 44.77 46.03
Eligible Students 166 163 165 160 141 180 179 191 177 192 184 168
Enrolled Students 415 418 400 635 664 636 418 435 452 441 411 365
Note: The students eligible for free or reduced price lunch per 100 students enrolled. Eligibility requirements are discussed in
Technical Notes.
State Source: Office of Superintendent of Public Instruction
Updated: 05/24/2021
Washington State Department of Social and Health Services
Research and Data Analysis,
Community Outcome and Risk Evaluation Geographic Information System (CORE-GIS). County Reports, Jun 2021. 10Community Domain: Transitions and Mobility
Net Migration
20
18
16
14
Rate Per 12
1,000 10
8
6
4
2
0
State Pacific County
2009 2010 2011 2012 2013 2014 2015 2016 2017 2018 2019 2020
State 3.33 1.73 0.85 1.76 4.14 7.10 8.16 12.12 12.72 11.62 11.95 10.90
Pacific County 10.78 7.12 4.07 6.92 6.19 11.33 9.62 5.72 6.83 16.44 18.31 16.55
Information for this rate is not available for areas smaller than a county.
Note: Net migration is the annual number of new residents that moved into an area minus the number of residents that moved
out of an area, per 1,000 persons. The Office of Financial Management estimates annual net migration for twelve months ending
on March 31st of a given year. For example, annual net migration in 2009 refers to the period from April 1, 2008 through March
31, 2009. Previously Net migration was calculated as a 3-year moving average which smooths changes over time. Now, annual
rates, numerators and denominators are based on single-year data.
State Source: Office of Financial Management, Net Migration Data
Updated: 05/26/2021
Washington State Department of Social and Health Services
Research and Data Analysis,
Community Outcome and Risk Evaluation Geographic Information System (CORE-GIS). County Reports, Jun 2021. 11Community Domain: Transitions and Mobility
Existing Home Sales
30
25
20
Rate Per
15
1,000
10
5
0
State Pacific County
2009 2010 2011 2012 2013 2014 2015 2016 2017 2018 2019 2020
State 12.71 12.62 12.92 11.67 13.62 12.89 14.12 15.53 15.53 15.26 14.32 14.38
Pacific County 9.59 10.04 10.05 13.35 17.15 18.97 22.65 24.57 24.96 24.76 25.44 25.67
Information for this rate is not available for areas smaller than a county.
Note: The previously-owned homes sold, per 1,000 persons (all ages). Previously-owned homes sold is rounded to the tens.
Existing homes sold are estimated based on data from multiple listing services, firms that monitor deeds, and local Realtors
associations. Adjustments were made by the data provider to remove refinanced, rather than sold homes from the counts of
sales.
State Source: Washington Center for Real Estate Research, University of Washington. Market Summary Report. Existing Home
Sales.
Population Estimates: Washington State Office of Financial Management, Forecasting Division
Updated: 06/08/2021
Washington State Department of Social and Health Services
Research and Data Analysis,
Community Outcome and Risk Evaluation Geographic Information System (CORE-GIS). County Reports, Jun 2021. 12Community Domain: Transitions and Mobility
New Residence Construction
7
6
5
4
Rate Per
3
1,000
2
1
0
State Pacific County
2009 2010 2011 2012 2013 2014 2015 2016 2017 2018 2019 2020
State 2.55 3.08 1.94 2.42 2.67 2.57 2.80 3.13 3.16 3.19 3.09 3.07
Pacific County 2.40 5.98 5.31 6.20 6.62 2.99 2.93 3.64 4.00 4.39 4.21 4.22
Information for this rate is not available for areas smaller than a county.
Note: The new building permits issued for single and multi-family dwellings, per 1,000 persons (all ages). Each unit in a multi-
family dwelling (for example, each apartment in a building) has a separate building permit.
State Source: Washington Center for Real Estate Research, Washington State University,U.S. Department of Commerce, C-40
Reports
Population Estimates: Washington State Office of Financial Management, Forecasting Division
Updated: 06/08/2021
Washington State Department of Social and Health Services
Research and Data Analysis,
Community Outcome and Risk Evaluation Geographic Information System (CORE-GIS). County Reports, Jun 2021. 13Community Domain: Antisocial Behavior of Community Adults
Alcohol- or Drug-Related Deaths
20
15
Percent 10
5
0
Naselle-Grays River Valley Locale 113 Pacific County State
2008 2009 2010 2011 2012 2013 2014 2015 2016 2017 2018 2019
State 11.68 12.43 12.45 12.70 12.80 10.80 13.12 13.33 13.35 13.74 14.23 14.19
Pacific County 14.77 13.41 12.20 14.17 11.42 9.06 9.74 7.93 14.05 12.70 12.08 13.68
Locale 113 15.58 14.75 15.03 17.82 14.94 9.30 11.56 9.38 12.05 14.14 9.90 14.01
Naselle-Grays River ValleySP SP SP SP SP SP SP SP SP SP SP SP
AOD-related SP SP SP SP SP SP SP SP SP SP SP SP
DeathsCommunity Domain: Antisocial Behavior of Community Adults
Clients of Publicly-Funded Alcohol or Drug Services (Age 18+)
25
20
Rate Per 15
1,000
10
5
0
Naselle-Grays River Valley Locale 113 Pacific County State
2009 2010 2011 2012 2013 2014 2015 2016 2017 2018 2019 2020
State 12.20 11.62 11.22 10.42 10.44 10.67 11.13 10.86 10.31 10.23 10.35 9.69
Pacific County 16.54 18.58 17.27 16.95 15.82 16.97 16.60 21.94 18.18 20.05 13.51 10.52
Locale 113 13.93 17.38 15.96 15.58 12.27 13.47 14.06 19.26 15.37 17.15 10.80 8.06
Naselle-Grays River Valley11.04 13.82 11.34 6.21 8.42 9.65 9.66 12.50 14.06 6.67 7.70 4.89
Admits, 18+ 19 24 20 11 15 17 17 22 25 12 14Community Domain: Antisocial Behavior of Community Adults
Arrests (Age 18+), Alcohol-Related
12
10
8
Rate Per 6
1,000
4
2
0
Naselle-Grays River Valley Locale 113 Pacific County State
2008 2009 2010 2011 2012 2013 2014 2015 2016 2017 2018 2019
State 9.62 9.87 9.31 9.43 7.28 6.71 6.02 5.34 4.92 5.15 5.18 5.36
Pacific County 6.14 6.47 4.57 4.05 1.05 2.90 1.72 1.60 1.49 1.20 1.24 1.28
Locale 113 2.85 2.96 2.92 2.95 0.81 2.73 1.73 2.47 1.42 2.44 0.73 0.93
Naselle-Grays River ValleyUN UN UN UN UN UN UN UN UN UN UN UN
Arrests, 18+
Adjusted Pop 18+
Note: The alcohol violations (age 18+), per 1,000 adults (age 18+). Alcohol violations include all crimes involving driving under the
influence, liquor law violations, and drunkenness. DUI arrests by the Washington State Patrol are included in the state trend
analysis. Denominators are adjusted by subtracting the population of police agencies that did not report arrests to UCR/NIBRS. In
spite of this population adjustment, when the non-reporting police jurisdiction is where much of the crime occurs, the rate will be
lower than it would be if that jurisdiction was included. For percent subtracted, suppression code definitions and the agencies
not reporting, see the Technical Notes and the appendix on Non-Reporting Agencies and Population.
The types of crimes used within this rate are represented in both Summary UCR and NIBRS systems and are not likely to be
substantially impacted by the system change.
State Source: Washington Association of Sheriffs and Police Chiefs (WASPC): Uniform Crime Report (UCR), National Incident-
Based Reporting System (NIBRS)
Population Estimates: Washington State Office of Financial Management, Forecasting Division
Updated: 09/14/2020
Washington State Department of Social and Health Services
Research and Data Analysis,
Community Outcome and Risk Evaluation Geographic Information System (CORE-GIS). County Reports, Jun 2021. 16Community Domain: Antisocial Behavior of Community Adults
Arrests (Age 18+), Drug Law Violation
6
5
4
3
Rate Per
1,000 2
1
0
Naselle-Grays River Valley Locale 113 Pacific County State
2008 2009 2010 2011 2012 2013 2014 2015 2016 2017 2018 2019
State 5.08 4.60 4.39 4.56 2.35 2.23 2.17 2.20 2.44 2.60 2.56 2.78
Pacific County 4.35 3.35 3.58 3.24 0.99 2.15 1.95 2.22 1.94 2.96 2.49 2.12
Locale 113 2.92 2.57 3.00 3.64 1.02 2.23 1.43 2.17 1.87 2.96 2.41 2.00
Naselle-Grays River ValleyUN UN UN UN UN UN UN UN UN UN UN UN
Arrests, 18+
Adjusted Pop 18+
Note: The arrests of adults (age 18+) for drug law violations, per 1,000 adults (age 18+). Drug law violations include all crimes
involving sale, manufacturing, and possession of drugs. Denominators are adjusted by subtracting the population of police
agencies that did not report arrests to WASPC. In spite of this population adjustment, when the non-reporting police jurisdiction
is where much of the crime occurs, the rate will be lower than it would be if that jurisdiction was included. For percent
subtracted, suppression code definitions and the agencies not reporting, see the Technical Notes and the appendix on Non-
Reporting Agencies and Population.
The types of crimes used within this rate are represented in both Summary UCR and NIBRS systems and are not likely to be
substantially impacted by the system change.
State Source: Washington Association of Sheriffs and Police Chiefs (WASPC): Uniform Crime Report (UCR), National Incident-
Based Reporting System (NIBRS)
Population Estimates: Washington State Office of Financial Management, Forecasting Division
Updated: 09/14/2020
Washington State Department of Social and Health Services
Research and Data Analysis,
Community Outcome and Risk Evaluation Geographic Information System (CORE-GIS). County Reports, Jun 2021. 17Community Domain: Antisocial Behavior of Community Adults
Arrests (Age 18+), Violent Crime
2
2
Rate Per 1
1,000
1
0
Naselle-Grays River Valley Locale 113 Pacific County State
2008 2009 2010 2011 2012 2013 2014 2015 2016 2017 2018 2019
State 1.46 1.62 1.57 1.63 1.45 1.51 1.47 1.47 1.52 1.53 1.50 1.56
Pacific County 1.19 1.65 0.82 0.56 0.47 0.93 0.86 0.34 0.57 1.48 0.85 1.23
Locale 113 1.90 1.71 0.63 0.69 0.51 0.81 0.75 0.37 0.97 1.11 0.80 1.22
Naselle-Grays River ValleyUN UN UN UN UN UN UN UN UN UN UN UN
Arrests, 18+
Adjusted Pop 18+
Note: The arrests of adults (age 18+) for violent crime per 1,000 adults (age 18+). Violent crimes include all crimes involving
criminal homicide, forcible rape, robbery, and aggravated assault. Simple assault is not defined as a violent crime. Denominators
are adjusted by subtracting the population of police agencies that did not report arrests to WASPC. In spite of this population
adjustment, when the non-reporting police jurisdiction is where much of the crime occurs, the rate will be lower than it would be
if that jurisdiction was included. For percent subtracted, suppression code definitions and the agencies not reporting, see the
Technical Notes and the appendix on Non-Reporting Agencies and Population.
The types of crimes used within this rate are represented in both Summary UCR and NIBRS systems and are not likely to be
substantially impacted by the system change.
State Source: Washington Association of Sheriffs and Police Chiefs (WASPC): Uniform Crime Report (UCR), National Incident-
Based Reporting
Population SystemWashington
Estimates: (NIBRS) State Office of Financial Management, Forecasting Division
Updated: 09/14/2020
Washington State Department of Social and Health Services
Research and Data Analysis,
Community Outcome and Risk Evaluation Geographic Information System (CORE-GIS). County Reports, Jun 2021. 18Community Domain: Low Neighborhood Attachment and Community Disorganization
Prisoners in State Correctional Systems (Age 18+)
1800
1600
1400
1200
1000
Rate Per 800
100,000 600
400
200
0
State Pacific County
2009 2010 2011 2012 2013 2014 2015 2016 2017 2018 2019 2020
State 400.08 400.37 367.85 401.63 465.69 470.68 522.11 662.04 662.13 696.08 801.12 364.28
Pacific County 383.44 372.85 368.46 605.74 685.98 820.29 839.82 770.14 1139.74 1551.04 1040.56 284.16
Information for this rate is not available for areas smaller than a county.
Note: The adult (age 18 and over) admissions to prison, per 100,000 persons (all ages). Admissions include new admissions, re-
admissions, community custody inmate violations, and parole violations. Counts of admissions are duplicated so that individuals
admitted to prison more than once in a year are counted each time they are admitted. The admissions are attributed to the area
where the conviction occurred. Prisoners being electronically monitored are included in the data. Suppression code definitions
for yearly rates are explained in Technical Notes.
State Source: Department of Corrections, Inmates File.
Population Estimates: Washington State Office of Financial Management, Forecasting Division
Updated: 06/02/2021
Washington State Department of Social and Health Services
Research and Data Analysis,
Community Outcome and Risk Evaluation Geographic Information System (CORE-GIS). County Reports, Jun 2021. 19Community Domain: Low Neighborhood Attachment and Community Disorganization
Population Not Registered to Vote
35
30
25
20
Percent
15
10
5
0
State Pacific County
2009 2010 2011 2012 2013 2014 2015 2016 2017 2018 2019 2020
State 29.66 29.98 29.56 25.55 26.21 27.09 27.18 23.17 24.65 24.27 23.19 17.89
Pacific County 23.72 24.35 23.08 22.59 21.83 24.39 23.13 19.68 18.31 17.06 13.76 8.05
Information for this rate is not available for areas smaller than a county.
Note: The persons not registered to vote in the November elections, per 100 adults (age 18 and over). As part of the November
Current Population Survey (the Voting and Registration Supplement), the Bureau of the Census collects data on voting and
registration in years with presidential or congressional elections (i.e. every other year).
State Source: Office of the Secretary of State, Elections Division, Registered Voters.
Population Estimates: Washington State Office of Financial Management, Forecasting Division
Updated: 04/01/2021
Washington State Department of Social and Health Services
Research and Data Analysis,
Community Outcome and Risk Evaluation Geographic Information System (CORE-GIS). County Reports, Jun 2021. 20Community Domain: Low Neighborhood Attachment and Community Disorganization
Registered and Not Voting in the November Election
70
60
50
40
30
Percent
20
10
0
State Pacific County
2009 2010 2011 2012 2013 2014 2015 2016 2017 2018 2019 2020
State 49.11 28.76 47.05 18.75 54.73 45.84 61.55 21.24 62.90 28.17 54.81 15.89
Pacific County 42.59 23.15 38.55 19.78 47.17 36.85 52.32 20.76 57.42 24.58 50.58 15.04
Information for this rate is not available for areas smaller than a county.
Note: The persons registered to vote in the November elections but not voting, per 100 adults (age 18 and over) registered to
vote. As part of the November Current Population Survey (the Voting and Registration Supplement), the Bureau of the Census
collects data on voting and registration in years with presidential or congressional elections (i.e. every other year).
State Source: Office of the Secretary of State, Elections Division, Registered Voters.
Population Estimates: Washington State Office of Financial Management, Forecasting Division
Updated: 04/02/2021
Washington State Department of Social and Health Services
Research and Data Analysis,
Community Outcome and Risk Evaluation Geographic Information System (CORE-GIS). County Reports, Jun 2021. 21Family Domain: Family Problems
Divorce
6
5
4
3
Rate Per 2
1,000
1
0
State Pacific County
2008 2009 2010 2011 2012 2013 2014 2015 2016 2017 2018 2019
State 4.84 4.89 5.19 5.13 4.90 4.79 4.62 4.43 4.36 4.25 4.13 3.85
Pacific County 4.59 4.49 3.68 4.46 1.89 3.11 2.70 3.73 3.57 3.84 2.50 1.99
Information for this rate is not available for areas smaller than a county.
Note: The divorces per 1,000 persons (age 15 and over). Divorce includes dissolutions, annulments, and unknown decree types; it
does not include legal separations. Divorce data on this page is reported by Person 1's county of residence at the time of decree.
If Person 1 lived outside Washington, then Person 2's county of residence is used. If neither party to the decree has a reported
county of residence in Washington State, the event is not assigned to a county, but is included in the state rate. Data prior to
2018 was recorded as "husband" & "wife", with the wife's county of residence used first and the husband's used second if the
wife's county of residence was not in Washington State. Suppression code definitions for yearly rates are explained in Technical
Notes.
State Source: Department of Health, Center for Health Statistics, Dissolution and Annulment Data.
Population Estimates: Washington State Office of Financial Management, Forecasting Division
Updated: 10/29/2020
Washington State Department of Social and Health Services
Research and Data Analysis,
Community Outcome and Risk Evaluation Geographic Information System (CORE-GIS). County Reports, Jun 2021. 22Family Domain: Family Problems
Victims of Child Abuse and Neglect in Accepted Referrals
100
80
60
Rate Per
1,000 40
20
0
Naselle-Grays River Valley Locale 113 Pacific County State
2009 2010 2011 2012 2013 2014 2015 2016 2017 2018 2019 2020
State 32.01 31.81 33.89 34.27 34.40 32.42 31.94 33.95 37.80 39.15 37.93 31.55
Pacific County 51.34 53.04 49.07 55.31 76.50 56.04 53.01 52.57 53.91 70.63 62.40 45.50
Locale 113 46.36 52.35 46.88 47.25 65.64 49.41 52.88 62.01 84.13 90.87 69.17 55.32
Naselle-Grays River Valley43.74 18.07 49.48 21.10 44.12 21.74 33.19 43.76 39.30 64.94 37.36 49.46
Accepted Victims 22School Domain: Academic Achievement
Poor Academic Performance, Grade 10
As of 2015, the High School Proficiency Exam (HSPE) and the Measurements of Student Progress (MSP) have been
discontinued. Currently Smarter Balanced Assessment (SBA) is being administered. These historical data will be
removed, when several years of SBA data has accumulated.
100
80
60
40
Percent
20
0
Naselle-Grays River Valley Locale 113 Pacific County State
2009 2010 2011 2012 2013 2014 2015 2016 2017 2018 2019 2020
State 65.02 75.62 50.86 40.12 31.61
Pacific County 76.12 78.65 60.53 40.57 42.47
Locale 113 86.79 76.54 55.26 38.68 38.40
Naselle-Grays River Valley88.89 59.46 52.00 40.00 29.17
Low Scorers
Tested, 10th grade
Note: The students tested who failed one or more content areas as a percent of all students tested at the 10th grade level. Some
districts have chosen to test students in both grades 9 and 10 for the 10th grade assessment. All students being tested at the 10th
grade level are included in these data regardless of their grade placement. Tests are given in the spring of the year. For example,
data for 2016 is for students in the 10th grade during the school year 2015/2016. By contractual agreement with OSPI, any rates
above 95% will be listed as >95% or "Greater than 95%", any rates below 5% will be listed asSchool Domain: Academic Achievement
Poor Academic Performance, Grade 7
As of 2015, the High School Proficiency Exam (HSPE) and the Measurements of Student Progress (MSP) have been
discontinued. Currently Smarter Balanced Assessment (SBA) is being administered. These historical data will be
removed, when several years of SBA data has accumulated.
80
60
40
Percent 20
0
Naselle-Grays River Valley Locale 113 Pacific County State
2009 2010 2011 2012 2013 2014 2015 2016 2017 2018 2019 2020
State 58.30 56.42 57.04 49.58 47.83
Pacific County 66.14 75.26 69.27 52.41 59.09
Locale 113 58.97 59.86 64.57 51.91 52.42
Naselle-Grays River Valley30.77 31.82 39.13 48.57 52.17
Low Scorers
Tested, 7th grade
Note: The students tested who failed one or more content areas as a percent of all students tested at the 7th grade level. Tests
are given in the spring of the year. Data for 2016 is for students in the 7th grade during the school year 2015/2016. By
contractual agreement with OSPI, any rates above 95% will be listed as >95% or "Greater than 95%", any rates below 5% will be
listed asSchool Domain: Academic Achievement
Poor Academic Performance, Grade 4
As of 2015, the High School Proficiency Exam (HSPE) and the Measurements of Student Progress (MSP) have been
discontinued. Currently Smarter Balanced Assessment (SBA) is being administered. These historical data will be
removed, when several years of SBA data has accumulated.
100
80
60
Percent
40
20
0
Naselle-Grays River Valley Locale 113 Pacific County State
2009 2010 2011 2012 2013 2014 2015 2016 2017 2018 2019 2020
State 58.27 59.80 54.96 54.27 51.70
Pacific County 58.89 65.54 63.83 67.01 66.10
Locale 113 62.50 65.52 61.54 63.36 64.66
Naselle-Grays River Valley57.14 >95 68.42 67.65 60.87
Low Scorers
Tested, 4th grade
Note: The students tested who failed one or more content areas as a percent of all students tested at the 4th grade level. Tests
are given in the spring of the year. Data for 2016 is for students in the 4th grade during the school year 2015/2016. By
contractual agreement with OSPI, any rates above 95% will be listed as >95% or "Greater than 95%", any rates below 5% will be
listed asSchool Domain: Academic Achievement
High school Cohort (Cumulative) Dropouts
45
40
35
30
Percent
25
20
15
10
5
0
Naselle-Grays River Valley Locale 113 Pacific County State
2008 2009 2010 2011 2012 2013 2014 2015 2016 2017 2018 2019
State 21.39 19.43 17.62 13.93 13.57 12.96 12.31 11.87 11.69 11.48 11.16 11.16
Pacific County 42.53 40.55 31.16 27.13 15.42 27.89 22.74 17.52 20.30 23.69 6.98 3.74
Locale 113 19.48 15.25 13.55 13.85 12.12 9.22 8.57 9.45 13.64 10.32
Naselle-Grays River Valley22.22 10.60School Domain: Academic Achievement
Annual (Event) Dropouts
40
35
30
25
20
Percent 15
10
5
0
Naselle-Grays River Valley Locale 113 Pacific County State
2007 2008 2009 2010 2011 2012 2013 2014 2015 2016 2017 2018
State 5.19 5.10 4.51 3.79 3.74 3.52 3.55 3.44 4.36 4.46
Pacific County 5.48School Domain: Academic Achievement
Protective Factor:
On-time Graduation
Estimated Cohort Method Adjusted Freshman Cohort Method
100
90
80
70
Percent 60
50
40
30
20
10
0
Naselle-Grays River Valley Locale 113 Pacific County State
2008 2009 2010 2011 2012 2013 2014 2015 2016 2017 2018 2019
State 72.03 73.53 76.46 76.61 77.18 76.04 77.24 78.09 79.13 79.34 80.87 80.95
Pacific County 55.16 56.11 64.62 67.21 76.64 64.29 70.40 75.64 70.48 67.07 90.91 94.29
Locale 113 78.22 82.84 85.76 79.23 79.55 84.40 89.52 83.46 81.82 84.92 81.90 84.47
Naselle-Grays River Valley77.78 89.40 >95 94.74 81.48 >95 91.67 95.00 88.00 >95 83.33
Note: The percent of students who graduate in four years by completion of the graduation requirements. The Adjusted Cohort
(new method) rate divides the number of students in the same freshman cohort graduating in their fourth year by the adjusted
freshman cohort for those students. In this method there are no adjustments for students in Special Education or English
Language Learners who are expected to take longer; additionally, students transferring from out of state or other districts who
are credit deficient may not be reclassified into a lower grade. Prior to 2011 the Estimated Cohort method used a complex
formula to estimate the graduation rate from data for multiple grades during the graduation year. Differences in rates from 2010
to 2011 are likely to be influenced by the change in computation methods. By contractual agreement with OSPI, any rates above
95% will be listed as >95% or "Greater than 95%", any rates below 5% will be listed asSchool Domain: Academic Achievement
Protective Factor:
Extended Graduation
100 Estimated Cohort Method Adjusted Freshman Cohort Method
90
80
70
60
Percent
50
40
30
20
10
0
Naselle-Grays River Valley Locale 113 Pacific County State
2008 2009 2010 2011 2012 2013 2014 2015 2016 2017 2018 2019
State 77.05 79.23 82.62 78.23 78.91 78.81 79.88 81.08 81.87 82.38 82.65 83.84
Pacific County 58.24 61.39 69.49 72.16 66.30 57.69 70.42 72.16 78.60 75.94 49.57 93.40
Locale 113 78.22 86.66 89.24 85.00 81.02 80.74 86.52 89.72 88.10 84.85 >95 87.50
Naselle-Grays River Valley77.78 93.29 >95 >95 >95 79.31 >95 91.67 >95 >95
Note: The percent of students who graduate including those students who stay in school and take more than four years to
complete their degree. The Estimated Cohort (old method) Extended Graduation rate formula is: (the number of on-time and late
graduates in the same year)/(the number of on-time graduates divided by the on-time graduation rate). The Adjusted Cohort
(new method) rate is the number of students graduating within five years divided by the adjusted freshman cohort for the
graduates. The new method does not include graduates after year 5 in the extended graduation rate. Differences in rates from
2010 to 2011 are likely to be influenced by the change in computation method. By contractual agreement with OSPI, any rates
above 95% will be listed as >95% or "Greater than 95%", any rates below 5% will be listed asSchool Domain: Academic Achievement
Protective Factor: Five year rates not available
Successful Academic Performance in Math, Grades 3-5
60
50
40
30
Percent
20
10
0
Naselle-Grays River Valley Locale 113 Pacific County State
2009 2010 2011 2012 2013 2014 2015 2016 2017 2018 2019 2020
State 55.3 50.4 49.9 50.7 --
Pacific County 40.2 26.4 27.6 35.0 --
Locale 113 41.3 32.5 36.4 40.9 --
Naselle-Grays River Valley 56.6School Domain: Academic Achievement
Protective Factor: Five year rates not available
Successful Academic Performance in Math, Grades 6-8
70
60
50
40
Percent 30
20
10
0
Naselle-Grays River Valley Locale 113 Pacific County State
2009 2010 2011 2012 2013 2014 2015 2016 2017 2018 2019 2020
State 49.6 43.2 43.3 47.6 --
Pacific County 36.5 18.5 14.9 37.5 --
Locale 113 32.3 20.4 20.9 36.6 --
Naselle-Grays River Valley 52.4 57.4 47.9 35.6 --
Met Standard --
Tested, 11th grade --
Note: The students tested in grades 6 to 8 who met the Smarter Balanced Assessment (SBA) Math standard as a percent of all
students who chose to test in grades 6 to 8. Tests are given in the spring of the year. For example, data for 2016 is for students
during the school year 2015/2016. By contractual agreement with OSPI, any rates above 95% will be listed as > 95%, "Greater
than 95%", any rates below 5% will be listed as < 5%, and data is suppressed when less than ten students were tested to avoid
individual student identification. OSPI does not consider the Smarter Balanced Assessment (SBA) and Measurements of Student
Progress (MSP) equivalent and advises against directly comparing the results of the two tests.
Due to the school closures on March 17th, 2020 to prevent the spread of COVID, 2020 data for this measure is unavailable.
State Source: Office of Superintendent of Public Instruction, Instructional Programs, Curriculum and Assessment, Grades 6-8
Meeting Math Standard, Smarter Balanced Assessment.
Updated: 05/25/2021
Washington State Department of Social and Health Services
Research and Data Analysis,
Community Outcome and Risk Evaluation Geographic Information System (CORE-GIS). County Reports, Jun 2021. 32School Domain: Academic Achievement
Protective Factor: Five year rates not available
Successful Academic Performance in English Language Arts, Grades 3-5
80
70
60
50
Percent
40
30
20
10
0
Naselle-Grays River Valley Locale 113 Pacific County State
2009 2010 2011 2012 2013 2014 2015 2016 2017 2018 2019 2020
State 57.8 52.0 53.5 60.8 --
Pacific County 45.4 32.4 32.5 51.9 --
Locale 113 48.5 39.5 35.0 55.5 --
Naselle-Grays River Valley 52.6School Domain: Academic Achievement
Protective Factor: Five year rates not available
Successful Academic Performance in English Language Arts, Grades 6-8
80
70
60
50
40
Percent
30
20
10
0
Naselle-Grays River Valley Locale 113 Pacific County State
2009 2010 2011 2012 2013 2014 2015 2016 2017 2018 2019 2020
State 59.1 51.4 52.0 58.8 --
Pacific County 51.9 30.6 19.4 53.5 --
Locale 113 47.6 34.7 25.9 56.5 --
Naselle-Grays River Valley 60.3 59.0 55.7 67.1 --
Met Standard --
Tested, 11th grade --
Note: The students tested in grades 6 to 8 who met the Smarter Balanced Assessment (SBA) English Language Arts (ELA) standard
as a percent of all students who chose to test in grades 6 to 8. Tests are given in the spring of the year. For example, data for
2015 is for students during the school year 2015/2016. By contractual agreement with OSPI, any rates above 95% will be listed as
> 95%, "Greater than 95%", any rates below 5% will be listed as < 5%, and data is suppressed when less than ten students were
tested to avoid individual student identification. OSPI does not consider the Smarter Balanced Assessment (SBA) and
Measurements of Student Progress (MSP) equivalent and advises against directly comparing the results of the two tests.
Due to the school closures on March 17th, 2020 to prevent the spread of COVID, 2020 data for this measure is unavailable.
State Source: Office of Superintendent of Public Instruction, Instructional Programs, Curriculum and Assessment, Grades 6-8
Meeting English Language Arts (ELA) Standard, Smarter Balanced Assessment.
Updated: 05/25/2021
Washington State Department of Social and Health Services
Research and Data Analysis,
Community Outcome and Risk Evaluation Geographic Information System (CORE-GIS). County Reports, Jun 2021. 34Problem Outcomes: School Climate
Weapons Incidents in School
4
3
3
2
Rate Per 2
1,000
1
1
0
Naselle-Grays River Valley Locale 113 Pacific County State
2009 2010 2011 2012 2013 2014 2015 2016 2017 2018 2019 2020
State 2.85 2.80 2.66 2.61 2.00 1.89 1.78 1.68 1.65 1.18 2.20 --
Pacific County 1.42 1.04 0.32 1.49 0.63 1.62 1.01 0.33 1.65 0.00 1.38 --
Locale 113 2.18 1.64 3.33 0.96 0.48 2.98 1.06 0.00 1.04 0.00 2.04 --
Naselle-Grays River Valley0.00 0.00 0.00 0.00 0.00 0.00 0.00 0.00 2.21 0.00 0.00 --
Incidents 0 0 0 0 0 0 0 0Problem Outcomes: School Climate
Unexcused Absences for Students in Grades 1 to 8
9
8
7
6
5
Rate Per
4
1,000
3
2
1
0
Naselle-Grays River Valley Locale 113 Pacific County State
2009 2010 2011 2012 2013 2014 2015 2016 2017 2018 2019 2020
State 3.76 3.61 3.80 4.29 5.08 5.44 6.03 6.66 7.74
Pacific County 1.18 2.16 1.55 1.27 4.54 2.31 3.26 2.10 4.21
Locale 113 1.16 2.08 1.86 1.18 1.68 2.13 2.03 1.80 2.27
Naselle-Grays River Valley0.79 0.93 0.00 0.21 0.20 2.93 0.51 0.20 0.77
Absences 27 30 0 13 11 137 16Problem Outcomes: School Climate
Regular Attendance (Protective Factor)
Added to this report in the July, 2020 issue.
95
90
Rate Per 85
100
80
75
Naselle-Grays River Valley Locale 113 Pacific County State
2009 2010 2011 2012 2013 2014 2015 2016 2017 2018 2019 2020
State 87.28 87.00 86.78 86.64 --
Pacific County 86.73 85.19 89.51 83.56 --
Locale 113 85.03 85.58 89.04 82.66 --
Naselle-Grays River Valley 90.72 92.05 88.70 84.72 --
Regular Attenders 215 220 212 183 --
Students 237 239 239 216 --
Note: The percentage of students who regularly attend school. Regular attendance is defined as having, on average, less than
two absences per month. It doesn't matter if the absences are excused or unexcused. An absence is defined as missing more
than half the school day. This measure includes students that were enrolled for at least 90 days at any given school. Unlike risk
indicators, a higher value on this protective factor is preferable.
Due to the school closures on March 17th, 2020 to prevent the spread of COVID, 2020 data for this measure is unavailable.
Regular Attendance replaces Unexcused Absences as a School Climate indicator in this report beginning July, 2020. For
additional information about Regular Attendance refer to the OSPI web site, www.k12.wa.us. See also RCW 28A.225.
State Source: Washington State Office of the Superintendent of Public Instruction.
Updated: 06/14/2021
Washington State Department of Social and Health Services
Research and Data Analysis,
Community Outcome and Risk Evaluation Geographic Information System (CORE-GIS). County Reports, Jun 2021. 37You can also read