Human Resource and Skill Requirement Study for 21 Coastal Districts of India - Prepared for: Sagarmala, Ministry of Shipping and National Skill ...
←
→
Page content transcription
If your browser does not render page correctly, please read the page content below
Human Resource and
Skill Requirement
Study for 21 Coastal
Districts of India
Prepared for:
Sagarmala, Ministry of Shipping and
National Skill Development
Corporation

Tamil Nadu
Thiruvallur
Thoothukudi
Final Report
Contents
1. District Profile                                                                                                    3

1.1. Thiruvallur                                                                                                       3
    1.1.1. Demographic Profile                                                                                         3
    1.1.2. Key Economic Drivers                                                                                        9
    1.1.3. Priority Sectors                                                                                            9
    1.1.4. About the Ports                                                                                            10
    1.1.5. Investments                                                                                                11
    1.1.6. Youth Aspiration                                                                                           13
    1.1.7. Training Infrastructure                                                                                    18

1.2. Thoothukudi                                                                                                      19
    1.2.1. Demographic Profile                                                                                        19
    1.2.2. Key Economic Drivers                                                                                       26
    1.2.3. Priority Sectors                                                                                           26
    1.2.4. About Port                                                                                                 27
    1.2.5. Investments                                                                                                27
    1.2.6. Youth Aspiration                                                                                           29
    1.2.7. Training Infrastructure                                                                                    34

2. Skill Gap Assessment, Job Roles and Emerging Job Roles                                                             35

2.1. Thiruvallur                                                                                                      35
    2.1.1. Incremental Demand for Skilled & Semi Skilled Manpower                                                     35
    2.1.2. Gap between Total Demand and Supply for Skilled workforce in Select Sectors                                36
    2.1.3. Job Roles High in Demand                                                                                   37

2.2. Thoothukudi                                                                                                      41
    2.2.1. Incremental Demand for Skilled & Semi Skilled Manpower                                                     41
    2.2.2. Gap between Total Demand and Supply for Skilled workforce in Select Sectors                                42
    2.2.3. Job Roles High in Demand                                                                                   43

3. District Action Plan                                                                                               46

3.1. Background                                                                                                       46
3.2. Objective of developing the plan                                                                                 46
3.3. Methodology                                                                                                      46
3.4. Summary for Thiruvallur                                                                                          47
3.5. Action Plan for Thiruvallur                                                                                      48
3.7. Additional Training Courses                                                                                      61

Human Resource and Skill requirement study for 21 Coastal Districts of India – Tamil Nadu: Thiruvallur, Thoothukudi
                                                                                                                           1
3.8. Summary for Thoothukudi                                                                                          62
3.9. Action Plan for Thoothukudi                                                                                      62

4. Consultations                                                                                                      74

4.1. State level consultations- Tamil Nadu                                                                            74
4.2. District level consultations- Thiruvallur                                                                        75
4.3. District level consultations- Thoothukudi                                                                        77

Human Resource and Skill requirement study for 21 Coastal Districts of India – Tamil Nadu: Thiruvallur, Thoothukudi
                                                                                                                           2
1. District Profile
1.1. Thiruvallur
Thiruvallur is the northernmost district of the state. It neighbors Chennai (South) and Kanchipuram (Southwest)
in Tamil Nadu, Chittoor (West) and Nellore (North) districts in Andhra Pradesh. The district largely lies within
the borders of the Chennai Metropolitan area and is influenced by the city of Tirupati in Andhra Pradesh which
results in interdependence on a daily basis. Thiruvallur houses one major port, Kamarajar Port and a private port
and shipyard at Kaatupalli. The major exportable items produced in the district are Auto components,
Engineering products, Leather, Garments and Rubber products1. Industry (34%) and Service sector (62%) have
the largest share in the overall district economy.

1.1.1. Demographic Profile2
    Indicator                                                                                                                Value
    Total population                                                                                                     3,728,104
    Decadal rate of growth of population (2001-11)                                                                          35.33%
    Rural population                                                                                                           35%
    Female                                                                                                                   49.6%
    SC population                                                                                                              22%
    ST population                                                                                                            1.27%
    Workforce participation                                                                                                    41%
    Main Workers (As % of total population)                                                                                    33%
    Marginal (As % of total population)                                                                                         8%
    Non-workers (As % of total population)                                                                                     59%
    Number of people with vocational training in the age group of 15+3                                                55 per 1,000

Population trends4
Figure 1: Population trend in Thiruvallur (2001-2021)

                                                                                                     5,045,369

                                                                           4,337,010
                                                 3,728,104

                        2,754,756

                          2001                      2011                      2016                      2021

1 Brief Industrial Profile of Thiruvallur District, MSME
2 Census, 2011
3 District Level Estimates for Tamil Nadu, Employment and Unemployment Survey, Labour Bureau2013-14
4 Based on Census 2001 & 2011

Human Resource and Skill requirement study for 21 Coastal Districts of India – Tamil Nadu: Thiruvallur, Thoothukudi
                                                                                                                                     3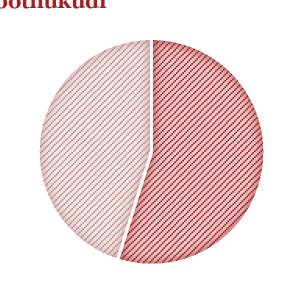
The demographic dividend bulge in Thiruvallur is shifting with youth in the employable age increasing.
Estimating the population for the period 2001-11 (10 years), the population is estimated to be 43,37,010 and
50,45,369 in 2016 and 2021 respectively. The projected absolute growth in the population from 2016 to 2021 is
16.3% driven large by the urbanization in Chennai, Vellore and Chitoor Districts.

Figure 2: Population Pyramid Thiruvallur - 2011

   80+
 75-79
 70-74
 65-69
 60-64
 55-59
 50-54
 45-49
 40-44
 35-39
 30-34
 25-29
 20-24
  15-19
  10-14
    5-9
    0-4
       6.0                 4.0                2.0                0.0                2.0                 4.0                   6.0

                                                          Male     Female

Literacy rates
Figure 3: Thiruvallur vs Tamil Nadu literacy rates (2011)

                                                                        86.77%
          79.73%                                                                                                  80.09%
                                                    74.88%                                   73.44%
                              69.98%

          Male                Female                Total                Male                Female                   Total
                            District Literacy rate                               State Literacy rate

Total literacy rate of Thiruvallur, as per the Census 2011, is approximately 74.88%, which is lower than the State’s
literacy rate of around 80.09%. However, the female literacy rate of Thiruvallur is 69.98% which is substantially
lower than the male literacy rate of 79.73% in 2011.

Human Resource and Skill requirement study for 21 Coastal Districts of India – Tamil Nadu: Thiruvallur, Thoothukudi
                                                                                                                                    4
Age specific population trends and education level for 20115
As per the Census 2011, the population in the age-group of 15 to 24 years was 664,517 (17.8% of the overall
population). The population in the age group of 15-59 years is estimated to be 2,995,770 and 3,553,051 in 2016
and 2021. The projected absolute growth in the population from 2016 to 2021 is 18.6%.

    Figure 4: Growth trend of population in the age group 15-59 year in Thiruvallur (2001-2021)

                                                                                                          3,553,051

                                                                             2,995,770

                                                2,525,896

                   1,795,682

                     2001                          2011                        2016                         2021

Figure 5: Age Specific population (15-59
years)                                                                 Figure 6: Age specific population (15- 24
                                                                       years)

                     Male       Female
                                                                                           Male        Female

                49.80%            50.20%                                               50.04%           49.96%

Both the age groups, 15-59 years and 15-24 years have almost equal representation of males and females with
males accounting for 50.20% and 49.96% of the total population share in the 15-59 years and 15-24 years age
group respectively. Females account for 49.80% and 50.04% of the total population share in the 15-59 years and
15-24 years age group respectively.

5   Based on Census 2001 and 2011

Human Resource and Skill requirement study for 21 Coastal Districts of India – Tamil Nadu: Thiruvallur, Thoothukudi
                                                                                                                      5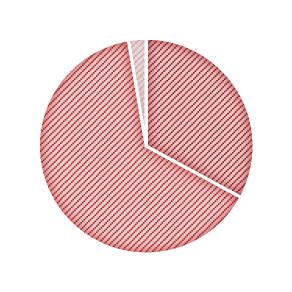
Figure 7: Age specific education level in Thiruvallur (15-59 yr)

                      Graduate and above                                                             15%
  Technical Diploma/Certificate Course                       4%
                        Higher Secondary                                                       14%
                                 Secondary                                                                        20%
                                    Middle                                                       14%
                                   Primary                                              12%
                            Below Primary               2%
       Literate without educational level                         5%
                                Not literate                                                       15%

 For the age category of 15-59 years, 15%of the population of Thiruvallur is illiterate. 5% is literate without any
 educational qualification, 2% have attained schooling till below primary level, 12% have done schooling till
 primary level and 14% have completed schooling till middle level. Roughly, 20% of the literate population has
 been educated till secondary level, whereas, around 14% of the literate population has been educated till higher
 secondary. Technical certificate/diploma course holders are in insignificant number in the district and 15% have
 at least completed graduation, indicating that a graduate/post-graduate degree is more sought after than a
 technical certificate/diploma.

 Figure 8: Age specific education level in Thiruvallur (15-24 years)

                   Graduate and above                                    11.8%
Technical Diploma/Certificate Course                    4.5%
                     Higher Secondary                                                           21.4%
                             Secondary                                                                                  32.1%
                                 Middle                                           15.2%
                                Primary                      6.6%
                        Below Primary          0.9%
    Literate without educational level                3.6%
                            Not literate              3.9%

 In the age group of 15-24 years, 3.9% of the population of Thiruvallur is not literate, 3.6% are literate without any
 educational qualification, ~1% have attended school till below primary level and ~7% have completed schooling
 only up to primary level. About 15.1% of the population in 15-24 years category has done schooling up to the
 middle level, whereas, around 32% of the same population segment has been educated till secondary. Only 4.5%
 of the population of this district has done a technical certificate/diploma course and 11.8% has at least completed
 graduation.

 Human Resource and Skill requirement study for 21 Coastal Districts of India – Tamil Nadu: Thiruvallur, Thoothukudi
                                                                                                                                6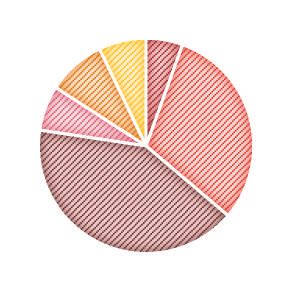
Age specific distribution of workers and educational level
  Figure 9: Age specific distribution of workers in Thiruvallur (15-24 years)

                                     Main Workers         Marginal Workers          Non-workers

                                                                      25%

                                                        68%
                                                                        7%

The total workforce participation rate for this district, according to census 2011, is 41.26% and 68% of the
population in the age group of 15-24 years are reported as non-workers. 25% of the population are main-workers,
whereas 7% are engaged in marginal work i.e. working for 3-6 months during the year.

Figure 10: Education level of marginal workers available for work in Thiruvallur (15-24 years)

 Technical degree or diploma equal to degree or post-
                                                                       6%
                   graduate degree

      Graduate and above other than technical degree                      8%

   Technical diploma or certificate not equal to degree                6%

                  Matric/secondary but below graduate                                                                 48%

                   Literate but below matric/secondary                                         25%

                                               Not literate           6%

Amongst the 26,550 marginal workers in the age group of 15-24 years, 1,689 (6.36%) hold technical degree or a
diploma equal to degree or post-graduate degree and 2,240 (8.44%) are graduates and above other than a
technical degree. Further, 1,666 (6.27%) have a diploma or a certificate (not equal to degree), 12,750 (48.02%)
are educated up to the matric/secondary level but below graduate and 6,715 (25.29%) are literate with an
educational qualification of below matric/secondary level, and 1,490 (5.61%) marginal workers in this age group
are not literates.

Human Resource and Skill requirement study for 21 Coastal Districts of India – Tamil Nadu: Thiruvallur, Thoothukudi
                                                                                                                            7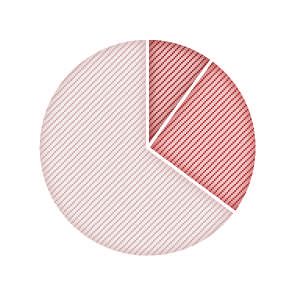
Figure 11: Education level of main workers available for work in Thiruvallur (15-24
 years)

                                                7%
                                                       5%
                                           9%

                                      7%                       31%

                                                41%

                      Illiterate
                      Literate but below matric/secondary
                      Matric/secondary but below graduate
                      Technical diploma or certificate not equal to degree
                      Graduate and above other than technical degree
                      Technical degree or diploma equal to degree or post-graduate degree

From Figures 10 and 11 given above, the proportion of main workers who are illiterate (in the age category 15-24
years) is slightly less than the proportion of marginal workers available for work and who are illiterate (difference
of 1% points). We also find that the proportion of main workers who are literate but below matric/secondary (in
the age category 15-24 years) is slightly more than (6 percentage difference point between the two) the
proportion of marginal workers who are available for work and are literate but below matric/secondary. The
proportion of main workers who are matric/secondary level but below graduate (in the age category 15-24 years)
is less than (7 percentage difference point between the two) the proportion of marginal workers who are available
for work and are matric/secondary level but below graduate. Also, the proportion of main workers who are
graduate and above other than technical degree (in the age category 15-24 years) is slightly less than (1
percentage difference point between the two) the proportion of marginal workers who are available for work and
are graduate and above other than technical degree. The proportion of main workers who have attained a
technical degree or diploma equal to degree or post-graduate degree (in the age category 15-24 years) is the
same.

Figure 12: Education level of non-workers available for work in Thiruvallur (15-24 yr)

        Technical degree or diploma equal to degree or…                7%
       Graduate and above other than technical degree                   9%
   Technical diploma or certificate not equal to degree              6%
                  Matric/secondary but below graduate                                                             57%
                    Literate but below matric/secondary                         18%
                                                Not literate      3%

Amongst the 106,907 non-workers in the age group of 15-24 years, 7,563 (7.07%) hold a technical degree or a
diploma equal to degree or post graduate degree and 10,002 (9.36%) have a graduate and above other than a
technical degree. Over 6,243 (5.84%) have a diploma or a certificate (not equal to degree), 61,256 (57.30%) are
educated up to the matric/secondary level but below graduate and 19,046 (17.82%) are literate but below
matric/secondary level. With respect to the marginal workers, about 2,797 (2.62%) of them in the age-group of
15-24 years are illiterates.

Human Resource and Skill requirement study for 21 Coastal Districts of India – Tamil Nadu: Thiruvallur, Thoothukudi
                                                                                                                        8
1.1.2. Key Economic Drivers
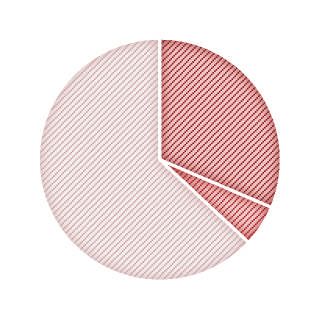
According to DES Tamil Nadu, Thiruvallur, the Gross Domestic Product Figure 13: Sectoral breakup of
of the district (at constant prices- 2004-05) was INR 28,03,894 crore in Thiruvallur district GDP at constant
2012-13 and it has steadily grown at a CAGR of 12.6% over the period prices Agriculture Industry Services
(2004-05)
2004-05 to 2012-13. The sectoral break up suggests that services sector
4%
contribution to district GDP is more than half (62%) followed by
industry sector (34%). Further disaggregation suggests that
manufacturing sector has a share of 25% and real estate sector has a
share of 24% in the district GDP. Other sectors driving the district
34%
economy are trade, hotels and restaurants (13%) and construction sector
(8%). The real estate sector has witnessed an impressive growth of 26%
over the years 2004-12. 62%
The key economic drivers of the district are illustrated below:
1.1.3. Priority Sectors
In Thiruvallur, the priority sectors that have been identified are Port and Maritime sector: logistics,
fisheries, tourism and construction. Other sectors that have been identified as priority sectors from the
point of view of their contribution to district GDP are manufacturing and real estate and construction
and Banking.
Human Resource and Skill requirement study for 21 Coastal Districts of India – Tamil Nadu: Thiruvallur, Thoothukudi
91.1.4. About the Ports
Ports & Maritime
Major Ports: Minor Ports: 1 Shipyards: 1
1
Details
Kamarajar Port Limited
Operations: Land Lord Port model (PPP) Capacity 34 mn tonnes P.A
Key Cargo Thermal Coal (80%), Petroleum Oil No of berths: 5
and Lubricants (12%) Draft 13.5M
Description It is the only corporatized major port in India. Initially developed with the only aim of
and key Trend handling thermal coal to divert coal traffic from Chennai Port Trust (ChPT), the Kamarajar
Port Limited has created facilities for handling liquid bulk, iron ore, automobiles (Ro-Ro for
Ford, Nissan, etc.) and general cargo.
It is working completely on the Land Lord Port model
The access roads to KPL and ChPT are common via the inner ring road which has affected
the traffic and performance of the port.
Terminal Operations
General Cargo Terminal –
Ennore Tank Terminal Chettinad International
Stevedores including JMB,
Private Limited Coal Terminal
SICAL, Hindustan Shipping, etc.
Annual
3 mn tonnes PA 8 mn tonnes PA 1 mn tonnes PA
Capacity
Type of Cargo Petroleum Oil and
Coal Automobiles
handled Lubricants (POL), Chemicals
Rail Engine Operator, Rail Railway Engine
Mounted Quay Crane Operator, Rail Mounted
Operator, Rail Mounted Quay Crane Operator,
High Demand
Gantry Crane Operator, Rail Mounted Gantry Car Drivers ( Ro-Ro)
Job Roles
Forklift Operator, Reach Crane Operator, Forklift
Stacker Operator, Crane Operator, Surveyors,
Mechanic, and Surveyors. Conveyor Belt Mechanic.
Kattupalli Port and Shipyard.
Operations: Private (Adani) Capacity 1.2 mn tonnes P.A
Key Cargo Container No of berths: 2
Draft 14M
Kattupalli International Container Terminal (KICT) is located north of Ennore Port near
Kattupalli village in Thiruvallur district near Chennai, built as a joint venture between L&T
Description
and TIDCO alongside a shipbuilding yard. Currently, the operations have been taken over
and key Trend
by Adani Port. L&T Shipbuilding continues to operate the shipyard, largely focussed on
manufacturing for the defense sector.
Human Resource and Skill requirement study for 21 Coastal Districts of India – Tamil Nadu: Thiruvallur, Thoothukudi
101.1.5. Investments
The table below summarizes the investments are that are in the pipeline in next few years:
Table 1: Proposed Key Investments for the year 2016-22 in Thiruvallur
Proposed
Number of Expected
Sector Investment (INR Key Players
Projects Employment
Cr)
Over 6,5006 Kamarajar Port Limited,
Port & Maritime 7,963 7
persons IOCL
Tamil Nadu State Highways
Infrastructure 17,280 5 -
Department, TNRDC, PWD
Manufacturing 1,425 4 - TIDCO
In the port and maritime sector, several upgradations of the KPL port have been identified as key focus areas for
future investments. Details of proposed investments in this sector are given below:
Table 2: Details of Investments in Port and Maritime sector in Thiruvallur
Project Proposed Expected Key Players
Investment (INR cr) Employment
Construction of RoRo Cum General 320 1,400 persons Kamarajar Port
Cargo Berth 2 Limited
Captive Oil Jetty by IOCL 480 1,400 persons Kamarajar Port
Limited, IOCL
Development of Marine Liquid 392 1,400 persons Kamarajar Port
Terminal-II Limited
(LNG) Import Terminal of 5 MTPA 5,151 Information Not Kamarajar Port
on Captive basis available Limited
Container Terminal of 1.40million 1,270 Information Not Kamarajar Port
TEU on DBFOT basis. available Limited
Multipurpose Cargo Terminal on 151 Information Not Kamarajar Port
DBFOT basis available Limited
Additional Coal Berth for TNEB of 9 199 Information Not Kamarajar Port
MTPA on Captive basis available Limited, TNEB
In Thiruvallur, with the MSME sectors, manufacturing, tourism, logistics, food processing are upcoming areas
with proposed investments to the tune of INR 1,069 Cr and is expected to create employment for approximately
3,000 individuals. The details of proposed investments across these sectors are given below.
6 Based on expected increase in capacity and historical utilization.
Human Resource and Skill requirement study for 21 Coastal Districts of India – Tamil Nadu: Thiruvallur, Thoothukudi
11Figure 14: Details of proposed investments across different sectors, DIC Thiruvallur
Human Resource and Skill requirement study for 21 Coastal Districts of India – Tamil Nadu: Thiruvallur, Thoothukudi
121.1.6. Youth Aspiration
The key findings of the youth aspiration survey include extent of youths’ exposure to vocational training and
educational aspiration, job aspirations, training aspirations and aspiration for self-employment.
Respondent Profile
The table below provides an overview of the respondent profile:
Profile Details
Total Sample Size 384
Gender Profile Male – 65.4%
Female -34.6%
Age Group 15-24 years
Education Level (top 3) Secondary schooling(Class 9 to 10)- 24.9%
Senior Secondary Schooling (Class 9 to 10)- 21.9%
Higher secondary schooling with science (Class 11 to 12)- 17.3%
APL/BPL/AAY/Don’t know APL -1.8 %
BPL – 97.1 %
Don’t know/Can’t Say – 1.0 %
Occupational Profile (top 3) Unemployed (45.6%), Student (24.7%), Salary from employment
(12.8%)
Exposure to Vocational Training and Educational Aspiration
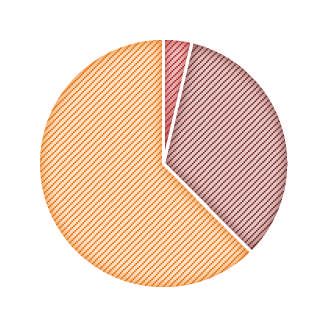
Regarding the exposure to the vocational training, most Figure 15: Respondents who completed
students reported that they had not undergone any vocational vocational training course - Thiruvallur
training course. Overall, ~96% of the respondents had not
enrolled in vocational training course (Figure 15). 3.6%
Yes
Respondents were asked about the level of education they
No
wished to attain. More than two-thirds of the respondents (74%)
didn’t aspire for further education. The desire to attain technical 96.4%
education is relatively low with only 6% aspiring for graduation
in technical field as against preference to general degrees (17%)
(Figure 16). Figure 16: Desired level of education -
Thiruvallur
Further, of the total respondents who underwent vocational
training (which is 3%), most were from NSDC TSPs (42.9%) and Don’t wish to study
74%
ITIs (28.6%). Figure 17 exhibits the percentage of respondents further
who completed different types of courses as part of their
Post Graduate 3%
vocational training.
Graduate [Technical] 6%
Graduate [General] 17%
Human Resource and Skill requirement study for 21 Coastal Districts of India - Tamil Nadu: Thiruvallur, Thoothukudi
13Figure 17: Respondents who completed courses in vocational training - Thiruvallur
42.9%
28.6%
14.3% 14.3%
ITI Polytechnic Short Term Course Offered Course offered by at a
by NSDC partner training center owned by the
Ports facility, others
Job Aspiration
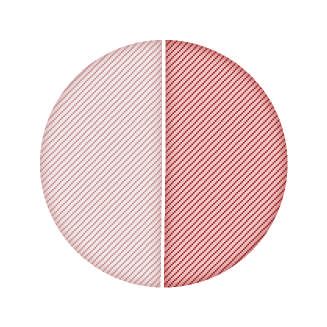
One of the important findings of the survey has been the high Figure 18: Respondents aspiring for wage
preference for wage employment over self-employment and self-employment - Thiruvallur
among the youth of the district. All of the respondents
reported to have preference for wage employment over self-
employment (Figure 18: Respondents aspiring for wage and
self-employment).
Wage
The respondents were further asked to identify the factors employment
important for securing employment in the area of their (Job)
interest for which 63.6% of the respondents identified
interest in the area as the most important factor for securing
100.0%
employment followed by industry specific skills (47.5%) and
job opportunities (34.1%) (Figure 19)
Figure 19: Factors important for securing employment in area of interest - Thiruvallur
63.6%
47.5%
34.1%
11.1%
6.9% 7.4%
3.2%
Industry specific Computer skills English speaking Good personality Degree or Interest in the Job
skills skills certificate in the area opportunities
area of work
Figure 20: Desired job profile after completion of education/training- Thiruvallur
Others 0.3%
Can’t Say/ Don’t Know 6.3%
Senior level job in services sector industry 2.5%
Senior level job in manufacturing industry 1.1%
Middle level job in services industry 8.8%
Middle level Job in a manufacturing industry 20.4%
Entry level job in services sector 23.7%
Entry Level job in a manufacturing Industry 34.2%
Employment in agriculture sector 2.8%
Human Resource and Skill requirement study for 21 Coastal Districts of India - Tamil Nadu: Thiruvallur, Thoothukudi
14Regarding job aspiration of the respondents after completion of current education or training, it can be observed
that there is a demand for manufacturing sector with 34% aspiring for entry level jobs and 20% aspiring for
middle level jobs. This is followed by services industry (24%) and middle level jobs in services sector (9%). Only
about 3% want to enter the Agriculture sector (Figure 20).
Figure 21: Sectors in which respondents’ foresee getting a desired job - Thiruvallur
43.5%
35.5% 35.3% 34.7%
29.8%
25.3%
18.7%
13.5%
11.3% 9.6% 10.5%
8.8% 8.3% 8.5%
6.6%
Further, Manufacturing (43.5%), IT/ITES Figure 22: Preferred work location of
(35.5%), Construction (35%), Retail (34.7%) and candidates - Thiruvallur
Agriculture (30%) have been identified as
sectors in which the respondents feel that they Outside the country 0.9%
are mostly likely to get a job which is in
alignment with their aspiration for a job in the Outside the home state
5.9%
within the country
manufacturing sector space. The details of other
sectors are mentioned in Figure 21. Within the home state but
23.9%
outside the district of…
Out of total respondents, 93% preferred to work Within the District of
69.4%
inside Tamil Nadu. However, more than half of residence
the of the respondents (69.4%) preferred to
work in the same district and 24% expressed
willingness to migrate to other districts in the
same state suggesting some flexibility among the youth of the district (Figure 22).
Maximum respondents (44.6%) have monthly salary expectation in the range of INR 10,000-15,000. While
39.6% of respondents have a salary expectation in the range of INR 5,000-10,000 per month (Figure 23).
Human Resource and Skill requirement study for 21 Coastal Districts of India - Tamil Nadu: Thiruvallur, Thoothukudi
15Figure 23: Monthly salary expectation of respondents - Thiruvallur
44.6%
39.6%
11.3%
3.2% 1.4%
5000-9999 per 10000-14999 per 15000-19999 per 20000-24999 per 30000-34999 per
month month month month month
Training Aspiration Figure 24: Willingness to participate in
trainings - Thiruvallur
Regarding willingness of the respondents to participate
in the training (skilling) programme in next (immediate)
one year, more than two thirds expressed interest (Figure 18.0% Yes
24)
41.0% No
Further, when enquired about what should be the key Can’t Say /Don’t
focus areas of skill training, 90% of respondents reported 41.0% Know
that emphasis must be laid on technical skills followed by
personality development (51%) and life skills (5%)
(Figure 25).
Figure 25: Focus area on skills training - Thiruvallur
90.0%
51.1%
0.9% 3.2% 5.0%
Technical Skills Proficiency in English Proficiency in IT Life Skills Personality
skills development
Overall, there is high acceptability for training in port (78%) and shipping (80%), followed by logistics (45.1%)
and fishing related activities (45.1%) and hospitality (37.4%) which in turn highlights the demand for the core
sectors of this study (Figure 26).
Figure 26: Willingness of respondents to participate in trainings of different sectors -
Thiruvallur
78.0% 79.12%
45.1% 45.1%
39.6% 37.4% 37.4%
9.9%
Port Shipping Ship Building/ Logistics Fishing Food Tourism Hospitality
Repair processing
Human Resource and Skill requirement study for 21 Coastal Districts of India - Tamil Nadu: Thiruvallur, Thoothukudi
16Self-Employment
Only 27 respondents of the sample are involved in entrepreneurial activities which is merely 7% of the sample.
Figure 27: Current status of entrepreneurial venture- Thiruvallur
55.6%
25.9%
18.5%
Looking to set up : In Ideation phase Already established Family Business
Regarding current status of the Entrepreneurial Venture of the respondents who aspired for self-employment,
55.6% were in family business and 26% had already established ventures (Figure 27Error! Reference source
not found.).
Figure 28: Interested in skill development
Further, 55.6% of the respondents expressed a desire to undergo a for enhancing entrepreneurial skills-
training programme for enhancing their entrepreneurial skills Thiruvallur
(Figure 28).
Food Processing (50%), tour operations (30%) and trade (20%) are
the only sectors in which the respondents aspired to set up
ventures. IT/ITEs services, retail and hospitality have found no
44.4% Yes
takers as most preferred sectors for setting up own enterprise
55.6% No
(Figure 29).
Figure 29: Sectors for establishing enterprise - Thiruvallur
IT/ITES 0.0%
Hospitality Industry 0.0%
Retail business 0.0%
Trade 20.0%
Food Processing 50.0%
Tour operations 30.0%
Human Resource and Skill requirement study for 21 Coastal Districts of India - Tamil Nadu: Thiruvallur, Thoothukudi
171.1.7. Training Infrastructure
Type of training Total number No of trades Top 5 trades based on enrolment and
infrastructure of institutions seat capacity
ITI7 20 27 Electrician, Fitter, MMV. Draughtsman Civil,
Welder
Polytechnic 23 16 Civil Engineering, Electrical And Electronics
Engineering, Mechanical Engineering. Civil
Engineering, Electronics & Communication
Engg.
PMKK Training 1 5 Field Technician – Networking and Storage,
Centre Field Technician – Computing and Peripherals,
Telecom -In-store promoter, Accounts
Executive - Accounts Payable and Receivable,
Retail Sales Associate.
PMKVY 3 15 Sewing Machine Operator, Retail Sales
Associate, Accounts Executive - Accounts
Payable and Receivable, Telecom -In-store
promoter, Home Health Aide.
DDU GKY Not available Not available Not available
Other State Govt.
skill centres
TNSDC 10 29 4 Wheeler Service Technician, Beautician,
Basic Shrimp Culture Techniques, Stitchers
(Leather)
The Training infrastructure in the district is dominated by the ITIs and Polytechnics. However, the trades are
largely focussed on technical and engineering trades.
ITIs – There are 20 ITIs providing training in 27 different trades. The Ambattur ITI is one of the largest
in the State and is the only one to provide certified training for land surveyors. However, according to
Dept. of Employment and Training data, only 55% the total capacity is sactioned for conducting
trainings. The actual occupation of seats is around 40% in total capacity.
Polytechinics – Core engineering sectors like Civil, Electrical & Electronics, Electronics &
Communication and Mechanical remain the most dominant trades, however, other trades like Hotel
Management, Mechatronics, Production Technology, etc. are also gaining traction. Most of the students
prefer to move to full time engineering courses post diploma.
PMKVY & PMKK – The Trades are focussed on the Apparel, Retail, Trade, Telecom sectors with a
santcioned strength of around 1090 in the next 4 years.
TNSDC – Through various institutions TNSDC has santioned courses in 29 trades with a capacity of
almost 900. However, the duration and levelof training vary widely and would require standardisation.
7 Some of the ITIs also undertake
Human Resource and Skill requirement study for 21 Coastal Districts of India - Tamil Nadu: Thiruvallur, Thoothukudi
181.2. Thoothukudi
Thoothukudi, colloquially known as “Pearl City” for the pearl fishing activity, has been a major centre for ports,
maritime and fisheries historically. The major exportable items produced in the district are chemicals, steel,
garments and processed food8. Industry (25%) and Service sector (65%) have the largest share in the overall
district economy. Thoothukudi houses one major port, the V.O. Chidambaranar Port Trust (VOCPT). It was the
home port of the first modern indigenous shipping services company, the Swadeshi Steam Navigation Company,
started by V.O. Chidambaranar.
1.2.1. Demographic Profile9
Indicator Value
Total population 1,750,176
Decadal rate of growth of population (2001-11) 10%
Rural population 49.85%
Female 50.5%
SC population 20%
ST population 0.28%
Workforce participation 43%
Main Workers (As % of total population) 38%
Marginal (As % of total population) 5%
Non-workers (As % of total population) 57%
*Number of people with vocational training in the age group of 15+10 25 per 1,000
Population trends11
Based on the population progression dynamics over the period 2001-11 (10 years), population is predicted to be
1,846,540 and 1,948,209 during 2016 and 2021 respectively. The projected absolute growth in the population
from 2016 to 2021 is 5.5%.
Figure 30: Population Trend in Thoothukudi (2001-2021)
1,948,209
1,846,540
1,750,176
1,572,273
2001 2011 2016 2021
The demographic dividend bulge in Thoothukudi will remain intact over the next decade i.e. 10 years.
8Brief Industrial Profile of Thoothukudi District, MSME
9Census, 2011
10District Level Estimates for Tamil Nadu, Employment and Unemployment Survey, Labour Bureau2013-14
11 Based on Census 2001, 2011.
Human Resource and Skill requirement study for 21 Coastal Districts of India - Tamil Nadu: Thiruvallur, Thoothukudi
19Figure 31 Population Pyramid Thoothukudi- 2011
80+
75-79
70-74
65-69
60-64
55-59
50-54
45-49
40-44
35-39
30-34
25-29
20-24
15-19
10-14
5-9
0-4
-6.0 -5.0 -4.0 -3.0 -2.0 -1.0 0.0 1.0 2.0 3.0 4.0 5.0
Male Female
Literacy rates12
Figure 32: Thoothukudi vs Tamil Nadu literacy rates (2011)
86.77%
81.28%
80.09%
77%
73.05% 73.44%
Male Female Total Male Female Total
District Literacy rate State Literacy rate
Total literacy rate of Thoothukudi, as per the Census 2011, is approximately 77%, which is lower than the State’s
literacy rate of around 80.09%. Also, the female literacy rate of Thoothukudi is 73.o5% which is quite lower than
the male literacy rate of 81.28% but only slightly lower than the state female literacy rate of 73.44% in 2011.
12 Census , 2011
Human Resource and Skill requirement study for 21 Coastal Districts of India - Tamil Nadu: Thiruvallur, Thoothukudi
20Age specific population trends and education level for 201113
As per the Census 2011, the population in the age-group of 15 to 24 years was 3,03,269 (17.33% of the overall
population). The population in the age group of 15-59 years is estimated to be about 11,99,432 and 12,83,581 in
2016 and 2021, respectively. The projected absolute growth in the population from 2016 to 2021 is 7%.
Figure 33: Growth trend of population in the age group 15-59 years in Thoothukudi (2001-2021)
1,283,581
1,199,432
1,120,799
978,661
2001 2011 2016 2021
Figure 34: Age specific population of Figure 35: Age specific population of
Thootukudi (15-24 years) Thootukudi (15-59 years)
Male Female
Male Female
50.63% 49.37%
50.33% 49.67%
Both the age groups, 15-59 years and 15-24 years have almost equal representation of males and females with
males accounting for 49.37% and 49.67% of the total population share in the 15-59 years and 15-24 years age
group respectively. Females account for 50.63% and 50.33% of the total population share in the 15-59 years and
15-24 years age group respectively.
It is worthy to note that females outnumber males marginally in both the age categories (15-59 years) and (15-24
years). However, in the smaller (15-24 years) category, the share of women is lower than that of women in the
larger category (15-59).
13 Based on Census 2001 and 2011
Human Resource and Skill requirement study for 21 Coastal Districts of India - Tamil Nadu: Thiruvallur, Thoothukudi
21Figure 36: Age specific education level in Thoothukudi (15-59 yr)
Graduate and above 10%
Technical diploma or certificate 4%
Higher Secondary 12%
Secondary 15%
Middle 18%
Primary 22%
Below Primary 5%
Literate without educational level 3%
Not literate 12%
From the Census 2011, we understand that for the age category of 15-59 years, literacy in the working age group
is 88 %. Graduates and Technical Diploma holders make only 14 % of the population. Taken together with higher
secondary (12%) education only 27% of the population is educated with secondary or higher education. Moreover,
27% of the population is educated till primary and below level; and 3% is literate without any education level. The
share of under educated workforce will prove to be a challenge as the availability of sufficiently educated
workforce is small.
Figure 37: Age specific education level in Thoothukudi (15-24 yr)
Graduate and above 9%
Technical diploma or certificate 6%
Higher Secondary 19%
Secondary 28%
Middle 21%
Primary 12%
Below Primary 1%
Literate without educational level 3%
Not literate 2%
For the age category of 15-24 years, 2% of the population of Thoothukudi is not literate, 3% are literate without
any educational qualification, 1% have attended school till below primary level and 12% have completed schooling
only up to primary level. Roughly, 21% of the population in 15-24 years category has done schooling up to the
middle level, whereas, around 28% of the population in 15-24 years category has been educated till secondary.
6% of the population of this district has done a certificate/diploma course and 9% have at least completed
graduation.
Human Resource and Skill requirement study for 21 Coastal Districts of India - Tamil Nadu: Thiruvallur, Thoothukudi
22Age specific distribution of workers and educational level14
Figure 38: Age specific distribution of workers in Thoothukudi (15-24 yr)
Main Workers Marginal Workers Non-workers
29%
66%
5%
The total workforce participation rate for this district, according to census 2011, is 42.74% and 66% of the
population in the age group of 15-24 years are reported as non-workers. 29% of the population are main-workers,
whereas 5% are engaged in marginal work i.e. working for 3-6 months during the year.
Figure 39: Education level of marginal workers available for work in Thoothukudi (15-24 year)
Technical degree or diploma equal to degree or post-
5.44%
graduate degree
Graduate and above other than technical degree 7.50%
Technical diploma or certificate not equal to degree 10.21%
Matric/secondary but below graduate 34.05%
Literate but below matric/secondary 39.41%
Not Literate 3.38%
Amongst the 7,538 marginal workers in the age group of 15-24 years, 410 (5.44%) hold technical degree or a
diploma equal to degree or post-graduate degree and 565 (7.50%) are graduate and above other than a technical
degree. 770 (10.21%) have a diploma or a certificate (not equal to degree). 2567 (34.05%) are educated up to the
matric/secondary level but below graduate and 2971 (39.41%) are literate with an educational qualification of
below matric/secondary level. 255 (3.38%) marginal workers in this age group are not literate.
14 Census, 2011
Human Resource and Skill requirement study for 21 Coastal Districts of India - Tamil Nadu: Thiruvallur, Thoothukudi
23Figure 40: Education level of main workers (15-59 years)
3%
5%3%
7%
29% 53%
Illiterate
Literate but below matric/secondary
Matric/secondary but below graduate
Technical diploma or certificate not equal to degree
Graduate and above other than technical degree
Technical degree or diploma equal to degree or post-graduate degree
The proportion of main workers who are illiterate (in the age category 15-24 years) is the same as the proportion
of marginal workers available for work and who are illiterate. We also find that the proportion of main workers
who are literate but below matric/secondary (in the age category 15-24 years) is significantly more than (14
percentage difference point between the two) the proportion of marginal workers who are available for work and
are literate but below matric/secondary.
The proportion of main workers who are matric/secondary level but below graduate (in the age category 15-24
years) is slightly less than (5 percentage difference point between the two) the proportion of marginal workers
who are available for work and are matric/secondary level but below graduate.
The proportion of main workers who are graduate and above other than technical degree (in the age category 15-
24 years) is slightly less than (3 percentage difference point between the two) the proportion of marginal workers
who are available for work and are graduate and above other than technical degree.
The proportion of main workers who have attained an technical degree or diploma equal to degree or post-
graduate degree (in the age category 15-24 years) is slightly less than (3 percentage difference point between
the two) the proportion of marginal workers available for work and who have attained a technical degree or
diploma equal to degree or post-graduate degree.
Human Resource and Skill requirement study for 21 Coastal Districts of India - Tamil Nadu: Thiruvallur, Thoothukudi
24Figure 41: Education level of non-workers available for work in Thoothukudi (15-24 yr)
Technical degree or diploma equal to degree or post-
7.98%
graduate degree
Graduate and above other than technical degree 11.40%
Technical diploma or certificate not equal to degree 11.21%
Matric/secondary but below graduate 47.38%
Literate but below matric/secondary 20.63%
Not Literate 1.40%
Amongst the 41,354 non- workers in the age group of 15-24 years, 3299 (7.98%) hold a technical degree or a
diploma equal to degree or post graduate degree and 4,715 (11.40%) have a graduate and above other than a
technical degree. 4,639 (47.38%) have a diploma or a certificate (not equal to degree). 19,592 (47.63%) are
educated up to the matric/secondary level but below graduate and 8,532 (20.63%) are literate but below
matric/secondary level. 577 (1.40%) marginal workers who are available for work in this age group are not
literate.
Human Resource and Skill requirement study for 21 Coastal Districts of India - Tamil Nadu: Thiruvallur, Thoothukudi
251.2.2. Key Economic Drivers Figure 42: Sectoral breakup of
Thoothukudi district GDP at
constant prices (2004-05)
According to District Economy Survey, Thoothukudi, the Gross
Domestic Product of the district (at constant prices- 2004-05) was
INR 1,228,778 crores in 2012-13 and it has steadily grown at a
CAGR of 9.5% over the period 2004-05 to 2012-13. The sectoral 10%
break up suggests that services sector contribution to district GDP
is more than half (65%) followed by industries sector (25%).
25%
Further disaggregation suggests that logistics sector has a share of
30% and manufacturing has a share of 16% in the district GDP. 65%
Other sectors driving the district economy are agriculture (8%)
and construction sector (8%).
Agriculture Industry Services
The key economic drivers of the district are illustrated below:
1.2.3. Priority Sectors
In Thoothukudi, the priority sectors that have been identified are Port and Maritime sector and other sectors:
logistics, fisheries, tourism and construction. Other sectors that have been identified as priority sectors
from the point of view of their contribution to district GDP are manufacturing and agriculture.
Human Resource and Skill requirement study for 21 Coastal Districts of India- Tamil Nadu: Thiruvallur, Thoothukudi
261.2.4. About Port
Ports & Maritime
Major Ports: 1 Minor Ports: Nil Shipyards: Nil
Details
V.O. Chidambaranar Port Trust (VOCPT)
Operations: PPP (Only Container Capacity 44.55 mn tonnes P.A
Terminal)
Rest by Port Trust
Key Cargo Containers (36%), Dry Bulk No of berths 13
(32%), Break Bulk (14%) Draft 12.80 M
Description and key The VOC Port is an all-weather port and has been one of the important ports of
Trend India lying very close to the international sea route. The port’s hinterland is
southern and Western parts of Tamil Nadu and South-western parts of
Karnataka.
In 2015-16, it witnessed close to 14% growth in traffic which is expected to further
grow in the coming years due to various projects planned in the ports and maritime
sector. There are plans to expand the outer harbour and improve the efficiency of
the present one which is currently at 83%.
Terminal Operations
PSA Sical Port Trust
Annual Capacity 4,50,000 TEUs
Dry Bulk (Coal, Fertilizer), Liquid Bulk
Type of Cargo handled Container
and Break Bulk
Manpower 200 850 (150 on Contract)
High Demand Job Roles Crane Operators, Truckers, Surveyors Mechanics for Mechanized equipment.
1.2.5. Investments
The table below summarizes the investments that are in the pipeline over the next few years:
Table 3: Proposed Key Investments for the year 2016-22 in Thoothukudi
Proposed Number of Expected
Sector Key Players
Investment (INR cr) Projects Employment
Port & Maritime 11,823 10 7,000 persons VOC Port, PSA Sical
Container Terminal
Manufacturing 4,300 2 ~45,000 persons SIPCOT, TIDCO
Power 28,283 3 3,000 persons TANGEDCO
(Construction)
1,500 persons
Infrastructure 14,308 3 -- AAI, TNRSP, NHAI,
TNRDC
In the port and maritime sector, the outer harbor development, construction and mechanization of various berths
at the VOC Port and increasing rail based port connectivity are the major proposed projects that have been
identified as key focus areas for future investments. Details of proposed investments in this sector are given
below:
Human Resource and Skill requirement study for 21 Coastal Districts of India- Tamil Nadu: Thiruvallur, Thoothukudi
27Table 4: Details of Investments in Port and Maritime sector in Thoothukudi
Project Proposed Expected Key Players
Investment (INR cr) Employment
Outer Harbour Development 10,150 - VOC Port Trust, PSA SICAL
Container Terminal
Construction of North Cargo 332 7,000
Berth 2 persons15
Construction of North Cargo 1,101 IITTM Chennai, VOC Port
Berths 3 & 4 Trust
Development of LNG Terminal 350 VOC Port Trust
Conversion of Berth No. 8 as 312.23 VOC Port Trust
Container Terminal
Mechanization of Berth No. 9 49.20 VOC Port Trust
(Upgradation of mechanical
handling infrastructure at V.O.
Chidambaranar Port Trust
Construction of Shallow Water 123 VOC Port Trust
Berth for handling General
Cargo
Construction of Shallow Water 65.37 VOC Port Trust
Berth for handling Construction
Materials
Laying of Railway Track from 58.30 DCW, VOC Port Trust
Port Marshalling Yard to Hare
Island at V.O. Chidambaranar
Port
Proposed making up cess from 3.05 Southern Railways, VOC Port
in between station Milavittan Trust
yard and TNHP marshalling
yard
The new investments in the MSME category are to be seen mainly in food Production and Processing, especially
sea food, apparel manufacturing and chemicals.
Table 5: Details of New Investments from DIC in Thoothukudi
Sector Number of Proposed Expected
Projects Investment (INR Employment
cr)
Food Production and Processing 93 47 1,282 persons
Apparel & Textiles 71 10 582 persons
Wood Products 14 9 90 persons
Chemicals 30 20 357 persons
In Thoothukudi, with the Tamil Nadu vision 2023 plan, upgradation and urbanization plans are proposed in the
sectors like power, water supply and sewerage and transport. The proposed Madurai-Thoothukudi Industrial and
Agro-Business Corridor is also expected to bring about a huge boost in the district. Brief details of proposed
investments across these sectors are given below:
15 Calculated from incremental Traffic and historical utilization rates at TPT.
Human Resource and Skill requirement study for 21 Coastal Districts of India- Tamil Nadu: Thiruvallur, Thoothukudi
28Figure 43: Details of proposed investments across different sectors
1.2.6. Youth Aspiration
The key findings of the youth aspirations include youths’ exposure to vocational training and educational
aspiration, job aspirations, training aspirations and self-employment.
Respondent Profile
The table below provides an overview of the respondent profile:
Profile Details
Total Sample Size 386
Male - 56.7%
Gender Profile Female -43.3%
Age Group 15-24 years
Education Level (top 3) Secondary schooling(Class 9 to 10)- 18.7%
Higher secondary schooling with commerce (Class 11 to 12)- 18.7%
Senior Secondary Schooling (Class 9 to 10)- 14.2%
APL/BPL/AAY/Don’t know APL -3.6 %
BPL - 90.2 %
AAY -3 0.8%
Don’t know/Can’t Say - 5.4 %
Occupational Profile (top 3) Unemployed (42.2%), Student (30.3%), Salary from employment
(9.8%)
Exposure to Vocational Training and Educational Aspiration
Regarding the exposure to the vocational training most
students reported that they had not completed any Figure 44: Respondents who completed
vocational training course - Thoothukudi
vocational training course. Overall, ~85% of the
respondents had not enrolled in vocational training 14.8%
course (Figure 44).Further, the respondents were asked
level about the level of education they wished to attain.
Yes
Nearly, two-thirds of the respondents (68%) didn’t
aspire for further education. The desire to attain No
technical education is relatively low with only 7%
aspiring for graduation in technical field as against 85.2%
preference to general degrees (20%) (Figure 45)
Human Resource and Skill requirement study for 21 Coastal Districts of India- Tamil Nadu: Thiruvallur, Thoothukudi
29Figure 45: Desired level of education - Thoothukudi
Don’t wish to study further 68%
Post Graduate 5%
Graduate [Technical] 7%
Graduate [General] 20%
Of the total respondents who underwent vocational training (which is ~14%), most were from Polytechnics
(35.1%) and NSDC TSPs (35.1%). Figure 46 exhibits the percentage of respondents who completed different types
of courses as part of their vocational training (Figure 46).
Figure 46: Respondents who completed courses in vocational training - Thoothukudi
35.1% 35.1%
14.0% 15.8%
ITI Polytechnic Short Term Course Offered by Course offered by at a training
NSDC partner center owned by the Ports
facility, others
Job Aspiration
Figure 47: Respondents aspiring for wage and
One of the important findings of the survey has been the self-employment - Thoothukudi
high preference for wage employment over self-
employment among the youth of the district. About 97% of 0.8% 2.1%
the respondents reported to have preferred wage
employment over self-employment (Figure 47). Wage employment
(Job)
The respondents were further asked to identify the factors Self-Employment
(Enterprise)
important for securing employment in the area of interest.
Can’t Say/ Don’t
Respondents identified Industry Specific skills (74%), Know
availability of opportunities (52%) and good personality
(51.5%) as important factors (Figure 48). 97.1%
Figure 48: Factors important for securing employment in area of interest - Thoothukudi
74.1%
51.5% 51.9%
38.9% 43.9%
33.5%
22.6%
Industry specific Computer skills English speaking Good personality Degree or Interest in the Job opportunities
skills skills certificate in the area
area of work
Human Resource and Skill requirement study for 21 Coastal Districts of India- Tamil Nadu: Thiruvallur, Thoothukudi
30Figure 49: Desired job profile after completion of education/training - Thoothukudi
Others 6.9%
Can’t Say/ Don’t Know 6.4%
Senior level job in services sector industry 6.1%
Senior level job in manufacturing industry 5.8%
Middle level job in services industry 10.0%
Middle level Job in a manufacturing industry 10.5%
Entry level job in services sector 22.2%
Entry Level job in a manufacturing Industry 32.7%
Employment in agriculture sector 12.5%
Regarding job aspiration of the respondents after completion of education or training, it can be observed that
there is a demand for manufacturing sector with 33% aspiring for entry level jobs and 10% aspiring for middle
level jobs. This is followed by entry level jobs (22%) and middle level jobs in services sector (10%). 12.5% also
want to enter the Agriculture sector (Figure 49).
Further, Manufacturing (41.3%), IT/ITEs (38%) Logistics & transport (36.8%), Agriculture (29%) and Retail
(28.3%) have been identified as sectors in which the respondents feel that they are mostly likely to get job which
is in alignment with their aspiration for a job in the service sector space. The details of other sectors are mentioned
in Figure 50.
Figure 50: Sectors in which respondents’ foresee getting a desired job - Thoothukudi
41.3%
38.5% 36.8%
28.8% 28.3%
21.3% 20.8%
13.9% 13.0% 12.5% 11.6%
9.7% 8.9% 8.3%
6.1%
Out of total respondents, 94% preferred to work in the Figure 51: Preferred work location of candidates
same state. However, less than half of the of the - Thoothukudi
respondents (43.5%) preferred to work in the same
district and 49% expressed willingness to migrate to
Outside the country 1.7%
other districts in the same state suggesting some
Outside the home state within
flexibility among the youth of the district (Figure 51). the country 5.0%
Within the home state but
outside the district of… 49.8%
Within the District of
residence 43.5%
For about 37.2% of the respondents, the monthly salary expectation was INR 10,000-15,000 . And for 28.2% of
respondents the expected salary is reported to be range in 5,000-10,000 per month (Figure 52).
Human Resource and Skill requirement study for 21 Coastal Districts of India- Tamil Nadu: Thiruvallur, Thoothukudi
31Figure 52: Monthly salary expectation of respondents - Thoothukudi
37.2%
28.2%
21.9%
7.3%
4.7%
0.7%
5000-9999 10000-14999 15000-19999 20000-24999 30000-34999 35000-39999
Training Aspiration Figure 53: Willingness to participate in
trainings - Thoothukudi
Regarding willingness of the respondents to participate in the
2.7%
training programme in the next one year, two thirds expressed
interest (Figure 53). 32.9%
Yes
Further, when enquired about the key focus areas of skill
training, 84.9% of respondents reported that emphasis must No
be laid on technical skills followed by personality Can’t Say
development( 54.8%) and Proficiency in English and IT skills
(14% each) (Figure 54). 64.5%
Figure 54: Focus area on skills training - Thoothukudi
84.9%
54.8%
14.6% 14.1% 11.6%
Technical Skills Proficiency in English Proficiency in IT skills Life Skills Personality
development
Overall, there is high acceptability for training in port, logistics and shipping activities (barring ship building)
related activities, fishing (68.7%) and food processing (54%) show demand for the core sectors of this study.
Human Resource and Skill requirement study for 21 Coastal Districts of India- Tamil Nadu: Thiruvallur, Thoothukudi
32Figure 55: Willingness of respondents to participate in trainings of different sectors -
Thoothukudi
78.8% 79.8%
68.7% 68.7%
54.5%
46.5% 47.5% 47.5%
Port Shipping Ship Building/ Logistics Fishing Food processing Tourism Hospitality
Repair
Self-Employment
Regarding current status of the Entrepreneurial Venture of the respondents who aspired for self-employment,
41.9% were in family business and 35.5% were in their ideation stage (Figure 56).
Figure 56: Current Status of Entrepreneurial Venture - Thoothukudi
41.9%
35.5%
19.4%
3.2%
Looking to set up : In Ideation Already established Family Business Can’t Say/ Don’t Know
phase
Further, 54.8% of the respondents expressed a desire to
Figure 57: Interested in skill development for
undergo a training programme for enhancing their
enhancing entrepreneurial skills -
entrepreneurial skills (Figure 57). Thoothukudi
45.2% Yes
Retail business (92%) and hospitality (8%) are the only
sectors which the respondents want to set up ventures in. 54.8% No
IT/ITEs services, trading, manufacturing and tour
operations have found no takers as most preferred sectors
for setting own enterprise (Figure 58).
Figure 58: Sectors for establishing enterprise -
Thoothukudi
Trade 0%
Tour Operations 0%
Manufacturing 0%
IT/ITES 0%
Retail business 91.70%
Hospitality Industry 8.30%
Human Resource and Skill requirement study for 21 Coastal Districts of India- Tamil Nadu: Thiruvallur, Thoothukudi
331.2.7. Training Infrastructure
Type of training Total number No of trades Top 5 trades based on enrolment and
infrastructure of institutions seat capacity
ITI 17 16 Fitter, Electrician, Welder, MMV, COPA
Polytechnic 10 12 Civil Engineering, Electrical And Electronics
Engineering, Mechanical Engineering, Civil
Engineering,
Electronics & Communication Engg.
PMKK Training Centre 1 2
PMKVY 2 5 Home Health Aide, General Duty Assistant,
Emergency Medical, Technician-Basic,
Autoconer Tenter, Ring Frame Tenter.
DDU GKY Information Information
Unavailable Unavailable
Other State Govt. skill
centres
TNSDC 29 31 DTP and Print Publishing Assistant
Accounts Assistant using Tally,
Draughtsman Mechanical, Basic of Anatomy
& Physiology, and Arc and Gas Welder.
The Training infrastructure in the district is dominated by the ITIs and Polytechnics. However, the trades are
largely focussed on technical and enginering trades.
ITI-s -There are 17 ITIs providing training in 16 different trades. However, according to information
shared by the Dept. of Employment and Training, (GoTN), only 55% the total capacity is sactioned for
conducting trainings. The actual occupation of seats is around 40% in total capacity.
Polytechinics – Core engineering sectors like Civil, Electrical & Electronics, Electronics &
Communication and Mechanical remain the most dominant trades, however, new age trades like Hotel
Management, Mechatronics, Production Technology, etc. are also gaining traction. The students prefer
to move to full time engineering courses post diploma.
PMKVY & PMKK – The Trades are focussed on the Hospital and Manufacturing sectors with a santcioned
strength of around 240.
TNSDC – Through various institutions, TNSDC has santioned courses in 31 trades with a capacity of
almost 900. However, the duration and levelof training vary widely and would require standardisation.
Human Resource and Skill requirement study for 21 Coastal Districts of India- Tamil Nadu: Thiruvallur, Thoothukudi
342. Skill Gap Assessment, Job Roles and
Emerging Job Roles
2.1. Thiruvallur
2.1.1. Incremental Demand16 for Skilled & Semi Skilled Manpower
The district of Thiruvallur is witnessing increased industrialization and urbanization due to its proximity to
Chennai. These are affecting the incremental demand for skilled workforce in the district, where as per our
methodology, Construction, Manufacturing and Trade are going to generate the maximum demand for skilled
and semi-skilled workers.
Table 6: Incremental Demand for Skilled & Semi Skilled Workers in Thiruvallur
Sector 2017 2018 2019 2020 2021 2022 Total
Core Sectors
Ports & Allied 1,305 848 940 1,042 1,159 1,289 6,583
Logistics 1,363 1,421 1,478 1,540 1,603 1,669 9,074
Tourism 870 923 979 1,036 1,099 1,165 6,072
Construction 3,512 3,721 3,943 4,180 4,429 4,693 24,478
Other Dominant Sectors in the District
Manufacturing 3,831 4,005 4,186 4,377 4,575 4,783 25,757
Trade (Retail & 1,864 1,976 2,094 2,221 2,354 2,495 13,004
Wholesale)
BFSI 640 676 712 751 792 836 4,407
Agriculture -228 -226 -226 -224 -223 -222 -1,349
TOTAL 88,026
Key trends in Core Sectors
Ports and Allied Sectors: Expected increase in the throughput at Ennore and Kattupalli ports and the
need for increased productivity to ensure competiveness are key drivers for demand of skilled labour
within the Ports & Allied Sector. The gradual shifting of traffic from Chennai port to Kamarajar Port, the
large quantities and share of bulk & container cargo traffic, are expected to be dominating factors for
pushing the labour requirements. The higher requirement of skills makes it one of the most promising
employer of skilled labour.
Logistics: Ponneri is going to emerge as a node for the CBIC and CVIC. In addition to the growth of
traffic from Chennai Ennore and Kattupalli ports, gradual shifting of industries to the outskirts of
Chennai city and development of Sri City in Andhra Pradesh is expected to increase the demand for total
employment in the logistics sector.
Tourism & Hospitality: Thiruvallur District neighbours important tourist and business destinations
like Chennai and Tirpuati. Trends in migration, businesses and tourists are key drivers of the incremental
demand in the sector. The sector is increasingly demanding skilled workers, especially within the
Hospitality segment.
Construction: In addition to the increasing urbanization, major infrastructure projects on CVIC and
CBIC, Smart Cities and Metro Rail are in the anvil. Thus, there is going to be a considerable construction
activity in the district.
16Incremental Demand Estimates the additional stock of workforce that are to be created given the expected Economic Conditions in the
period of study. This may help in estimating requirement for fresh trainings .
Human Resource and Skill requirement study for 21 Coastal Districts of India- Tamil Nadu: Thiruvallur, Thoothukudi
35You can also read