INFRASTRUCTURE STRATEGY 2018 2048 - Tasman District Council
←
→
Page content transcription
If your browser does not render page correctly, please read the page content below

INFRASTRUCTURE STRATEGY 2018 - 2048
Cover page to come from Hot House

INFRASTRUCTURE STRATEGY 2018-2048     PAGE 1
CONTENTS

      Executive Summary              Strategic Direction      Activity Summaries
      Summary of Council’s            Provides context, an       Overview of each
      strategic direction for          outline of the key     infrastructure activity
         its infrastructure          infrastructure issues,    including options to
               services             and a summary of how      address key issues and
                                       Council intends to        long term budget
                                       manage its assets           requirements

INFRASTRUCTURE STRATEGY 2018-2048                                                       PAGE 2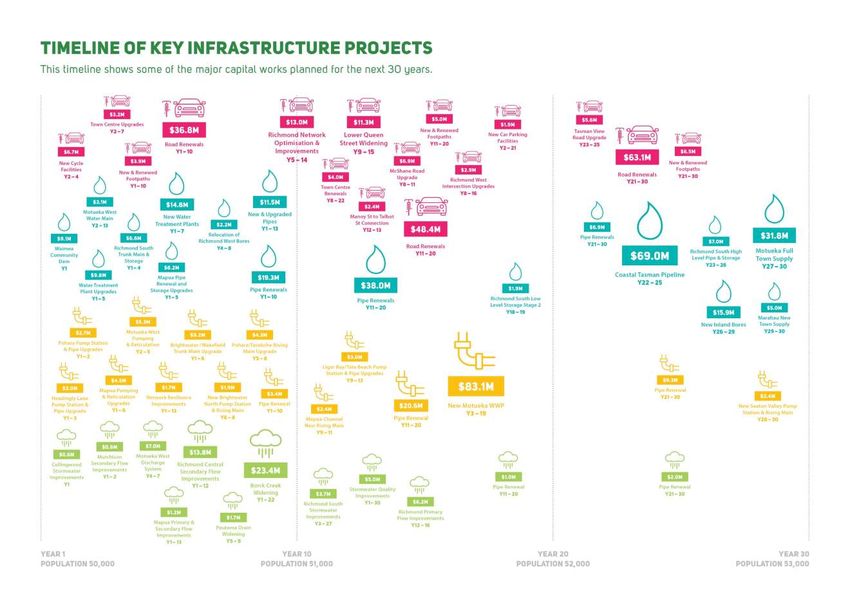
EXECUTIVE SUMMARY
This Infrastructure Strategy (Strategy) covers the provision of Council’s water supplies, stormwater,
wastewater, rivers and flood control, and transportation activities.

WHAT IS INFRASTRUCTURE?
Infrastructure is the physical assets that Council provides and owns in order to undertake these services. Council has other
infrastructure that supports community services such as libraries, parks and reserves, pools and halls. These are not
covered by this Strategy.
Infrastructure provides the foundation on which the Tasman District is built. It is essential to health, safety, and for the
transport of both people and freight. It enables businesses and communities to flourish, and failure to maintain and invest
in infrastructure would inhibit the economic performance, health and prosperity of Tasman.

WHY HAVE AN INFRASTRUCTURE STRATEGY?
Council is responsible for managing $1.1 billion worth of infrastructure. Maintaining and renewing these assets, as well as
managing and meeting the communities changing needs for infrastructure, account for most of Council’s spending.
The purpose of this Strategy is to identify key issues relevant to the provision of infrastructure, the key options for
addressing those issues, and the subsequent financial implications for the next 30 years.
However, there is tension in the process when Council assesses how and when to address these key issues. Often, what
Council would like to do differs from what is practical and affordable, especially in regards to timing. Council has an
inherent desire to address issues quickly for the community, but often there are constraints that mean this cannot always
be the case. This Strategy acknowledges the tension between prudent provision of infrastructure and the need to stay
within the financial caps set out in Council’s Financial Strategy. By doing this, Council has set out a long-term infrastructure
strategy that is realistic, prudent and achievable, and outlines the infrastructure services that will be provided over the next
30 years.

WHERE ARE WE AT NOW?
In 2015, Council made a plan to turn the tide on its growing debt. It did this by introducing new financial caps that capped
rate income increases at 3% per year plus an allowance for growth, and net debt at $200 million through the development
of the Long Term Plan 2015-2025. This changed the way that Council had to think about infrastructure planning. There
needed to be a clear focus on the ‘need to have’ and much less focus on the ‘nice to have’. The Long Term Plan 2015-2025
focused on maintaining core renewal programmes, making the most of existing assets first, and undertaking upgrades
required to meet agreed levels of service rather than investing in increasing levels of service.
Since 2015, Tasman’s population has grown significantly more than anticipated, using up a lot of capacity within Council’s
existing infrastructure in the process. Development in Richmond, Mapua/Ruby Bay, and Motueka has almost exhausted the
capacity that Council had assumed would be available to service new developments in the years to come. This means that
the timing of upgrades that Council planned in 2015 now need to be advanced, and some new works are required.
In 2015, Council decided to accept some risk when programming renewal of some assets. This was in attempt to maximise
the life of those existing assets and to keep within the new financial caps. This included deferral of the Mapua trunk water
main replacement, and reducing road resurfacing budgets for three years between 2015 and 2018. Since then, there has
been a number of failures on the Mapua trunk water main meaning that it no longer provides the appropriate level of
service. Reducing the road resurfacing budget was a good short-term tactic that enabled Council to pay off some extra debt
but, as Council anticipated, it is not a sustainable level of investment for the long-term.
Nationally there has been asset failures which has resulted in significant harm to communities. Two notable events were
the contamination of the Havelock North drinking water supply, and flooding due to stopbank failure. For Council, this has
reinforced the need to ensure its assets are maintained and operated well, and to learn from the mistakes of others. A
standout issue for Tasman is the challenge of providing water supplies that meet the requirements of the NZ Drinking
Water Standards.
Nationally, there is improved understanding of the likely impact a major rupture of the Alpine Fault will have on
infrastructure services. Council will need to do more to adequately prepare to respond to and recover from an event of
such magnitude.

INFRASTRUCTURE STRATEGY 2018-2048                                                                                         PAGE 3

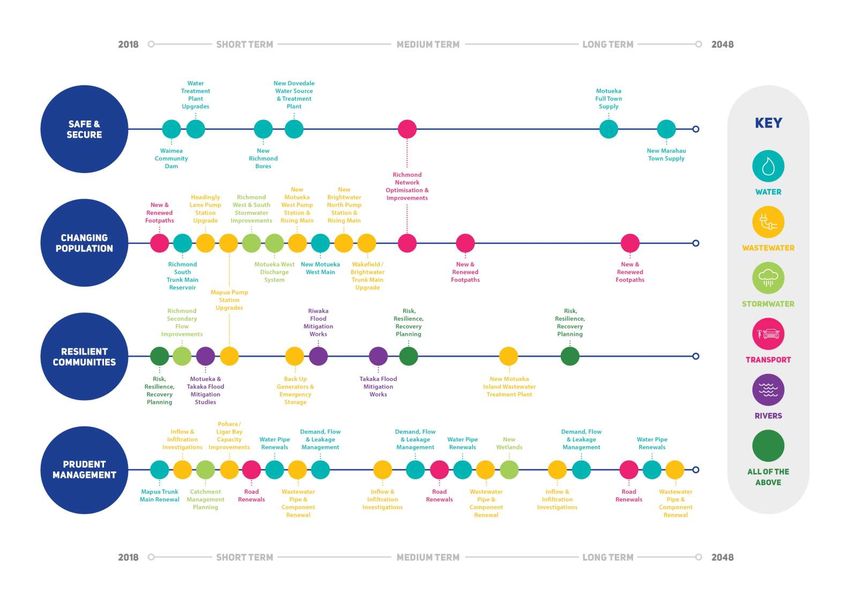
WHERE ARE WE GOING?
After considering the key issues facing the District’s infrastructure, Council has identified four key priorities that will guide
Council’s effort and investment in planning, developing and maintaining its infrastructure in the short, medium, and long
term.

    1       Providing safe and secure infrastructure services

    2      Providing infrastructure services that meet the needs of our changing population

    3      Planning, developing, and maintaining resilient communities

    4      Prudent management of our existing assets and environment

HOW ARE WE GOING TO GET THERE?
Council plans to spend $696 million on infrastructure services over the next 10 years, and a total of around $2.4 billion over
the next 30 years. Figure 1 shows how much Council plans to invest in each of the infrastructure activities. The percentage
of planned expenditure for each activity is similar for the 10 year and 30 year timeframes. Council invests most in
transportation as there is a large core programme of routine maintenance and renewal work.

                                                                                                             Rivers & Flood
                  Transportation         Water Supply            Wastewater             Stormwater
                                                                                                               Protection
        Capex          $413                   $214                   $229                   $78                    $40
        Opex           $463                   $389                   $360                  $102                    $96

Figure 1: Total Infrastructure Expenditure for 2018 – 2048 ($ million)

The following page shows the key actions that Council plans to take to achieve the four key infrastructure priorities.

INFRASTRUCTURE STRATEGY 2018-2048                                                                                          PAGE 4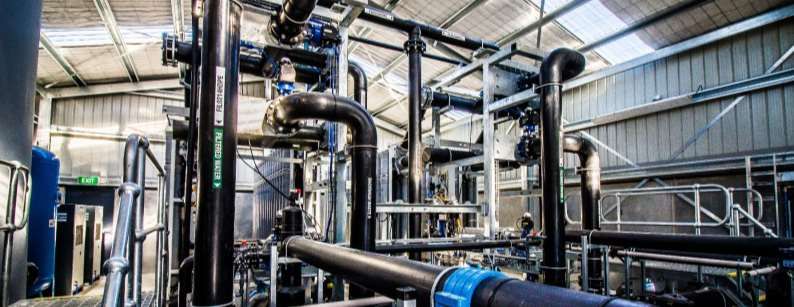
Insert info graphic to represent above
To come from Hot House

INFRASTRUCTURE STRATEGY 2018-2048         PAGE 5

INTRODUCTION
PURPOSE
The purpose of this Infrastructure Strategy, as prescribed by the Local Government Act 2002, is to identify the significant
infrastructure issues for Tasman over the next 30 years, and to identify the principal options for managing those issues and
the implications of those options.
When setting out how Council intends to manage the District’s infrastructure assets and services, it must consider how:
to respond to growth or decline in demand;
to manage the renewal or replacement of existing assets over their lifetime;
planned increases or decreases in levels of service will be allowed for;
public health and environmental outcomes will be maintained or improved; and
natural hazard risks will be addressed in terms of infrastructure resilience and financial planning.
SCOPE
This Strategy covers the following essential infrastructure:
Water Supply Wastewater Stormwater Transportation Rivers & Flood
Control
This Strategy has a 30 year planning horizon and will be reviewed every three years.
For this update of the Strategy the following activities have been excluded at Council’s discretion. During future reviews of
the Strategy, Council will reconsider the inclusion of these activities.
Solid Waste Coastal Assets Community Facilities
Parks and Reserves Commercial Assets Council Property
Hydrometric Assets
This Strategy provides direction to Council’s infrastructure activity management plans, which can be found on Council’s
website http://www.tasman.govt.nz/policy/plans/activity-management-plans/.
All financial information included in this Strategy includes inflation.
CONTEXT
DISTRICT OVERVIEW
The Tasman District is located in the north-west of the South Island. It covers the area extending
from Golden Bay in the north-west to Richmond in the east and Murchison in the south, covering
9,654 square kilometres of land, 817km of coastline, and including 17 settlements/towns.
POPULATION
At 30 June 2017, Statistics New Zealand estimated Tasman District’s population to be 51,100. Over the last 10 years, the
District has experienced average annual growth of 1.2%. Two thirds of the population live in 17 urban settlements spread
throughout the District, and the other third live in the rural areas. The settlements vary in size from approximately 110 people
living in St Arnaud to 14,600 people living in Richmond. Figure 2 provides an overview of Tasman’s 17 settlements.
INFRASTRUCTURE STRATEGY 2018-2048 PAGE 6
Figure 2: Tasman’s 17 Settlements

         INFRASTRUCTURE STRATEGY 2018-2048   PAGE 7
AGE STRUCTURE Table 1: Tasman’s Age Structure
The median age of Tasman residents was estimated to be AGE GROUP POPULATION PERCENT
46 years at 30 June 2017 and is showing an increasing
0 – 14 years 9,400 18
trend. The age structure of Tasman residents at 30 June
2017 is summarised in Table 1. 15 – 39 years 12,200 24
40 – 64 years 18,800 37
65+ years 10,700 21
DWELLINGS
Tasman’s latest dwelling count was completed as part of Census 2013. At that time, Tasman had approximately 21,700
dwellings.
ECONOMY
The main drivers of the Tasman economy continue to be horticulture, forestry, fishing/seafood, agriculture and tourism.
There are many manufacturing and processing plants associated with these industries, for example the Nelson Pine Industries
plant in Richmond, and dairy factories in Takaka and Brightwater. These industries rely on the road network to transport
their products through Richmond and onto Port Nelson.
CLIMATE SUMMARY
Across Tasman District the winds are generally light except for parts around Farewell Spit where the wind is often strong.
Rainfall is fairly evenly distributed across the year, although February and March are typically the driest months of the year
and the wettest months are typically in winter or spring. Parts of Tasman’s mountains receive in excess of 6000 mm of rainfall
per year. In contrast, the Waimea Basin is the driest area of the District as it is sheltered from rain-bearing weather systems
arriving to New Zealand from the west and south. Here, rainfall totals are approximately 1000 millimetres per year. Dry spells
of more than two weeks are quite common, particularly in eastern and inland locations. In Tasman, temperatures are mild
compared with most parts of the country due to the District’s close proximity to the sea. This causes a relative lack of extreme
high and extreme low temperatures. Temperatures exceeding 30° Celsius are rare in coastal areas. Frosts are quite common
in the cooler months but they occur less frequently than most other South Island locations. Tasman is renowned for receiving
a great deal of sunshine with average annual sunshine hours (approximately 2,400 hours) among the highest recorded in New
Zealand.
The impacts of climate change are discussed later in this Strategy.
INFRASTRUCTURE
The District is served by:
18 water supply schemes including 15 water treatment plants, 21 pump stations, and 756 kilometres (km) of
reticulation;
9 wastewater schemes including 8 wastewater treatment plants, 78 pump stations, and 360 km of reticulation;
187 km of piped stormwater network and 29 km of maintained streams
1,741 km of roads, 282 km of footpaths and cycleways, and 483 bridges
285 km of river spread across six main river catchments; Waimea including 19.5 km of stopbanks, Motueka including
31.2 km of stopbanks, Takaka, Riwaka including 8.25 km of stopbanks, Aorere, and Buller.
INFRASTRUCTURE STRATEGY 2018-2048 PAGE 8
LINKS WITH OTHER DOCUMENTS
FINANCIAL STRATEGY
                                         Alongside this Strategy, Council also prepares a Financial Strategy which sets out the
                                         rate increase and net debt level caps for the next 30 years. Infrastructure expenditure
                                         forms a large proportion of Council’s spending being 40% of operational expenditure
      “Providing the                     and 82% of capital expenditure over the next 10 years. The two strategies are closely
       right balance                     linked to ensure the right balance is struck between providing the agreed levels of
                                         service for infrastructure assets within the agreed financial caps. Often these financial
      between levels
                                         caps will influence how Council manages and develops existing and new assets. This is
      of service and                     especially so for the next 10 years.
           cost.”                        Over the next 10 years, forecast rate income increases and net debt levels are projected
                                         to be near Council’s caps. Council has had to work hard to prioritise and plan a work
                                         programme which addresses the key issues outlined in this Strategy while staying within
                                         these caps. Given Council’s net debt is projected to peak at $199m in Year 2021/22
                                         there is very little scope to add further work programmes in the next five years.
LINKAGES
There are multiple factors that influence how Council should plan and manage its assets. These factors can be grouped into
three broad categories which are described below in Figure 3.

                                                          LONG TERM PLAN

                                                         Council’s Vision &
                                                       Community Outcomes

                                         Infrastructure
                                                                              Financial Strategy
                                            Strategy

                 Internal Factors                      Activity Management                         External Factors
                                                                Plans

                Financial Position                                                          Statutory Requirements
           Policies, Strategies, Plans                                                     Policies, Strategies, Plans
             Organisational Capacity                      Customer Factors                           Technology
                  & Capability                                                                     Climate Change
                                                            Expectations
                                                                                                   Natural Hazards
                                                          Population Growth
                                                            Demographics
                                                          Economic Drivers

Figure 3: Strategic Linkages and Factors Affecting Infrastructure Planning

INFRASTRUCTURE STRATEGY 2018-2048                                                                                         PAGE 9
KEY INFRASTRUCTURE ISSUES AND PRIORITIES
POPULATION GROWTH AND DEMOGRAPHICS
Tasman is one of New Zealand’s sunbelt regions and is generally noted for its mild winters, frequent sunny skies, and growing
economic opportunities. This is a key drawcard for the District and one of the leading reasons why Tasman is a desirable
place to live. This is proven by Tasman’s growing population. In recent years Tasman has experienced a high rate of
population growth. Figure 4 below shows the rate of estimated population growth as well as a range of projections for
population growth into the future.
                                        70000

                                        65000
                  Resident Population

                                        60000

                                        55000

                                        50000

                                        45000

                                        40000

                                                                                                  Year
                                                Tasman's Assumed Population Projection                           Population Estimate
                                                Population Projection (Stats NZ) - High                          Population Projection (Stats NZ) - Medium
                                                Population Projection (Stats NZ) - Low

Figure 4: Tasman’s Population Projections

                                                          The actual population growth of each settlement varies across the District with the highest growth
                                                          observed in Richmond followed by Motueka. After careful consideration of recent actual growth
                                                          and future projections Council has determined that it will plan for high population growth for the
                                                          first ten years followed by medium thereafter for Richmond, Brightwater, Wakefield, Motueka and
                                                          Mapua / Ruby Bay. Council is planning for medium population growth for the next 30 years for all
                                                          other settlements and rural areas. Figure 4 also shows the population projection for the District
                                                          that Council has adopted for its planning purposes. This shows that Tasman’s population is
                                                          expected to grow by 4,400 residents over the next 10 years, to reach 55,690.

A high proportion of the population growth is occurring as a result of people moving to Tasman. The
growth projections indicate that many of these people are older and are choosing to live in larger
settlements with easier access to services. This means the composition of Tasman’s households is
changing. Generally, the number of people living in each home is decreasing and our population is
ageing. Tasman’s projected age structure is shown below in Figure 5.

                      22500
  No. of People

                      17500

                      12500

                                7500
                                                   2013             2018             2023          2028                2033             2038                 2043
                                                                                                  Year
                                                             0-14 years           15-39 years            40-64 years           65 years and over

Figure 5: Tasman’s Population Projections by Age Group

INFRASTRUCTURE STRATEGY 2018-2048                                                                                                                        PAGE 10
In 2013, the percentage of Tasman’s population aged over 65 years was 18%, compared with the national average of 15%.
Within 30 years, the percentage of Tasman’s population aged over 65 year is projected to be 37%, compared with the national
average of 23%. This indicates that Tasman’s age structure is approximately 25 years ahead of national trends. It is likely
that Tasman will need to be a leader of change in providing for an ageing population. Council needs to consider and plan for
a larger portion of the population that is likely to be on a fixed income and may experience personal mobility challenges. This
is likely to cause an increased demand for high quality pedestrian facilities and alternative modes of transport.
Using the above information Council has determined that Tasman will need to supply approximately
2,955 new dwellings within the next ten years, and a further 3,040 between 2028 and 2048. Council
will need to provide most of these new dwellings with water, wastewater and stormwater, and all
will create an increasing load on Tasman’s transportation network.
It is important to note that even if no new people shift to Tasman, the structure of our existing
population is ageing. This is driving a reduction in the number of occupants per household. That
means that if no new people arrive in Tasman there is likely to still be some demand for more
houses.
In 2015, Council planned for medium population growth. Since then actual growth has surpassed what Council had assumed,
using up considerable amounts of available infrastructure capacity. The combination of this and the projected population
increases and demographic change present a significant challenge to Council as to how they provide infrastructure to service
new dwellings. Particular settlements of concern are Richmond, Mapua/Ruby Bay and Motueka.
In 2016, the Government released the National Policy Statement on Urban Development Capacity (NPS-UDC). The NPS-UDC
directs local authorities to provide sufficient development capacity in their resource management plans, supported by
infrastructure, to meet demand for housing and business space. The NPS-UDC classifies Richmond and Nelson as one urban
area and assumes that the area will experience medium population growth. For Richmond and Nelson, the NPS-UDC requires
both Councils to ensure sufficient, feasible development capacity is available and to provide an additional margin of feasible
development capacity over and above projected demand of at least 20% in the short and medium term, and 15% in the long
term. The release of the NPS-UDC has reinforced to Council the need to plan and provide infrastructure to enable the
population growth.
NATURAL HAZARDS
Tasman District comprises a diverse landscape ranging from flat coastal low lands and intensively used (predominantly
horticulture) alluvial flood plains to large sparsely populated steep mountainous areas. The District has several major rivers
traversing it, including the Aorere, Buller, Motueka and Takaka rivers that pass close by townships. The geology is relatively
complex and varied with numerous active fault systems. These include the Waimea Flaxmore fault system that runs through
urban areas of Richmond, and the Alpine/Wairau Fault that passes through the Nelson Lakes area at the south of the Region.
Tasman District is susceptible to a wide range of hazards, and has over time, felt the impact of natural hazards such as
earthquakes, landslides, floods and coastal inundation. Many hazards originate from within the District, but there is also
potential for the area to be affected by hazards generated from outside the District’s boundaries or hazards that affect
multiple regions for example, an Alpine fault earthquake or tsunami.
For the purposes of this Strategy, these risks have been categorised into three broad areas:
Flooding and land instability
Earthquakes and tsunami
Coastal erosion and inundation
INFRASTRUCTURE STRATEGY 2018-2048 PAGE 11FLOODING AND LAND INSTABILITY At times, Tasman District experiences a diverse range of extreme weather. Recently, major damage to property and infrastructure has occurred because of these extreme weather events, and this has come at a significant cost to Council, households and businesses. Recent examples include Aorere River flooding, and extreme rainfall in Golden Bay and Richmond resulting in extensive surface water flooding and landslides. The performance of Council’s flood control and stormwater assets during rainfall events can have an impact on the amount of damage sustained by both public and private property. Recent events, like those that occurred between 2010 and 2013, place the spotlight on the performance of these assets and the community’s level of service expectations often increase following an event. The Ministry for Environment’s climate change advice suggests that rainfall patterns are likely to change long term. Increases in rainfall are expected in winter for the entire District but are likely to be more pronounced in the southern and western parts. The nature of rain events are also expected to increase in intensity meaning an increased amount of rain over a shorter period of time. With the changing rainfall patterns, Tasman District is also expected to experience longer periods of no rainfall increasing the time in which drought conditions will be present. This is likely to be particularly in the eastern part of the District, as was experienced during December 2017. Increasing periods of drought will place increasing pressure on Council’s water sources meaning that Council can expect to see greater rationing and have difficulty supplying the growing population, particularly in the Waimea Basin. EARTHQUAKES AND TSUNAMI Fortunately, Tasman District has not experienced major disruption from earthquakes in recent times. However, the risk of major fault rupture is present. The Alpine Fault has a high probability (estimated at 30% to 50%) of rupturing in the next 50 years. The rupture may produce one of the biggest earthquakes since European settlement of New Zealand, and it will have a major impact on the lives of many people as well as catastrophic consequences for some assets. The Regional Civil Defence Emergency Management Group has ranked rupture of either the Waimea/Flaxmore fault or the Alpine fault as the highest risk and priority for the Nelson-Tasman region. Earthquakes happen with little or no warning. The Kaikōura earthquake demonstrated how communities can be immediately isolated and the challenges of reinstating access and services to those communities. In the event of a major rupture it is reasonable to expect the Nelson-Tasman region to be isolated from other parts of New Zealand for an extended period of time, potentially many months. An offshore fault rupture or land movement can generate a tsunami as well as ground shaking. There are three distinct types of tsunami, distant, regional, and local. A local tsunami is likely to arrive with little to no warning following an earthquake. The Regional Civil Defence Emergency Management Group has identified this as high risk and priority for the Nelson-Tasman Region, whereas both regional and distant tsunami are considered to be a lower priority. As seen in other parts of the world, tsunamis can have devastating effects on above ground public and private infrastructure. In the event of a local tsunami there is likely to be extensive damage to Council’s roads, pump stations and treatment plants that are in low lying areas near the coast. COASTAL EROSION AND INUNDATION Seven of Tasman’s settlements are located in coastal areas, representing approximately 11,500 people. These are Collingwood, Kaiteriteri, Mapua/Ruby Bay, Motueka, Pohara/Ligar Bay/Tata Beach, Riwaka, and Tasman. There is also widespread development in rural areas along our coastline that is exposed to the risk of coastal erosion and inundation. Tasman residents have experienced the impact of coastal erosion and inundation both within private property and public areas. Where Council’s assets are located in close proximity to the coast, these have also been affected by erosion, most noticeably the erosion of roads and pathways. Climate change advice from the Ministry for Environment suggests that Council should plan for sea level rise of at least 0.8m by 2090 based on the average 1980 – 1999 levels. As this occurs, new areas of Tasman’s coast will be exposed to wave action generating further erosion, as well as increasing the risk of inundation from storm surges. Council expects increasing rates of erosion and associated repair costs. Council will also need to consider improved protection of assets, or potentially relocating further away from the coast. INFRASTRUCTURE STRATEGY 2018-2048 PAGE 12
PUBLIC AND ENVIRONMENTAL HEALTH RISKS
Council builds and operates infrastructure to provide essential services to and improve the well-being of its communities.
Sometimes if these assets are managed incorrectly it can have a negative impact on public health or the environment.
In other parts of New Zealand there has been asset failure which has resulted in significant harm to communities. Examples
include sickness due to contaminated drinking water supplies, and flooding due to stopbank failure. For Council, this has
reinforced the need to ensure its assets are well maintained and operated, and to learn from the mistakes of others. A
standout issue for Tasman is the challenge of providing water supplies that meet the NZ Drinking Water Standards. Currently,
out of 17 water supply schemes that Council maintains, only three fully comply with the requirements of the NZ Drinking
Water Standards. To achieve full compliance, Council’s water treatment plants will need upgrading.
As well as looking after the health of Tasman’s residents, Council must also protect the health of the environment. Sometimes
there are negative effects on the environment that are created inadvertently by the provision of infrastructure. This can
include wastewater overflows and contaminated stormwater. The Resource Management Act and National Policy Statement
– Freshwater Management place obligations on Council to ensure our natural environment is protected.

AGEING INFRASTRUCTURE
Throughout Tasman District, Council is responsible for $1.1 billion worth of infrastructure assets. These assets have a finite
period in which they will operate suitably; known as an asset’s ‘useful life’. Once the useful life of an asset is reached, the
asset will usually require renewal or replacement. The useful life of assets varies significantly from 10 years for signs or road
chip seal up to 100 years for bridges and pipes. A lot of Tasman’s infrastructure was built between the mid-1900s and the
1980s. To date, this has meant that Council has largely had to renew assets with relatively short useful lives and that most
of the longer life assets are yet to be renewed.
Figure 6 to Figure 9 show the long-term renewal investment required based on the expected asset life for Council’s bridges
and pipes. Council needs to be very mindful of these types of assets when forecasting future renewal needs because they
will generate the most change in the demand for renewal investment. However, this is most relevant beyond the period of
this Strategy. For the period of the Strategy, Council expects the renewal of short life assets to continue much the same as
recent times, effectively creating a stable baseline for renewal investment which bridges and pipes will add to in the future.
Council needs to plan well ahead of time in order to manage and fund this big step up in renewal activity.

           14,000
                    Period of Infrastructure Strategy

           12,000

           10,000

            8,000
    $000

            6,000

            4,000

            2,000

               0

Figure 6: 100 Year Bridge Renewal Profile – Uninflated as at 1 April 2017

INFRASTRUCTURE STRATEGY 2018-2048                                                                                      PAGE 13
14,000
Period of Infrastructure Strategy
12,000
10,000
8,000
$000
6,000
4,000
2,000
0
Figure 7: 100 Year Stormwater Pipe Renewal Profile – Uninflated as at 1 April 2017
14,000
Period of Infrastructure Strategy
12,000
10,000
8,000
$000
6,000
4,000
2,000
0
Figure 8: 100 Year Water Pipe Renewal Profile – Uninflated as at 1 April 2017
14,000
Period of Infrastructure Strategy
12,000
10,000
8,000
$000
6,000
4,000
2,000
0
Figure 9: 100 Year Wastewater Pipe Renewal Profile – Uninflated as at 1 April 2017
INFRASTRUCTURE STRATEGY 2018-2048 PAGE 14OUR INFRASTRUCTURE PRIORITIES Council has identified four key priorities to help guide Council’s efforts and investment in planning, developing and maintaining its assets in the short, medium and long term. These priorities are listed below in no particular order. 1 Providing safe and secure infrastructure services Providing safe and secure infrastructure services is paramount to Council. Council aims to provide public water supplies that are safe to drink, a transport network where people feel they can move about safely, and public assets that are safe to use. Not only do our infrastructure services need to be safe and available now, they need to be secure into the future. Council aims to provide security in the services that it delivers and avoid significant disruptions. For example, water takes for public water supplies should be enduring and have a low risk of becoming unavailable. 2 Providing infrastructure services that meet the needs of our changing population Council will continue to enable growth through the development of trunk and main infrastructure as it has done in the past. However, as Tasman grows and changes, we expect the density of our urban populations to increase and there to be significant advancements in technology. This will place a changing demand on the infrastructure networks at the same time as presenting opportunities to optimise the use of existing assets through smarter operational procedures. Council expects the most significant change to be less reliance on individual self-drive motor vehicles in the future and more demand for alternative travel options. 3 Planning, developing, and maintaining resilient communities Infrastructure resilience is the ability to reduce the magnitude and/or duration of disruptive events. The effectiveness of resilient infrastructure depends upon its ability to anticipate, absorb, adapt to, and/or rapidly recover from a potentially disruptive event. For Tasman’s communities to cope well with change and disruption, they must be resilient. Resilience will not be achieved through the actions of Council alone. Council will need to work together with other organisations such as the Regional Civil Defence Emergency Management Group and residents to effectively build resilience and plan for recovery. 4 Prudent management of our existing assets and environment Council cannot lose sight of the importance of maintaining its existing assets or the need to continue to protect Tasman’s natural environment. If Council does not put the right level of effort into looking after what we have now it can have a significant impact on what future generations experience and need to pay for. With built assets, Council aims to invest in renewal and maintenance at an optimised level. Too little investment in renewals could see more and more assets becoming run-down, costing more to maintain and increasing whole-of-life costs. Too much investment in renewal and Council would not be getting the best value it could from assets by prematurely replacing them, again increasing whole-of-life costs. INFRASTRUCTURE STRATEGY 2018-2048 PAGE 15
KEY ASSUMPTIONS AND UNCERTAINTIES
There are factors outside of Council’s control that can change, impacting on our ability to do what is
planned. Sometimes the impact can be significant. There is always uncertainty in any planning
process, but the key to good quality planning is to make clear assumptions to help address this
uncertainty. In this section, we have set out the key assumptions and uncertainties that relate to the
provision and management of infrastructure.

                           GROWTH
                           Council cannot be certain what the actual rate of population and business growth will be. There
                           are local, national, and international factors that can affect the actual rate of growth, either
                           speeding it up or slowing it down. For example, some of these factors include employment
                           opportunities and immigration policies. For planning purposes Council has assumed that
                           population growth will be medium to high as set out earlier in this Strategy.
                           If growth is slower than assumed, Council may be able to defer some infrastructure upgrades
                           associated with providing increased capacity. Where infrastructure has already been installed to
                           provide for future growth it may take Council longer to pay off the debt associated with the works.
                           This is because development contribution income will also slow. The increased financing costs
                           associated with this will be incorporated into future development contribution charges.
                           If growth occurs faster than assumed, Council may need to advance planned upgrades or consider
                           unplanned infrastructure to provide additional capacity sooner. In order to do this Council may
                           need to reprioritise other works to ensure it maintains a programme of work that is affordable
                           within existing financial caps and also deliverable. If this occurs, development contribution
                           income is also likely to increase meaning that debt associated with growth is paid off quicker.

WATER AVAILABILITY
Council cannot be certain what the actual climatic conditions of the future will be, nor the
demand for community water supplies, but has assumed both will increase. Council has
instigated a process to secure an augmented water source in the Waimea Basin to address the
risks associated with drought, increasing demand, and existing over subscription of the
aquifers. Council’s preferred solution is the construction of the Waimea Community Dam. In
preparing this Strategy, Council has assumed that the dam will be built as planned. If this is not
the case, Council will need to implement an alternative urban water augmentation solution or
demand management measures to addresses the risk and demand. Without the dam, there will
be greenfield growth areas in Brightwater, Richmond and Mapua that Council will not be able
supply water to. In a ‘no dam’ scenario, there will be associated infrastructure planned for these
areas that will no longer be necessary, or the timing may be delayed.

                           STATUTORY CHANGES
                           Central government often enacts new statutory requirements that affects Council and the way it
                           must manage its assets. When planning, Council cannot be certain when these changes will take
                           place or of the scope of change that will be made until it is confirmed by Central Government.
                           Council is aware that change is proposed for the Government Policy Statement on Land Transport,
                           and that there is potential changes likely to be made to the Drinking Water Standards New
                           Zealand. When preparing this Strategy, Council has had to work to the current versions of both
                           of these documents. If changes are significant, Council may need to review the scope and timing
                           of some of the transportation programme, and the water treatment plant upgrades.

INFRASTRUCTURE STRATEGY 2018-2048                                                                                    PAGE 16
EXPECTED LIFE OF ASSETS
Council cannot be certain how long each individual asset will last. Even if assets are made from
the same material, it is unlikely that they will age exactly the same as each other. Factors such as
installation methodology, operating conditions, wear and tear, and manufacturing defects will
affect how long each individual asset will actually last before needing replacement. To address
this uncertainty, Council assigns an average expected life for types of assets to assist with renewal
planning.
For the purposes of long term planning for utilities assets, Council has generally used average asset
life expectancy to estimate future renewal requirements. Actual asset condition and performance
has only been incorporated for assets that have shown clear signs of premature failure. These
exceptions include the early replacement of the Mapua water trunk main and Thorp Street water
main. For transportation assets, Council uses a mix of average asset life expectancy, asset
condition and performance.
Overall Council’s asset data reliability is generally B/C grade. This means that the data used to
determine Council’s renewal forecasts has an uncertainty of approximately 15% to 30% and that
renewal needs in any year could vary to this extent.
Some assets will fail before reaching the end of their expected useful life, and some will last longer.
Council has assumed that it will be able to manage this variance within the budgets it has set by
annually prioritising renewals.
SCOPE RISK AND TOTAL FUNDED CAPITAL PROGRAMME
When developing this Strategy and the associated work programmes, Council needs to estimate
how much to budget for each project. Often, Council cannot be certain what the actual costs or
scope of the project will be because the design is yet to be completed. Typically, Council has
more confidence in the cost and scope of projects that are planned within the first three years.
After this, estimates are usually based on simple concept designs.
To address this uncertainty, Council has incorporated funding of scope risk into capital project
budgets. The amount of scope risk included varies from 5% to 25% of the project estimate,
depending on the expected complexity of the individual project. Based on history, it is unlikely
that all individual projects will need the full amount of allocated scope risk funding, in reality
there will be some under and over spending.
For the water, wastewater, and stormwater activities, Council has made an overall downward
adjustment to the total capital programme of 5% per year. This adjustment acknowledges that
Council is unlikely to use the full amount of scope risk in the programme for every project and
enables Council to avoid over-funding the activities. We refer to this as the total funded capital
programme.
INFRASTRUCTURE STRATEGY 2018-2048 PAGE 17HOW WE MANAGE OUR INFRASTRUCTURE ASSETS
This section outlines how Council plans to account for the growth that is occurring across Tasman,
the on-going need to renew assets, and opportunities to improve levels of service, public health, the
natural environment, and resilience.
SUPPORTING GROWTH
Council has planned to only provide trunk and main infrastructure for growth areas where more than one development is
served. The programme of work that supports this Strategy has been prepared to support growth across the District for the
next 30 years. Richmond, Motueka and Mapua/Ruby Bay are priorities for investment as most of the capacity of the existing
infrastructure in these areas has been taken up already. Key growth areas within these settlements include Richmond West,
Richmond South, Motueka West and Mapua. Figure 10 shows the total planned investment in growth infrastructure for the
next 30 years.
9,000,000
8,000,000
7,000,000
6,000,000
5,000,000
4,000,000
3,000,000
2,000,000
1,000,000
0
2044/45
2046/47
2018/19
2019/20
2020/21
2021/22
2022/23
2023/24
2024/25
2025/26
2026/27
2027/28
2028/29
2029/30
2030/31
2031/32
2032/33
2033/34
2034/35
2035/36
2036/37
2037/38
2038/39
2039/40
2040/41
2041/42
2042/43
2043/44
2045/46
2047/48
Figure 10: Total Growth Expenditure for Infrastructure for the next 30 Years
Council will use development contributions to fund the growth costs shown in Figure 10. For more funding information, refer
to Council’s Development Contributions Policy and Revenue and Financing Policy.
INVESTING IN ASSET RENEWAL
Council has generally planned the rate of renewal investment for water, wastewater, stormwater, and rivers and flood
protection assets based mainly on the age of the assets and their expected useful life. Exceptions have been made where
assets have notably performed poorly and these have specifically been programmed for early replacement. For roads, Council
uses age, condition and demand data to predict an optimised programme of renewal. Following the premature failure of the
Mapua water trunk main, Council plans to be more risk adverse when planning renewals where there is an emerging trend
in asset failure. Figure 11 shows the total planned investment in renewal of infrastructure assets for the next 30 years.
As highlighted earlier in this Strategy, Council’s infrastructure renewal profile is projected to significantly increase beyond
the period of this Strategy. This will likely present a funding challenge to Council in approximately 50 years’ time.
Council has planned to progressively fully fund depreciation (i.e. the wearing out of assets as it occurs) through rates and
other income streams by 2025. Over the next 30 years, funding of depreciation generally exceeds Council’s immediate
asset renewal needs. This means that there is an excess of depreciation funding that can be used to manage Council’s cash
position as a whole, helping to reduce debt. In the long term, Council expects that asset renewal needs will exceed the
funding that Council collects for depreciation. When this occurs, it is likely that Council will need to fund asset renewals
through a mix of depreciation funds and borrowing.
Council plans to undertake more mature renewal planning over the next six years to better understand this issue and
consider the associated potential effects on Council’s future borrowing requirements.
INFRASTRUCTURE STRATEGY 2018-2048 PAGE 1830,000,000
25,000,000
20,000,000
15,000,000
10,000,000
5,000,000
0
2023/24
2036/37
2018/19
2019/20
2020/21
2021/22
2022/23
2024/25
2025/26
2026/27
2027/28
2028/29
2029/30
2030/31
2031/32
2032/33
2033/34
2034/35
2035/36
2037/38
2038/39
2039/40
2040/41
2041/42
2042/43
2043/44
2044/45
2045/46
2046/47
2047/48
Renewal
Figure 11: Total Renewal Expenditure for Infrastructure for the next 30 Years
MANAGING LEVELS OF SERVICE
Levels of service are what Council has agreed to deliver to the community. They are attributes that describe the service from
the customer’s perspective. Levels of service are set through Council’s Long Term Plan, sometimes in response to community
desire, and sometimes in response to statutory requirements. Due to Council’s financial position, there is little scope for
Council to significantly improve levels of service over the next five to 10 years. Council has had to focus investment on
meeting levels of service, and making improvements due to statutory requirements. Where relatively low cost opportunities
are available to improve customers experiences, Council has planned to do these. This includes increasing investment in
unsealed road maintenance.
The following table summarises where Council has planned to improve levels of service. A full list of Council’s agreed levels
of service can be found in the activity management plans. Figure 12 shows the total planned investment in level of service
improvements for the next 30 years.
Table 2: Proposed Level of Service Changes
ACTIVITY TYPE OF CHANGE DESCRIPTION
ENVIRONMENTAL HEALTH
Improve compliance with NZ’s Invest in meeting the requirements of the Drinking Water
Drinking Water Standards Standard New Zealand.
Water
Reduce water loss from the Invest in proactive leak detection and repairs, and on-
network going pipe renewal.
Reduce incidences of wastewater Invest in pipe and pump station upgrades.
overflows into waterways
Wastewater
Improve network resilience Invest is additional storage or standby electrical
generation
Maintain focus on mitigating Prioritise investment in network upgrades that mitigate
Stormwater flooding of habitable floors flooding of habitable floors rather than nuisance surface
water flooding.
Increase the number of people Invest in improved cycling facilities.
using cycling as a mode of
transport
Transportation
Increase the number of people Invest in expanded public transport services.
using public transport
INFRASTRUCTURE STRATEGY 2018-2048 PAGE 19ACTIVITY TYPE OF CHANGE DESCRIPTION
ENVIRONMENTAL HEALTH
Rivers & Flood Increasing the amount of native Invest in new and existing native riparian planting.
Control riparian planting
60,000,000
50,000,000
40,000,000
30,000,000
20,000,000
10,000,000
0
2023/24
2036/37
2018/19
2019/20
2020/21
2021/22
2022/23
2024/25
2025/26
2026/27
2027/28
2028/29
2029/30
2030/31
2031/32
2032/33
2033/34
2034/35
2035/36
2037/38
2038/39
2039/40
2040/41
2041/42
2042/43
2043/44
2044/45
2045/46
2046/47
2047/48
Figure 12: Total Level of Service Expenditure for Infrastructure for the next 30 Years
MAINTAINING PUBLIC AND ENVIRONMENTAL HEALTH
Through the provision of infrastructure, Council has an influence on public and environmental health. Table 3 summarises
key aspects.
In this Strategy, Council has changed its approach to public and environmental health in the following areas.
Water Supply – Council has focused on complying with the NZ Drinking Water Standards to ensure that the water
provided to communities is safe to drink sooner than previously planned.
Wastewater – Council has prioritised investment to areas in Mapua and Pohara where overflows have been a
problem.
Stormwater – Council has implemented an integrated approach to catchment management planning which looks at
catchments in a holistic manner and considers multiple factors when identifying improvements. The main factors
include flooding, amenity and the environment.
Transportation – Council has focused more on safe and accessible transportation networks that are fit for purpose,
and has provided more budget to increase the frequency of road sweeping in areas with typically high contaminants.
Table 3: Measures Used to Maintain Public and Environmental Health
RELEVANT STATUTES
ACTIVITY PUBLIC HEALTH ENVIRONMENTAL HEALTH
/ REGULATIONS
Water Council aims to provide a safe Council aims to always comply with Resource
and reliable supply of drinking the conditions of its water take Management Act
water to residents and consents so that water is not over Health Act
businesses. extracted from aquifers or streams. Local
Government Act
Wastewater Council collects wastewater Council collects wastewater from Resource
from properties and properties and adequately treats it Management Act
adequately treats it before before discharging back to the Local
discharging back to the environment. Wastewater is Government Act
environment. collected and transferred in a
manner that minimises odours and
overflows.
INFRASTRUCTURE STRATEGY 2018-2048 PAGE 20RELEVANT STATUTES
ACTIVITY PUBLIC HEALTH ENVIRONMENTAL HEALTH
/ REGULATIONS
Stormwater Council aims to collect and Council aims to minimise the level of National Policy
discharge rain water in a way contaminants in stormwater Statement –
that minimises disruption to discharges, and manages natural Freshwater
normal community activities streams in a manner that protects Management
and risk to life. the natural habitat within the Local
stream. Government Act
Resource
Management Act
Transportation Council provides a range of Council has a regular road sweeping Resource
transport options that and sump cleaning regime to Management Act
connects communities and prevent contaminants from being Land Transport
enables access to health care washed off the road and into the Management Act
and recreation natural environment.
Rivers & Flood Council manages stopbanks to Council manages gravel aggregation Resource
Control maintain flood protection for and river planting in a manner that Management Act
residents and businesses protects the natural features and life
within the river systems.
MANAGING RISKS AND IMPROVING RESILIENCE
Tasman’s communities are faced by the ongoing presence of risks from natural hazards and Council needs to ensure that it
provides infrastructure that is resilient and that it is prepared financially to respond to and recover from damaging events.
Through this Strategy, Council has placed more emphasis on natural hazard planning and the need to build resilient
infrastructure services that can cope during times of major disruption or that can be restored quickly. Council has budgeted
to undertake some minor infrastructure improvements which will help build resilience, including the provision of backup
power generators and additional storage capacity. These improvements will be the start of a wider programme of work that
will be necessary in order to improve resilience to an adequate level. Currently, Council does not have enough information
to adequately plan a full suite of resilience upgrades for the medium and long term horizon.
During 2018 and 2019, Council’s has planned to undertake more robust risk, resilience and recovery planning in order to
provide better information on network resilience needs. Once this is work is complete, it is likely that Council will need to
add further infrastructure projects and budget to its work programme in order to continue to improve network resilience.
As well as ensuring its assets are resilient, Council has a range of financial provisions to assist with response to and recovery
from major damaging events. These include:
Annual emergency funding;
An established Emergency Fund that Council aims to maintain to a value of $12.8 million;
Ability to reprioritise Council’s capital programme;
Insurance cover of 40% of the costs of a catastrophic disaster event, up to $125m;
Central Government support of up to 60% through the Local Authority Protection Programme;
NZ Transport Agency subsidy of at least 51% for subsidies transportation asset reinstatement.
INFRASTRUCTURE STRATEGY 2018-2048 PAGE 21CRITICAL ASSETS AND LIFELINES
Knowing what’s most important is fundamental to managing risk well. By knowing
this, Council can invest where it is needed most and it can tailor this investment at the
right level. This will avoid over investing in assets that have little consequence of
failure, and will ensure assets that have a high consequence of failure are well
“First things managed and maintained. For infrastructure, this is knowing Tasman’s critical assets
and lifelines, these typically include:
first – know
Arterial road links including bridges
what is most
Water and wastewater treatment plants
important”
Trunk mains
Main pump stations
Key water reservoirs
Stopbanks
Detention dams
During 2016, Council in partnership with Nelson City Council, the Regional Civil Defence Emergency Management Group and
other utility providers, prepared the Nelson Tasman Lifelines Report. This report summarises all lifelines within Nelson and
Tasman and covers the activities included in this Strategy. Within the report there were a number of actions identified to
improve the Region’s infrastructure resilience. Improvements relevant to Council’s infrastructure include:
Water
Review need for additional storage
Review hazards at all treatment and pumping station sites
Complete introduction of digital SCADA network
Review water reticulation under the Mapua estuary
Wastewater
Upgrading pump stations to provide additional storage capacity
Reduce inflow and infiltration flows within the reticulation
Reticulation renewals programme
Review hazards at all treatment and pumping station sites
Complete implementation of digital SCADA network
Review wastewater reticulation under the Mapua estuary
All of the above improvements have been considered by Council when preparing its activity management plans and the work
programme contained in them. Over the next three years, as part of the risk, resilience and recovery planning work Council
will focus on the planning and management of its critical assets and lifelines to ensure that the appropriate level of effort is
being made to manage, maintain and renew them. This will extend to ensuring that Council has adequate asset data to
enable robust decisions to be made regarding the management of those assets.
INFRASTRUCTURE STRATEGY 2018-2048 PAGE 22LONG TERM FINANCIAL ESTIMATES
Council is taking a prudent financial approach to managing its infrastructure, with moderate overall
cost increases and a steady capital programme. This section provides a summary of the total
investment Council is planning to make in infrastructure over the next 30 years.
TOTAL OPERATING EXPENDITURE
The annual operating costs for Council’s infrastructure are forecast to rise from around $33 million in 2018, to $42 million in
2028, and $66 million by 2048. This results in an annual increase of around 2.8% on average in the first 10 years, and 3.4%
over the 30 years. These increases are primarily caused by increases in direct costs, increased loan servicing costs, and
inflation.
45,000,000
40,000,000
35,000,000
30,000,000
25,000,000
20,000,000
15,000,000
10,000,000
5,000,000
0
2018/19 2019/20 2020/21 2021/22 2022/23 2023/24 2024/25 2025/26 2026/27 2027/28
Year 1 Year 2 Year 3 Year 4 Year 5 Year 6 Year 7 Year 8 Year 9 Year 10
Direct Indirect
Figure 13: Year 1 to 10 Infrastructure Annual Operating Costs
350,000,000
300,000,000
250,000,000
200,000,000
150,000,000
100,000,000
50,000,000
0
2018 to 2023 2023 to 2028 2028 to 2033 2033 to 2038 2038 to 2043 2043 to 2048
Yr 1 to 5 Yr 6 to 10 Yr 11 to 15 Yr 15 to 20 Yr 21 o 25 Yr 26 to 30
Direct Indirect
Figure 14: Year 1 to 30 Infrastructure 5-Yearly Operating Costs
TOTAL CAPITAL EXPENDITURE
Council has planned to fund $318 million of capital expenditure over the next 10 years, and around $1 billion over the next
30 years. In the first 10 years, 38% of the investment is for level of service improvements, 52% for renewals, and 10% for
growth.
INFRASTRUCTURE STRATEGY 2018-2048 PAGE 2345,000,000
40,000,000
35,000,000
30,000,000
25,000,000
20,000,000
15,000,000
10,000,000
5,000,000
0
2018/19 2019/20 2020/21 2021/22 2022/23 2023/24 2024/25 2025/26 2026/27 2027/28
Year 1 Year 2 Year 3 Year 4 Year 5 Year 6 Year 7 Year 8 Year 9 Year 10
Renewal Level of Service Growth Total Funded Capital Programme
Figure 15: Year 1 to 10 Infrastructure Annual Capital Expenditure
250,000,000
200,000,000
150,000,000
100,000,000
50,000,000
0
2018 to 2023 2023 to 2028 2028 to 2033 2033 to 2038 2038 to 2043 2043 to 2048
Yr 1 to 5 Yr 6 to 10 Yr 11 to 15 Yr 15 to 20 Yr 21 o 25 Yr 26 to 30
Renewal Level of Service Growth Total Funded Capital Programme
Figure 16: Year 1 to 30 Infrastructure 5-Yearly Capital Expenditure
ACTIVITY SUMMARIES
The following graphs show the split of Council’s operating and capital expenditure for infrastructure. For the next 10 years,
Council needs to invest most in water supply due to water treatment plant upgrades. A breakdown of the financials for
each activity is provided in the following activity summaries. The full list of the operating and capital budgets for each
activity is included in Council’s respective activity management plans.
4%
8% 6% 13%
24% 34%
33% 20%
OPERATING CAPITAL
29% 28%
Figure 17: Year 1 to 10 Split of Operating and Capital Expenditure
INFRASTRUCTURE STRATEGY 2018-2048 PAGE 24TIMELINE OF KEY INFRASTRUCTURE PROJECTS INFRASTRUCTURE STRATEGY 2018-2048 PAGE 25
WATER SUPPLY
Council provides potable water to properties and businesses within 18 water
supply areas across Tasman District. For most urban areas the water supply
network also provides adequate pressure to meet firefighting requirements.
Over the next 10 years, Council plans to spend 29% of its total infrastructure
budget on the water supply activity.

ASSET OVERVIEW
The assets that make up Council’s water supply infrastructure are summarised in Table 4.
Historically, Council’s asset registers have been set up to record reticulation asset inventory data, which it does well. Asset
data for water treatment plants is less reliable due to database constraints. Council plans to improve this during 2018.
Table 4: Water Supply Asset Summary

   DESCRIPTION                                     REPLACEMENT VALUE                 DATA RELIABILITY
   15 water treatment plants                       $6.5m                             Poor
   21 pump stations                                $16.4m                            Good
   756km reticulation                              $118.8m                           Good
   4,548 valves                                    $3.3m                             Good
   1,437 hydrants                                  $3.3m                             Good
   117 backflow prevention devices                 $0.3m                             Good
   61 reservoirs                                   $21.5m                            Good
   11,199 water meters                             $5.2m                             Good
   1,522 rural restrictors                         $0.4m                             Good
   32 bores                                        $0.9m                             Good
Note: Replacement Valuation as at 1 April 2017

LEVELS OF SERVICE
Council aims to provide the following levels of service for the water supply activity.

                                                 “Our use of the water resource is
       “Our water is safe to drink”                                                         “Our water takes are sustainable”
                                                             efficient”

      “Our water supply systems                    “Our water supply systems are
                                                                                             “Our water supply activities are
    provide fire protection to a level           built, operated and maintained so
                                                                                               managed at a level that the
       that is consistent with the               that failures can be managed and
                                                                                              community is satisfied with”
          national standard”                            responded to quickly”
As explained earlier in this Strategy, providing safe and secure infrastructure services is a priority for Council. Council has
planned to invest significantly in improving water treatment commencing in 2018 through to 2025. This investment will lift
Council’s performance against its agreed levels of service within the next few years.
Council plans to invest in proactive water leak detection in order to meet agreed levels of service.

INFRASTRUCTURE STRATEGY 2018-2048                                                                                        PAGE 26
You can also read