Assessment of Effects of Proposed Treated Wastewater Discharge to the Te Arikiroa Thermal Channel and Sulphur Bay (Lake Rotorua) - University of ...
←
→
Page content transcription
If your browser does not render page correctly, please read the page content below
ISSN 2463-6029 (Print)
 ISSN 2350-3432 (Online)

Assessment of Effects of Proposed Treated Wastewater
 Discharge to the Te Arikiroa Thermal Channel and
 Sulphur Bay (Lake Rotorua)

 June 2018
 ERI Report 91

 Client report prepared for Rotorua Lakes Council
 By
 Dada, A.C., Hicks, B. J., Ling, N., Hamilton, D. P.
 Environmental Research Institute
 University of Waikato, Private Bag 3105
 Hamilton 3240, New Zealand

 and

 Jonathan A. Abell
 Ecofish Research Ltd, Victoria, Canada
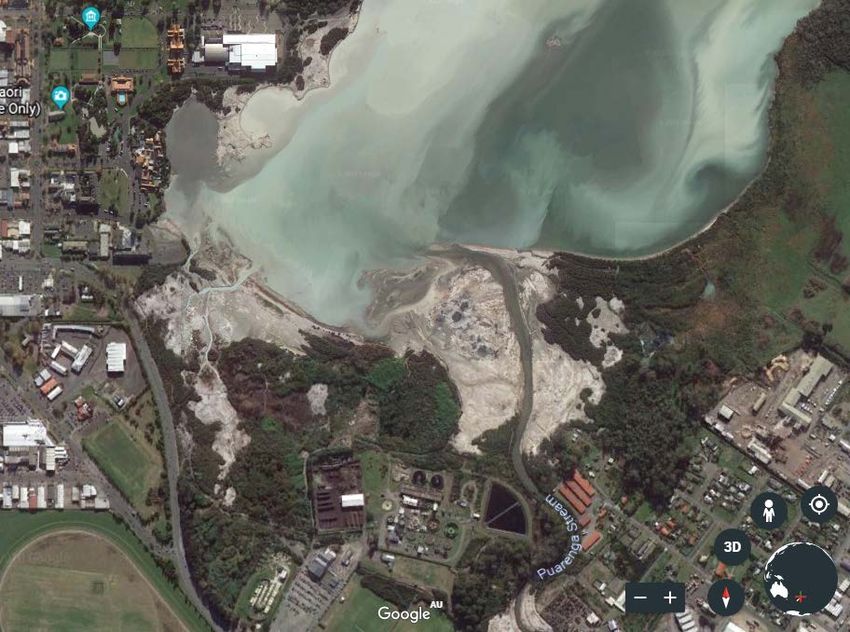
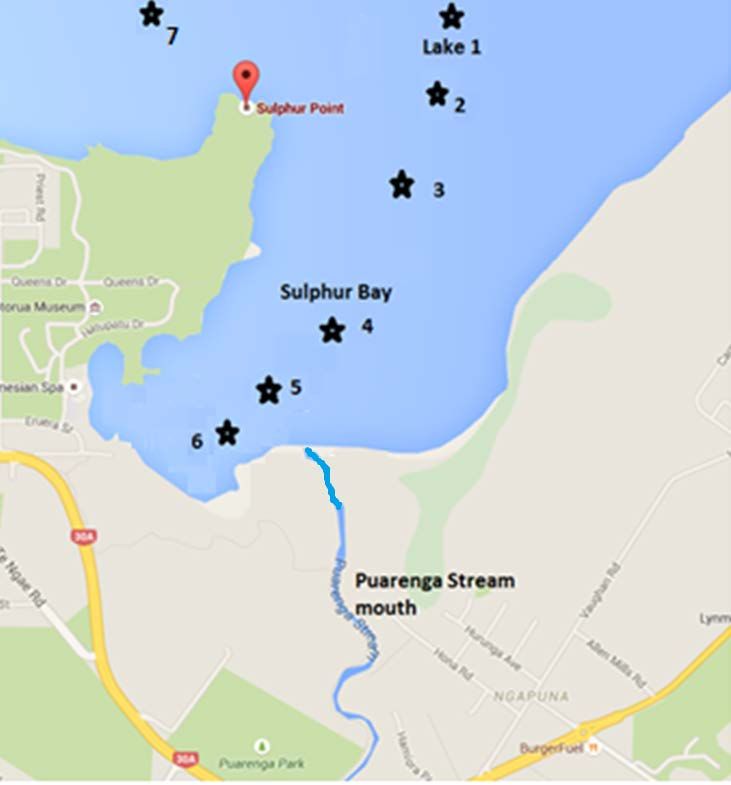
Discharge to the Thermal Channel and Sulphur Bay: Environmental Effects Study Page ii

Cite report as:
Dada*, A.C., Hicks, B. J., Ling, N., Hamilton**, D. P., Abell***, J. M., 2017. Assessment of Effects
of Proposed Treated Wastewater Discharge to the Te Arikiroa Thermal Channel and Sulphur Bay
(Lake Rotorua). Client report prepared for Rotorua Lakes Council. Environmental Research
Institute Report No. 91, The University of Waikato, Hamilton. 80 pp.
* Current address: Streamlined Environmental Limited, 510 Grey Street, Hamilton East,
Hamilton
** Current address: Australian Rivers Institute, Griffith University, 170 Kessels Road, Nathan
4111, Australia
*** Ecofish Research Ltd, Victoria, Canada

Cover: View across Lake Rotorua from Sulphur Bay (Photo: Christopher Dada).

Reviewed by: Approved for release by

Chris McBride John Tyrrell
Senior Research Officer Business Manager
Environmental Research Institute Environmental Research Institute
University of Waikato University of Waikato
Discharge to the Thermal Channel and Sulphur Bay: Environmental Effects Study Page iii

 EXECUTIVE SUMMARY
After 2019, irrigation operations at the Land Treatment System (LTS) in the Whakarewarewa
Forest are scheduled to cease. A number of options and locations have been considered for the
discharge of the treated wastewater when the current discharge consent ceases. Following
consultations and technical assessments, the preferred option of Rotorua Lakes Council is to
upgrade the existing plant to a full Membrane Bioreactor Plant with the addition of an
Ultraviolet Disinfection System (or alternative treatment to achieve an equivalent performance
in terms of treated wastewater quality). Under this arrangement, wastewater would be
subjected to biological, chemical and physical treatment processes, and the treated wastewater
discharged through Te Arikiroa Thermal Channel to Sulphur Bay. Rotorua Lakes Council is thus
undertaking an environmental impact assessment study to determine the effects of discharging
treated wastewater to the thermal channel and Puarenga Bay (Lake Rotorua), with particular
reference to aesthetic, water quality and ecological considerations. These considerations
include potential effects related to faecal indicator bacteria, nutrient concentrations, metals,
dissolved oxygen, and taonga species (native species of cultural significance).
The assessment focused on:
 (i) The projected treated wastewater characteristics;
 (ii) Existing conditions of the receiving water;
 (iii) The sensitivity of the receiving water and the impact of the proposed discharge on
 water quality and taonga species (native species of cultural significance) in Te
 Arikiroa Thermal Channel and Sulphur Bay.
The main techniques used to inform the assessment in this study were:
 1) Analysis of historical water quality data, 2011-2014;
 2) Collection of additional water quality data at Te Arikiroa Thermal Channel and Sulphur
 Bay and along a transect to quantify spatial variability (sampling in 2016 and 2017);
 3) Mass balance dilution modelling to predict water quality in the Te Arikiroa Thermal
 Channel and Sulphur Bay (Lake Rotorua), at a site outside of the assumed mixing zone;
 4) Lake ecosystem modelling conducted by Abell et al. (2015) to assess effects related to
 eutrophication;
 5) Background review of biological information and field investigations for taonga species
 at Sulphur Bay and Te Arikiroa Thermal Channel (2017).
For mass balance dilution calculations, it was assumed that mean baseline discharge (flow rate)
of the thermal channel is 0.01 m3 s-1 and the mean daily discharge of treated wastewater is
0.2756 m3 s-1. Thus, following implementation of the proposed option, the flow in the thermal
channel was assumed to comprise 27.56 parts treated wastewater to 1 part baseline thermal
channel water. The smaller discharge of the thermal channel relative to the treated wastewater
means that the treated wastewater will completely dominate the quality of the water in the
Discharge to the Thermal Channel and Sulphur Bay: Environmental Effects Study Page iv

thermal channel following implementation of the proposed option. Estimation of baseline
conditions in the Te Arikiroa Thermal Channel was informed by the results of grab sampling
undertaken in January 2017. To predict water quality in the lake, mass balance dilution
calculations were used to predict water quality at a monitoring site (‘Site 4’) 250–300 m north
of the Puarenga Stream mouth, outside of an assumed mixing zone that comprises the area
within a 250 m radius of the mouth of the thermal channel. This area may be considered a
“zone of reasonable mixing”, and was identified following: consideration of baseline data;
previous hydrodynamic modelling results, and; consideration of the magnitude of the projected
discharge and the morphology of the receiving bay. To estimate the extent that lake water will
dilute the treated wastewater, results were analysed from a previous study that used a three-
dimensional hydrodynamic model (ELCOM) to simulate the mixing and dilution of treated
wastewater from a shoreline site to the west of the Puarenga Stream mouth, in the vicinity of
the mouth of the Te Arikiroa Thermal Channel (Abell 2015, Abell et al. 2015). Results for two
representative one-month modelling periods in winter and summer showed that the
proportion of treated wastewater present at the surface (0–2 m depth) ranged from 0.1–4.0%
(median = 0.7%) at Site 4, with a 95th percentile proportion wastewater of 3.0%. Consistent with
a precautionary approach, the 95th percentile value (3.0%) was used for mass balance dilution
calculations to predict lake water quality, i.e., the treated wastewater was assumed to mix in
the lake to yield a mixture that comprises three parts wastewater to 97 parts ambient lake
water. This approach is conservative because it is based on the 95th percentile value (i.e., the
modelling predicted that the proportion of treated wastewater would be lower than 3% for
95% of the time) and the concentration of treated wastewater is expected to be considerably
lower in the main body of the lake, relative to conditions at Site 4 at the edge of the mixing
zone. Estimation of baseline water quality at Site 4 in Lake Rotorua was based on the results of
monthly sampling during July 2011 to June 2016 conducted as part of an Alum Dosing
Monitoring Survey, supplemented with the results of additional sampling undertaken in
November 2016 to inform this assessment (to measure nutrients, metals, faecal indicator
bacteria, and water column chlorophyll a).

Results of the assessment for individual indicators are as follows:
Microbiological characteristics
Potential impacts on microbiological characteristics of receiving waters were assessed based on
modelled concentrations of E. coli, which is an indicator of faecal contamination. Projected E.
coli concentrations in the treated wastewater are very low, reflecting the high level of proposed
treatment, which will include an Ultraviolet Disinfection System. Concentrations of E. coli
measured in November 2016 (2 CFU 100 mL-1) were used for the mass balance calculations,
although this is conservative as concentrations following the upgrades are expected to be lower
due to more stringent treatment. Projected concentrations are lower than background
concentrations in the Te Arikiroa Thermal Channel and Lake Rotorua. The mass balance dilution
modelling therefore showed that the proposed discharge option is predicted to reduce E. coli
Discharge to the Thermal Channel and Sulphur Bay: Environmental Effects Study Page v

concentrations in the receiving environment, thus providing improved water quality with
regard to this indicator. Further assessment of microbial risk will be provided in a separate
study conducted by MWH/NIWA that involves modelling the fate of faecal bacteria and
provides a Microbial Risk Assessment. No consideration has been given to other factors that
could compromise the predicted microbial concentrations.

Eutrophication (including macrophytes and periphyton)
Relative to operation of the LTS, the proposed option will increase nitrogen and phosphorus
loads to Lake Rotorua. In isolation, this will contribute to adverse water quality and ecological
effects associated with eutrophication. Projected total nitrogen and total phosphorus
concentrations in the treated wastewater equate to maximum loads of 40 t N yr-1 and 3.0 t P yr-
1.

The effects of the proposed option on eutrophication in Lake Rotorua were considered in detail
by Abell et al. (2015) by applying a one-dimensional lake ecosystem model (DYRESM-CAEDYM).
Those modelling results for Option 6a surface discharge (most comparable to the preferred
option considered here), showed that the mean 8-year TLI3 would be 0.02 TLI3 units higher than
the modelled baseline scenario (no discharge). This difference is small relative to model error,
and is negligible to low from an ecological perspective. The model predictions showed no
change to the baseline Attribute States for chlorophyll a (B), total nitrogen (B) and total
phosphorus (C) that are defined in the National Policy Statement for Freshwater Management
(2014) for protection of ecosystem health in lakes and rivers (in relation to toxicity). The version
denoted as 2014 includes amendments to water quality standards made in 2017; the
referencing format is specified by the Ministry for the Environment.
Although the predicted long-term effects on lake trophic status are minor (negative), there is
potential for more pronounced localised effects on productivity. These could include local
increases in phytoplankton biomass in the southern area of the lake during periods when
background nutrient concentrations in the lake are at limiting concentrations, e.g., during
stratified periods in the summer. Such conditions could also occur some distance from the
outfall, in areas where dominant mixing process cause the discharged treated wastewater to
accumulate. Three-dimensional modelling showed that discharge to Sulphur Bay could result in
accumulation of treated wastewater in the vicinity of Rotorua lakefront following prolonged NE
winds (Abell 2015, Abell et al. 2015). Thus, there is potential for localised and temporary
increases in phytoplankton biomass in this area during specific weather conditions.
Potential impacts to periphyton and macrophytes were not considered in the assessment due
to the geothermal characteristics of the thermal channel and Sulphur Bay (unsuitable habitats).

Metals and pH
A suite of 31 metals was considered, based on those that have potential to cause ecological or
human health risks. Projected concentrations in treated wastewater were estimated based on
Discharge to the Thermal Channel and Sulphur Bay: Environmental Effects Study Page vi

three flow-weighted samples of the existing treated wastewater that were collected in
November 2016. Projected concentrations in treated wastewater are higher than baseline
concentrations of nine metals in the Te Arikiroa Thermal Channel and 20 metals in the lake,
measured at Site 4 in Sulphur Bay, outside of the assumed mixing zone. In the Te Arikiroa
Thermal Channel, projected metal concentrations in treated wastewater are higher than
baseline concentrations of antimony, bismuth, cadmium, molybdenum, nickel, selenium,
sodium, tin and silver. The modelled concentrations of cadmium, nickel, selenium and silver in
the thermal channel are less than the 99% ANZECC and ARMCANZ (2000) trigger values. No
trigger values are defined for the remaining five metals.
In Sulphur Bay, projected metal concentrations in treated wastewater are higher than baseline
concentrations of antimony, bismuth, cadmium, calcium, chromium, cobalt, copper, lead,
magnesium, molybdenum, nickel, potassium, selenium, sodium, strontium, tin, uranium,
vanadium, zinc and silver. The modelled concentrations of cadmium, lead, copper, nickel,
selenium and sulphur in Sulphur Bay are less than the 99% ANZECC and ARMCANZ (2000)
trigger values. The modelled concentrations of chromium and zinc in the thermal channel are
less than the 95% ANZECC and ARMCANZ (2000) trigger values but greater than the 99% values.
No trigger values are defined for the remaining 12 metals.
In Sulphur Bay, the only metal for which the modelled concentration exceeds a defined 90%
trigger value is aluminium. This reflects background conditions and not the proposed discharge.
The projected mean pH of the treated wastewater (6.94) is higher than the baseline pH of Te
Arikiroa Thermal Channel (~5.60) and Sulphur Bay (4.16 at Site 4). Therefore the proposed
discharge will increase the pH in the thermal channel and cause a localised increase in pH in
Sulphur Bay; modelled pH was 6.89 in the thermal channel and 4.24 in Sulphur Bay.

Nutrients (assessment of potential for toxicity)
Projected ammoniacal nitrogen concentrations in the treated wastewater (2.0 mg N L-1) are
lower than measured concentrations in the Te Arikiroa Thermal Channel (5.6 mg N L-1) but
higher than measured concentrations in Sulphur Bay at Site 4 (0.04 mg N L-1). The modelling
therefore predicts that the discharge will cause ammoniacal nitrogen concentrations to
decrease in the Te Arikiroa Thermal Channel (1.16 mg N L-1) but increase slightly at the edge of
the mixing zone in Sulphur Bay (0.07 mg N L-1).
Comparisons were made with Attribute States defined in the National Policy Statement for
Freshwater Management (2014) for protection of ecosystem health in lakes and rivers (in
relation to toxicity), which assigns an ‘attribute state’ of A to D based on concentration.
Comparisons were made using criteria based on median concentrations, although we recognise
that criteria based on other metrics (annual maxima or 95th percentiles) have also been
defined. Consideration of median concentrations was deemed most appropriate due to the
limited extent of baseline sampling. Baseline Attribute States (based on estimated median
concentrations) are D in the Te Arikiroa Thermal Channel and B in Sulphur Bay (Lake Rotorua).
Discharge to the Thermal Channel and Sulphur Bay: Environmental Effects Study Page vii

The proposed discharge is predicted to improve the Attribute State to C in Te Arikiroa Thermal
Channel and cause no change to the Attribute State in Lake Rotorua. The modelled
concentration for Lake Rotorua is at the low end of the range for Attribute State B, which
corresponds to conditions associated with occasional impacts on the most sensitive species.
The toxicity of ammonia depends strongly on pH, although no pH adjustments were made for
this assessment, which provides for a conservative approach given the low pH of Sulphur Bay.
The proposed discharge is therefore not predicted to substantively increase ecological risks
associated with ammonia toxicity.
Projected nitrate-nitrogen concentrations in the treated wastewater (2.0 mg N L-1) are higher
than measured concentrations in the Te Arikiroa Thermal Channel (
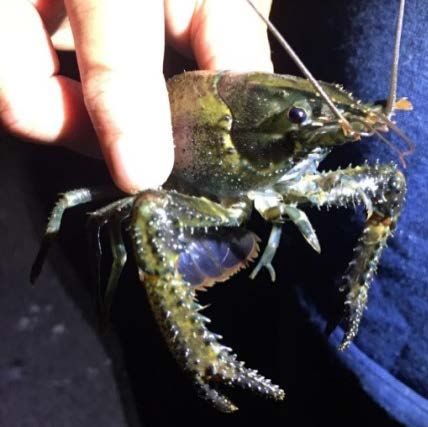
Discharge to the Thermal Channel and Sulphur Bay: Environmental Effects Study Page viii

changes in Sulphur Bay are expected to be ameliorated before treated wastewater mixes with
the wider lake.

Suspended solids, colour, clarity and visual/aesthetic values
Baseline turbidity is high in the Te Arikiroa Thermal Channel (460 NTU, n=1) and Sulphur Bay
(mean of 163.5 NTU at Site 4, n = 29), reflecting the geothermal influence. Turbidity in the
treated wastewater is not precisely known but it will be substantially lower than the baseline
turbidity in the receiving environments, partly due to the use of ultra-filtration, which will
remove the contribution of particulate material to turbidity. Accordingly, the proposed
discharge is predicted to cause a decrease in turbidity in the thermal channel, and a localised
decrease in Sulphur Bay.
Similarly, suspended sediment concentrations are projected to be negligible in the treated
wastewater due to the use of ultra-filtration. The proposed discharge is therefore not predicted
to cause an increase in suspended sediment concentrations in receiving waters unless there is
an initial scouring of the channel with the large volume of wastewater discharge. The removal
of particulate material means that no issues are expected related to increased deposition of
sediments.
The colour of the receiving waters or the treated waters is not precisely known. Generally, the
treated wastewater is expected to have considerably higher clarity than the receiving waters
that are geothermally influenced and of high turbidity. The discharge has potential to cause a
localized reduction in the milky hue of Sulphur Bay, most likely during winter when the treated
wastewater is likely to be warmer than the off-shore areas of the bay and thus positively
buoyant, i.e., it will float and therefore have higher potential to affect visual appearance at the
surface. However, there is uncertainty about this prediction due to the relatively low flow rate
of the proposed discharge and localised mixing, i.e., a visible change might not be apparent.

Emerging organic contaminants
The proposed wastewater discharge has potential to increase concentrations of emerging
organic contaminants in receiving waters. These analytes were sampled during baseline data
collection undertaken for this study, at sites inside and outside of the assumed mixing zone
(site 4 and 5). Analysis of these data and associated assessment outcomes are provided in a
separate study conducted by Northcott Research Consultants Ltd (Northcott 2017).

Taonga species (including macroinvertebrates and fish)
Taonga species (fish, kōura and kākahi) are currently expected to be absent from the Te
Arikiroa Thermal Channel. The large geothermal-influence most likely eliminates the potential
for taonga species to colonise the channel. Accordingly, there is considered to be no effect of
the proposed wastewater discharge on these taxa in the Te Arikiroa Thermal Channel or
perhaps a higher likelihood of their colonisation of the Thermal Channel.
Discharge to the Thermal Channel and Sulphur Bay: Environmental Effects Study Page ix

Previous biological monitoring of Sulphur Bay suggests that, apart from wildfowl (not
considered in this assessment), chironomids (family: Chironomidae) are the only aquatic
organisms present. Based on evaluation of the water quality modelling results, taonga species
are not expected to colonize Sulphur Bay following implementation of the proposed discharge.
Accordingly, there is also assessed to be no effect of the proposed wastewater discharge on
taonga species in Lake Rotorua.
Discharge to the Thermal Channel and Sulphur Bay: Environmental Effects Study Page x

TABLE OF CONTENTS
EXECUTIVE SUMMARY ...........................................................................................................II
GLOSSARY ..................................................................................................................... XVI
INTRODUCTION ................................................................................................................... 17
BACKGROUND ..................................................................................................................... 17
 1.1. GENERAL ENVIRONMENTAL EFFECTS OF DISCHARGING TREATED WASTEWATER .......................17
 1.2. LAKE ROTORUA............................................................................................................18
 1.2.1. Setting .....................................................................................................................18
 1.2.2. Hydrology and land use ..........................................................................................19
 1.2.3. Water quality ..........................................................................................................20
 1.3. WASTEWATER DISCHARGE IN THE LAKE CATCHMENT ............................................................22
 1.3.1. History of wastewater discharge in the lake catchment ........................................22
 1.3.2. Proposed option for wastewater discharge in the lake catchment ........................23
MATERIALS AND METHODS.................................................................................................. 25
 1.4. OVERVIEW ..................................................................................................................25
 1.5. CHARACTERISTICS OF TREATED WASTEWATER....................................................................25
 1.6. CHARACTERISTICS OF RECEIVING WATER ..........................................................................26
 1.6.1. Receiving Water: Te Arikiroa Thermal Channel (January 2017) ............................26
 1.6.2. Receiving Water: Sulphur Bay Water Quality (2011-2016) ...................................26
 1.7. MASS BALANCE DILUTION MODELLING ..............................................................................27
 1.7.1. Overview .................................................................................................................27
 1.7.2. Modelling ................................................................................................................29
 1.7.2.1. Te Arikiroa Thermal Channel ....................................................................................................................... 29
 1.7.2.2. Lake Rotorua (Sulphur Bay) ......................................................................................................................... 29
 1.7.3. Assessment guidelines ............................................................................................32
 1.7.3.1. NPS-FM (2014) Attribute States .................................................................................................................. 32
 1.7.3.2. ANZECC and ARMCANZ (2000) guidelines ................................................................................................... 40
 1.8. LAKE ECOSYSTEM MODELLING OF EUTROPHICATION EFFECTS .................................................42
 1.9. EFFECT OF TREATED WASTEWATER ON TAONGA SPECIES .......................................................42
RESULTS AND DISCUSSION ................................................................................................... 43
 1.10. CHARACTERISTICS OF TREATED WASTEWATER....................................................................43
 1.10.1. Microbiological Characteristics ...............................................................................43
 1.10.2. Metals .....................................................................................................................44
 1.10.3. Nutrients .................................................................................................................44
 1.10.4. pH ............................................................................................................................44
 1.10.5. Water Temperature ................................................................................................45
Discharge to the Thermal Channel and Sulphur Bay: Environmental Effects Study Page xi

 1.10.6. Suspended solids, colour and clarity .......................................................................46
 1.10.7. Dissolved oxygen .....................................................................................................46
 1.11. RECEIVING WATER QUALITY ...........................................................................................46
 1.11.1. Te Arikiroa Thermal Channel ..................................................................................46
 1.11.1.1. E. coli ........................................................................................................................................................... 46
 1.11.1.2. Nutrients ..................................................................................................................................................... 47
 1.11.1.3. Metals and pH ............................................................................................................................................. 47
 1.11.1.4. Water temperature ..................................................................................................................................... 48
 1.11.1.5. Suspended sediments, colour and clarity .................................................................................................... 48
 1.11.1.6. Dissolved oxygen ......................................................................................................................................... 48
 1.11.2. Sulphur Bay Water Quality .....................................................................................48
 1.11.2.1. Overview ..................................................................................................................................................... 48
 1.11.2.1. E.coli ............................................................................................................................................................ 51
 1.11.2.1. Nutrients and turbidity ................................................................................................................................ 53
 1.11.2.2. Metals and pH ............................................................................................................................................. 55
 1.11.2.3. Water temperature ..................................................................................................................................... 58
 1.11.2.4. Suspended sediments, colour and clarity .................................................................................................... 58
 1.11.2.5. Dissolved oxygen ......................................................................................................................................... 58
 1.12. MASS BALANCE DILUTION MODELLING ..............................................................................58
 1.12.1. Microbiological characteristics ...............................................................................58
 1.12.2. Nutrients .................................................................................................................59
 1.12.2.1. Ammoniacal nitrogen .................................................................................................................................. 59
 1.12.2.2. Nitrate-nitrogen .......................................................................................................................................... 60
 1.12.2.3. Total nitrogen and total phosphorus ........................................................................................................... 61
 1.12.3. Metals and pH .........................................................................................................61
 1.12.4. Water temperature .................................................................................................63
 1.12.5. Suspended sediments, colour and clarity................................................................63
 1.12.6. Dissolved oxygen .....................................................................................................64
 1.13. LAKE ECOSYSTEM MODELLING OF EUTROPHICATION EFFECTS .................................................65
 1.14. EFFECT OF TREATED WASTEWATER DISCHARGE ON TAONGA SPECIES .......................................66
 1.14.1. Outcomes of background review and field investigations ......................................66
 1.14.1.1. Te Arikiroa Thermal Channel ....................................................................................................................... 66
 1.14.1.2. Sulphur Bay ................................................................................................................................................. 67
 1.14.2. Assessment outcomes .............................................................................................69
 1.14.2.1. Effect on Te Arikiroa Thermal Channel taonga species ............................................................................... 69
 1.14.2.2. Effect on Sulphur Bay taonga species .......................................................................................................... 69
 1.15. LIMITATIONS AND UNCERTAINTIES ...................................................................................70
ACKNOWLEDGEMENTS ........................................................................................................ 70
REFERENCES ....................................................................................................................... 71
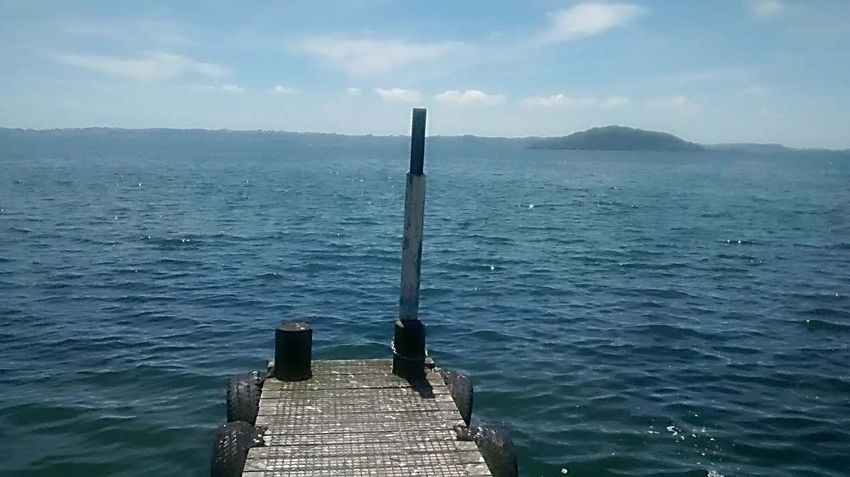
Discharge to the Thermal Channel and Sulphur Bay: Environmental Effects Study Page xii

LIST OF FIGURES
Figure 1 Map of Lake Rotorua (created using GPS Visualizer). The Te Arikiroa Thermal Channel
 enters the lake at the southern end of Sulphur Bay. ................................................................19
Figure 2 Land use within the Lake Rotorua Catchment. Size of the pie charts is scaled to the area
 of the catchment (Source: Tempero et al. 2015) ......................................................................20
Figure 3. Estimated mean external nitrogen loads to Lake Rotorua. Estimates are based on the
 period 2007–2014. Vertical lines show the minimum and maximum annual loads.
 Estimates are presented for the range of wastewater treatment options that were
 considered during an earlier assessment stage. The TN load for the current preferred
 option corresponds to Option 2b (mean TN concentration = 4.62 mg L-1). Reproduced
 from Abell et al. (2015).................................................................................................................21
Figure 4. Estimated mean external phosphorus loads to Lake Rotorua. Estimates are based on the
 period 2007–2014. Vertical lines show the minimum and maximum annual loads.
 Estimates are presented for the range of wastewater treatment options that were
 considered during an earlier assessment stage. The TP load for the current preferred
 option corresponds to Option 6a (up to 3.0 t P y-1). Reproduced from Abell et al. (2015).
 ..........................................................................................................................................................22
Figure 5 Schematic representation of Rotorua’s Proposed Upgraded WWTP treatment process.
 The figure indicates the level of treatment that is expected, although the specifications
 may differ. ......................................................................................................................................24
Figure 6 Locations sampled along a transect from the estimated mixing zone (sites 5 and 6) to sites
 that represent increased influence from the wider lake (sites 1–4). A control sample was
 collected at Site 7. Red line (right-hand figure) denotes the treated discharge water. Right-
 hand figure: Google Earth. ..........................................................................................................28
Figure 7. Projected range in treated wastewater concentrations at sites in Sulphur Bay at the edge
 (Site 5) and just outside (Site 4) of the assumed mixing zone (Figure 6). Projections are
 based on 3-D modelling of two representative 1-month periods in summer and winter
 (Abell et al. 2015). Each value represents the modelled concentration at 09:00 on each day
 of the modelling periods. Points have been jittered on the x-axis to minimise over-
 plotting. ...........................................................................................................................................31
Figure 8 Concentrations of faecal coliforms (FC), E. coli and enterococci (b) faecal coliforms
 measured in composite samples of treated wastewater collected in November 2016. .......43
Figure 9 pH of treated discharge water (July 2015-June 2016). Values measured after March 2016
 reflect sample preservation, not ambient conditions. ..............................................................45
Figure 10 Projected annual variability in treated wastewater temperature. Based on values assigned
 in modelling conducted by Abell et al. (2015). .........................................................................45
Discharge to the Thermal Channel and Sulphur Bay: Environmental Effects Study Page xiii

Figure 11 Graphs to show how the solubility of specific metals is controlled by pH (Ayres et al.
 1994). ...............................................................................................................................................49
Figure 12 Box plots of water quality data collected along a transect in Sulphur Bay as part of an
 Alum Dosing Monitoring Survey (2011-2014). Sites are shown on Figure 6; sites lie along
 a projected concentration gradient of treated wastewater, with sites 6 and 5 closest to the
 proposed point of discharge, within the assumed mixing zone. ............................................50
Figure 13 Monthly measurements of E.coli concentration (logarithmic scale) in samples collected
 from Sulphur Bay area, as well as from recreational sites proximal to the proposed
 discharge site. Dashed lines denote values (defined as annual 95th percentiles) that
 correspond to Attribute States defined in the National Policy Statement for Freshwater
 Management 2014. Precise 95th percentile values are not defined for Attribute States D
 and E (the criterion is ‘>1200’ for both states). .......................................................................52
Figure 14 Water quality, Sulphur Bay area, Lake Rotorua (2011-2014). .................................................52
Figure 15 Correlation between Puarenga Stream mean daily flow and water quality, Sulphur Bay,
 Lake Rotorua (2011-2014). Correlations of each analyte with Puarenga flow were mostly
 weak (R2
Discharge to the Thermal Channel and Sulphur Bay: Environmental Effects Study Page xiv

LIST OF TABLES
Table 1. Summary of modelled concentrations (% of wastewater) shown in Figure 7......................31
Table 2 Lake and river E. coli concentrations corresponding to Human Health for Recreation
 Attribute States designated in the NPS-FM (2014). .................................................................33
Table 3 Ammoniacal-nitrogen concentrations (mg N L-1) corresponding to Ecosystem Health
 Attribute States designated in the NPS-FM (2014), with considerations given to a range of
 pH and temperature following wastewater discharge. .............................................................34
Table 4 Nitrate-nitrogen concentrations (mg N L-1) corresponding to River Ecosystem Health
 Attribute States designated in the NPS-FM (2014). .................................................................35
Table 5 Total nitrogen concentrations (mg L-1) corresponding to Lake Ecosystem Health
 Attribute States designated in the NPS-FM (2014). .................................................................36
Table 6 Total phosphorus concentrations (mg L-1) corresponding to Lake Ecosystem Health
 Attribute States designated in the NPS-FM (2014). .................................................................37
Table 7 Phytoplankton concentrations expressed as chlorophyll a (µg L-1) corresponding to Lake
 Ecosystem Health Attribute States designated in the NPS-FM (2014). ...............................38
Table 8 Dissolved oxygen concentrations (mg L-1) corresponding to River Ecosystem Health
 Attribute States designated in the NPS-FM (2014) in relation to dissolved oxygen. ..........39
Table 9 Classification of naturally occurring metals according to their toxicity and availability in
 the hydrologic environment (Garbarin et al 1995) ...................................................................41
Table 10 General framework for applying levels of protection for toxicants to different ecosystem
 conditions. ......................................................................................................................................41
Table 11 Nutrient concentrations measured in Te Arikiroa Thermal Channel, compared with mean
 concentrations measured in Sulphur Bay and projected concentrations in treated
 wastewater. .....................................................................................................................................48
Table 12 Historical E.coli concentrations, Sulphur Bay area, Lake Rotorua, 2003-2015. Figure 13
 provides context for these data by drawing comparisons with other sites and Attribute
 States. ..............................................................................................................................................51
Table 13 Baseline and projected E.coli concentrations. Comparisons are made to Attribute States
 defined in the National Policy Statement for Freshwater Management (2014) for
 protection of human health for recreation in lakes and rivers. ..............................................59
Table 14 Baseline and projected ammoniacal nitrogen concentrations. Comparisons are made to
 Attribute States defined in the National Policy Statement for Freshwater Management
 2017 for protection of ecosystem health in lakes and rivers (based on toxicity). ................60
Discharge to the Thermal Channel and Sulphur Bay: Environmental Effects Study Page xv

Table 15 Baseline and projected nitrate-nitrogen concentrations. Comparisons are made to
 Attribute States defined in the National Policy Statement for Freshwater Management
 2017 for protection of ecosystem health in rivers (based on toxicity). .................................61
Table 16 Baseline and modelled metal concentration, with comparisons to ANZECC and
 ARMCANZ (2000) guidelines. ...................................................................................................62
Table 17 Baseline and modelled pH ...........................................................................................................63
Table 18 Baseline and modelled dissolved oxygen concentrations for a worst case scenario. ..........65
Discharge to the Thermal Channel and Sulphur Bay: Environmental Effects Study Page xvi

GLOSSARY
Bardenpho A biological nutrient removal system that comprises a series of tanks with
 alternating anoxic/aerobic conditions to remove both N and P. Added to the
 Rotorua WWTP in 1991.
BoPRC Bay of Plenty Regional Council
Chl a Chlorophyll a. A plant pigment that is used as an indicator of phytoplankton
 biomass.
DRP Dissolved reactive phosphorus
E.coli Escherichia coli. A bacterium that is commonly used as an indicator of faecal
 contamination in water.
LTS Land Treatment System. Treated wastewater is currently spray–irrigated at the
 LTS, located to the south of Lake Rotorua.
MBR Membrane bioreactor. A nutrient removal system that combines biological
 treatment and membrane separation. Added to the Rotorua WWTP in 2012.
N Nitrogen.
NH4 Ammonium. Part of the inorganic nitrogen which is required by plants
P Phosphorus.
Phytoplankton Microscopic aquatic plants that are suspended in the water column
Q Stream discharge
RDC Rotorua District Council
TLI Trophic Level Index. The metric is termed TLI3 when it is calculated without Secchi
 depth data as values are based on three (rather than four) water quality
 variables.
TN Total nitrogen
TP Total phosphorus
UV Ultra–violet
WWTP Waste water treatment plant
Discharge to the Thermal Channel and Sulphur Bay: Environmental Effects Study Page 17

INTRODUCTION
Currently, wastewater from the city of Rotorua is collected and treated at the Rotorua
Wastewater Treatment Plant (WWTP). The resulting wastewater is pumped to the Land
Treatment System (LTS) in the Whakarewarewa Forest for subsequent irrigation onto
approximately 300 ha of plantation forest. Whakarewarewa Forest is irrigated with treated
wastewater as permitted by the resource consent for the discharge of treated municipal
wastewater to land. This disposal method will be discontinued in around 2020. A court-
mediated agreement was reached between the Rotorua Lakes Council, Bay of Plenty Regional
Council and landowners in the LTS area to find an alternative to the current discharge system
before the end of the current resource consent in 2021.
After assessment of a large number of possible discharge options, a preferred option was
identified by Rotorua Lakes Council for further detailed assessment. This option involves
treating wastewater to a high level and then discharging it to Lake Rotorua at Sulphur Bay, via
Te Arikiroa Thermal Channel. To support further detailed assessment of this preferred option,
Rotorua Lakes Council engaged the Environmental Research Institute, University of Waikato to
lead water sampling and undertake additional analysis that builds on previous studies.
Specifically, objectives were to:
 • Conduct water quality sampling along a transect perpendicular to the mouth of the Te
 Arikiroa Thermal Channel;
 • Analyse available water quality data and provide assessment outcomes in the context of
 attribute states defined in the National Policy Statement for Freshwater Management
 2014 (amended 2017; NPS-FM (2014));
 • Consider the potential for the proposed discharge to impact taonga species (species of
 cultural significance), including macroinvertebrates and freshwater fish.
This report addresses the objectives listed above, and is complimentary to a separate Microbial
Risk Assessment conducted by MWH /NIWA, and a study of emerging organic contaminants
undertaken by Northcott Research Consultants Ltd (Northcott 2017).

BACKGROUND

 1.1. GENERAL ENVIRONMENTAL EFFECTS OF DISCHARGING TREATED WASTEWATER

While it is generally accepted that conventional wastewater treatment reduces the
concentrations of contaminants and pathogens, the extent to which this occurs varies widely
depending on the treatment process. For example, although treatment at WWTPs largely
reduces biochemical oxygen demand and pathogen load, the treatment does not generally
ensure that the characteristics of the wastewater match the water quality of the receiving
waters (USEPA 2011). Previous studies of the effects of WWTP wastewaters elsewhere have
reported the following:
Discharge to the Thermal Channel and Sulphur Bay: Environmental Effects Study Page 18

 1. increased nutrient loading and eutrophication (Gücker et al. 2006, Waiser et al. 2011);
 2. increased antibiotic resistance in bacteria (Amos et al. 2014, Bouki et al. 2013);
 3. persistence of non-indigenous microorganisms in the receiving water (Dury et al 2013);
 4. emerging organic contaminant loading (Stewart et al. 2014);
 5. heavy metal loading (Stewart et al. 2014, WSL 2011, Wilkison et al 2002),and;
 6. changes in flora and fauna distribution, abundance and community structure (WSL
 2011).
The impact of the proposed option on eutrophication (bullet point 1) in Lake Rotorua was
assessed by Abell et al. (2015), although local effects of the proposed discharge on nutrient
concentrations in Sulphur Bay and the Te Arikiroa Thermal Channel are considered in this
report. Microbial effects (bullet points 2 and 3) will be considered in detail in a Microbial Risk
Assessment conducted by MWH /NIWA, although potential effects of the proposed option on
faecal indicator bacteria concentrations are considered in this report. Emerging organic
contaminants will be considered separately by Northcott Research Consultants Ltd. (bullet point
4). Bullet points 5 and 6 are considered in this report.

 1.2. LAKE ROTORUA

 1.2.1. Setting

Lake Rotorua is a large (80.8 km2), relatively shallow (mean depth 10.8 m) lake of volcanic origin
(Figure 1). It has a terrestrial catchment area of approximately 425 km2 with complex
hydrogeology including large unconfined aquifers that retain groundwater for long and variable
periods (Hamilton et al. 2015). Lake Rotorua is geologically separate from nearby lakes and was
formed in a caldera (crater caused by a volcanic eruption) about 200,000 years ago
(teara.govt.nz). Lake Rotorua is nationally iconic and a major asset to the city of Rotorua. It is a
lake of great cultural significance to Māori and the lake lies within the tribal area of Te Arawa.
Lake Rotorua also provides important recreational and tourism opportunities such as such as
boating, kayaking, swimming, as well as a trout fishery.
Lake Rotorua flows into Lake Rotoiti via the Ōhau Channel at the northeastern corner of the
lake. The Ōhau Channel Diversion Wall, constructed in 2008, prevents water from Lake Rotorua
mixing with Lake Rotoiti and instead diverts flow to the Kaituna River, which flows into the
Pacific Ocean near Maketu. Owing to the geothermal activity, areas around the lake have a high
sulphur content. This gives Lake Rotorua a yellowish-green hue in Sulphur Bay, which is an
example of Rotorua's famous geothermal environment, with characteristic silica flats, rocky
terraces, and sulphur ledges that lie alongside active boiling mud pools and steam vents.
Mokoia Island, close to the centre of the lake, is a rhyolite dome.
Discharge to the Thermal Channel and Sulphur Bay: Environmental Effects Study Page 19

 1.2.2. Hydrology and land use

Lake Rotorua has nine major sub-catchments that contribute approximately 66% of the inflow
to the lake (Hoare 1980). Rainfall to the lake surface contributes approximately 22% of the
inflow, while minor streams and ungauged sources contribute approximately 12% (Hoare 1980).
The WWTP is situated in the Puarenga Stream sub-catchment, which is the second-largest
stream inflow based on volume and has a mean discharge of 1.95 m3 s-1 (2007–2014 data; Abell
et al. 2015). The projected mean flow rate of the treated wastewater discharge is 0.276 m3 s-1
(Mott MacDonald 2017).
The predominant land use in the wider Lake Rotorua catchment is pasture, although this varies
among sub-catchments (Figure 2). Pasture (dairy and dry stock) comprised approximately 13%
of the catchment in 1940 but now comprises approximately 50% (Rutherford et al. 2011), with
intensification greatest in the past 3-4 decades (Hamilton et al. 2015). Land use in the Puarenga
Stream sub-catchment predominantly consists of plantation forestry, dairy support pastoral
activities, and native forest and scrub plantations (Figure 2).

 Sulphur Bay

 4 km
Figure 1 Map of Lake Rotorua (created using GPS Visualizer). The Te Arikiroa Thermal
 Channel enters the lake at the southern end of Sulphur Bay.
Discharge to the Thermal Channel and Sulphur Bay: Environmental Effects Study Page 20

 Scale

 50km2

Figure 2 Land use within the Lake Rotorua Catchment. Size of the pie charts is scaled
 to the area of the catchment (Source: Tempero et al. 2015)

 1.2.3. Water quality

Lake Rotorua is eutrophic (highly productive). This is caused by excessive inputs of nitrogen and
phosphorus, which have impaired water quality relative to pre-1960s conditions. Since 2010,
the water quality of Lake Rotorua has improved relative to the previous two decades, reflecting
a range of environmental management actions (Smith et al. 2016).
Lake water quality is monitored using the Trophic Level Index (TLI), which is a metric of trophic
status that integrates mean annual measurements of Secchi depth, and concentrations of total
nitrogen (TN), total phosphorus (TP) and chlorophyll a (Burns et al. 1999). The 2014/15 TLI value
for the lake is 4.4 TLI units, which is slightly higher than the target of 4.2 but lower than the
majority of the values that were measured during the 1990s and 2000s (Scholes & Hamill 2016).
The land use in the lake catchment affects the quality of water that enters the lake. In
particular, intensive pastoral agriculture is a significant source of nitrogen and phosphorus to
the lake, although there has been a lag between intensification and increased loads to the lake,
particularly for nitrogen (Rutherford 1984, Morgenstern et al. 2015). The expansion of
agricultural development and co-incident urbanisation in the Lake Rotorua catchment have
largely been implicated in the decline of Lake Rotorua water quality particularly between the
1960s and mid- 2000s (e.g., Fish 1969; Rutherford et al. 1996; Burger et al. 2007a, 2008).
Figure 3 and Figure 4 show mean external nitrogen and phosphorus loads to Lake Rotorua. For
context, the estimated loads associated with the proposed treated wastewater discharge are
also presented on these figures; these are discussed further in Section 1.3.2. Internal loads from
Discharge to the Thermal Channel and Sulphur Bay: Environmental Effects Study Page 21

the lake bed have also been shown to be historically significant, particularly for phosphorus
(Burger et al. 2008). There is evidence that these loads have declined in the last decade (e.g.,
Figure 1 in Abell et al. 2016), which likely largely reflects alum dosing operations (Smith et al.
2016) and, potentially, some decline of legacy nutrient loads in the lake bed sediments.

 200 145

 180

 160

 140
 71
 Annual load (t N/y)

 74
 120

 100 60
 59
 63 49
 80

 60
 34 30
 40
 40
 13 10 19
 20

 0
 Waiowhiro
 Awahou

 Hamurana

 Ngongohata

 Waihoewa
 Utuhina
 Puarenga

 Rain
 Waiteti

 Treated wastewater
 Waingaehe

 Minor streams

 Ungauged
 Major streams Other

Figure 3. Estimated mean external nitrogen loads to Lake Rotorua. Estimates are based
 on the period 2007–2014. Vertical lines show the minimum and maximum
 annual loads. Estimates are presented for the range of wastewater treatment
 options that were considered during an earlier assessment stage. The TN load
 for the current preferred option corresponds to Option 2b (mean TN
 concentration = 4.62 mg L-1). Reproduced from Abell et al. (2015).
Discharge to the Thermal Channel and Sulphur Bay: Environmental Effects Study Page 22

 11.5
 16

 14 7.1
 12

 10 7.0 4.0
 Annual load (t P/y)

 8 4.2
 4.0
 6
 2.2
 4 3.0
 1.8 1.4
 2 0.9 1.0
 0.5
 0

 Waihoewa

 Waiowhiro
 Awahou

 Hamurana

 Ngongohata

 Utuhina

 Proposed WWTP discharge
 Puarenga

 Rain
 Waiteti
 Waingaehe

 Minor streams

 Ungauged
 Major streams Other

Figure 4. Estimated mean external phosphorus loads to Lake Rotorua. Estimates are
 based on the period 2007–2014. Vertical lines show the minimum and
 maximum annual loads. Estimates are presented for the range of wastewater
 treatment options that were considered during an earlier assessment stage.
 The TP load for the current preferred option corresponds to Option 6a (up to
 3.0 t P y-1). Reproduced from Abell et al. (2015).

 1.3. WASTEWATER DISCHARGE IN THE LAKE CATCHMENT

 1.3.1. History of wastewater discharge in the lake catchment

Before 1991, secondary-treated wastewater was discharged to Lake Rotorua. This contributed
to the accumulation of nutrients (particularly phosphorus) in the bed sediments, in addition to
inputs from other sources such as farmland, in turn contributing to eutrophication and
associated algal blooms and periods of water quality decline in the 1970s and 1980s (Tomer et
al 1997, 2000, Rutherford 1984; Rutherford et al. 1989). To address this point source, treated
wastewater was re-directed to the LTS in October 1991, an area which covers over 193 ha in the
Whakarewarewa Forest of the Puarenga subcatchment to the south of the lake (Hu et al.,
2007). In the same year, (1991), the treatment plant was upgraded to include an activated-
sludge (Bardenpho) process for nutrient removal (Water Environment Federation 1992, Tomer
et al 2000). Treated wastewater from Rotorua city is then spray-irrigated in the
Whakarewarewa Forest to minimise wastewater-derived nitrogen (N) and phosphorus (P)
Discharge to the Thermal Channel and Sulphur Bay: Environmental Effects Study Page 23

entering Lake Rotorua. Water quality monitoring of the outflow stream (Waipa Stream) from
the LTS, indicates that a major portion of the N and P loads is retained or attenuated
(denitrified), meaning that the implementation of the LTS has considerably reduced N and P
input to the lake from wastewater sources (Tomer et al. 1997, Hu et al 2007).

 1.3.2. Proposed option for wastewater discharge in the lake catchment

The Resource Consent for the Rotorua LTS expires in 2021, warranting the need to consider
alternative wastewater disposal systems. As a result, various stakeholders (Bay of Plenty
Regional Council, Toi Te Ora, Te Arawa Lakes Trust, Rotorua Lakes Community Board, CNI,
Timberlands and representatives from all hapū around the lake) were invited following a
workshop to participate in the Rotorua Project Steering Committee (RPSC). The RPSC had an
objective to identify and evaluate alternative options to the LTS. At least six different options,
involving varying grades of treatment were considered (Abell et al. 2015, Mott Macdonald
2015). A number of potential discharge sites to water were also identified, including discharge
to the Puarenga Stream, the lake bed, or the shoreline of Sulphur Bay. Following consultations
and technical assessments, the RPSC's preliminary preferred option was to upgrade the existing
plant to provide a full Membrane Bioreactor Plant, with the addition of an Ultraviolet
Disinfection System (or alternative treatment to achieve an equivalent performance in terms of
treated wastewater quality). Under this arrangement, wastewater would be subjected to a
rigorous array of biological, chemical and physical treatment processes (Figure 5). The highly
treated wastewater would then be discharged through a land contact treatment area (earth
beds) to an existing constructed drain at Sulphur Bay (Te Arikiroa). Treated wastewater would
then flow into the Te Arikiroa Thermal Channel, which is a natural channel that drains the
geothermal area.
In summary, the proposed upgrade will involve the following features (Mott MacDonald 2017):
 • upgrades to the inlet structure;
 • a large increase in capacity to fully treat 72ML d-1;
 • upfront flow-balancing;
 • a potential option to bypass primary settling tanks to divert carbon into secondary
 treatment to reduce carbon dosing requirement;
 • no changes to the existing extended secondary treatment tank (i.e., the current capacity
 to fully nitrify and denitrify will remain);
 • capacity for phosphorus flocculation (likely with aluminium sulphate [alum])at several
 locations in the secondary treatment tank at a number of points;
 • installing a new tank for ultra-filtration using a 0.02–0.04 µm pore size filter;
 • post-filtration UV treatment, prior to consent compliance testing;
 • capacity for beneficial reuse, and;
 • discharge to earth beds.
Discharge to the Thermal Channel and Sulphur Bay: Environmental Effects Study Page 24

The preferred treatment option is projected to result in treated wastewater with a TN
concentration of ≤4.62 mg L-1 and a TP concentration of approximately 0.35 mg L-1 (see options
2b and 6a in Abell et al. 2015 1). Based on a mean treated wastewater discharge rate of
0.276 m3 s-1, these concentrations correspond to an annual TN load of 40 t N yr-1 (Figure 3) and
an annual TP load from treated wastewater of 3.0 t P yr-1 (Figure 4). These projected loads will
be lower than the loads that are currently applied to the LTS and they are comparable with
loads from a major stream inflow (Figure 3, Figure 4). The projected composition of the treated
wastewater is considered further in Section 1.5.

Figure 5 Schematic representation of Rotorua’s Proposed Upgraded WWTP treatment
 process. The figure indicates the level of treatment that is expected, although
 the specifications may differ.

Technical assessments that informed the selection of the preferred option captured the
available treatment and discharge options. To inform environmental risks, Abell et al. (2015)
completed a water quality assessment of six main options for enhanced wastewater treatment
at seven proposed discharge locations. The assessment included: 1) mass balance calculations;
2) 1-D lake modelling, and; 3) 3-D lake modelling. The assessment considered impacts to lake
trophic status and involved comparing predicted lake water quality with Attribute States based
on the National Policy Statement for Freshwater Management 2014. A key finding of this study
was that effects associated with each treatment option on lake trophic status would be neutral
to minor (negative). This was based on using a 1-D model to simulate mean TLI for an eight-year
period, which showed that predicted changes in mean TLI values were minor (
You can also read