Development of a groundwater quality index: GWQI, for the aquifers of the state of Bahia, Brazil using multivariable analyses - Nature
←
→
Page content transcription
If your browser does not render page correctly, please read the page content below
www.nature.com/scientificreports
OPEN Development of a groundwater
quality index: GWQI,
for the aquifers of the state
of Bahia, Brazil using multivariable
analyses
José Barbosa Filho1 & Iara Brandão de Oliveira 2*
This work elaborated a groundwater quality index—GWQI, for the aquifers of the state of Bahia,
Brazil, using multivariable analyses. Data from 600 wells located in the four hydrogeological domains:
sedimentary, crystalline, karstic, and metasedimentary, were subjected to exploratory statistical
analysis, and 22 out of 26 parameters were subjected to multivariable analysis using Statistica
(Version 7.0). From the PCA, 5 factors were sufficient to participate in the index, due to sufficient
explanation of the cumulative variance. The matrix of factorial loads (for 1–5 factors) indicated 9
parameters related to water quality and 4 hydrological, with factor loads above ± 0.50, to be part
of the hierarchical cluster analysis. The dendrogram allowed to choose the 5 parameters related to
groundwater quality, to participate in the GWQI (hardness, total residue, sulphate, fluoride and iron).
From the multivariable analyses, three parameters from a previous index—NGWQI, were not selected
for the GWQI: chloride (belongs to the hardness hierarchical group); pH (insignificant factor load);
and nitrate (significant factor load only for 6 factors), also, not a regionalized variable. From the set
of communality values (5 factors), the degree of relevance of each parameter was extracted. Based
on these values, were determined the relative weights (wi) for the parameters. Using similar WQI-NSF
formulation, a product of quality grades raised to a power, which is the weight of importance of each
variable, the GWQI values were calculated. Spatialization of 1369 GWQI values, with the respective
colors, on the map of the state of Bahia, revealed good correlation between the groundwater quality
and the index quality classification. According to the literature on water quality indexing, the GWQI
developed here, using emerging technologies, is a mathematical tool developed as specific index, as it
was derived using limits for drinking water. This new index was tailored to represent the quality of the
groundwater of the four hydrogeological domains of the state of Bahia. Although it has a regionalized
application, its development, using, factor analysis, principal component analysis, and hierarchical
cluster analysis, participates of the new trend for WQI development, which uses rational, rather than
subjective assessment. The GWQI is a successful index due to its ability to represent the groundwater
quality of the state of Bahia, using a single mathematical formulation, the same five parameters, and
unique weight for each parameter.
Many reviews about water quality indexing have been published by a variety of authors. For instance1, reviewed
WQIs developed from 1960 to 2010;2 analyzed the performance of 30 existing WQIs;3,4 applied 7 different WQIs
for, respectively, thirteen and sixteen months monitoring data in river waters; and5 reviewed 40 existing WQIs.
The following statements were extracted from their conclusions: (i) although many WQIs are available, there is
still a need of an overall WQI, able to incorporate the available data and describe the water quality for different
uses; (ii) significant discrepancies were observed in classification from different methodologies; (iii) the most
challenging aspect is that WQIs are developed for a specific region, being source-specific; (iv) no single WQI
1
Departamento de Ciências E Tecnologias Dos Materiais, Escola Politécnica, Universidade Federal da Bahia, Rua
Aristides Novis, 2, Federação, Bahia, Salvador 40210‑630, Brasil. 2Departamento de Engenharia Ambiental,
Escola Politécnica, Universidade Federal da Bahia, Rua Aristides Novis, 2, Federação, Bahia, Salvador 40210‑630,
Brasil. *email: oliveira@ufba.br
Scientific Reports | (2021) 11:16520 | https://doi.org/10.1038/s41598-021-95912-9 1
Vol.:(0123456789)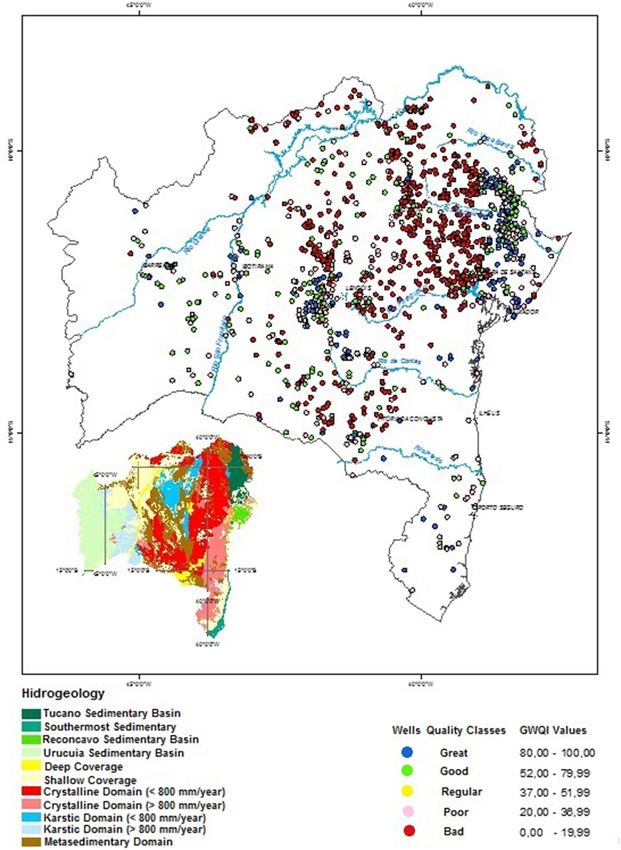
www.nature.com/scientificreports/
has been globally accepted; (v) there is no worldwide accepted method for implementing the steps used for
developing a WQI; (vi) there is a continuing interest to develop accurate WQIs that suit a local or regional area;
(vii) some future directions are still necessary due to the limitations of worldwide developed WQIs. The conclu-
sions from these authors indicate the desire in finding a globally accepted water quality index, and, a method of
development. However, so far, these objectives were not achieved.
The authors6 developed a critical review of the published literature on water quality indexing, up to 2020,
working with 2049 articles from a variety of scientific journals. They used a three-stage sequential process of
examination (bibliometric, scientometric, and qualitative valuation) identifying the most influential journals,
researchers, articles, and countries dynamic in the research field of water quality indexing. Their scientometric
analysis indicated that water quality indexing fills four classes: specific indices, human intervention, performance
assessment, and emerging technologies. Moreover, the review o f7 indicated that the WQIs are classified into four
categories depending on the water end-use: (i) no specified end-use (WQI has a holistic view of the water); (ii)
uses for drinking, irrigation, or industrial activities (WQI is highly target-specific); (iii) if the primary focus is
management and planning of water resources (WQI has planning and management features); and, (iv) if statis-
tical and mathematical models help to determine the overall water body health (WQI is a mathematical tool).
WQI, as a mathematical tool, has the goal to transform a variety of water quality parameters into a single value
to describe the quality of a water b ody2,8,9. The development of the majority of the numerical WQIs involves the
transformation of parameters with different units and dimensions, into dimensionless scale, defining subindices,
and choosing different aggregation methods to generate the single value for the index8.
The first reported numerical index, target-specific, was proposed by10, to assess pollution reduction pro-
grams in rivers. Then, in 1970, emerged other important analytical index for surface water quality evaluation,
the WQI-NSF f rom11, which is applied worldwide as originally p roposed12–15, or modified, and renamed before
16–22
application , to cite a few. The WQI-NSF was proposed with the support of US National Sanitation Founda-
tion, to express the surface water quality, using nine parameters associated to domestic wastewater pollution.
The calculation involves transforming chemical concentrations values, in dimensionless quality grades, using
normalized curves. The multiplicative formula to produce a single WQI-NSF value, operates the dimensionless
subindex raised to a power, or the weight of importance of each variable. More recently, in 2001, emerged the
WQI-CCME23,24, a statistical index to assess the quality of surface waters, very well-known and applied worldwide
as it was p roposed3,4,13,14,25–35; also applied after receiving some adaptation for local conditions36,37. The index23
was proposed with the support of the Canadian Council Minister of Environment, with the following charac-
teristics: it is independent of dimensionless sub-indices; can incorporate from four to all measured parameters;
all parameters had the same degree of importance, and had to be measured during four monitoring campaigns.
Later24, changed one condition, which was: to incorporate, from a minimum of eight, to a maximum of twenty
measured parameters.
The authors38 considered that, for the proper use of the WQI- CCME, it is necessary to define the time period
for water quality evaluation, the choice of variables to use, and the objectives for the index calculation, as the
factors (F1, F2) that compose the index, can vary when few variables are used or when the variables are closely
related. The authors3,4, investigating seven frequently used indexes, found that the WQI-CCME was the most
appropriate, for being conservative (indicated a stricter river water quality), and sensitive to changes in water
quality. Moreover, the majority of authors that applied the WQI- CCME, favor it as the most flexible, because it
can incorporate any parameter site specific; has an ease formulation; and can be easily adapted to legal require-
ments of different locations and different water uses.
In the meantime, since the 70’s, a variety of WQIs with planning and management characteristics, were devel-
oped in many countries, such as: for river pollution evaluation39–42; for public water supplier43; for river water
quality status definition44,45 and others, such us, the Florida stream water quality index—SAFE46, the Lower Great
Miami watershed enhancement program—WEP47, and the British Columbia (BC) water quality index48, to cite
a few. All these indices have been evaluated in the literature, and, for all of them, are indicated some limitations
in their ability to unequivocally represent the water quality. For i nstance49, investigated the WQI-(SAFE, WEP,
and BC) considering the indices with too many variables, which, for most watersheds, are rarely found in a con-
tinuous manner. They found the WQI-BC with too many water use objectives: drinking, recreation, irrigation,
livestock watering, wildlife, and aquatic life; each one, with different set of parameters and specific rankings.
Also49, considered the WQIs’ formulas inefficient to evaluate the degree of pollution or the actual water quality in
a stream. Then, they developed an analytical new index, using fewer variables and independent of standardized
variables. However, they considered their new index with a limitation, as it could not be applied downstream of
a wastewater treatment plant or in watercourses with large amounts of untreated human or animal waste. Finally,
they concluded that, their new index gave results very similar to the WQI-NSF and WQI-WEP.
Recent development of WQIs for surface water, occupy the category of emerging-technologies, as they are
based on mathematical approaches such as: multivariate statistics50; fuzzy inference system—FIS51–53; probabil-
istic neural network—PNN53; and artificial neural network—ANN54. About the development of the WQIs using
emerging-technologies, the following conclusions were reached by these authors: (i) using statistical techniques
reduce bias and it is more objective; (ii) multivariate statistics is more economic, as it identifies the significant
parameters, reducing the time effort, and cost requirement, to monitor large number of variables; (iii) applica-
tion of fuzzy techniques could interpret complex conditions in a river system, also, was appropriate to address
uncertainty and subjectivity in environmental problems; (iv) fuzzy-logic-based methods may be useful to develop
a water quality management strategy; (v) jointly application of fuzzy inference systems (FIS), Bayesian networks
(BN), and probabilistic neural network (PNN) to the output of the WQI-NSF and WQI-CCME for river water,
produced an accurate probabilistic water quality assessment; and, (vi) artificial neural network (ANN) using
globally accepted parameters was successful in crating a WQI for surface water. Despite the fact the WQIs
developed with emerging-technologies were all tailored to local or regional applications, the main feature was
Scientific Reports | (2021) 11:16520 | https://doi.org/10.1038/s41598-021-95912-9 2
Vol:.(1234567890)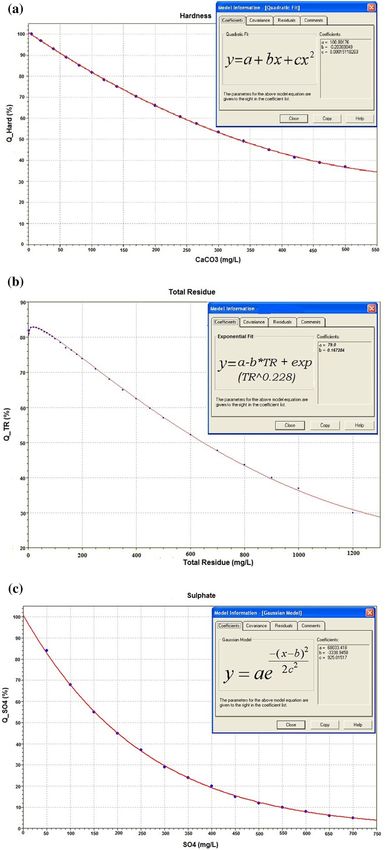
www.nature.com/scientificreports/
the absence of subjective assessments, as they derived from water quality datasets and specific mathematical
correlation between variables. Thus, the emerging-technologies can provide methods with global application to
develop WQIs for surface waters.
Regarding the studies on groundwater quality indexing, the a uthor6 found that the WQIs are mainly in the
class of water-use specific, as the primary regions of focus are those facing scarcity of surface water, thus, depend-
ing on the local aquifers to meet their water demands. These water-use specific WQIs are focused on assessing the
hydrogeology of the study area, mainly for drinking and irrigation purposes55–59. However, the literature reports
initiatives to communicate groundwater quality in the category human-intervention, performance-assessment.
For instance60, developed the index SEQ-Eaux Souterraines with the support of the French Ministry of Waters,
based on two notions: the ability of a water to satisfy a chosen use; and the alteration of water quality due to pres-
sures from human activities. The SEQ-index uses a large number of parameters organized in seventeen groups
of alteration, associated to the uses: drinking water, industrial, energy, irrigation and animal feed. It generates
sub-indices for each group of alteration, and, the final value of the SEQ-index corresponds to the lowest value
attributed to the set of sub-indices.
On the other hand, a variety of groundwater quality indices were derived to help policy makers and stake-
holders, regarding the planning and management of groundwater resources. Many indices were derived from
WQIs originally developed for surface waters. For instance, the WQI-CCME, due to its statistical formulation
and flexibility of parameters selection, was adapted by many authors for groundwater quality e valuation55,56,61–68.
Others, adapted the WQI-NSF, after identifying the most significant parameters for the groundwater quality
evaluation and their degree of i mportance68,69. The work o f70,71 used the mathematical formulation for the WQI-
NSF to derive a groundwater quality index—NGWQI for the state of Bahia, Brazil. The NGWQI development
involved the following steps: (i) subjective assessment for choosing the representative variable of the state of Bahia
groundwater quality (hardness, chloride, fluoride, nitrate, total residue, and pH); (ii) subjective assessment to
define the degree of importance of each chosen variable; (iii) development of normalized curves of concentration
(ci) versus grades ( qi), using the limits from Brazilian drinking water legislation to set the quality range from 0
(worst) to 100 (best); (iv) transformation of the physicochemical values in dimensionless subindices using the
normalized curves; and, (v) calculation of the single value for the NGWQI based on the product of each grade
(qi), raised to its weight (wi), or the degree of importance. The spatialization of the NGWQI in the four hydro-
geological domains of the state of Bahia: sedimentary, crystalline, karstic and metasedimentary, was considered
with good correlation with the groundwater quality, by hydrogeologists from CERB, the governmental drilling
well company.
For groundwater applications, the trend of WQI development in the category of emerging-technologies, has
also grown. In this category, can be cited: multivariate statistics and regression models72; multivariate statistics,
probability curves and G IS69; regression m
odels73; fuzzy methodology and G IS74; artificial neural network—ANN
and multiple linear regression—MLR ; and entropy information t heory76–81. The following conclusions were
75
reached by these authors about the development of these WQIs: (i) jointly application of correlation analysis and
multivariable linear regression helped to identify the sources and factors affecting the groundwater pollution of
an urban aquifer. The regression model derived for the groundwater quality prediction was reliable and stable;
(ii) probability curves defined the critical variables, and PCA determined the principal water quality parameters
and their weights, to compose the WQI; (iii) regression models allowed predictions about past, present, or future
groundwater quality events, in a less expensive manner, either in terms of time and/or money; (iv) hybrid WQI
model, fuzzy-GIS-based, using seven critical parameters, was more reliable and pragmatic for groundwater-
quality assessment and analysis at a larger scale; (v) jointly application of ANN and MLR models predicted
precise values for a WQI, with sensitive performance for two seasons; (vi) information entropy methods avoid
personal judgments about the weight of the parameters to participate in the WQI; (vii) entropy weighted water
quality index (EWQI) has been recognized as the most unbiased model for assessing drinking water quality.
Based on these comments, the WQIs developed for groundwater quality applications, were all tailored for local
or regional situations. However, the most important feature of using the emerging-technologies is the absence of
subjective assessments, as they derive from water quality datasets and specific mathematical correlation between
variables. Similarly to surface waters, the emerging-technologies can provide methods with global application
to develop WQIs for groundwater resources.
The present work develop a groundwater quality index—GWQI for the state of Bahia, Brazil, in the category
of emerging-technologies, using the multivariable techniques: factorial analysis (FA), principal component analy-
sis (PCA), and hierarchical cluster analysis (HCA), for parameter selection and determination of the degree of
importance of each parameter. The method was totally rational, independent of subjective assessment, partici-
pating of the new trend for WQI development.
Study area: state of Bahia, Brazil
Geology and hydrogeology of the state of Bahia. The study area is the whole state of Bahia, a federa-
tive unit in the Northeast Region of Brazil. The state of Bahia is approximately located between the coordinates
38ºE to 46ºW of longitude, and 9ºN to 17ºS of latitude, with an area of 567.295 km2, being the largest northeast-
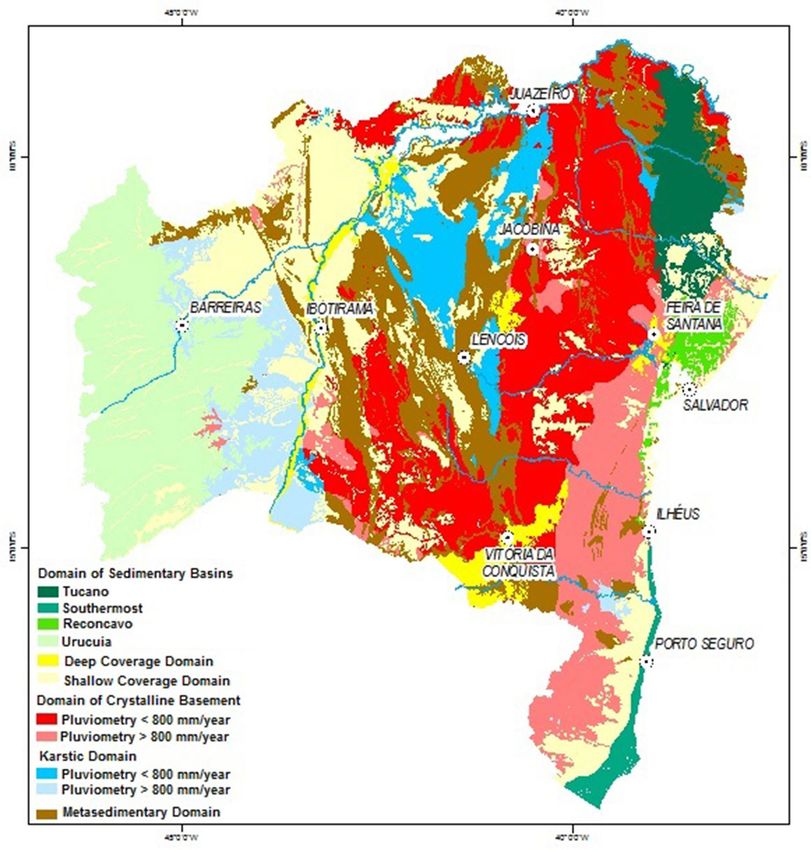
ern state in terms of land area, and fifth in the national r anking82. Figure 1 presents the map of the hydrogeologic
domains of the State of B ahia82, modified f rom83, indicating the presence of eleven domains with the respective
lithologies.
The Fig. 1 shows that the state of Bahia has great geological and hydrogeological diversity. In the coastal
region, east of the state (18 to 65 km wide), occurs from north-to-south the sedimentary basins (Tucano, Recon-
cavo, and Southernmost). Next, emerges from north-to-south the crystalline domain (rainfall < 800 mm/year;
and > 800 mm/year), plus detrital covers (shallow) at the south. In the central area occurs the karstic domain
Scientific Reports | (2021) 11:16520 | https://doi.org/10.1038/s41598-021-95912-9 3
Vol.:(0123456789)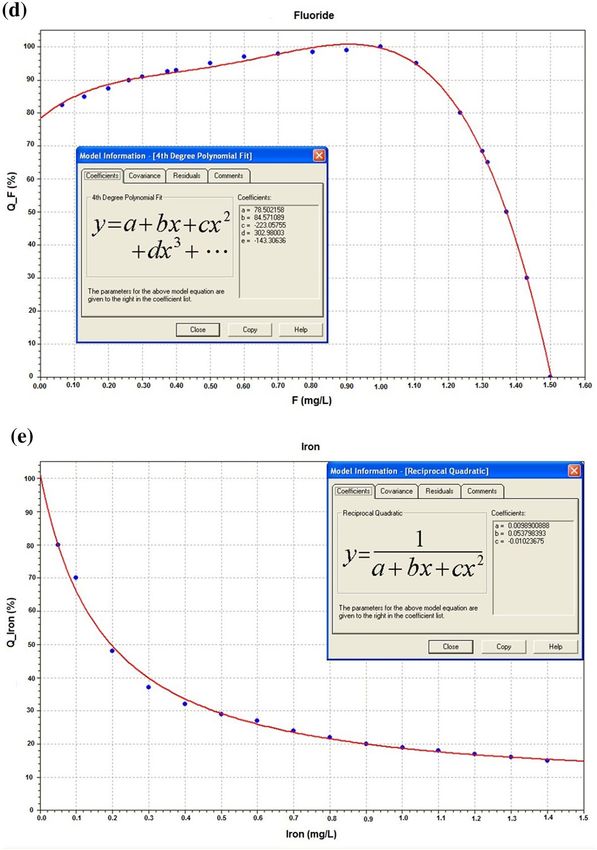
www.nature.com/scientificreports/
Figure 1. Geological and hydrogeological domains of the State of Bahia. Source: 82 modified from83, using
ArcGIS version, 8.384.
(rainfall < 800 mm/year), almost surrounded by the metasedimentary domain, plus detrital covers (deep) at the
south. Next, towards the west, comes the sequence: detrital covers (shallow); karstic domain (rainfall > 800 mm/
year), and the sedimentary basin (Urucuia). Predominantly, the domain of sedimentary rocks are composed by
sandstones; the crystalline domain, by mafic and ultramafic iron producing rocks; the karstic domain, by car-
bonate rocks, limestones and pure quartzites; and the metasedimentary domain, also presents iron producing
mafic and ultramafic rocks.
The state of Bahia hydrogeological characteristics are controlled by the factors: geology, climate, and pre-
cipitation. Consequently, the groundwater resources has a very heterogeneous geographical distribution. The
authors83 delimited areas of similar hydrogeological behavior and groundwater production (Fig. 1). In the state
of Bahia, the climate and precipitation have the following distribution: coastal region (humid; 1400–2600 mm/
year); next stripe parallel to the coast, also at the western region (humid to sub-humid; 1000–1400 mm/year);
following stripe parallel to the coast, also at the center, in addition to the karstic terrains in high topography
(sub-humid to dry; 800–1200 mm/year); terrains of crystalline and karstic domains at the center/north (semi-
arid; ≤ 600 to ≤ 800 mm/year); far north (arid; 300–500 mm/year); far western region, in the stripe of 20- 80 km
wide, (humid to sub-humid; 1300–1600 mm/year).
The Table 1 presents a description of the geological characteristics of the hydrogeological domains of the State
of Bahia, and some aquifer characteristics: groundwater productivity and quality, f rom85 and86.
Scientific Reports | (2021) 11:16520 | https://doi.org/10.1038/s41598-021-95912-9 4
Vol:.(1234567890)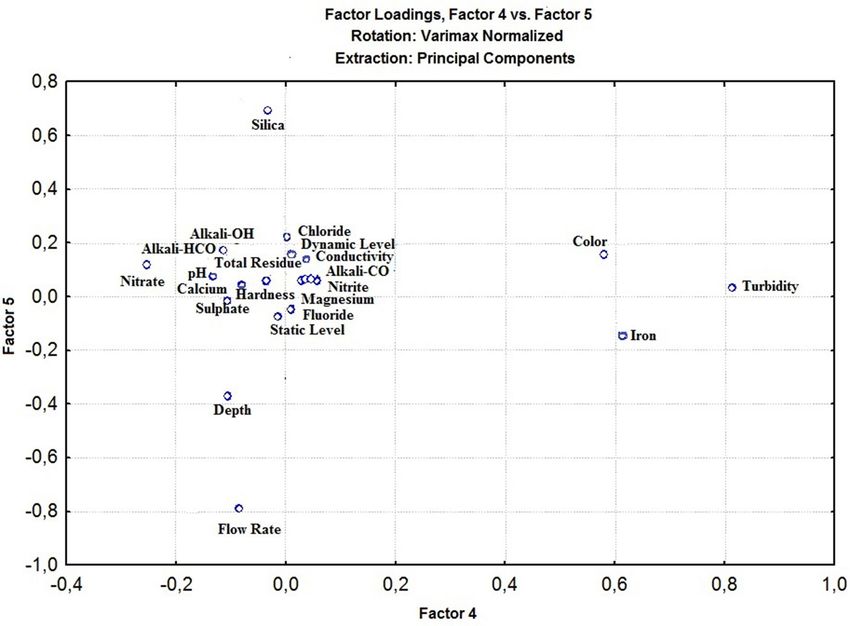
www.nature.com/scientificreports/
Domain Description State area % Lithology and aquifer characteristic
Predominance of sandstone. Sergi formation: small recharge area,
variable flow rates and tendency of salinization in depth
State eastern region: Reconcavo basin
Marizal-São Sebastião formations: large recharge area, wells with
Rainfall rate: 1400 to 2600 mm/year
large capacity: up to 450 m deep; flow rates up to 350 m3/h. Store
water of good quality in the sandstones
Predominance of sandstone but with lithological aspects (layers
6.9 of shale and carbonates) with variable groundwater favorability.
State eastern region: Tucano basin (South, Central, North)
Sedimentary basins Marizal, Sergi, Aliança formations: store water of good quality.
Rainfall rate: 1400 to 2600 mm/year
However, the Marizal presents salinization in depth. Group Ilhas
presents less groundwater favorability
Quaternary coastal deposits and Tertiary-Quaternary Barreiras
State eastern region: Southernmost basin. Rainfall rate:
Formation. Averaged flow rate of 27 m3/h. Store water of good
1000–1400 mm/year
quality in the sandstones
State western region: Urucuia basin Predominance of Sandstone. State largest groundwater reserve;
16.3
Rainfall rate: 1300–1600 mm/year high potentiality; excellent groundwater quality
Dune and alluvial sands and clayey sand sediments. The shallow
Shallow coverage (dune and alluvial sands); cover has reduced depth and store pluvial waters. Aquifer of high
Sedimentary coverage Deep coverage (Barreiras Formation) 15 vulnerability. The deep covers has wells with 150 m deep, flow
Rainfall rate: 800–1200 mm/year rates greater than 50 m3/h. Both sediments stores water with good
quality
Granulites; basalt and gabbro; plutonic bodies Shallow, fissural
or fractured free aquifers, low storage capacity, low permeability,
State central-eastern portion from north to south
heterogeneous and anisotropic. For rainfall > 800 mm/year, average
Rainfall rate: > 800 mm/year
flow rates is 9.9 m3/h, and the groundwater has from regular to
Crystalline Domain 34.3 inferior quality
Granodioritic and granitic rocks, mafic–ultramafic and calcium-
State north central part
silicate rocks For rainfall ≤ 800 mm/year, average flow rates is 9.1
Rainfall rate < 800 mm/year
m3/h, and the groundwater presents generally inferior quality
Carbonate rocks, and glaciogenic sediments. Dolomitic marbles
limestones, and pure quartzites. Free fissural aquifers of high
State western and coastal southern region
heterogeneity and anisotropy. Due to a better rainfall rate, the
Rainfall rate: > 800 mm/year
averaged flow rate is 4.0 m3/h, and the groundwater has from
regular to inferior quality
Karstic Domain 13.2
Glacial diamictites, and carbonate from shallow marine and tidal
plain Limestones and dolomites. Free aquifers of high heterogene-
State central and north-northeast region
ity and anisotropy, with low storage capacity. Due to the low rain-
Rainfall rate: < 800 mm/year
fall rate, the averaged flow rate is 3.4 m3/h, and the groundwater
has generally inferior quality
Quartzites, metarenites, sandstone, claystone; carbonous phyl-
lites, mafic–ultramafic rocks in the north–south direction; and
Mountain range from Jacobina and Chapada Diamantina Greenstone Belts
Meta sedimentary Domain 14.3
Rainfall rate: 800–1200 mm/year Free aquifers of fissural and fractured nature, of high permeability,
high recharge rate. Averaged flow rate of 6.9 m3/h, and the ground-
water has from regular to inferior quality
Table 1. Characteristics of the hydrogeological domains of the State of Bahia.
State of Bahia Grouwndwater Quality. This section presents the groundwater quality of the state
of Bahia, per hydrogeological domain, summarized in Table 1. Also discuss the results published b y85,86,88, to
address the importance of the parameters (hardness, total residue, sulphate, and iron), selected to be part of
the GWQI. The work o f85 presents the average values for (chloride, total hardness, total residue, and nitrate) in
the groundwater of the state of Bahia, whose limits for drinking water87, are, respectively, (250 mg/L; 500 mg/L;
1000 mg/L; and 10 mg/L). The work of86 studied the parameter iron in the groundwater of the state of Bahia,
based on 5583 wells drilled in the period (2003–2013). He found 978 wells (17.5%), with high iron content
(> 0.3 mg/L), the limit for drinking water87. The work o f88 studied the parameter sulphate in the groundwater
of the state of Bahia using the same data base f rom86. She found from 2792 wells, 289 (10.4%) with high sulfate
concentration (> 250 mg/L), the limit for drinking w ater87. The predominant species with high sulfate concentra-
tion were (CaSO4 and M gSO4), smaller quantities for ( NaSO4) and very low for ( KSO4). She found that aquifer
geology, and not rainfall, was the most influential on sulfate concentration and species.
From85, the deep sedimentary coverage presents average values for (chloride, total hardness, total residue,
and nitrate) below the limits (groundwater of good quality); nevertheless, due to its shallowness or not so deep
layers, it presents high vulnerability to contaminants.
In general, the sedimentary basin has predominance of sandstone with water of good quality, however, areas
with small recharge and variable flow rates has tendency of salinization in depth. The Tucano sedimentary basin
presents some lithological aspects (layers of shale and carbonates) that favor the occurrence of groundwater with
variable quality. From85, the sedimentary basins present, in general, average values for (chloride, total hardness,
total residue, and nitrate) below the limits (groundwater of good quality), only the (Sergi/Aliança formations)
presents chloride slightly above the limit.
The fractured crystalline aquifer presents unfavorable water circulation, thus has generally water of inferior
quality. From85, the crystalline domain presents average values above the limits, for three parameters: chloride,
total hardness, and total residue (groundwater with quality regular or poor); while for nitrate, the average values
are below the limit, indicating not significant human impact. F rom86, the mixed sedimentary/crystalline aquifer
Scientific Reports | (2021) 11:16520 | https://doi.org/10.1038/s41598-021-95912-9 5
Vol.:(0123456789)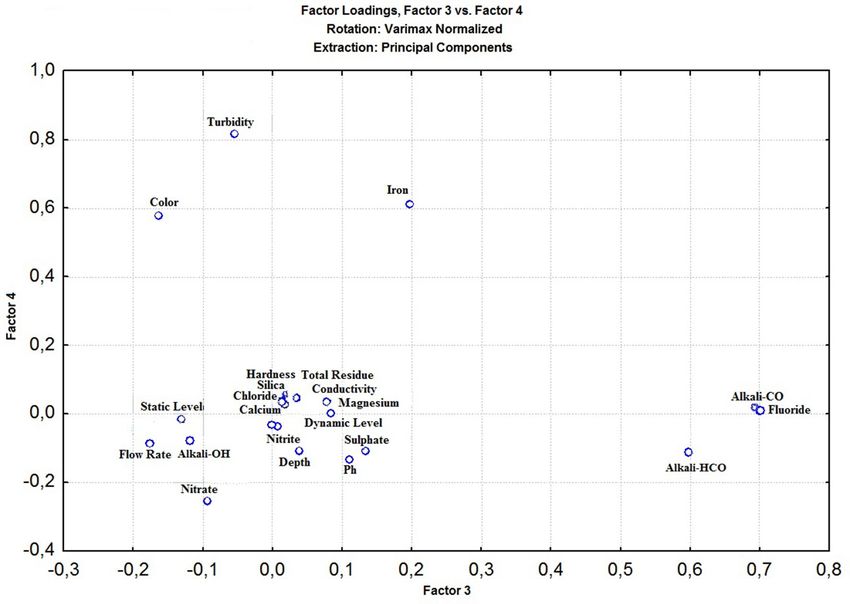
www.nature.com/scientificreports/
For the set of 600 wells For the set of 1369 wells
Ratio of
Hydrogeological Percentages of Number of Percentages of Number of municipalities
domain Number of wells wells % municipalities Number of wells wells % municipalities N600/N1369
Sedimentary 113 18.8 48 327 23.9 70 0.686
Crystalline 261 43.5 128 614 44.8 147 0.871
Karstic 135 22.5 46 212 15.4 58 0.793
Metasedimentary 91 15.2 40 217 15.9 60 0.667
Totals 600 100.0 262 1369 100.0 335 0.782
Table 2. Number of wells and municipalities per hydrogeological domain, and related percentages, for the
set of 600 and 1369 wells. For the total of 1969 wells, the number of wells per hydrogeological domain is:
Sedimentary (440 or 22.4%), Crystalline (875 or 44.4%), Karstic (346 or 17.6%), and Metasedimentary (308 or
15.6%).
had (46.9%) of wells with high iron content, due to the presence of iron producing rocks in the crystalline por-
tion, and larger water circulation in the sedimentary portion.
The karstic domain, due to the presence of carbonates, only presents water of better quality in places were the
rainfall rates are favorable. From85, the karstic domain (> 800 mm/year) presents the average values for (chloride,
total hardness, total residue, and nitrate) below the limits (groundwater of good quality), clearly related with the
larger rainfall; while the karstic domain (< 800 mm/year) presents average values above the limits (groundwater
with quality regular or poor). F rom86, the karstic domain had the smallest percentage of wells with high iron
content (9.88%).
The metasedimentary domain with free aquifers of fissural and fractured nature, associated with a variety
of lithological and geological characteristics, presents groundwater from regular to inferior quality. F rom85, for
the metasedimentary domain, only the parameters, total hardness and nitrate, present average values below the
limits, indicating varying groundwater quality.
For nitrate85, found, only in the karstic domain (< 800 mm/year) an average value (10.7 mg/L) slightly above
the limit established for drinking water (10 mg/L). Nitrate is an anthropic groundwater chemical parameter
derived from fertilizers (the karstic domain has extensive agricultural activities), and from domestic wastewater
(the urban area uses septic tanks and has inadequate sewer system). The presence of nitrate in the aquifer of
karstic terrains is also favored by the presence of caves and dolines.
Geostatistic applied to parameters of groundwater quality of the state of Bahia. For the
parameters, chloride, total hardness, total residue, and nitrate in the hydrogeological domains of the state of
Bahia, the work o f85 developed semivariograms, a geostatistical tool to investigate how much the variable is
regionalized, which characterize a natural p henomenon89,90. In the semivariogram function, the parameter (a)
represents the maximum distance at which the variables correlate with themselves.
A regionalized variable is indicated by a spatial correlation structure, or, a function [Z(x)] for each point (x) in
the space n dimensional ( Rn), presenting two characteristics: randomness, or erratic variations; and structure, or
the global aspect of the regionalized phenomenon. To study spatial and temporal variability of a given property,
the geostatistic may assist in identifying the most probable spatial patterns of a parameter distribution91,92. The
literature presents a variety of geostatistical tools that allow estimating the probability of occurrence of a given
event, in places not investigated, from information obtained e lsewhere93,94. When samples are collected in the
field, it is necessary, before to proceed an interpolation between two measured locations, to build up isoline maps
with the appropriate tool to establish the spatial dependence. The semivariogram indicates the most appropriate
spatial dependency function of the variable under s tudy89. Once the semivariogram is known and the spatial
dependence is confirmed, values can be interpolated at any position in the field of study, and the interpolation
method is called K riging93,94.
From the work o f85, the variables (chloride, total hardness, and total residue) present the parameter (a) with
values (204.3; 236.9; and 170.7 km), respectively, indicating that these are regionalized variable. For nitrate,
the parameter (a = 4.95 km), a relatively small distance, after which the nitrate values no longer correlate, and
this is not a regionalized variable. The spatialization of nitrate values in the groundwater of the state of Bahia
by85, indicated high nitrate concentrations in the most vulnerable areas of the karstic and crystalline aquifers,
due to three main factors: shallow aquifers; karstic and fractured structures; and vectors of pollution (irrigated
agriculture and domestic wastewater effluents).
Material and methods
Selection of wells and grouwndwater samples for statistical analysis. The database from the state
of Bahia well drilling company, CERB –Water Resources and Environmental Engineering C ompany95, provided
a comprehensive amount of data for the hydrogeological domains of the State of Bahia. The physicochemical
analysis were developed at LABDEA, the laboratory of the Environment Engineering Department, Polytechnic
School of the Federal University of Bahia (UFBA).
A total of 600 from 1969 wells, were used to apply the statistical analysis and develop the groundwater qual-
ity index—GWQI. The remaining 1369 wells were used to apply the GWQI and to test the model adequacy to
describe the state of Bahia groundwater quality. The Table 2 presents for both sets (600 and 1369 wells), the
Scientific Reports | (2021) 11:16520 | https://doi.org/10.1038/s41598-021-95912-9 6
Vol:.(1234567890)
www.nature.com/scientificreports/
statistics for the number of wells and municipalities envolved, per hydrogeological domain, considered here, as
criteria to guarantee the sample randomness.
From Table 2, the percentages verified in the set (600 wells) are not exactly the same, as those in the set (1369
wells), however, they are close enough to guarantee the similarity. For instance, 78.2% of the total number of
municipalities in the set with 1369 wells (335), it is present in the set of 600 wells (262), indicating good areal
distribution of the wells. Classifying per hydrogeological domain, it is verified that, from 66.7 to 87.1% of the
number of municipalities in the set (1369 wells), it is present in the set of (600 wells), indicating good hydrogeo-
logical representativeness. Thus, the sample of 600 wells can adequately represent the total.
The data bank with the 600 wells was submitted as Supplementary Material. Also, was submitted the data bank
with 1369 wells, including the necessary information to calculate the GWQI and the previous index NGWQI,
for comparison. These two spreadsheets present summary tables and statistical results discussed in the paper.
Multivariable statistical methods. Multivariable analysis are largely applied to environmental data,
seeking to identify the significant parameters from a large data set of multiple variables22,96–102. To identify the
factors responsible for the groundwater pollution in a shallow urban aquifer of Yan’an City, in China72, used the
methods of principal component analysis (PCA), hierarchical cluster analysis (HCA), and multivariable linear
regressions (MLR) to search the relationships between the groundwater quality parameters and to generate a
regression model. Also, in C hina103, used multivariate analysis to understand the hydrogeochemical processes
occurring in the water of the Guohua phosphorite mine. In I ndia104, used these techniques to elucidate aspects
of the groundwater geochemistry and drinking water suitability in the Kudal region. In Brazil, state of Bahia105,
applied multivariable analysis for groundwater quality evaluation in the central-southern portion of the state,
while106, used to classify the groundwater quality in the Salitre river watershed. And, in the state of Ceará107, used
to explain the processes responsible for the groundwater quality in the city of Fortaleza; w hile108, were searching
the similarity of hydrochemical variables in the Salgado river watershed.
The multivariable methods applied in this work were factorial analysis (FA); the principal component analysis
(PCA) and the hierarchical clustering analysis (HCA). The factorial analysis was used to define the structure of
the variables c orrelations109. The (FA) calculates the correlation matrix between variables, it does the extraction
of initial factors and does the rotation of the m atrix109. The correlation matrix allows to indicate the similarities
and differences in the cluster a nalysis110.
The method of principal component analysis (PCA) helps to extract the factors from the correlation matrix,
necessary to explain the covariance structure through linear combinations of the original v ariables111,112. The
(PCA) reduces the total number of variables to a smaller data set of statistical variables, while preserving the
variability with a minimal loss of information. Each factorial load represents the degree of contribution of the
variable to the formation of the factor. The variables with the highest factorial load are considered of greater
importance and should influence more on the factor label109. The PCA also helps to detect through communali-
ties, how much each parameter explains each f actor113. The normalized Varimax rotation, an orthogonal rotation
of the factors, helps to minimize the number of variables with high loads in different factors.
The hierarchical cluster analysis (HCA) has the goal to produce the variables hierarchical classification,
necessary to detect the most pertinent properties to be included in the index. The (HCA) build the tree diagram
where the most similar properties in the study are placed on branches that are close together109. The clustering
was performed using the method o f114, which creates a small number of clusters with relatively more properties.
The cluster analysis define the similarities and dissimilarities between variables through a dendrogram. The key
to interpreting a dendrogram is to look at the point at which any given pair of properties join together in the tree
diagram. The pair that join together sooner are more similar to each other than those that join together later. In
the present work, the (HCA) helped to detect the most pertinent properties to be included in the groundwater
quality index—GWQI.
Results and discussion
Application of the multivariable analysis to develop the Gwqi. The sample with 600 wells was a
satisfactory number to apply the multivariable analysis, according to the simplified approach f rom109. For these
authors, the number of cases for the factorial analysis must be at least 5 times the number of measured variables.
The number of measured variables indicated in the CERB database was (26), then, (5 × 26 variables = 130). Thus,
the sample of 600 wells was representative of the 1369 wells used to test the index, besides it was a random sam-
ple, as demonstrated in the topic 3.1.
The results from the exploratory analysis are on Table 3. It involves the descriptive statistics (minimum, maxi-
mum, and average; the quartiles, lower, upper and median; standard deviation, standard error and confidence
interval), calculated with the software Statistica, version 7.0115. From the 26 variables from CERB data bank, were
excluded the variables considered not representative or presenting nonconformities: sodium (9 valid samples),
potassium (7 valid samples), ammoniacal nitrogen (4 valid samples), and acidity (not representative). The Table 3
presents only the 22 variables that will be the input for the multivariable analysis.
In Table 3, eleven variables present values equal to zero (0.0) as their minimum. These values resulted from
the substitution of the laboratorial expression (below detection limit) by (zeros). These “not measured data”
receive, in the literature, the designation of “censored data”. The a uthors116 discuss four different procedures for
solving the censured data: substitution, parametric methods, robust methods and non-parametric methods, all
of them, presenting advantages and limitations. They say that, the simplest method to replace the undetected
values is using a constant value below the detection limit. However, any value between zero and the detection
limit can lead to deviations in the descriptive statistics: zeros, tend to produce underestimated averages, and the
detection limit, tends to produce overestimated averages. In Table 3, zeros replaced, systematically, the censored
Scientific Reports | (2021) 11:16520 | https://doi.org/10.1038/s41598-021-95912-9 7
Vol.:(0123456789)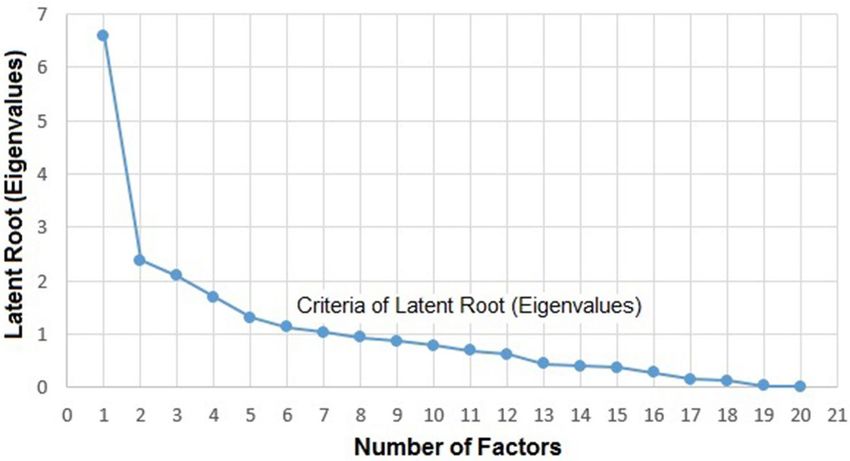
www.nature.com/scientificreports/
Valid Confidence Confidence Lower Upper Standard Standard
n = 22 number Mean interval − 95% interval + 95% Median Minimum Maximum quartile quartile deviation error CV (%)
Depth 599 103.3 99.37 107.2 90.0 10.0 339.2 72.0 130.0 48.5 2.0 47
Static level 595 19.4 17.0 21.7 7.3 − 0.5 209.3 3.0 21.2 29.6 1.2 153
Dynamic
595 53.4 50.87 55.82 52.24 1.63 220.46 35.24 62.75 30.75 1.26 58
level
Flow rate 595 9.2 8.3 10.1 5.1 0.1 88.0 1.9 12.0 10.9 0.5 118
pH 594 8.0 7.91 8.02 8.00 3.62 10.52 7.64 8.37 0.69 0.03 9
Turbidity 595 10.8 7.04 14.63 3.00 0.08 907.00 1.70 6.63 47.12 1.93 435
Conductivity 571 2804 2459 3148 1069 21 20,000 450 2880 4192 175 149
Color 581 8.0 6.7 9.3 5.0 0.0 160.0 5.0 5.0 15.9 0.7 199
Alkali-HCO 595 184.7 174.7 194.8 179.9 0.0 710.8 78.8 257.2 125.0 5.1 68
Alkali-CO 595 13.3 11.5 15.2 0.0 0.0 176.0 0.0 21.1 22.9 0.9 172
Alkali-OH 595 0.2 0.0 0.3 0.0 0.0 28.9 0.0 0.0 1.9 0.1 1233
Sulphate 573 108.5 91.7 125.3 27.5 0.0 2180.7 5.8 120.0 204.6 8.6 189
Chloride 599 855.8 708.1 1003.6 145.0 1.5 18,407.5 36.7 654.0 1841.3 75.2 215
Calcium 525 396.0 344.4 447.7 195.3 0.0 6006.0 54.4 454.9 602.4 26.2 152
Magnesium 525 134.4 110.0 159.0 31.7 0.0 2551.0 10.8 106.0 285.5 12.5 212
Nitrite 598 0.04 0.01 0.06 0.00 0.00 8.00 0.00 0.01 0.34 0.01 848
Nitrate 597 4.9 3.9 5.8 0.6 0.0 135.0 0.01 4.2 11.5 0.5 238
Iron 599 1.1 0.7 1.4 0.2 0.0 97.4 0.1 0.6 4.7 0.2 442
Silica 566 22.8 21.6 24.0 20.6 2.1 101.0 12.5 30.5 14.1 0.6 62
Fluoride 589 0.8 0.7 0.9 0.4 0.0 30.0 0.2 0.8 1.7 0.1 211
Hardness 551 958.5 813.9 1103.2 331.8 3.0 13,773.0 112.0 917.0 1728.8 73.7 180
Total Resi-
600 2356 2010 2702 764 18 47,098 328 2162 4318 176 183
due
Table 3. Descriptive statistics including the coefficient of variation (CV), with 22 representative variables.
Figure 2. Screen test indicating the number of factors to be extract, using Excel, version 15.0117.
data. The impact of this choice was evaluated, calculating the averages for both extremes (zero and detection
limit). The spreadsheet for 600 wells (Supplementary Material) presents the averages and standard deviations
for the parameters iron, fluoride and sulphate (ones with the largest amount of zeros), showing small impact.
Consequently, in this work, the substitution by zeros has no negative consequences.
The multivariable analysis developed in this work, applied the methods of factorial analysis (FA), the principal
component analysis (PCA), and the hierarchical cluster analysis (HCA), using the Statistica, version 7.0115. To
identify the optimal number of factors to participate in the GWQI, Fig. 2 shows the criterion of the latent root.
As recommended by109, only factors with latent roots or eigenvalues greater than one are considered significant.
Figure 2 shows that the limiting value is 7 factors.
Scientific Reports | (2021) 11:16520 | https://doi.org/10.1038/s41598-021-95912-9 8
Vol:.(1234567890)www.nature.com/scientificreports/
Value Eigenvalue % Total Variance Cumulative eigenvalue Cumulative %
1 6.581434 29.92 6.58 29.92
2 2.367200 10.76 8.95 40.68
3 2.103711 9.56 11.05 50.24
4 1.686792 7.67 12.74 57.91
5 1.322018 6.01 14.06 63.91
6 1.116483 5.07 15.18 68.99
7 1.018798 4.63 16.20 73.62
Table 4. Eigenvalues (Data Bank NUPEA 600 wells). Extraction: Principal Components.
n = 22 Factor 1 Factor 2 Factor 3 Factor 4 Factor 5 Factor 6
Depth − 0.081 − 0.810 0.039 − 0.106 − 0.372 − 0.010
Static level − 0.121 − 0.862 − 0.131 − 0.014 − 0.076 0.029
Dynamic level 0.016 − 0.922 0.085 0.001 0.221 0.029
Flow rate − 0.093 0.125 − 0.176 − 0.085 − 0.792 0.700
pH 0.139 − 0.017 0.110 − 0.132 0.074 − 0.500
Turbidity 0.150 − 0.016 − 0.055 0.814 0.034 0.002
Conductivity 0.944 0.051 0.078 0.037 0.132 0.022
Color − 0.070 0.044 − 0.164 0.579 0.156 − 0.090
Alkali-HCO 0.286 0.081 0.597 − 0.112 0.169 0.314
Alkali-CO − 0.142 − 0.040 0.698 0.009 0.153 − 0.236
Alkali-OH − 0.019 0.052 − 0.118 − 0.079 0.044 − 0.561
Sulphate 0.741 − 0.020 0.134 − 0.107 − 0.018 0.086
Chloride 0.969 0.030 0.017 0.056 0.058 − 0.019
Calcium 0.940 0.049 0.011 0.051 0.074 0.058
Magnesium 0.959 0.041 0.019 0.028 0.057 − 0.018
Nitrite 0.052 − 0.153 0.008 − 0.035 0.057 0.222
Nitrate 0.133 0.155 − 0.093 − 0.253 0.119 0.572
Iron 0.036 0.081 0.198 0.613 − 0.146 0.134
Silica 0.129 0.189 − 0.001 − 0.032 0.694 − 0.062
Fluoride 0.128 0.006 0.702 0.009 − 0.048 0.014
Hardness 0.982 0.044 0.013 0.036 0.064 0.010
Total Residue 0.977 0.033 0.034 0.046 0.062 − 0.023
Table 5. Factorial Loads after Normalized Varimax rotation.
Another procedure to decide how many factors to participate of the GWQI, is the criterion adopted by118,
which is, maintaining a minimum explanation of 60% of the cumulative variance. Table 4 presents the eigen-
values from the principal component analysis (PCA), the percentage of variance explained by each component;
and the cumulative variance. The cumulative variance for five (5) factors, which is equal to 63.91%, satisfies the
recommendation, and was adopted in the present work.
The Table 5 shows the matrix of factorial loads, after the Normalized Varimax rotation performed on the
factorial axes. The factorial load is the correlation of the variable with the respective factor. If that load assumes
a positive value, means that the variable has a positive correlation with the factor, and if it is negative, this cor-
relation is negative, or, the variable has a direction of variation opposite to that of the construct. The Table 5
shows both results, positive and negative.
The recommendation f rom109 is that, factor loads with values above ± 0.50 are of practical significance, how-
ever, this work adopted a factor load higher than the minimum recommended value. For instance, from (Factor
4), the parameter iron, with factor load (0.613), was the minimum value considered significant in this work.
The application of the principal component analysis (PCA) helped to evaluate the variable level of explanation
relevant to the analysis. Figures 3, 4, 5 show the graphical representations of the factorial plans: Fig. 3 (Factor
1 × Factor 2), Fig. 4 (Factor 3 × Factor 4), and Fig. 5 (Factor 4 × Factor 5).
In Fig. 3 (Factor 1 × Factor 2), the (Factor 1) explains 29.92% of the total variability of the data, and is the most
important in the analysis, and (Factor 2), explains 10.76%, as shown on Table 7. From (Factor 1), seven (7) rel-
evant variables related to water quality emerged with the greatest factorial load: calcium (0.940), chloride (0.969),
conductivity (0.944), hardness (0.982), magnesium (0.959), sulfate (0.741), and total residues (0.977). From
Scientific Reports | (2021) 11:16520 | https://doi.org/10.1038/s41598-021-95912-9 9
Vol.:(0123456789)www.nature.com/scientificreports/
Figure 3. Graphical representation of factors F1 x F2 (Normalized Varimax Rotation), using Statistica, version
7.0115.
Figure 4. Graphical representation of factors F3 x F4 (Normalized Varimax Rotation), using Statistica, version
7.0115.
Scientific Reports | (2021) 11:16520 | https://doi.org/10.1038/s41598-021-95912-9 10
Vol:.(1234567890)www.nature.com/scientificreports/
Figure 5. Graphical representation of factors F4 x F5 (Normalized Varimax Rotation), using Statistica, version
7.0115.
(Factor 2) emerged three (3) hydraulic variables with the greatest factorial loads: the dynamic level (− 0.922),
static level (− 0.862), and depth (− 0.810). The total of significant parameters, so far, is ten (10).
In Fig. 4 (Factor 3 × Factor 4), the (Factor 3) explains 9.56% of the total variability of the data, and (Factor 4)
explains 7.67%, shown on Table 7. From (Factor 3), the parameter fluoride has great significance (0.702), and
from (Factor 4), turbidity has factor load (0.814), and iron (0.613). Turbidity was discharged because during a
normal regime of groundwater exploitation this parameter is no longer significant in the water well. Thus, two
(2) significant water quality parameters were identified, totaling twelve (12) significant parameters.
In Fig. 5 (Factor 4 × Factor 5), the (Factor 4) explains 7.67% of the total variability of the data, and (Factor 5)
explains 6.01%, as shown on Table 7. From (Factor 5), the parameter flow rate with factor load (− 0.792) is the
most significant. Consequently, the number of factors to be involved in the hierarchical cluster analysis is thir-
teen (13), with nine (9) related to water quality, and four (4) are hydraulic parameters. However, the hydraulic
parameters, not related to water quality, will not be considered to compose the GWQI. Figure 6 presents the
dendrogram from the hierarchical cluster analysis (HCA).
The dendrogram shows the formation of 3 groups of parameters with high internal similarity: “hardness x
chloride”, “total residue x conductivity”, and “calcium x magnesium and sulphate”. This work choose only five (5)
relevant variables, a total that responds for 63.91% of the total variance, satisfying the recommendation from118.
The choices were: hardness (instead chloride, as they belongs to the same group); total residue (instead conduc-
tivity, as total residue is a chemical parameter); sulphate (instead calcium or magnesium, as both variables are
present in hardness). In addition, were considered fluoride and iron, which are independent from each other.
Thus, the variables to include in the GWQI to express the state of Bahia groundwater quality are: hardness, total
residue, sulphate, fluoride and iron.
The next step for the GWQI formulation is, to define the degree of relevance of each parameter, in order to
establish the relative weight (wi), necessary to the GWQI model. The starting point was to examine the commu-
nality values calculated after the normalized Varimax rotation, which represent the amount of variance explained
by each variable in the factorial solution. The Table 6 presents the communality values (from 1 to 6 factors).
The largest communality value in the column (5 factors), is hardness (0.972), providing the greatest relative
weight (wi). The others are: total residue (0.962), sulphate (0.579), fluoride (0.511), and iron (0.444). Then, on
Table 7 it is demonstrated the procedure to obtain the weights (wi), based on the communality values for the five
parameters (hardness, total residue, sulphate, fluoride and iron).
Using the communality values, and the procedure defined in this work, the relative weight (wi) for each
parameter is: hardness (0.28), total residue (0.27), sulphate (0.17), fluoride (0.15), and iron (0.13). The sum of
the five weights add to one (1.00).
Scientific Reports | (2021) 11:16520 | https://doi.org/10.1038/s41598-021-95912-9 11
Vol.:(0123456789)www.nature.com/scientificreports/
Figure 6. “R” mode dendrogram from the hierarchical cluster analysis, using Statistica, version 7.0115.
Multiple
n = 22 From1 factor From 2 factors From 3 factors From 4 factors From 5 factors From 6 factors R-square
Depth 0.007 0.662 0.664 0.675 0.813 0.813 0.661
Static level 0.015 0.758 0.775 0.775 0.781 0.782 0.634
Dynamic level 0.000 0.850 0.857 0.857 0.906 0.907 0.765
Flow rate 0.009 0.024 0.055 0.063 0.690 0.700 0.482
pH 0.019 0.020 0.032 0.049 0.055 0.305 0.041
Turbidity 0.022 0.024 0.026 0.689 0.690 0.690 0.286
Conductivity 0.892 0.895 0.901 0.902 0.919 0.920 0.904
Color 0.005 0.007 0.034 0.369 0.394 0.402 0.135
Alkali-HCO 0.082 0.088 0.445 0.457 0.486 0.585 0.362
Alkali-CO 0.020 0.022 0.509 0.509 0.533 0.589 0.166
Alkali-OH 0.000 0.003 0.017 0.023 0.025 0.340 0.027
Sulphate 0.549 0.549 0.567 0.579 0.579 0.587 0.529
Chloride 0.938 0.939 0.940 0.943 0.946 0.946 0.970
Calcium 0.883 0.885 0.885 0.888 0.893 0.897 0.963
Magnesium 0.919 0.921 0.922 0.922 0.925 0.926 0.985
Nitrite 0.003 0.026 0.026 0.027 0.031 0.080 0.033
Nitrate 0.018 0.042 0.050 0.114 0.129 0.456 0.123
Iron 0.001 0.008 0.047 0.423 0.444 0.462 0.136
Silica 0.017 0.052 0.052 0.053 0.536 0.539 0.213
Fluoride 0.016 0.016 0.509 0.509 0.511 0.511 0.164
Hardness 0.964 0.966 0.966 0.968 0.972 0.972 0.993
Total Residue 0.953 0.955 0.956 0.958 0.962 0.962 0.977
Table 6. Communalities (Data Bank with 600 wells). Extraction: Principal Component Analysis. Rotation:
Varimax Normalized.
Scientific Reports | (2021) 11:16520 | https://doi.org/10.1038/s41598-021-95912-9 12
Vol:.(1234567890)www.nature.com/scientificreports/
Commonality values (from Largest difference Weights obtained by
Parameters Table 9) (1-commonality value) Largest weight proportionality
Hardness 0.972 (1–0.972) = 0.028 0.28 0.28
Total Residue 0.962 0.27
Sulphate 0.579 0.17
Fluoride 0.511 0.15
Iron 0.444 0.13
Sum of weights 1.00
Table 7. Description how to obtain the relative weight (wi) of each parameter.
Thus, the multivariable analysis helped to define the five parameters to represent the groundwater quality of
the state of Bahia; and the weight of importance for each parameter (wi), independent of subjective assessments.
The next step is to transform the chemical concentration ( ci) for each variable, in dimensionless grade ( qi), to
calculate the GWQI value for each water sample.
Nonlinear fit to transform dimensional groundwater quality parameters in dimensionless
subindices. It was necessary to develop empirical curves, with chemical concentrations in the abscissa and
grades (from 0.0 to 100.0) in the ordinate. The grades were defined using the limits for drinking water, from the
Resolution 2914/201187. The Fig. 7a–e show the curves (concentration versus grade) for the parameters (hard-
ness, total residue, sulphate, fluoride, and iron), and the mathematical models derived using the nonlinear curve
fitting from the statistical package Statgraphics Centurion XVI119.
The Table 8 presents the nonlinear fit for the five parameters (hardness, total residue, sulphate, fluoride, and
2.
iron), the respective fitting constants, the validity intervals, and the respective correlation coefficients R
Mathematical formulation for the groundwater quality index. The mathematical formulation for
the GWQI is similar to the formulation of the WQI-NSF, a product of grades ( qi) raised to a power ( wi), or the
degree of importance of each parameter in the water quality (Eq. 1).
GWQI = Qwi 0.28 0.27 0.17 0.15
i = QHARD × QTR × QSO4 × QF × Q0.13
IRON (1)
The grades representing the groundwater quality vary from 0.0 to 100.0. The classification of the groundwater
quality, based on the GWQI values, are similar to the classification for the WQI-NSF, as follows: grades 0.00–19.99
(BAD, color RED); 20.00–36.99 (POOR, color PINK); 37.00–51.99 (REGULAR, color YELLOW); 52.00–79.99
(GOOD, color GREEN); and, 80.00–100.00 (GREAT, color BLUE).
Application of the groundwater quality index for the state of Bahia. From the spreadsheet for
1369 wells presented as Supplementary Material, the number of wells with GWQI classified as (BAD, POOR,
REGULAR, GOOD and GREAT) for the hydrogeological domains (sedimentary, crystalline, karstic, and meta-
sedimentary) have the following distribution: the grades (BAD and POOR) corresponds to 69.5% of the total
number of wells, and (GOOD and GREAT) to 30.1%. The percentage of 69.5% has good correlation with the
percentage of wells drilled in the domains (crystalline and karstic) which is 60.3%. These domains are mainly in
the arid and semiarid regions of the state of Bahia and produce groundwater of inferior quality.
To investigate if the GWQI values for the sample of 1369 wells (Supplementary Material), are affected by the
characteristics of the sample of 600 wells (Supplementary Material), used to develop the GWQI, it was calculated
for this sample, the number of wells, per hydrogeological domain, in which, the concentrations for the param-
ater87.
eters (hardness, total residue, sulphate, fluoride and iron), are, below and above, the limits for drinking w
The calculations presented in the spreadsheet (600 wells), indicated an averaged percentage of 70.5% for the set
(concentrations below the limits); and, averaged percentage of 29.5% for the set (concentrations above the limits).
Based on these results, it is expected for the sample of 600 wells, around 70.5% of grades (GOOD and GREAT),
and around 29.5% of grades (BAD and POOR). These results are quite different from the sample (1369 wells),
with 69.5% (BAD and POOR), and, 30.1% (GOOD and GREAT). The difference between the samples indicates
that the calculation of the GWQI, for the 1369 wells, was not biased, and the multivariate process not flawed.
To visualize how the GWQI values, and the respective grades, are correlated with the characteristic of the
groundwater sample, Table 9 shows, for ten wells located in the crystalline and karstic hydrogeological domains,
the GWQI values and grades, and the concentration for the parameters (hardness, total residue, sulphate, fluoride
and iron). The data were taken from the set of 1369 wells (Supplementary Material).
The data on Table 9 show GWQI values from 4.27 to 87.52, very well correlated with the parameters concen-
tration: (i) if parameters have concentrations above the limits, the grades are (BAD and POOR); (ii) if concentra-
tions are close to the limits (REGULAR); and, (iii) if concentrations are below the limits (GOOD and GREAT).
Finally, with the objective to compare the groundwater quality evaluation resulting from the new index
(GWQI), with the previous index NGWQI (Oliveira et al. 2007)71, it was examined the number of similar and
dissimilar results using both indices. These results are presented in the spreadsheet for 1369 wells (Supplemen-
tary Material).
Examining the similarity between the grades it was found that: the grades (GOOD and GREAT by NGWQI),
have similarities (44.5 and 53.7%) with the grades (GOOD and GREAT by GWQI), which means, around half
Scientific Reports | (2021) 11:16520 | https://doi.org/10.1038/s41598-021-95912-9 13
Vol.:(0123456789)You can also read