Methane dynamics in three different Siberian water bodies under winter and summer conditions
←
→
Page content transcription
If your browser does not render page correctly, please read the page content below
Biogeosciences, 18, 2047–2061, 2021
https://doi.org/10.5194/bg-18-2047-2021
© Author(s) 2021. This work is distributed under
the Creative Commons Attribution 4.0 License.

Methane dynamics in three different Siberian water
bodies under winter and summer conditions
Ingeborg Bussmann1 , Irina Fedorova2 , Bennet Juhls3 , Pier Paul Overduin4 , and Matthias Winkel5,a
1 Alfred  Wegener Institute Helmholtz Centre for Polar and Marine Research, Helgoland, Germany
2 Institute of Earth Sciences, St. Petersburg University, St. Petersburg, Russia
3 Institute for Space Sciences, Department of Earth Sciences, Freie Universität Berlin, Berlin, Germany
4 Alfred Wegener Institute Helmholtz Centre for Polar and Marine Research, Potsdam, Germany
5 German Research Centre for Geoscience, 3.7 Geomicrobiology Group, Potsdam, Germany
a current address: German Research Centre for Geosciences, 3.5 Interface Geochemistry Group, Potsdam, Germany

Correspondence: Ingeborg Bussmann (ingeborg.bussmann@awi.de)

Received: 24 March 2020 – Discussion started: 22 April 2020
Revised: 31 December 2020 – Accepted: 13 February 2021 – Published: 22 March 2021

Abstract. Arctic regions and their water bodies are affected       1.3 ◦ C. In the ice cores a median methane concentration of
by a rapidly warming climate. Arctic lakes and small ponds         9 nM was observed, with no gradient between the ice sur-
are known to act as an important source of atmospheric             face and the bottom layer at the ice–water interface. MOX in
methane.                                                           the (melted) ice cores was mostly below the detection limit.
   However, not much is known about other types of wa-             Comparing methane concentrations in the ice with the un-
ter bodies in permafrost regions, which include major rivers       derlaying water column revealed methane concentration in
and coastal bays as a transition type between freshwater and       the water column 100–1000 times higher.
marine environments. We monitored dissolved methane con-              The winter situation seemed to favor a methane accumu-
centrations in three different water bodies (Lena River, Tiksi     lation under ice, especially in the lake with a stagnant water
Bay, and Lake Golzovoye, Siberia, Russia) over a period of 2       body. While on the other hand, in the Lena River with its
years. Sampling was carried out under ice cover (April) and        flowing water, no methane accumulation under ice was ob-
in open water (July–August). The methane oxidation (MOX)           served. In a changing, warming Arctic, a shorter ice cover
rate and the fractional turnover rate (k 0 ) in water and melted   period is predicted. With respect to our study this would im-
ice samples from the late winter of 2017 was determined with       ply a shortened time for methane to accumulate below the ice
the radiotracer method.                                            and a shorter time for the less efficient winter MOX. Espe-
   In the Lena River winter methane concentrations were            cially for lakes, an extended time of ice-free conditions could
a quarter of the summer concentrations (8 nmol L−1                 reduce the methane flux from the Arctic water bodies.
vs. 31 nmol L−1 ), and mean winter MOX rate was low
(0.023 nmol L−1 d−1 ). In contrast, Tiksi Bay winter methane
concentrations were 10 times higher than in summer
(103 nmol L−1 vs. 13 nmol L−1 ). Winter MOX rates showed           1   Introduction
a median of 0.305 nmol L−1 d−1 . In Lake Golzovoye, me-
dian methane concentrations in winter were 40 times higher         Worldwide, the mixing ratio of methane has been increas-
than in summer (1957 nmol L−1 vs. 49 nmol L−1 ). However,          ing rapidly since 2000, from 2.1 ppb yr−1 for the time
MOX was much higher in the lake (2.95 nmol L−1 d−1 ) than          span 2000–2009 to 6.6 ppb yr−1 for the time span 2008–
in either the river or bay. The temperature had a strong influ-    2017 and to 6.1 ppb yr−1 in 2017 (Saunois et al., 2020).
ence on the MOX (Q10 = 2.72±0.69). In summer water tem-            Understanding and quantifying the global methane bud-
peratures ranged from 7–14 ◦ C and in winter from −0.7 to          get is important for assessing realistic pathways to mit-
                                                                   igate climate change. For the 2008–2017 decade, global

Published by Copernicus Publications on behalf of the European Geosciences Union.
2048 I. Bussmann et al.: Methane dynamics in three different Siberian water bodies methane emissions are estimated by a top-down approach 2020). However, the hydrography of a lake is also an impor- to be 576 Tg CH4 yr−1 (range 550–594, corresponding to tant factor to consider since stratification of the water col- the minimum and maximum estimates of the model ensem- umn counteracts an intense gas exchange. Thus, examples ble) (Saunois et al., 2020). The reasons for the observed are known for lakes with incomplete spring mixing and con- increases in atmospheric methane are unclear. A probable sequently a maximum gas exchange in autumn during com- explanation is increased methane emissions from wetlands, plete mixing (Deshpande et al., 2015). both in the tropics (Nisbet et al., 2016) and in the Arc- Rivers of permafrost regions are characterized by an ice tic (Fisher et al., 2011), and from other Arctic water bod- season of > 100 d duration between autumn freeze-up, and ies (Walter Anthony et al., 2016; Kohnert et al., 2018) or spring ice-off; for the Lena River it is > 160 d (Shiklo- geological methane emissions (Kohnert et al., 2017). Espe- manov and Lammers, 2014). Ice effects and the demobiliza- cially in northern latitudes, natural wetlands contribute 59 % tion of liquid water result in very low discharge during winter to the northern methane emissions (Saunois et al., 2020). In freeze-up and runoff is lowest during late winter (Lininger the Arctic, the mean atmospheric methane mixing ratio in- and Wohl, 2019). A decrease in ice thickness of the largest creased by 6 ppb yr−1 from 2001 to 2017, resulting in an Siberian rivers during the last 10 to 15 years (Shiklomanov atmospheric mole fraction of 1939 ppb in 2017 at Svalbard and Lammers, 2014) could enhance the channel connectivity (Platt et al., 2018) and with a median of 1932 ppb in 2017 for to subchannel and groundwater flow, causing an increase in Tiksi (Hydrometeorological Observatory of Tiksi, Russia). In winter base flow, as suggested by Gurevich (2009). An in- particular the Laptev Sea, in eastern Siberia, is generally a creased winter flow and increasing temperatures in the Lena source of methane to the atmosphere, and the sea–air flux of River are also supported by Tananaev et al. (2016), Yang et methane is mainly affected by increasing water temperatures al. (2002), and Peterson et al. (2002). (Wåhlström et al., 2016). Also, Saunois and co-authors es- An important filter, counteracting the methane flux into the timated increased methane emission for freshwater systems atmosphere, is microbial methane oxidation. Methane can be and wetlands, but a better quantification of the emissions of oxidized under anoxic conditions close to sediment horizons different contributors (streams, rivers, lakes, and ponds) is where it is produced (Martinez-Cruz et al., 2017; Winkel et needed (Saunois et al., 2016). al., 2018) or during migration through the oxic water col- Lakes are important sources of atmospheric methane on umn to the atmosphere (Mau et al., 2017a; Bussmann et al., a regional to global scale (Bastviken et al., 2004; Cole et 2017). Under ice cover, it is important to consider methane al., 2007), and their contribution is predicted to increase oxidation below ice as it may reduce the total amount of in response to climate change and rapidly warming waters methane emitted to the atmosphere during ice-off. Active (O’Reilly et al., 2015; Tan and Zhuang, 2015; Wik et al., methane oxidation and a methanotrophic community have 2018). Most of the methane produced in lake sediments en- been shown for permafrost thaw ponds and lakes (Kallistova ters the atmosphere via ebullition (Bastviken et al., 2004; et al., 2019). Yet, the methane oxidation capacity in such Walter et al., 2007), a temperature-sensitive transport mode lakes during ice cover with low temperatures and low oxy- with high spatial and temporal heterogeneity (DelSontro et gen concentrations is unknown. In a study covering several al., 2015). The role of Arctic rivers as a methane source to the boreal lakes, methane oxidation was restricted to three lakes, shelf seas is poorly described. Some studies present rivers as where the phosphate concentrations were highest (Denfeld et strong methane sources (Morozumi et al., 2019), while other al., 2016). Rates of methane oxidation during the winter have studies revealed a complex pattern of riverine methane input been found to be much lower than summer rates, yet there is (Bussmann et al., 2017). no clear consensus on the factors limiting methane oxidation One major drawback from most of these studies is that in winter (Ricão Canelhas et al., 2016). In addition to oxygen sampling was conducted in the ice-free season, although concentration, the geological background (i.e., yedoma-type most of the year Arctic water bodies are ice covered. Thus, permafrost lakes versus non-yedoma-type lakes) also had a the seasonal variation could not be captured within those significant impact on the methane oxidation rate (Martinez- studies. The ice cover on lakes decouples the water body Cruz et al., 2015). from the atmosphere and the circulation changes from wind- Our study tests the hypothesis that winter ice blocks driven to thermohaline. After ice formation a stable winter methane emissions, leading to the accumulation of methane stratification is set up. As there is no more external oxygen in the underlying water bodies. By studying hydrographi- supply, enhanced anaerobic degradation leads to accumula- cally different water bodies (lake, river, and sea), we ex- tion of methane, H2 S and NH3 (Leppäranta, 2015). In several pect insights into the influence of water column dynamics lakes in Alaska and Canada, dissolved methane was highest on methane accumulation to result. In addition, we measure under the ice cover, indicating that the spring ice-off period methane oxidation rates in the water column and in melted is a large source of atmospheric methane (Townsend-Small ice to assess oxidation as a potential sink. et al., 2017; Cunada et al., 2018; Serikova et al., 2019). In lakes at > 65◦ N the ice duration is 9 months, typically from around mid-September to mid-June (Cortés and MacIntyre, Biogeosciences, 18, 2047–2061, 2021 https://doi.org/10.5194/bg-18-2047-2021
I. Bussmann et al.: Methane dynamics in three different Siberian water bodies 2049
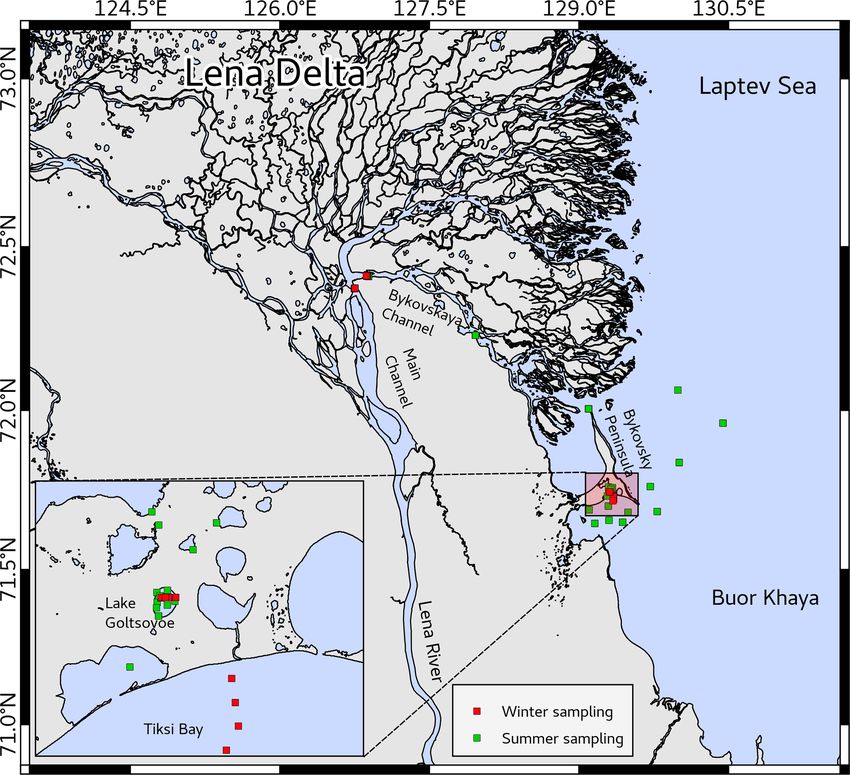
Figure 1. Map of the study area in the Lena River and Buor-Khaya Bay (Siberia, Russia). The inset shows details of the sampling at Lake
Golzovoye. Sampling locations in winter are shown in red and summer sampling locations in green. Created by Bennet Juhls.
2 Study area The Lena River has a mean annual discharge of
581 km3 yr−1 . It is the second largest Arctic river by annual
This study was conducted on the southern coast of Bykovsky discharge and the sixth largest globally. There are no dams
Peninsula in northeast Siberia, Russia (Fig. 1). Thermokarst on the mainstem of the Lena, but there is a dam on the Vi-
lakes in that area commonly originated in the early Holocene lyuy River, one of the Lena’s main tributaries (Holmes et al.,
when surficial permafrost started to thaw, leading to accu- 2013). The Lena’s watershed is 2.6 million square kilome-
mulation of lake sediments with organic contents of about ters, of which 70.5 % is underlain by continuous permafrost
5 %–30 % (Biskaborn et al., 2016; Schleusner et al., 2015). (Juhls et al., 2020). Most of the water is discharged at the
Thermokarst lakes in the Lena River delta seem to be ice free end of May and beginning of June when the ice in the rivers
a little later after the coastal ice breakup, depending strongly breaks up, but the Laptev Sea is still covered by sea ice
on the air temperature in the individual year (Bennet Juhls, (Holmes et al., 2012). The main Lena River branches en-
unpublished data). ter the Buor-Khaya Bay through the northern and eastern
Offshore of the Bykovsky Peninsula, part of the Yedoma part of the delta and through the Bykovskaya Channel with
Ice Complex is submerged, and subsea permafrost is cur- 20 %–25 % of the Lena River water discharge (Charkin et
rently degrading. The coastline erodes at mean rates of be- al., 2011). The further distribution of the river water in Buor-
tween 0.5 and 2 m yr−1 and can intersect inland water bodies, Khaya Bay is mainly driven by the atmospheric systems of
draining them or leading to the formation of thermokarst la- the cyclonic or anticyclonic Arctic circulation (Thibodeau et
goons (Lantuit et al., 2011). The sea ice season in Tiksi Bay al., 2014; Wegner et al., 2013).
and the Buor-Khaya Bay typically starts in late September–
early October and ends in beginning–mid-July (Angelopou-
los et al., 2019; Janout et al., 2020). Due to its isolation be-
hind Muostakh Island and Cape Muostakh, sea ice tends to
be preserved longer than in the central Laptev Sea, resulting
in approx. 96 d of open water (Günther et al., 2015).
https://doi.org/10.5194/bg-18-2047-2021 Biogeosciences, 18, 2047–2061, 20212050 I. Bussmann et al.: Methane dynamics in three different Siberian water bodies
3 Material and methods core was used to measure the in situ temperature and back-
up, one core was used for methane analysis, and the third
3.1 Study sites core was drilled for later molecular analyses. For determin-
ing the methane oxidation rates and later methane concentra-
In the course of several expeditions to the Lena Delta tions, the ice cores were processed at the Research Station
(Siberia, Russia), we were able to repeatedly sample the Samoylov Island. The top 10 cm, a 10 cm mid-section, and
same locations in winter and summer over the years (Ta- three 10 cm sections at the bottom of the core were cut off
ble 1). and transferred to special PVDF gas sampling bags (Keika
In September 2016, water samples were taken in the Ventures). The remaining parts of the cores were kept frozen.
Bykovskaya Channel and mouth of the Lena River (Over- The bags were evacuated and the cores melted within ap-
duin et al., 2017). In April 2017 with ice cover on the water prox. 5 h in a water bath at 8 ◦ C. The sample was distributed
bodies, ice cores were taken at Lake Golzovoye, the Lena with a 60 mL syringe to three glass bottles for determination
River, and Tiksi Bay, and the water below the ice was also of MOX and one bottle (which was poisoned immediately
sampled. Lake Golzovoye is an oval-shaped thermokarst lake with H2 SO4 ) for analysis of methane concentration (Strauss
about 0.5 km in diameter with a maximal depth of 10 m, sur- et al., 2018).
rounded by yedoma uplands at various stages of degradation
and with no ice grounding in its center (Spangenberg, 2018; 3.4 Methane analysis
Strauss et al., 2018). Tiksi Bay is a shallow brackish bay at
the southern end of Buor-Khaya Bay but still strongly in- Methane concentrations were determined via the headspace
fluenced by the Lena River outflow. The water column is method by adding 20 mL of N2 as headspace and vigorous
usually stratified, with a colder, more saline water underly- shaking for 2 min. Headspace methane concentrations were
ing the brackish surface layer (Overduin et al., 2016). The analyzed in the home laboratory with a gas chromatograph
water of the Lena River was sampled near Samoylov island (GC 2014, Shimadzu) equipped with a flame ionization de-
(main channel). In July and August 2017, we sampled the tector and a ShinCarbon column (Restek, USA). The tem-
same locations (Lena River near Samoylov, Tiksi Bay, and peratures of the oven, the injector, and detector were 100,
Lake Golzovoye) with open water (Strauss et al., 2018). The 120, and 160 ◦ C, respectively. The carrier gas (N2 ) flow
transect to the “outer” Tiksi Bay has been investigated repeat- was 20 mL min−1 , with 40 and 400 mL min−1 synthetic air.
edly over the previous years (Bussmann, 2013; Bussmann et Gas standards (Air Liquide) with methane concentrations of
al., 2017). In April 2018, again under-ice samples were taken 10 and 100 ppm were used for calibration. The calculation of
from the Lena River (Kruse et al., 2019). the methane concentration was performed according to Ma-
gen et al. (2014). The precision of the calibration line was
3.2 Water sampling for methane analysis
r 2 = 0.99 and the reproducibility of the samples was < 5 %.
In winter, water samples at the ice–water interface were taken
with a 1 L water sampler (Uwitec Austria) and transferred 3.5 Methane oxidation rate (MOX)
to 0.5 L Nalgene bottles. In the field camp, the water was
transferred with a 60 mL syringe into glass bottles, closed The MOX rate was determined by adding radioactive triti-
with butyl stoppers and crimps, poisoned with 0.2 mL 25 % ated methane to triplicate samples (Bussmann et al., 2015).
H2 SO4 , and stored upside down at 4 ◦ C. In summer the water The principle of the MOX rate determination is based on
samples were directly transferred from the water sampler into the ratio of produced tritiated hydrogen from the added tri-
the glass bottles and further processed as described above. tiated methane. This ratio corrected for the incubation time
In winter 2017, due to problems of freezing, 40 mL gives the fractional turnover rate (k 0 , d−1 ). To obtain the
of sample water was shaken for 2 min with 20 mL nitro- MOX rate, k 0 is multiplied with the in situ methane con-
gen in a 60 mL syringe. This headspace was then trans- centration. Radioactive tritiated methane (0.1 mL of 3 H-
ferred into glass bottles filled with a saturated NaCl so- methane, 2 kBq mL−1 , American Radiolabeled Chemicals)
lution. Comparative measurements showed no significant was added to triplicate samples. Samples were incubated for
difference between these two sampling strategies (Tripu- 60 h at 1 ◦ C, in the dark. Incubation was stopped by adding
tra, 2018). This data set has been published already: 0.2 mL of 25 % H2 SO4 . Abiotic controls were poisoned be-
https://doi.org/10.1594/PANGAEA.905776 . fore adding the tracer. Radioactivity was determined with a
liquid scintillation counter (Triathler, Finland) and Ultima
3.3 Ice cores Gold (PerkinElmer) as a scintillation cocktail. For MOX, the
limit of detection was calculated as described in Bussmann
In winter 2017, in addition to water sampling, we also inves- et al. (2015) and was determined to be 0.009 nmol L−1 d−1
tigated ice cores for their methane content and methane oxi- for this data set.
dation rates. For each station three ice cores were drilled with In a set of experiments, we also assessed the influence of
a Kovacs Mark II ice coring system (9 cm diameter). One temperature on the MOX rate. Water samples (main chan-
Biogeosciences, 18, 2047–2061, 2021 https://doi.org/10.5194/bg-18-2047-2021I. Bussmann et al.: Methane dynamics in three different Siberian water bodies 2051
Table 1. Locations and sampling dates of water samples and ice cores for dissolved methane (M-conc) and methane oxidation rates (MOX).
Location Sampling date Season Water Number of sampling
temperature samples
(◦ C)
Lena River 7–8 Sep 2016 Summer 8.5–10.3 22 M-conc
Lena River 19–22 Apr 2017 Winter 1.3 6 M-conc, MOX
Lena River 29 Jul 2017 Summer 1–14 13 M-conc
Lena River 21–24 Apr 2018 Winter −0.7 10 M-conc
Lake Golzovoye 7–8 Apr 2017 Winter 0.3 8 M-conc
Lake Golzovoye 7–8 Apr 2017 Ice cores 5 M-conc, MOX
Lake Golzovoye 5 Aug 2017 Summer 7–10 5 M-conc
Tiksi Bay 10 Apr 2017 Winter 0.3 2 M-conc
Tiksi Bay 10 Apr 2017 Ice cores 4 M-conc, MOX
Tiksi Bay 15 Jul–5 Aug 2017 Summer 4–11 6 M-conc
nel, April 2017) that were incubated at temperatures from 1, vs. 10 nM in winter (Wilcoxon test, p = 0.0009, Fig. 2).
4, 7, and 10 ◦ C show the temperature curve of the MOX re- Pooling the complete data set into winter and summer data
action. At a previous cruise off Svalbard, identical experi- for the Lena River showed that summer concentrations were
ments were performed (Mau et al., 2017a) with water from significantly higher than winter concentrations (median of
stations HE449-CTD-2, 10, 33, and 37 incubated at temper- 31 nM vs. 8 nM, p < 0.001). In summer 2016, water tem-
atures from 0, 4, 8, 13, and 20 ◦ C. We determined the Q10 perature ranged from 8.5–10.3 ◦ C and electric conductivity
factor, which indicates the temperature dependence of a bio- from 135–185 µS cm−1 with a pH value around 6 that showed
logical process according to (Raven and Geider, 1988) almost no variation in the water columns of 8.3 to 10 m
! (Matthias Winkel, unpublished data).
m In winter 2017, the water column under the ice of the Lena
Q10 = exp −10 · 2 , (1)
Tis River was about 1.3 ◦ C with a conductivity of 275 µS cm−1 ;
no stratification was evident. The water was flowing at a
where Tis is the in situ temperature and “m” the slope of the
speed of 0.043 m s−1 under the ice and with 0.1 m s−1 above
regression line of the Arrhenius plot (the inverse of the abso-
the bottom (0.85 H ) (Strauss et al., 2018) (Sect. 2.5). In the
lute temperature vs. the natural logarithm of the MOX rate).
main channel of the Lena River the maximal water depth
3.6 Hydrochemistry and hydrology in winter 2017 was 25.3 m vs. 28 m in summer at the same
point. In winter the water velocity in the channels is much
Profiles of water temperature and conductivity were mea- lower than in summer: in April 2017 it was 0.18 m s−1 in
sured with a CastAway CTD (SonTek) in summer 2016 the Bykovskaya Channel but reached 1.53 m s−1 in sum-
and in winter and summer 2017. Water depth measurements mer 2016.
were made with an echo-sounding device (Garmin), ev- In summer 2017, the water discharge in Bykovskaya
ery 10 m along the profile. Water velocity was measured in Channel was 5313.4 m3 s−1 . Water temperature ranged from
three horizons at each vertical profile: 0.2, 0.6, and 0.8 H 13–14 ◦ C with no changes with water depth, indicating a
(with H being total water depth) using a hydrological speed full mixing (Strauss et al., 2018). In winter 2018, the water
recorder (GR-21). Water discharges were calculated accord- column under the ice of the Lena River was about −0.7 ◦ C
ing to the recommendations for Russian hydrometeorologi- with a median conductivity of 465 µS cm−1 and a median pH
cal stations (Fedorova et al., 2015). of 7.3. In Bykovskaya Channel oxygen saturation had a me-
dian value of 51 %. No stratification of the water column was
evident, based on water temperature and conductivity (Kruse
4 Results et al., 2019). These findings agree to the Lena River monitor-
ing observations by Juhls et al. (2020).
4.1 Methane concentrations and hydrochemistry
In Lake Golzovoye, in summer 2017, the median methane
In the Lena River in summer 2016, median methane concen- concentration was 49 nM (n = 5), while in winter concentra-
trations were 37 nM (n = 21) in surface water and signifi- tions were about 40 times higher with a median of 1957 nM
cantly higher than the winter concentrations of 2017 (8 nM, (n = 8, Wilcoxon test, p = 0.002, Fig. 2). In winter, the wa-
Wilcoxon test, p = 0.0004, Fig. 2). Comparing the summer ter temperature of the lake was cold at the surface (median
and winter concentrations for 2017/18 also showed signif- 0.3 ◦ C in the top 1 m) and warmer (2 ◦ C) at the bottom with a
icantly higher values in summer, with a median of 25 nM
https://doi.org/10.5194/bg-18-2047-2021 Biogeosciences, 18, 2047–2061, 20212052 I. Bussmann et al.: Methane dynamics in three different Siberian water bodies
Figure 2. Median summer and winter methane concentrations at the Lena River, Lake Golzovoye, and Tiksi Bay in the years 2016–2018.
Bright columns indicate summer values, and dark columns indicate winter values. The asterisks indicate significant differences between
summer and winter data.
thermocline at 2 m. In summer, the surface water was heated
to 7–10 ◦ C, while the bottom water only warmed to 4–5 ◦ C.
In Tiksi Bay and in summer 2017, the median methane
concentration was 14 nM (n = 6). In contrast, in winter con-
centrations were about 7 times higher with a median of
103 nM (n = 2). Due to low sample numbers, no statisti-
cal test was possible. In summer 2017, water temperature
ranged from 4.3–10.9 ◦ C and electric conductivity from 20–
6200 µS cm−1 . In winter, bottom water had a temperature of
3.3 and 0.3 ◦ C at the top 1 m, with a thermocline at 1–2 m.
4.2 Ice cores
Ice cores were taken at Lake Golzovoye and in Tiksi Bay,
whereas no ice core data are available for the Lena River
itself (Strauss et al., 2018). Methane concentrations in the Figure 3. Median methane concentrations in the ice cores and in
ice cores of Lake Golzovoye and Tiksi Bay were rather low the water below the ice. Data from Tiksi Bay are shown in light
(both with a median of 9 nM). No depth gradients from the grey and data for Lake Golzovoye in dark grey, with core no. 24
ice surface, middle section, and the three lowermost sections shown separately in white. Note the logarithmic scale.
were evident. In a closeup for the bottom layers, there was
a slight increase in methane towards the ice–water interface
for the ice cores from Lake Golzovoye, but not from Tiksi Golzovoye and Tiksi Bay were possible. In the first step we
Bay. determined the fractional turnover rate k 0 . In the ice cores,
Figure 3 shows the median methane concentrations in k 0 was very patchily distributed, and 73 % of all samples
the ice cores and in the water from the ice–water interface. were below the detection limit. In all positive samples, the
Water column concentrations were 11 times and 109 times value for k 0 was rather stable with a median of 0.003 per
higher than in the ice cores, for Tiksi Bay and Lake Gol- day (n = 31). In the water samples below the ice, the frac-
zovoye, respectively, with a median of 102 and 985 nM tional turnover rate k 0 was never below the detection limit.
(Bussmann and Fedorova, 2019). However, in one core of The median k 0 determined for all water samples (Lena River)
Lake Golzovoye (core no. 24), concentrations were orders of was also 0.003 (n = 14). To calculate the MOX for all water
magnitude higher throughout the core (854–11091 nM) and samples, we multiplied the median k 0 of 0.003 obtained from
6954 nM in the water below Fig. 2 (Fig. 3). Lena River and ice cores with the respective in situ methane
concentration of the water columns of Lake Golzovoye, Tiksi
4.3 Methane oxidation rates (MOX) Bay, and Lena River.
The highest MOX rates were found in the water be-
Methane oxidation rates were determined in the melted water low station 24 in Lake Golzovoye (20.36 nmol L−1 d−1 ),
from the ice cores from the different locations and in water where very high methane concentrations were also observed
from the Lena River. Due to logistic restraints at the field (Fig. 4). The median MOX in the other water samples of
sites, no direct measurements of MOX in the waters of Lake Lake Golzovoye was about 1 order of magnitude lower
Biogeosciences, 18, 2047–2061, 2021 https://doi.org/10.5194/bg-18-2047-2021I. Bussmann et al.: Methane dynamics in three different Siberian water bodies 2053
5 Discussion
5.1 Methane concentrations and hydrochemistry
In this study we compared the methane concentration un-
der ice cover (winter) with open-water situations (summer)
in three different water bodies.
In winter the methane concentrations in the Lena River
were 4 times lower than in summer (Table 2). The Lena River
displays a reduced but still substantial water flow/discharge
under ice cover. In 2017, the discharge in winter (March
and April with 2830 and 2185 m3 s−1 ) was about 10 times
lower than in summer (July and August with 29 800 and
26 000 m3 s−1 (Shiklomanov et al., 2018).
Figure 4. Box plot of the calculated methane oxidation rates (MOX) In winter there are only a few possible sources of methane
in water under ice cover at Lake Golzovoye, at the location of ice left. The surrounding soils of the drainage basins are all
core no. 24, Tiksi Bay, and the Lena River. Note the logarithmic frozen. The ground below the main channels of the Lena is
scale. still unfrozen (Fedorova et al., 2019); however the sediment
consists of coarse grain sizes and is poor in organic mate-
rial (Rivera et al., 2006), and we do not expect any in situ
methane production. Especially in the Lena River, a substan-
tial amount of particulate organic carbon (POC) originates
from thermokarst-induced, abrupt collapse of Pleistocene Ice
Complex deposits. These events mainly occur in late sum-
mer. The signal however is still visible in winter (Wild et al.,
2019). With these collapses methane could also be imported
to the river. So, we could only detect low methane concen-
trations in winter. In contrast, in summer, the active-layer
soils from the drainage basin allow for several sources of
methane and thus increased methane concentrations in sum-
mer. Also, methane could be transported from the southern
Lena catchment towards our study area, as is suggested for
particulate organic matter (Winterfeld et al., 2015). At least
during the warm season, methane production from (temper-
ate) river sediments is possible (Bednařík et al., 2019).
Figure 5. Influence of incubation temperature on methane oxidation In Tiksi Bay, we observed an increase of a factor of 7 in
rate for Lena River water, winter 2017. dissolved methane under ice cover, compared to open-water
conditions (Table 2). Tiksi Bay is part of Buor-Khaya Bay
and via the central Laptev Sea perennially connected to the
(2.95 nmol L−1 d−1 ). In Tiksi Bay and in the Lena River Arctic Ocean. Not much is known about tidal surge or water
MOX rates decreased by further orders of magnitude (me- movement in Tiksi Bay under ice cover. It is anticipated that
dian of 0.305 and 0.023 nmol L−1 d−1 , Fig. 4). the ice cover on Tiksi Bay will lead to a decrease in tidal am-
plitudes and velocities (Fofonova et al., 2014). The structure
4.4 Temperature influence on MOX of ice formation in Tiksi Bay also suggests that even in winter
it is still an open system connected to the outer bay (Spangen-
To assess the influence of temperature on the MOX, we incu-
berg et al., 2020). Sources of methane could be through diffu-
bated water samples at different temperatures and determined
sion of methane from the underlying sediment (Bussmann et
their MOX rate. As expected, with increasing temperature
al., 2017), where methane is produced by the degradation of
the MOX rate also increased (Fig. 5). The Q10 calculated for
organic material. However, as aerobic methane oxidation in
these water samples from the Lena River was 2.72±0.69. For
the water column is impaired by low temperatures, methane
polar and marine waters off Svalbard a Q10 of 2.99 ± 0.86
concentrations in water increase.
was calculated.
In Lake Golzovoye, dissolved methane concentrations in-
creased by a factor of 40 from summer to winter (Table 2).
Lake Golzovoye is an isolated freshwater lake with pre-
sumably only a weak thermohaline circulation (Leppäranta,
https://doi.org/10.5194/bg-18-2047-2021 Biogeosciences, 18, 2047–2061, 20212054 I. Bussmann et al.: Methane dynamics in three different Siberian water bodies
Table 2. Comparison of methane concentration in water and ice as well as methane oxidation rates (MOX) at different sites and in different
seasons.
Location [CH4 ]winter / Under ice Water [MOX] MOXduring ice off /
[CH4 ]summera accumulationb velocity winterc MOXdduring ice coverage
winter
Lena River S > W , ×5 NAe strong Low, 4674/4 nmol L−1
S
W = 1270
Lake W > S, ×40 Wa
I , ×109 minor High, 10 165/797 nmol L−1
Golzovoye S>W = 13
Tiksi Bay W > S, ×7 Wa > I , ×11 medium Medium 40/84 nmol L−1
S=W = 0.5
a Comparing dissolved methane concentrations in water in winter and summer. b Comparing methane concentration in the lowest
ice core layer with underlying water. c MOX winter data from this study and summer data from Osudar et al. (2016) and
Bussmann et al. (2017), d assuming 270 d of ice coverage for Lake Golzovoye and Tiksi Bay and 160 d of ice coverage for Lena
River. e NA: not available.
2015; Spangenberg et al., 2020). A similar seasonal pat- in terms of methane, a complete separation of the water body
tern of methane among lake waters of the Mackenzie Delta from the atmosphere can be assumed. As mentioned earlier in
has been observed, ranging from very high concentrations this study and in Spangenberg et al. (2020), core no. 24 (LK-
at the end of winter beneath lake ice (> 2 000 000 nM) to 3) in Lake Golzovoye had much higher methane concentra-
considerably lower concentrations during open water, partic- tions throughout the core and visible inclusions of (methane)
ularly by late summer (approx. 10 000 nM) (Cunada et al., bubbles. We assume that core no. 24 was located above an
2018). For yedoma lakes in Alaska, the same pattern was ob- active ebullition site, which might have slowed ice formation
served with high methane concentrations in winter and a de- and prolonged direct methane release to the atmosphere.
crease of more than 1 order of magnitude in summer (even In the ice itself, 28 % of the samples showed methane oxi-
though the actual concentrations > 7.53 mg L−1 or 120 mM dation capability. During ice formation most free-living bac-
were much higher than in this study) (Martinez-Cruz et al., teria are lost from the liquid phase through incorporation
2015; Sepulveda-Jauregui et al., 2015). The same pattern is into the ice, while bacterial aggregates remain in the water
reported for boreal Swedish lakes (Denfeld et al., 2018). The (Santibáñez et al., 2019). In an experimental setup, Wilson
source of methane in the water column of Lake Golzovoye et al. (2012) show that multiple freeze–thaw cycles in wa-
is presumably the sediment, where high concentrations and ter from freshwater lakes reduce the total bacterial cell num-
active methane production, sulfate reduction, and anaerobic ber at least 100 000-fold. In addition, methanotrophic bac-
methane oxidation have been observed in winter 2017 (Lieb- teria are particular sensitive to freezing and thawing (Green
ner et al., 2021). and Woodford, 1992; Hoefman et al., 2012). These findings
The role of water velocity and water column mixing is not could explain the reduced activity of methanotrophic bacteria
clear, but our data suggest more methane accumulates under within the ice cores.
ice in a stagnant water body such as a lake than in a water Also, we did not detect any discoloration or other indi-
body with running water such as a river. Water column tur- cations of photosynthesis or other biological processes in
bulent diffusivity has a major influence on the methane cycle, the bottom layer of the ice cores. Thus, we conclude that
where higher turbulence potentially leads to a greater propor- the ecosystem of freshwater ice and its lower margin does
tion of methane being oxidized, and lower turbulence leads not reach the richness observed in polar sea ice (Leppäranta,
to a greater proportion being stored (Vachon et al., 2019). 2015).
5.2 Ice cores 5.3 Methane oxidation rates (MOX)
The median methane concentration of all ice cores for Lake In this study we determined the methane oxidation rate with
Golzovoye and Tiksi Bay was 9 nM, which was supersatu- tritiated methane as a tracer. The advantage of the tracer in-
rated compared to atmospheric concentrations, for which the jection method is that natural low concentrations are hardly
equilibrium concentration would be 5 nM. More details on altered, and thus we assume that our values are close to the
the ice formation in the different water bodies are given in actual rates. The fractional turnover rate k 0 was determined
Spangenberg et al. (2020). Compared to the methane con- in ice cores from the lake and Tiksi Bay and in river wa-
centrations in the water, the concentrations in the ice were ter, but not for water samples from the lake and Tiksi Bay.
1–2 orders of magnitude lower (Table 2). This means that, Within these locations k 0 was evenly distributed. However,
Biogeosciences, 18, 2047–2061, 2021 https://doi.org/10.5194/bg-18-2047-2021I. Bussmann et al.: Methane dynamics in three different Siberian water bodies 2055
k 0 may vary between different environments (river, lake, and For MOX in lakes, summer rates from small lakes
brackish water) as well as between ice cores and underly- near Research Station Samoylov Island were 36 times
ing water. The fractional turnover rate is influenced by tem- higher (median 107 nmol L−1 d−1 , n = 6) than winter rates
perature, methane, and oxygen concentrations (Steinle et al., (2.95 nmol L−1 d−1 ). Also, for yedoma lakes in Alaska, sum-
2017). Temperature was low at all locations and should not mer values of MOX were about 10 times higher than winter
have a big impact on k 0 . For methane concentrations rang- values (Martinez-Cruz et al., 2015). The amount of methane
ing from 6–800 nM, k 0 was independent from the methane oxidized during open water (10 165 nmol L−1 ) was about
concentration. Studies from Mau et al. (2017b) and Steinle et 13 times more than the amount oxidized during ice cover
al. (2017) support the fact that the k-to-methane relation does (797 nmol L−1 ).
not necessarily apply. However, it cannot be excluded that For Tiksi Bay there are also summer values of MOX
at the very high methane concentration in Lake Golzovoye available (Bussmann et al., 2017). However, with a me-
the real k 0 may have been larger. Thus, at very high methane dian summer rate of 0.419 nmol L−1 d−1 for surface river-
concentrations, our estimations of MOX would be an under- ine water, there is little difference when compared to our
estimation of the real rates and real k 0 . For all other samples, winter data (0.31 nmol L−1 d−1 , Table 2). The amount of
we suppose that the application of one k 0 to all samples is the methane oxidized during open water (40 nmol L−1 ) was
best possible assumption. about 2 times less than the amount oxidized during ice cover
Our data span 3 orders of magnitude, ranging from (84 nmol L−1 ).
0.02 nmol L−1 d−1 in the Lena River to 0.31 in Tiksi Bay There still seems to be no clear consensus on the factors
and 2.95 nmol L−1 d−1 in Lake Golzovoye. Another polar limiting MOX in winter. In several boreal lakes MOX was
study finds a MOX of 0.004–1.09 mg C m−3 d−1 (= 0.33– restricted to lakes where the phosphate concentrations were
91 nmol L−1 d−1 ) at the water–ice interface of a Swedish lake highest (Denfeld et al., 2016). Another study reports that in
(Ricão Canelhas et al., 2016). Also, Bastviken et al. (2002) winter MOX is mainly controlled by the dissolved oxygen
report a MOX of similar range (0.001–39 mg C m−3 d−1 = concentration, while in the summer it was controlled pri-
0.08–3250 nmol L−1 d−1 ). However, the methods of deter- marily by the methane concentration (Martinez-Cruz et al.,
mining MOX were quite different and more of a poten- 2015). The stratification of lakes determines the availability
tial rate. Another study in yedoma lakes in Alaska also re- of methane and oxygen for the methanotrophic bacteria and
ports higher MOX (0.03–0.28 mg methane L−1 d−1 = 1875– thus strongly influences MOX (Kankaala et al., 2006, 2007).
17 500 nmol L−1 d−1 ) with a kinetic approach to determine Temperature is also an important factor affecting winter
MOX (Martinez-Cruz et al., 2015). In marine polar waters off MOX. MOX is observed at temperatures of 2 ◦ C, mostly by
Svalbard MOX was determined with the same tracer method Methylococcaceae (Ricão Canelhas et al., 2016). A recent
and ranged from 1.6–2.2 nmol L−1 d−1 in summer (Mau et study with in situ concentrations in a northern temperate lake
al., 2017a). Thus, our data are within the very low range of re- observes a Q10 of 2.4 ± 1.4 (Thottathil et al., 2019), which
ported MOX rates in polar regions, probably due to method- is a bit lower than the Q10 of this study with 2.7 and 2.9
ological differences. for polar, fresh, and marine water, respectively. In addition,
In previous years we determined MOX in the study area there are co-correlations between temperature and methane
during summer, applying the same method as in this study. concentration. At substrate (methane) saturation, tempera-
Therefore, we can approach a seasonal comparison (winter ture has a strong influence, while under substrate-limiting
vs. summer), assuming interannual variability is negligible conditions, temperature has a minor influence (Lofton et al.,
and neglecting spring and autumn mixing. To estimate the 2014; King and Adamsen, 1992). In contrast, Thottathil et
importance of ice cover on the overall MOX, we assume al. (2019) observed a strong temperature response for MOX
an ice coverage of 270 d for Lake Golzovoye and Tiksi Bay across the entire range of ambient methane concentrations.
(Cortés and MacIntyre, 2020) and 160 d for the Lena River Measuring MOX with tritiated methane and thus at concen-
(Shiklomanov and Lammers, 2014). By multiplying the re- trations close to in situ, we can compare the Q10 from this
spective winter and summer MOX with the days of ice cover study with data from temperate environments. The Q10 for
and days of open water, we can calculate the amount of polar environments was higher than Q10 values obtained
methane oxidized during ice cover versus ice-off time. from temperate waters (the Elbe, Germany, and North Sea;
For the Lena River and permafrost lakes, we compare Bussmann et al., 2015) with 1.52 and 1.75, respectively
our winter data with summer data obtained in July 2012 (Fig. 6). Although the substrate concentration in the temper-
(Osudar et al., 2016). For the Lena River, with a me- ate waters was higher, MOX from polar regions seems to re-
dian MOX of 22.8 nmol L−1 d−1 (n = 8), the summer MOX act more sensitively to a temperature increase. One explana-
was about 3 orders of magnitude higher than in winter tion could be that the temperature optimum of psychrotoler-
(0.023 nmol L−1 d−1 ). The amount of methane oxidized dur- ant methanotrophs is below 20 ◦ C (Bale et al., 2019). Thus,
ing ice-off (4674 nmol L−1 ) was about 1270 times more than the polar methanotrophs are further away from their optimum
the amount oxidized during ice cover (4 nmol L−1 ). temperature and react with increased activity to temperature
increases while methanotrophic bacteria from temperate wa-
https://doi.org/10.5194/bg-18-2047-2021 Biogeosciences, 18, 2047–2061, 20212056 I. Bussmann et al.: Methane dynamics in three different Siberian water bodies
methane oxidation in the sediment (Liebner et al., 2021).
However, we assume that this activity is the same or less than
in summer. Ebullition does occur in winter (as shown for ice
core no. 24) and thus will lead to locally increased methane
concentrations. The methane sink and flux from the water
into the atmosphere is cut off by the ice cover; thus the only
remaining sink is MOX, which is reduced by low temperature
and other environmental factors as discussed above. During
and after ice-off, altered or weakened water column stratifi-
cation will allow a mixing of the water column. This results
in increased methane emission but also enhanced MOX as
more oxygen and nutrients will become available (Utsumi et
Figure 6. Temperature dependence (Q10 ) of the methane oxida- al., 1998). In summer increased MOX and methane flux from
tion rate at different locations; shown are the mean and standard the water lead to reduced methane concentrations in the wa-
deviation. Data for the Elbe and North Sea are from Bussmann et ter.
al. (2015), and data for the temperate lake are from Thottathil et
In the bay, we observed an accumulation of methane under
al. (2019).
ice and higher concentrations in winter. Thus, we assume that
the sinks have weakened, with a stable or reduced methane
input. Our comparison shows that MOX does not change
ters are nearer to their optimum temperature and do not react significantly between the seasons; thus the other main sink,
as sensitively. transport via water exchange of the bay with the shelf water,
Environmental conditions between winter and summer is reduced during winter because of the ice cover (Fofonova
conditions certainly differ and may also affect the popula- et al., 2014), and direct flux from open water is reduced by
tion structure of methanotrophs. Some psychrophilic strains the ice cover. There is probably still an input of methane
adapt to colder temperatures (20 ◦ C vs. 4 ◦ C) by modifying from the sediments, which results in a slight accumulation
their fatty acid composition (Bale et al., 2019), while others of methane. The ice-off in the bay will result in increased
may have only limited abilities, resulting in different popu- methane emissions and also reduced methane concentrations
lation structures. This is supported by a recent study reveal- when water circulation in the bay restarts.
ing that wintertime Arctic bacterial communities’ and food In a changing, warming Arctic, a shortened time of ice
webs’ structure change based on carbon availability (Kellogg coverage on lakes and rivers is predicted (Prowse et al., 2011;
et al., 2019). Newton and Mullan, 2020; Benson et al., 2012). This could
In this study we compared the methane inventory (concen- be −6 d per 1◦ of temperature increase (Newton and Mul-
trations) and the biological sink (methane oxidation) of three lan, 2020). Another scenario is given by Benson et al. (2012)
polar aquatic environments under summer and winter condi- with −17 d every 100 years. For the lake we observed the
tions. For a complete budget, the methane sources should be greatest difference between the ice-covered winter situation
known, as there is methane input from the sediment, by either and open water. Especially in the lake, the duration of ice
diffusion or ebullition and lateral input by groundwater, river cover is important and we assume that a shorter ice cover
flow, or water circulation in the bay. Additional sinks for the results in less high methane concentrations under ice and
systems are methane flux from the water into the atmosphere subsequently in a reduced pulse of methane emissions at
and lateral output by water circulation. In the following we ice-off. With respect to our study, this would imply a short-
apply our results on the methane cycle of the three different ened time for methane accumulation under ice and a short-
environments. ened time for the less efficient winter-MOX. For lakes this
In the river we find higher methane concentrations and would result in increased MOX during ice-off with a ratio
higher MOX in summer. The low concentrations in winter of MOXduring ice off / MOXduring ice coverage of 14 and 16 for
are probably due to low methane input from the frozen bor- the two scenarios vs. 13 for today. For rivers the same trend
ders and a reduced but still effective dilution of methane by can be assumed, with the ratio increasing from today’s 1270
the water flow (Fedorova et al., 2019). MOX is low and thus towards 1358 or 1539 for the two scenarios.
will not contribute to the removal of methane from the river. Thus, an extended time of ice-free conditions could reduce
The ice-off on the river will probably not increase methane the methane emissions from Arctic water bodies. However,
emissions, as only minor amounts are accumulated under the it has to be kept in mind that not much is known about the
ice. MOX during water column mixing in spring or autumn.
In the lake, we observed a strong accumulation of methane
in winter under ice cover. Thus, either the methane sources
are strengthened and/or the sinks have weakened. In winter
there is an active cycle of methanogenesis and (anaerobic)
Biogeosciences, 18, 2047–2061, 2021 https://doi.org/10.5194/bg-18-2047-2021I. Bussmann et al.: Methane dynamics in three different Siberian water bodies 2057
6 Conclusions Competing interests. The authors declare that they have no conflict
of interest.
Our work on an eastern Siberian lake, river, and marine bay
showed that methane accumulates under ice cover during the
winter and is consumed differently in the three water bod- Acknowledgements. This study was part of the Helmholtz program
ies. Our study was restricted to late winter and midsummer, PACES, Topic 1.3. We are thankful to the logistics department of
which represent two extremes of the annual cycle. Other pro- the Alfred Wegener Institute, particularly Waldemar Schneider. Lo-
cesses during autumn mixing, ice-on, and ice-off are not con- gistical support for the fieldwork was provided by the Russian Hy-
sidered. drographic Service (Hydrobase Tiksi).
Two main physical factors affecting the methane cycle in
the water bodies under ice cover are the water velocity and
Financial support. Matthias Winkel was supported by the
the ice cover itself. In most of our ice cores no concentra-
Helmholtz Young Investigators Group of Susanne Liebner (VH-
tion gradient between the bottom of the ice cores and the top
NG-919) and further supported by the German Ministry of
was obvious. As we could hardly detect any MOX within the Education and Research by a grant to Dirk Wagner (03G0836D).
ice cores, we assume that methane is not integrated into the We acknowledge support by the Open Access Publication Funds
ice during freeze-up. Therefore, the ice cover seems to effec- of Alfred-Wegener-Institut Helmholtz-Zentrum für Polar- und
tively prevent any methane flux from the highly accumulated Meeresforschung.
methane concentrations in the water towards the atmosphere.
In the river with running water under the ice cover, only a mi- The article processing charges for this open-access
nor accumulation of methane was observed. In the bay with a publication were covered by a Research
restricted but still present water movement, dilution or mix- Centre of the Helmholtz Association.
ing with other water bodies, allowed for a moderate accumu-
lation of methane. In the small lake, we assume a stagnant
water body with a subsequent accumulation of high amounts Review statement. This paper was edited by Zhongjun Jia and re-
viewed by two anonymous referees.
of methane.
The biotic counterpart of the observed methane accumula-
tion is microbial methane oxidation (MOX). In most cases,
MOX in summer was much higher than in winter. We ob- References
served a strong dependence of MOX on the temperature, and
Angelopoulos, M., Westermann, S., Overduin, P., Faguet,
with in situ temperatures of only 1 ◦ C in winter subsequently
A., Olenchenko, V., Grosse, G., and Grigoriev, M. N.:
low rates were observed. Higher methane concentrations in Heat and salt flow in subsea permafrost modeled with
winter indicate the methanotrophic bacteria were not limited CryoGRID2, J. Geophys. Res.-Earth, 124, 920–937,
by substrate (methane) concentrations. However, especially https://doi.org/10.1029/2018JF004823, 2019.
in Lake Golzovoye and its stagnant water body oxygen could Bale, N. J., Rijpstra, W. I. C., Sahonero-Canavesi, D. X., Oshkin,
become a limiting factor. Other factors could be nutrient lim- I. Y., Belova, S. E., Dedysh, S. N., and Sinninghe Damsté, J.
itation or shift in the population structure. S.: Fatty acid and hopanoid adaption to cold in the nethan-
A shortened time of ice coverage on the water bodies is otroph Methylovulum psychrotolerans, Front. Microbiol., 10,
predicted with increasing temperatures in the Arctic. With 589, https://doi.org/10.3389/fmicb.2019.00589, 2019.
respect to our study this would imply a shortened time for Bastviken, D., Ejlertsson, J., Sundh, I., and Tranvik, L.: Measure-
ment of methane oxidation in lakes: a comparison of methods,
methane to accumulate below the ice and a shorter time for
Environ. Sci. Technol., 36, 3354–3361, 2002.
the less efficient winter MOX. Especially for lakes, an ex-
Bastviken, D., Cole, J., Pace, M., and Tranvik, L.: Methane emis-
tended time of ice-free conditions could reduce the methane sions from lakes: Dependence of lake characteristics, two re-
flux from the Arctic water bodies. gional assessments, and a global estimate, Global Biogeochem.
Cy., 18, GB4009, https://doi.org/10.1029/2004GB002238, 2004.
Bednařík, A., Blaser, M., Matoušů, A., Tušer, M., Chaud-
Data availability. Data on methane concentration and MOX are hary, P. P., Šimek, K., and Rulík, M.: Sediment methane
available at the PANGAEA database (https://doi.pangaea.de/ dynamics along the Elbe River, Limnologica, 79, 125716,
10.1594/PANGAEA.920013 and https://doi.pangaea.de/10.1594/ https://doi.org/10.1016/j.limno.2019.125716, 2019.
PANGAEA.919986) (Bussmann et al., 2020a, b). Benson, B. J., Magnuson, J. J., Jensen, O. P., Card, V. M.,
Hodgkins, G., Korhonen, J., Livingstone, D. M., Stewart,
K. M., Weyhenmeyer, G. A., and Granin, N. G.: Extreme
Author contributions. All authors carried out fieldwork and mea- events, trends, and variability in Northern Hemisphere lake-
surements and collected samples. IB performed the methane and ice phenology (1855–2005), Climatic Change, 112, 299–323,
MOX analyses. IB, BJ, PPO, and MW contributed to the initial and https://doi.org/10.1007/s10584-011-0212-8, 2012.
final versions of the paper. Biskaborn, B. K., Subetto, D. A., Savelieva, L. A., Vakhrameeva,
P. S., Hansche, A., Herzschuh, U., Klemm, J., Heinecke,
https://doi.org/10.5194/bg-18-2047-2021 Biogeosciences, 18, 2047–2061, 20212058 I. Bussmann et al.: Methane dynamics in three different Siberian water bodies L., Pestryakova, L. A., Meyer, H., Kuhn, G., and Diek- Deshpande, B. N., MacIntyre, S., Matveev, A., and Vincent, W. F.: mann, B.: Late Quaternary vegetation and lake system dy- Oxygen dynamics in permafrost thaw lakes: Anaerobic biore- namics in north-eastern Siberia: Implications for seasonal actors in the Canadian subarctic, Limnol. Oceanogr., 60, 1656– climate variability, Quaternary Sci. Rev., 147, 406–421, 1670, https://doi.org/10.1002/lno.10126, 2015. https://doi.org/10.1016/j.quascirev.2015.08.014, 2016. Fedorova, I., Chetverova, A., Bolshiyanov, D., Makarov, A., Boike, Bussmann, I.: Distribution of methane in the Lena Delta and J., Heim, B., Morgenstern, A., Overduin, P. P., Wegner, C., Buor Khaya Bay, Russia, Biogeosciences, 10, 4641–4465, Kashina, V., Eulenburg, A., Dobrotina, E., and Sidorina, I.: https://doi.org/10.5194/bg-10-4641-2013, 2013. Lena Delta hydrology and geochemistry: long-term hydrological Bussmann, I. and Fedorova, I.: Dissolved methane concentra- data and recent field observations, Biogeosciences, 12, 345–363, tions under ice cover in the Lena Delta area, PANGAEA, https://doi.org/10.5194/bg-12-345-2015, 2015. https://doi.org/10.1594/PANGAEA.905776, 2019. Fedorova, I., Bobrov, N., Pankova, D., Konosavskii, P., and Alek- Bussmann, I., Matousu, A., Osudar, R., and Mau, S.: Assessment of seeva, N.: Modeling of thermic process of the arctic ecosys- the radio 3 H–CH4 tracer technique to measure aerobic methane tems, in: International Multidisciplinary Scientific GeoConfer- oxidation in the water column, Limnol. Oceanogr.-Meth., 13, ence Surveying Geology and Mining Ecology Management, 312–327, https://doi.org/10.1002/lom3.10027, 2015. SGEM, 30 June–6 July 2019, Albena, Bulgaria, 401–409, 2019. Bussmann, I., Hackbusch, S., Schaal, P., and Wichels, A.: Fisher, R. E., Sriskantharajah, S., Lowry, D., Lanoisellé, M., Methane distribution and oxidation around the Lena Fowler, C. M. R., James, R. H., Hermansen, O., Lund Myhre, Delta in summer 2013, Biogeosciences, 14, 4985–5002, C., Stohl, A., Greinert, J., Nisbet-Jones, P. B. R., Mienert, https://doi.org/10.5194/bg-14-4985-2017, 2017. J., and Nisbet, E. G.: Arctic methane sources: Isotopic evi- Bussmann, I. Fedorova, I., Juhls, B., Overduin, P. and Winkel, dence for atmospheric inputs, Geophys. Res. Lett., 38, L21803, M.: Dissolved methane concentrations and oxidation rates in https://doi.org/10.1029/2011gl049319, 2011. ice cores from the Lena Delta area, 2016–2018, PANGAEA, Fofonova, V., Androsov, A., Danilov, S., Janout, M., Sofina, E., https://doi.pangaea.de/10.1594/PANGAEA.920013, 2020a. and Wiltshire, K.: Semidiurnal tides in the Laptev Sea Shelf Bussmann, I. Fedorova, I., Juhls, B., Overduin, P. and Winkel, M.: zone in the summer season, Cont. Shelf Res., 73, 119–132, Dissolved methane concentrations and oxidation rates in wa- https://doi.org/10.1016/j.csr.2013.11.010, 2014. ter samples from the Lena Delta area, 2016–2018, PANGAEA, Green, P. N. and Woodford, S. K.: Preservation studies on some https://doi.pangaea.de/10.1594/PANGAEA.919986, 2020b. obligatory methanotrophic bacteria, Lett. Appl. Microbiol., 14, Charkin, A. N., Dudarev, O. V., Semiletov, I. P., Kruhmalev, A. 158–162, 1992. V., Vonk, J. E., Sánchez-García, L., Karlsson, E., and Gustafs- Günther, F., Overduin, P. P., Yakshina, I. A., Opel, T., Baranskaya, son, Ö.: Seasonal and interannual variability of sedimentation A. V., and Grigoriev, M. N.: Observing Muostakh disappear: per- and organic matter distribution in the Buor-Khaya Gulf: the mafrost thaw subsidence and erosion of a ground-ice-rich island primary recipient of input from Lena River and coastal ero- in response to arctic summer warming and sea ice reduction, The sion in the southeast Laptev Sea, Biogeosciences, 8, 2581–2594, Cryosphere, 9, 151–178, https://doi.org/10.5194/tc-9-151-2015, https://doi.org/10.5194/bg-8-2581-2011, 2011. 2015. Cole, J. J., Prairie, Y. T., Caraco, N. F., McDowell, W. H., Tranvik, Gurevich, E. V.: Influence of air temperature on the river runoff in L. J., and Striegl, R. G.: Plumbing the global carbon cycle: Inte- winter (the Aldan river catchment study), Russ. Meteorol. Hy- grating inland waters into the terrestrial carbon budget, Ecosys- drol., 34, 628–633, 2009. tems, 10, 172–185, https://doi.org/10.1007/s10021-006-9013-8, Hoefman, S., Van Hoorde, K., Boon, N., Vandamme, P., 2007. De Vos, P., and Heylen, K.: Survival orrevival: Long-term Cortés, A. and MacIntyre, S.: Mixing processes in small arc- preservation induces a reversible viable but non-culturable tic lakes during spring, Limnol. Oceanogr., 65, 260–288, state in methane-oxidizing bacteria, PLoS ONE, 7, e34196, https://doi.org/10.1002/lno.11296, 2020. https://doi.org/10.1371/journal.pone.0034196, 2012. Cunada, C. L., Lesack, L. F. W., and Tank, S. E.: Seasonal dynamics Holmes, R. M., McClelland, J. W., Peterson, B. J., Tank, S. E., Bu- of dissolved methane in lakes of the Mackenzie Delta and the lygina, E., Eglinton, T. I., Gordeev, V. V., Gurtovaya, T. Y., Ray- role of carbon substrate quality, J. Geophys. Res.-Biogeo., 123, mond, P. A., and Repeta, D. J.: Seasonal and annual fluxes of nu- 591–609, https://doi.org/10.1002/2017JG004047, 2018. trients and organic matter from large rivers to the Arctic Ocean DelSontro, T., McGinnis, D. F., Wehrli, B., and Ostrovsky, I.: Size and surrounding seas, Estuar. Coast., 35, 369–382, 2012. does matter: Importance of large bubbles and small-scale hot Holmes, R. M., Coe, M. T., Fiske, G. J., Gurtovaya, T., McClel- spots for methane transport, Environ. Sci. Technol., 49, 1268– land, J. W., Shiklomanov, A. I., Spencer, R. G. M., Tank, S. 1276, https://doi.org/10.1021/es5054286, 2015. E., and Zhulidov, A. V.: Climate change impacts on the hydrol- Denfeld, B. A., Ricão Canelhas, M., Weyhenmeyer, G. A., Bertils- ogy and biogeochemistry of Arctic Rivers, in: Global Impacts of son, S., Eiler, A., and Bastviken, D.: Constraints on methane Climate Change on Inland Waters, edited by: Goldman, C. Ku- oxidation in ice-covered boreal lakes, J. Geophys. Res.-Biogeo., magai, M., and Robarts, R. D., Wiley, ISBN 9781118470596, 121, 1924–1933, https://doi.org/10.1002/2016JG003382, 2016. https://doi.org/10.1002/9781118470596, 2013. Denfeld, B. A., Klaus, M., Laudon, H., Sponseller, R. Janout, M. A., Hölemann, J., Laukert, G., Smirnov, A., Krumpen, A., and Karlsson, J.: Carbon dioxide and methane dy- T., Bauch, D., and Timokhov, L.: On the variability of stratifica- namics in a small boreallake during winter and spring tion in the freshwater-influenced Laptev Sea Region, Front. Mar. melt events, J. Geophys. Res.-Biogeo., 123, 2527–2540, Sci., 7, 543489, https://doi.org/10.3389/fmars.2020.543489, https://doi.org/10.1029/2018JG004622, 2018. 2020. Biogeosciences, 18, 2047–2061, 2021 https://doi.org/10.5194/bg-18-2047-2021
You can also read


