Warming and ocean acidification may decrease estuarine dissolved organic carbon export to the ocean - Biogeosciences
←
→
Page content transcription
If your browser does not render page correctly, please read the page content below
Biogeosciences, 18, 1823–1838, 2021
https://doi.org/10.5194/bg-18-1823-2021
© Author(s) 2021. This work is distributed under
the Creative Commons Attribution 4.0 License.

Warming and ocean acidification may decrease estuarine dissolved
organic carbon export to the ocean
Michelle N. Simone, Kai G. Schulz, Joanne M. Oakes, and Bradley D. Eyre
Centre for Coastal Biogeochemistry, Faculty of Science and Engineering, Southern Cross University, Lismore,
NSW, 2480, Australia

Correspondence: Michelle N. Simone (mnhsimone@gmail.com)

Received: 9 September 2020 – Discussion started: 29 September 2020
Revised: 18 January 2021 – Accepted: 19 January 2021 – Published: 16 March 2021

Abstract. Relative to their surface area, estuaries make a dis-   DOC in long-term carbon storage in the ocean has been a
proportionately large contribution of dissolved organic car-      focus of research for decades (Siegenthaler and Sarmiento,
bon (DOC) to the global carbon cycle, but it is unknown how       1993; Hansell et al., 2009; Bauer and Bianchi, 2011; Wag-
this will change under a future climate. As such, the response    ner et al., 2020), with DOC reaching the ocean interior be-
of DOC fluxes from microbially dominated unvegetated sed-         ing effectively stored for millennia (Hansell et al., 2009).
iments to individual and combined future climate stressors of     Although phytoplankton in the surface ocean are the main
temperature change (from 1−3 to 1+5 ◦ C compared to am-           source of DOC globally, with an estimated production of
bient mean temperatures) and ocean acidification (OA, ∼ 2×        around 50 Pg C yr−1 , only 0.3 % of the DOC they produce
current CO2 partial pressure, pCO2 ) was investigated ex situ.    reaches the ocean interior (Hansell et al., 2009). Most of the
Warming alone increased sediment heterotrophy, resulting          DOC produced by phytoplankton is rapidly remineralized in
in a proportional increase in sediment DOC uptake; sedi-          the water column by heterotrophic bacteria (Azam, 1998).
ments became net sinks of DOC (3.5 to 8.8 mmol C m−2 d−1 )        Only more recently has the coastal zone been considered a
at warmer temperatures (1+3 and 1+5 ◦ C, respectively).           major source of DOC export to the open ocean and deep sea
This temperature response changed under OA conditions,            (Duarte et al., 2005; Maher and Eyre, 2010; Krause-Jensen
with sediments becoming more autotrophic and a greater sink       and Duarte, 2016). The shallow coastal zone accounts for
of DOC (up to 4× greater than under current pCO2 con-             1 to 10 % of global net primary production (NPP) (Duarte
ditions). This response was attributed to the stimulation of      and Cebrián, 1996), with up to 33 % of the associated DOC
heterotrophic bacteria with the autochthonous production of       exported offshore and stored in the ocean interior (Krause-
labile organic matter by microphytobenthos. Extrapolating         Jensen and Duarte, 2016).
these results to the global area of unvegetated subtidal es-         Although shallow estuaries and fringing wetlands make
tuarine sediments, we find that the future climate of warming     up only ∼ 22 % of the world’s coastal area (Costanza et al.,
(1+3 ◦ C) and OA may decrease estuarine export of DOC             1997) and 8.5 % of the total marine area (Costanza et al.,
by ∼ 80 % (∼ 150 Tg C yr−1 ) and have a disproportionately        1997), they are quantitatively significant in terms of DOC
large impact on the global DOC budget.                            processing and offshore transport (Smith and Hollibaugh,
                                                                  1993). In 1998, Bauer and Druffel used radioisotopic car-
                                                                  bon (14 C) to identify the source and age of DOC and par-
                                                                  ticulate organic carbon inputs into the open ocean interior.
1   Introduction                                                  They found that ocean margins accounted for greater organic
                                                                  carbon inputs into the ocean interior than the surface ocean
The aquatic dissolved organic carbon (DOC) pool is one            by more than an order of magnitude. Assuming one-third of
of the largest pools of organic carbon on earth (Hedges,          the DOC produced in the coastal zone (100–1900 Tg C yr−1 ;
1987), roughly equivalent in size to the atmospheric CO2          Duarte, 2017) is subducted and reaches the ocean inte-
reservoir (Siegenthaler and Sarmiento, 1993). The role of

Published by Copernicus Publications on behalf of the European Geosciences Union.
1824 M. N. Simone et al.: Warming and OA may decrease DOC export rior (Krause-Jensen and Duarte, 2016), 30 to 630 Tg C yr−1 , Primary producers fix dissolved inorganic carbon (DIC) or up to 3.5× more DOC, could reach the ocean interior during photosynthesis and release DOC directly through ex- from coastal areas than from the open ocean (180 Tg C yr−1 , udation and/or indirectly when they are grazed upon. Pho- Hansell et al., 2009). This is despite coastal areas having a tosynthetically produced DOC is the main source of DOC DOC production rate only 0.2 to 3.9 % of that of the open in the ocean (Hansell et al., 2009) and fuels local microbial ocean (Duarte, 2017). As such, small changes to the coastal mineralization (Azam, 1998). Heterotrophic bacteria within production and export of DOC may have a disproportionate estuarine sediments respire the carbon from DOC as CO2 , influence on the global DOC budget. which can then be recaptured by photoautotrophs (Rieken- Euphotic estuarine sediments occupy the coastal boundary berg et al., 2018), closing the microbial loop (Azam, 1998). between terrestrial and marine ecosystems. Microalgal com- DOC or DIC that is not captured is ultimately effluxed to munities (microphytobenthos, or MPBs) are ubiquitous in the overlying water column and may be transported from these sediments, occupying ∼ 40 to 48 % of the coastal sur- estuaries to the coastal ocean. Individually, increased tem- face area (Gattuso et al., 2020) and generating up to 50 % of perature and CO2 have been reported to enhance primary total estuarine primary productivity (Heip et al., 1995; Mac- productivity and DOC production in Arctic (Czerny et al., Intyre et al., 1996; Underwood and Kromkamp, 1999). MPBs 2013) and temperate phytoplankton communities (Wohlers exude some of the carbon they fix as extracellular substances, et al., 2009; Engel et al., 2011; Liu et al., 2017; Novak et including carbohydrates (Oakes et al., 2010), and can there- al., 2018; Taucher et al., 2012), and in temperate stream sed- fore be a source of relatively labile DOC in net-autotrophic iments (Duan and Kaushal, 2013). However, one study in a sediments (Cook et al., 2004; Oakes and Eyre, 2014; Ma- temperate fjord reported no enhancement of DOC production her and Eyre, 2010). The dominant sink of DOC in estuar- despite CO2 -enhanced phytoplankton productivity (Schulz et ine sediments, however, is uptake by heterotrophic bacteria al., 2017). This uncertainty of the response to individual cli- (Azam, 1998). These heterotrophic bacteria not only con- mate stressors is exacerbated when considering how the com- sume autochthonous DOC from upstream (Boto et al., 1989), bination of OA and warming will affect DOC processing. To but their biomass is influenced by the lability of sediment or- date, only one study has considered this combined stressor ganic matter (OM) (Hardison et al., 2013), which can be al- effect on DOC (Sett et al., 2018), observing no difference tered by MPB production (Hardison et al., 2013; Cook et al., in DOC production by temperate phytoplankton relative to 2007). Estuarine sediments are therefore a potentially impor- current conditions under the combined stressors (Sett et al., tant sink for DOC. 2018). Unvegetated estuarine sediments can affect the quantity To understand the potential effect of future climate on and quality of DOC input to the ocean by (1) acting as DOC fluxes, it is essential that both individual and combined a source of autochthonous DOC, through MPB production effects of OA and warming are considered. Here we focus on (Duarte, 2017; Krause-Jensen and Duarte, 2016; Maher and changes in DOC fluxes in unvegetated estuarine sediments, Eyre, 2010), or (2) modifying allochthonous and terrigenous as these systems have the potential for significant uptake of DOC inputs (Fichot and Benner, 2014). Through efficient DOC that is currently exported to the coastal ocean. In this mineralization of DOC (Opsahl and Benner, 1997), estuaries study, benthic DOC responses in unvegetated estuarine sedi- can act as a sink for DOC and a source of CO2 to the ocean ments were investigated over an 8 ◦ C temperature range un- (Frankignoulle et al., 1998; Fichot and Benner, 2014; Sand- der both current and projected future high-pCO2 conditions berg et al., 2004). Given the disproportionate contribution of in an ex situ laboratory incubation. estuaries to the export of DOC to offshore marine ecosys- We expected that warming would promote a stronger het- tems, relative to their surface area, it is important to under- erotrophic than autotrophic microbial response in shallow stand how this balance of DOC sources and sinks within euphotic sediments (Patching and Rose, 1970; Vázquez- estuaries may change with future shifts in climate, particu- Domínguez et al., 2012; Yang et al., 2016) and, as such, larly expected increases in temperature and ocean acidifica- there would likely be more DOC remineralization (Lønborg tion (OA) associated with elevated atmospheric CO2 concen- et al., 2018) than “new” DOC production by photoautotrophs trations. (Wohlers et al., 2009; Engel et al., 2011; Novak et al., 2018). Climate projection models assuming a high-emission sce- Moreover, despite the potential stimulation of primary pro- nario suggest that atmospheric CO2 concentrations could ductivity in unvegetated muddy sediments by OA (Vopel et more than double by the end of the century, increasing al., 2018), or more likely high pCO2 , and potential enhance- the partial pressure of CO2 (pCO2 ) in surface waters to ment of DOC production (Engel et al., 2013; Liu et al., 2017), 1000 µatm and decreasing pH by 0.3 units, together termed this increase in labile DOC may promote bacterial produc- OA (RCP8.5; IPCC, 2019). There is also expected to be tivity and DOC mineralization (Hardison et al., 2013). In ad- an increase in mean surface ocean temperature by 2–4 ◦ C dition, increased DOC availability alone may increase het- (RCP8.5; IPCC, 2019) and increased frequency of unsea- erotrophic bacterial biomass production and activity (Engel sonably warm days (Morak et al., 2013; Fischer and Knutti, et al., 2013). We therefore predicted that increases in DOC 2015). production from OA alone or in combination with warming Biogeosciences, 18, 1823–1838, 2021 https://doi.org/10.5194/bg-18-1823-2021
M. N. Simone et al.: Warming and OA may decrease DOC export 1825
may be counteracted by increased consumer activity, poten- repeated back to back. The incubation in the first week (9–
tially diminishing the available DOC pool under future cli- 12 January 2018) had cores in the four temperature tanks
mate conditions. subjected to high pCO2 (∼ 1000 µatm), achieved with a
CO2 -enriched airstream (initially adjusted and set when at-
tached to a LICOR LI-7000) bubbled into tank water via air-
2 Methods stones and air pumps. The incubation in the second week
(16–20 January 2018) maintained current pCO2 conditions
2.1 Study site (∼ 450 µatm) by circulating ambient laboratory air through
the tank water via airstones and air pumps. An additional
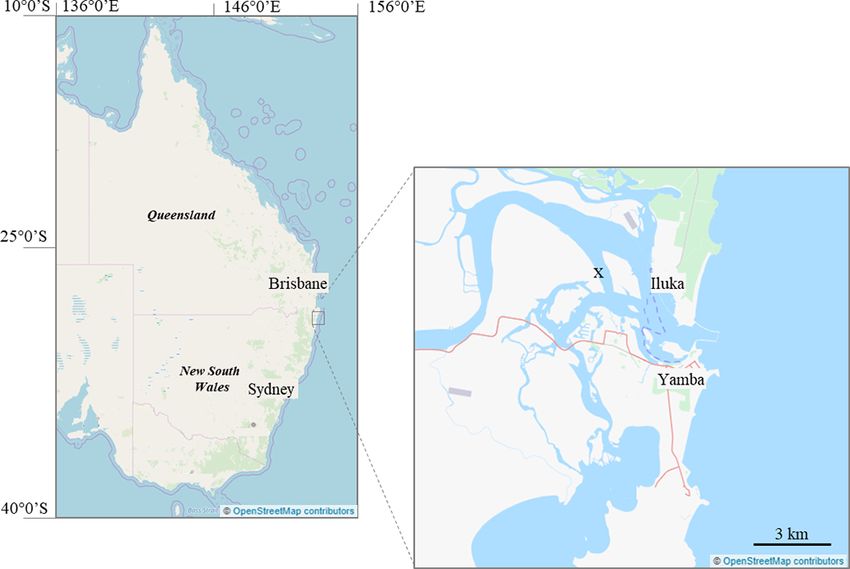
A subtidal site (∼ 1.5 m below mean sea level) in the sub-
tank was included in week 1 alongside the high-pCO2 in-
tropical Clarence River estuary, Australia, was used for this
cubation. This tank was a control tank equivalent to the con-
study (29◦ 24.210 S, 153◦ 19.440 E; Fig. 1). Sediment at the
trol tank present week 2, allowing for comparison of the two
site was unvegetated and characterized as euphotic cohe-
separate incubations (see Table 1 for details). The tempera-
sive sandy mud (31–36 % of grains within 250–500 µm, 61–
ture and pCO2 manipulations were within 12 and 4 %, re-
65 % within 63–250 µm, and ∼ 2 % < 63 µm; Lewis and Mc-
spectively, of their in situ ranges (see Sect. 2.1) to reduce any
Conchie, 1994). Temperature ±0.3 ◦ C, pH ± 0.5 units, and
potential shock effect for the sediment community.
salinity (± < 1 %) were measured over 24 h using a Hydrolab
Water columns within cores were stirred at ∼ 60 rpm
HL7 submerged at the site. The tidal cycle introduced a salin-
throughout the incubations via magnetic stir bars (∼ 5 cm
ity range of 10–35, pH range of 7.92–8.15 units (min–max),
above sediment surface) interacting with an external rotat-
and mean daily temperature of 23.9 ± 1.6 ◦ C (20–25 ◦ C). The
ing magnet, ensuring water columns were well mixed whilst
surface sediments (0–2 cm) had a porosity of 0.43 and an or-
avoiding sediment disturbance (Ferguson et al., 2003, 2004).
ganic matter content of ∼ 3.5 % (of dry weight), determined
High-pressure sodium lamps (400 W; Philips Son-T Argo
from mass loss after combustion (490 ◦ C) of dried sediment
400) were used to simulate mean daytime field conditions,
(60 ◦ C) (Luczak et al., 1997). The Clarence River estuary has
providing ∼ 270–280 µmol quanta m−2 s−1 of photosyntheti-
low nutrient loading (Eyre and Pont, 2003) with dissolved in-
cally active radiation at the water surface of the tanks. Lamps
organic nitrogen (DIN) concentrations < 2 µM (Eyre, 2000).
were turned on in the mornings in line with natural diel light
This is consistent with concentrations determined at the time
cycling, following a similar in situ ∼ 12 h dark–12 h light cy-
of this study (∼ 0.9–1.9 µM DIN, Supplement Sect. S4).
cle. Cores were pre-incubated at treatment conditions for 36–
2.2 Core collection 48 h, before solute-flux incubations. This pre-incubation pe-
riod would be sufficient for three to six generations of the
Sediment (∼ 20 cm depth) was collected and capped in dominant microbial members of unvegetated estuarine sedi-
acrylic cores (9 cm diameter × 47 cm length) allowing for ments, diatoms, and cyanobacteria (Mori et al., 1996; Greene
∼ 1.8 L of overlying water on 9 and 16 January 2018 (15 and et al., 1992), allowing time for the microbial community to
12 cores, respectively). Thalassinidean shrimp, Trypaea aus- acclimatize to the new treatment conditions.
traliensis, burrows were avoided and therefore excluded from
the collected cores as their occasional inclusion would result 2.3.1 Solute-flux incubation
in considerable variability in sediment processes (Webb and
Eyre, 2004) that would mask potential treatment effects. To Immediately after pre-incubation, cores were capped for a
ensure sediments were subtidal, cores were collected during 20 h (10 h dark, 10 h light) solute-flux incubation to mea-
low tide. Immediately after core collection, ∼ 700 L of site sure rates of O2 , DIC, and DOC production and consump-
water was also collected to fill a laboratory incubation setup. tion over a diel cycle. To adhere to natural diel cycling, cores
were capped at dusk to start the incubation on a dark cycle.
2.3 Incubation setup Samples were collected from three cores per tank at each of
three time points in the diel cycle (dark start (dusk), dark
Within 6 h of core collection, all cores were in the laboratory, end and light start (dawn), and light end (dusk)). Water was
submerged and uncapped in site water. The cores were placed collected and syringe-filtered to determine concentrations of
in one of four temperature tanks – control (23 ◦ C), 1 − 3 ◦ C DIC (0.45 µm Minisart filter, 100 mL serum bottle; without
(20 ◦ C), 1 + 3 ◦ C (25 ◦ C), and 1 + 5 ◦ C (28 ◦ C) – filled with headspace, poisoned with 50 µL of saturated HgCl2 , stored
∼ 80 L of site water, with temperatures maintained and mon- at room temperature) and DOC (GF/F filter, 40 mL glass vial
itored via thermo-regulating aquarium pumps. Each tank had with silicon septum; without headspace, poisoned with 20 µL
three cores (n = 3). of HgCl2 , injected with 200 µL of 85 % H3 PO4 , stored at
The ex situ study design allowed control of tempera- room temperature). As water was removed for sampling, it
ture, pCO2 , and light that would be difficult to achieve was replaced with gravity-fed water maintained in a collapsi-
in situ. Due to limited space, this investigation was con- ble bag under the same atmospheric conditions and temper-
ducted over 2 weeks with two complementary incubations ature. After all cores were sampled, dissolved oxygen (DO)
https://doi.org/10.5194/bg-18-1823-2021 Biogeosciences, 18, 1823–1838, 20211826 M. N. Simone et al.: Warming and OA may decrease DOC export
Figure 1. Study location (x; 29◦ 24.210 S, 153◦ 19.440 E) marked on a map of Yamba, NSW, embedded in an east coast map of Australia.
© OpenStreetMap contributors 2020. Distributed under a Creative Commons BY-SA License.
Table 1. Start conditions for incubations at current and high pCO2 levels (∗ ) showing mean (±SD) of various carbonate parameters. CON∗ is
the overlapping control core present in the high-pCO2 incubation week.
Scenario Sal T pH pCO2 HCO−
3 CO2−
3 TA DIC
(‰) (◦ C) (free scale) (µatm) (µmol kgSW−1 ) (µmol kgSW−1 ) (µmol kgSW−1 ) (µmol kgSW−1 )
1−3 ◦ C 24.4 21.0 8.08 453.1 1750.8 123.9 2048.7 1889.8
(±0.1) (±0.02) (±24.0) (±2.9) (±6.4) (±12.6) (±3.3)
∗ 17.7 20.8 7.60 989.8 1232.9 24.28 1293.8 1291.6
(±0.1) (±0.02) (±40.7) (±2.6) (±0.9) (±2.8) (±2.9)
Control 24.4 23.1 8.07 469.9 1744.7 130.2 2056.9 1889.6
(±0.0) (±0.02) (±27.2) (±4.1) (±6.9) (±12.1) (±2.0)
∗ 17.7 23.2 7.63 995.9 1281.6 29.5 1354.7 1343.4
(±0.1) (±0.06) (±146.6) (±5.5) (±4.3) (±12.7) (±6.1)
1+3 ◦ C 24.4 25.6 8.08 471.5 1723.5 136.9 2051.6 1874.5
(±0.5) (±0.01) (±13.3) (±2.0) (±3.4) (±6.2) (±1.5)
∗ 17.7 25.8 7.64 1011.1 1265.8 32.7 1346.7 1329.2
(±0.2) (±0.12) (±248.6) (±2.7) (±9.3) (±23.6) (±3.4)
1+5 ◦ C 24.4 27.1 8.11 445.2 1698.3 155.3 2069.3 1866.1
(±0.1) (±0.05) (±56.2) (±22.7) (±17.0) (±17.6) (±7.4)
∗ 17.7 27.9 7.65 989.6 1254.4 34.3 1339.2 1317.1
(±0.1) (±0.12) (±40.7) (±5.2) (±1.3) (±3.8) (±5.2)
CON∗ 17.7 23.3 7.96 431.9 1193.0 58.4 1338.2 1265.5
(±0.1) (±0.05) (±45.7) (±4.1) (±6.1) (±10.9) (±1.1)
Biogeosciences, 18, 1823–1838, 2021 https://doi.org/10.5194/bg-18-1823-2021M. N. Simone et al.: Warming and OA may decrease DOC export 1827
concentrations, temperature, and pH were measured using a Gross primary productivity (GPP, µmol O2 m−2 h−1 ) was
high-precision Hach HQ40d multiprobe meter with an LDO calculated using NPP and R, as follows:
probe and pH probe, calibrated to 3-point NIST buffer scale
GPP = −R + NPP. (2)
(R 2 = 0.99). Probes were inserted into a resealable port fit-
ted in each lid, ensuring no incubation water exchanged with The production-to-respiration ratio (P / R) was calculated
tank water. After the dawn sampling, lamps were switched using GPP and R scaled for a 12 h light–12 h dark diel cy-
on. cle (Eyre et al., 2011).
DIC concentrations were determined with an AIRICA sys- (GPP) × 12 h
tem (MARIANDA, Kiel, Germany) via infrared absorption P /R = (3)
(−R × 24 h)
using a LICOR LI-7000 and corrected for accuracy against
Finally, net fluxes for DIC and DOC were calculated from
certified reference material, batch no. 171 (Dickson, 2010).
the dark and light fluxes from Eq. (1) and presented as
Measurements on four analytical replicates of 1.5 mL sam-
mmol C m−2 d−1 for a 12 h light–12 h dark diel cycle.
ple volume were used to calculate DIC concentration as the
mean of the last three out of four measurements (typical Net flux = ((dark flux × 12 h) + (light flux × 12 h))/1000 (4)
overall uncertainty, < 1.5 µmol kg−1 ). DIC and pH measure- Temperature sensitivity coefficients (Q10 values) were used
ments were then used to calculate the remaining carbonate to evaluate the temperature dependence of metabolic rates on
chemistry parameters (Table 1) using CO2 SYS (Pierrot et temperature increases of 10 ◦ C. This was expressed simply as
al., 2006). Total borate concentrations (Uppström, 1974) and an exponential function:
boric acid (Dickson, 1990) and stoichiometric equilibrium 10 ◦ C/(Topt −T1 )
constants for carbonic acid from Mehrbach et al. (1973), as R2
Q10 = , (5)
refit by Dickson and Millero (1987), were used. Comparison R1
of pH (free scale) measured with a Hach HQ40d multiprobe where R1 and R2 are the R, NPP, or GPP rates measured at
meter and pH calculated from measured total alkalinity and temperatures of 20 ◦ C (T1 ) and optimal temperatures (Topt ),
DIC (Table S1) indicated an uncertainty for potentiometric where rates are highest, respectively.
pH measurements of ±0.05 pH units. Propagating the uncer-
tainty in pH measurements with the uncertainty of DIC mea- 2.4.1 Scaling rates
surements translates to a pCO2 uncertainty of ± ∼ 110 and
∼ 56 µatm under high-pCO2 and current conditions, respec- Rates in the overlapping control cores each week were
tively. This uncertainty is well within the treatment variabil- checked to ensure comparability between incubations. If
ity measured among cores (Table 1) and is therefore consid- means (±SD) were significantly different (did not overlap),
ered unlikely to have contributed substantially to differences rates from individual treatment cores were scaled to the over-
in treatment response. DOC concentrations were measured all mean control rate of both weeks (n = 6). This was done by
via continuous-flow wet oxidation using an Aurora 1030 W calculating the relative proportion of treatment rates (tProp.,
total organic carbon analyser (Oakes et al., 2011) (uncer- µmol N m−2 h−1 ) to the control rates present in its week
tainty of ∼ 3 %). (Eq. 6),
tRate
2.4 Data analysis tProp. = , (6)
control
where tRate is the individual core rate, and control is the
The dissolved oxygen and DIC measurements were used
mean rate of control cores present during the incubation
to estimate benthic microalgal production inside the cores.
(n = 3). This proportional rate was then multiplied by the
Net primary production and respiration (NPP and R,
overall control mean rates (averaged across both weeks,
µmol O2 m−2 h−1 ) were defined as the light and dark cy-
n = 6) to scale individual core rates and calculate compara-
cle oxygen evolution, respectively, where DIC and DOC
ble treatment means (n = 3) across incubations (see Sect. 3.1
light and dark fluxes (µmol C m−2 h−1 ) were defined using
for details on scaled rates).
the evolution of DIC and DOC concentrations, respectively.
Fluxes (NPP, R, DIC, or DOC) were calculated as 2.5 Statistical analysis
(end − start) × V Homogeneity of variances (Levene’s test) was tested be-
flux = , (1)
(T × A) fore analysis to minimize the potential for type I error. All
tests were run in MATLAB (Mathworks, 2011) with signif-
where end and start are the dissolved oxygen, inorganic icance defined at a maximum alpha of < 0.05. Where Lev-
carbon, or organic carbon concentrations (µmol O2 L−1 or ene’s test returned a significant result, either datasets were
µmol C L−1 ) at the end and start of the light or dark cycle, log-transformed or else, if negative values were present, an
V is the water column volume (L), T is hours of incubation, alpha of 0.01 was used for the subsequent analyses of vari-
and A is surface area of the core. ance (ANOVAs).
https://doi.org/10.5194/bg-18-1823-2021 Biogeosciences, 18, 1823–1838, 20211828 M. N. Simone et al.: Warming and OA may decrease DOC export
2.5.1 Net variability with temperature and CO2 3.2 Productivity and respiration responses to OA
Net fluxes were compared among treatments to identify the High-pCO2 conditions alone (at mean ambient temperatures,
individual and combined effects of temperature and pCO2 23 ◦ C) significantly increased P / R by ∼ 20 % over con-
on O2 , DIC, and DOC fluxes. To investigate the effect of trol ratios (one-way interaction: F3,4 = 101.9, p = 0.0005;
increased pCO2 alone, data from control temperature cores Fig. 2d). This was a result of significant increases in NPP
at both current and high pCO2 levels (n = 2) were com- (∼ 42 %) compared to control conditions (one-way inter-
pared using a one-way ANOVA. A two-way ANOVA on each action: F3,4 = 241.4, p < 0.0005; Fig. 2b), in concert with
dataset identified whether there were interacting effects on no significant change in R (one-way interaction: F3,4 = 4.5,
O2 , DIC, and DOC fluxes of temperature (n = 4) and pCO2 p = 0.10; Fig. 2a). Insignificant increases of DIC uptake
(n = 2). Finally, one-way ANOVAs were also run for each in the light reflected the significant increases in NPP un-
pCO2 level to investigate differences in sediment responses der high-pCO2 conditions at ambient temperature (one-way
across temperatures (n = 4). Post hoc Tukey’s tests were then interaction: F3,4 = 5.9, p = 0.07; Fig. 3c). Like R, DIC in
used to determine which temperatures had similar or differ- the dark did not change with pCO2 (one-way interaction:
ent responses. F3,4 = 1.3, p = 0.33; Fig. 3b). GPP also significantly in-
creased under high-pCO2 conditions at ambient tempera-
2.5.2 Diel variability with temperature for DIC and tures (one-way interaction: F3,4 = 65.3, p = 0.001; Fig. 2c),
DOC fluxes with net DIC significantly shifting from a slight efflux to a
slight influx (one-way interaction: F3,4 = 24.3, p = 0.008;
Differences between dark and light cycles were compared
Fig. 3a).
to further investigate changes observed in DIC and DOC
net variability. Similar analyses to those described above
3.3 Productivity and respiration responses to
were applied. To examine differences among temperatures
temperature and OA
(n = 4), light condition (n = 2), and whether light condition
significantly interacted with temperature response, two-way
Temperature had a strong effect on R, NPP, GPP, and P / R,
ANOVAs were applied to current- and high-pCO2 cores,
whereas only light cycle NPP and, in turn, GPP and P / R
separately. Following this, each light condition was further
were affected by OA.
investigated to consider the individual temperature responses
The response of R to temperature was similar at both
in the light and dark separately using one-way ANOVAs and
current and high pCO2 levels (no two-way interaction:
post hoc Tukey’s tests.
F3,16 = 0.77, p = 0.53; Fig. 2a), and it was not affected
by pCO2 (CO2 effect, two-way interaction: F1,16 = 0.99,
3 Results p = 0.34; Fig. 2a). Accordingly, Q10 values for R were sim-
ilar for current (1.66) and high-pCO2 (1.69) conditions (Ta-
3.1 Overlapping control scaling ble 2). R changed significantly across the 8 ◦ C temperature
range, increasing by ∼ 11 and ∼ 29 % in higher-temperature
Mean rates calculated from overlapping control cores present cores (1 + 3 and 1+5 ◦ C, respectively) and decreasing by
in each week were compared to establish whether the two ∼ 16 % in 1−3 ◦ C cores (temperature effect, two-way inter-
sets of incubations were directly comparable, and whether action: F3,16 = 36.93, p < 0.0001; Fig. 2a).
changes attributed to high pCO2 levels were truly due to Sediment NPP was significantly affected by the inter-
that treatment, not just a temporal shift in how the sediments action of pCO2 and temperature (two-way interaction:
were behaving. The P / R ratios were similar for incubations F3,16 = 8.92, p = 0.001; Fig. 2b). Under current pCO2 con-
(0.84 ± 0.01 and 0.83 ± 0.04, Table S2); however, the magni- ditions, NPP decreased significantly with increased tem-
tude of the R and NPP fluxes was ∼ 23 % greater for control perature (one-way interaction: F3,8 = 41.94, p < 0.0001;
cores in the high-pCO2 week (Table S2; discussed in Sect. Fig. 2b), shifting from net autotrophy in the light in low-
4.0). As such, R and NPP rates of cores were scaled to mean and control temperature cores (efflux of 590 ± 121 and
control rates (n = 6) using the proportional rate difference 613 ± 10 µmol O2 m−2 h−1 , respectively) to net heterotro-
calculated between the treatments and the individual controls phy in higher-temperature cores (influx of 163 ± 228 and
present in the respective weeks (n = 3) (Eq. 6). Scaled rates 390 ± 97 µmol O2 m−2 h−1 for 1+3 and 1+5 ◦ C, respec-
were within ±13 % of actual rates. There were no significant tively). Warming alone therefore resulted in a reduction in
differences between controls for light or dark production of NPP by 126 % at 1+3 ◦ C and 164 % at 1+5 ◦ C, com-
DIC or DOC. pared to the control (Fig. 2a). OA in general significantly in-
creased NPP rates over those measured under current pCO2
conditions (CO2 effect, two-way interaction: F1,16 = 21.92,
p = 0.0003; Fig. 2b), and Q10 of NPP increased from 1.13
to 1.92 when OA was present (Table 2). As such, under
Biogeosciences, 18, 1823–1838, 2021 https://doi.org/10.5194/bg-18-1823-2021M. N. Simone et al.: Warming and OA may decrease DOC export 1829
Figure 2. Effect of temperature on rates of (a) respiration (R, µmol O2 m−2 h−1 ), (b) net primary production (NPP, µmol O2 m−2 h−1 ),
(c) gross primary production (GPP, µmol O2 m−2 h−1 ), and (d) P / R under current (open boxes) and high-pCO2 conditions (hatched boxes).
Panels show mean values “×” at three temperature offsets from control (CON = 23◦ C). Middle horizontal line in each box is the exclusive
median, with the start of the upper and lower quartiles represented by the top and bottom edges of the box, respectively. Letters identify
significantly different means across temperatures under current pCO2 conditions, and numerals identify significantly different means across
temperatures under high-pCO2 conditions, where letters or numerals that are the same indicate no significant difference, as determined by
post hoc Tukey’s test. Solid and dashed horizontal lines identify significant effects of OA and temperature, respectively, where double solid
and dashed lines identify significant interaction of temperature and OA (two-way ANOVA). Levels of significance are denoted with “∗ ” for
0.05, “∗∗ ” for 0.01, and “∗∗∗ ” for 0.001. Data in Tables S3 and S4.
Table 2. Q10 and Topt values for current and high-pCO2 climates. atures (CO2 effect, two-way interaction: F1,16 = 24.77,
p = 0.0001; Fig. 2c), resulting in a stronger temperature sen-
R NPP GPP sitivity in GPP under high-pCO2 conditions (one-way inter-
Current High Current High Current High action: F3,8 = 40.90, p < 0.0001; Fig. 2c) than under current
pCO2 conditions (p = 0.001). This increased sensitivity of
Q10 1.66 1.69 1.13 1.92 1.46 2.27
GPP to temperature was supported by GPP Q10 value differ-
Topt (◦ C) 28 28 23 23 23 23
ences between current and high-pCO2 conditions, increasing
from 1.46 to 2.27 (Table 2).
The differences in P / R among treatments further high-
lighted significant interaction of temperature and pCO2
high-pCO2 conditions NPP maintained net autotrophy in
(two-way interaction: F3,16 = 5.86, p = 0.007; Fig. 2d), sug-
the light at 1+3 ◦ C and only resulted in net heterotrophy
gesting the effect of pCO2 on primary productivity was
in the highest-temperature treatment (one-way interaction:
strong enough to alter the overall productivity of the sedi-
F3,8 = 53.01, p < 0.0001; Fig. 2b).
ments. Under current pCO2 conditions, P / R reflected GPP
GPP displayed a similar interactive stressor response to
with a clear separation between control and 1−3 ◦ C sedi-
that described for NPP (two-way interaction: F3,16 = 9.39,
ments having a higher P / R (0.84 ± 0.01 and 0.89 ± 0.07,
p = 0.0008; Fig. 2c). Under current pCO2 conditions, GPP
respectively) than the significantly lower ratios calculated
had a slight but insignificant rate increase from lowered
in increased-temperature cores (0.42 ± 0.11 and 0.33 ± 0.05
to control temperatures (∼ 12 %), where rates significantly
for 1+3 and 1+5 ◦ C, respectively) (one-way interaction:
decreased at temperatures higher than control (∼ 45 and
F3,8 = 49.41, p < 0.0001; Fig. 2d). Similarly, under high-
∼ 50 % for 1+3 and 1+5 ◦ C, respectively) (one-way in-
pCO2 conditions, the effect of GPP on P / R was clear. The
teraction: F3,8 = 16.89, p = 0.001; Fig. 2c). OA signif-
positive effect of high-pCO2 conditions on GPP pushed the
icantly increased GPP at ambient and 1+3 ◦ C temper-
https://doi.org/10.5194/bg-18-1823-2021 Biogeosciences, 18, 1823–1838, 20211830 M. N. Simone et al.: Warming and OA may decrease DOC export P / R ratio of 1−3 ◦ C and control temperature cores to ∼ 1 (1.09 ± 0.16 and 1.03 ± 0.03, respectively), suggesting the ecosystem shifted toward net autotrophy under those condi- tions. The positive effect of high-pCO2 conditions was also highlighted at 1+3 ◦ C, with P / R (0.77 ± 0.13) remaining close to the current ecosystem ratio (0.84 ± 0.01) instead of significantly dropping like those calculated under current pCO2 conditions or in 1+5 ◦ C cores (0.25 ± 0.04, one-way interaction: F3,8 = 38.58, p
M. N. Simone et al.: Warming and OA may decrease DOC export                                                                                1831

Figure 4. DIC : DO fluxes from sediment (µmol C m−2 h−1 or
µmol O2 m−2 h−1 ) for all temperatures in dark-and-light cycles
subject to current and high-pCO2 conditions (mean ± SD). Dashed
line highlights the 1 : 1 ratio (±18 %; Hopkinson, 1985), with val-
ues falling on this line likely a result of aerobic respiration. Arrows
indicate the position values would fall in if sediments were experi-
encing chemical oxidation or anaerobic respiration.

temperatures to DOC fluxes around zero (one-way interac-
tion: F3,8 = 16.76, p = 0.001; Fig. 5b).
   High-pCO2 conditions alone (at ambient mean tem-
peratures, 23 ◦ C) had a significant effect on net DOC,
shifting from a slight efflux at current pCO2 levels
(∼ 0.5 mmol C m−2 d−1 ) to a significant uptake at high
pCO2 levels (∼ 10.9 mmol C m−2 d−1 ; one-way interaction:
F3,4 = 25.1, p = 0.007; Fig. 5a). The trend in temperature
response was similar for current and high-pCO2 conditions
(two-way interaction: F3,16 = 0.88, p = 0.47; Fig. 5a), but
there was a significant shift from small efflux at lower tem-
peratures to considerable uptakes at all temperatures under
high-pCO2 conditions (two-way CO2 effect: F1,16 = 61.46,
p < 0.0001; Fig. 5a). Differences between dark and light
DOC fluxes under high-pCO2 conditions were independent                    Figure 5. Effect of three temperature offsets from control (CON
of temperature (two-way interaction: F3,16 = 1.94, p = 0.16;              = 23◦ C) on (a) net dissolved organic carbon (DOC) fluxes
Fig. 5c), with the overall magnitude of influxes in the dark              (µmol C m−2 d−1 ) under current (open boxes) and high-pCO2 con-
being significantly greater than those in the light (two-way              ditions (hatched boxes). Light (grey boxes) and dark fluxes (spot-
light condition: F1,16 = 15.83, p = 0.001; Fig. 5c). Loss of              ted boxes) of DOC (µmol C m−2 h−1 ) for (b) current pCO2 and
statistically different temperature responses for high-pCO2               (c) high-pCO2 conditions. In panel (a) letters identify significantly
                                                                          different means across temperatures under current pCO2 condi-
light and dark responses (temperature effect, two-way inter-
                                                                          tions, and numerals identify significantly different means across
action: F3,16 = 1.05, p = 0.40; Fig. 5c) was in large part due            temperatures under high-pCO2 conditions; in panels (b) and (c)
to within-treatment variability in the high-pCO2 cores.                   letters identify significantly different means across temperatures
                                                                          in dark cycles, and numerals identify significantly different means
                                                                          across temperatures in light cycles. Letters or numerals that are the
4   Discussion                                                            same indicate no significant difference, as determined by a one-way
                                                                          ANOVA and post hoc Tukey’s test. Solid and dashed horizontal
An important component of this study was testing the inter-               lines identify significant effects of pCO2 or light and temperature,
action and individual effects of warming and OA on DOC                    respectively, where double solid and dashed lines identify signifi-
processing. This was necessarily achieved through a com-                  cant interaction of temperature and light (two-way ANOVA). Lev-
parison of core incubations occurring in different weeks. As              els of significance are denoted with “∗ ” for 0.05, “∗∗ ” for 0.01, and
such, it is important to consider the limitations of this ap-             “∗∗∗ ” for 0.001. Data in Table S6.
proach. Control treatments in different weeks would ideally

https://doi.org/10.5194/bg-18-1823-2021                                                             Biogeosciences, 18, 1823–1838, 2021
1832 M. N. Simone et al.: Warming and OA may decrease DOC export
be the same in all respects, but there were some differences. 4.1 DOC fuels benthic respiration
For instance, NPP and R were higher in the incubation week
for current pCO2 conditions (Table S2), likely due to small DOC appeared to be a significant driver of benthic res-
changes in environmental conditions, such as salinity differ- piration (Fig. 5b). At control temperatures (23 ◦ C) net
ences (24 versus 17.7 for current and high-pCO2 conditions, DOC fluxes were near zero (0.47 ± 0.93 mmol C m−2 d−1 ),
respectively; Table 1). However, these differences did not indicating that the diel production and uptake of DOC
significantly affect DOC fluxes, nor the heterotrophy of the across the sediment–water interface were balanced (Fig. 5a).
sediments (P / R = 0.84 ± 0.01 and 0.83 ± 0.04; Table S2). The control rates in the present study were close to
Moreover, sediments in separate weeks maintained the same benthic DOC flux rates reported for subtropical estuar-
OM content (∼ 3.5 %) and molar C : N ratio (∼ 16), suggest- ine sediments in most seasons, ∼ 1.5 mmol C m−2 d−1 , ex-
ing that differences in processing have very little short-term cept summer (Maher and Eyre, 2010). Relative to our
impact on the overall OM pool in the sediment due to the control (summer) rates, Maher and Eyre (2010) reported
OM pool size being about 3 orders of magnitude higher than higher net DOC flux rates (∼ 10 mmol C m−2 d−1 ) as a
any diel flux (organic carbon pool ∼ 12 000 mM). Thus, be- result of DOC effluxes in both the light and dark (Ma-
cause all conditions in the laboratory setup were the same her and Eyre, 2010). We observed similar light DOC ef-
for each incubation (with the exception of pCO2 in treat- fluxes (610 µmol C m−2 h−1 ) to summer sediments in Ma-
ment tanks, which was intentionally manipulated to be differ- her and Eyre (2010) (∼ 647 µmol C m−2 h−1 ), whereas
ent), the difference in fluxes between controls was attributed dark DOC uptake was observed in the current study
to differences in when the sediments and overlying waters (−571 µmol C m−2 h−1 ), and Maher and Eyre (2010) re-
were collected. Therefore, the scaling of NPP and R (Ta- ported dark DOC effluxes (254 µmol C m−2 h−1 ). This re-
ble S3) was done for the sake of treatment comparison, re- lease of DOC in the dark was attributed to enhanced micro-
sulting in scaled rates within 13 % of actual measured val- bial coupling in the sediments in warmer temperatures (Ma-
ues, which had a negligible effect on P / R (< 1 % across all her and Eyre, 2010). In the current study, and in previous re-
treatments). The final NPP and R rates in comparisons across ports, DOC uptake suggests that bacteria not only intercepted
treatments should thus be considered relative to control rates DOC produced from within the pore waters (potentially sat-
and be interpreted as approximate values (±13 %). isfying up to 60 % of total mean bacterial production; Boto et
Understanding current ecosystem functioning is of pri- al., 1989) but also took up available DOC from the water col-
mary interest when trying to determine how disturbances umn to satisfy its metabolic requirements (Boto et al., 1989;
in the environment may change metabolic rates and path- Brailsford et al., 2019), effectively acting as a DOC sink. Un-
ways of OM mineralization (Jørgensen, 1996; D’Avanzo et der conditions of reduced light availability and/or intensity,
al., 1996; Malone and Conley, 1996). Based on unadjusted sediments are expected to have an amplified heterotrophic re-
R rates, the nearly 1 : 1 ratio of DIC production to O2 con- sponse in addition to a reduction in microalgal production of
sumption in the dark (respiratory quotient of ∼ 1.13 ± 0.05; DOC.
Fig. 4) suggests that aerobic respiration dominated the sedi-
ments (Eyre and Ferguson, 2002). Similarly, unadjusted NPP 4.2 OA increases DOC assimilation
rates suggest that aerobic processes dominated benthic pro-
duction in the light, with a 1 : 1 ratio of O2 and DIC fluxes Positive responses in primary production were associated
(Fig. 4; Eyre and Ferguson, 2002). Sediments in the current with OA. The ∼ 72 % increase in NPP rates at ambient tem-
study were net heterotrophic, with a P / R in control cores of peratures was consistent with general stimulation of primary
∼ 0.84 ± 0.01 and ∼ 0.83 ± 0.04 during current- and high- production in finer sediments with increased DIC availabil-
pCO2 incubation weeks, respectively. Despite the undeni- ity (Vopel et al., 2018; Oakes and Eyre, 2014). Sediments
able range of P / R ratios that unvegetated estuarine sedi- may become DIC-limited when algal demand is relatively
ments may experience (1.2 (Oakes et al., 2012) to 0.01 (Fer- high compared to porewater supply of CO2 (Cook and Røy,
guson and Eyre, 2013)), the ratios in the current study were 2006), and MPBs therefore may benefit from an increase in
similar to mean global estimates for unvegetated estuarine CO2 availability. MPBs in fine sediments are restricted to dis-
sediments (∼ 0.82, calculated from values in Duarte et al., solved substrates (i.e. nutrients and DIC) accessed via diffu-
2005) and calculated from P and R values of 22 estuaries sion from deeper and adjacent sediments, and the overlying
globally (∼ 0.87, compiled by Smith and Hollibaugh, 1993), water column (Boudreau and Jørgensen, 2001). This makes
suggesting that the metabolic function of sediments in the them more likely to deplete accessible DIC than MPBs in
current study are representative of estuarine sediments glob- permeable sediments. Primary producers in permeable sedi-
ally and the impacts observed in this study should be broadly ments, like those in reef ecosystems, therefore do not often
applicable. experience the same increase in primary production with in-
creased CO2 (Trnovsky et al., 2016; Cyronak and Eyre, 2016;
Eyre et al., 2018; Cook and Røy, 2006; Vopel et al., 2018).
As well as differences in diffusive versus advective modes of
Biogeosciences, 18, 1823–1838, 2021 https://doi.org/10.5194/bg-18-1823-2021M. N. Simone et al.: Warming and OA may decrease DOC export 1833
solute transfer between the sediment types (Cook and Røy, fore, unlike previous studies, decreases in MPB productiv-
2006), variable response may also be attributable to sandier ity at higher temperatures appeared to be a greater driver
sediments being limited by other factors such as nutrient and towards heterotrophy than increases in respiration rates. In
OM availability, given that coarser sediments are generally other words, temperature increases not only increased the
more oligotrophic (Admiraal, 1984; Heip et al., 1995). In rate of DOC uptake but also likely decreased the rate of DOC
comparison, nutrients were non-limiting in the less perme- production.
able sediments used in the current study, based on nutrient
concentrations that increased during all incubations (see the 4.3.1 Warming reduces GPP and DOC production
Supplement and Table S7). MPB growth rates in sediments under current pCO2 conditions
with low permeability are more likely limited by DIC avail-
ability. Primary productivity responses to pCO2 would likely Primary production is the main source of DOC in marine
differ in permeable sediments where general access to CO2 ecosystems (Wagner et al., 2020). Decreasing trends in GPP
is greater. with warming under current pCO2 conditions seen here have
Given that MPBs exude carbon (Maher and Eyre, 2010), been described previously where photosynthetic growth and
we would expect increased GPP to correspond with increased production decline at higher temperatures (Thomas et al.,
DOC production and flux. However, although OA stimulated 2012). Photosynthetic productivity is often linked to seasonal
primary production (Fig. 2), we instead saw increased DOC temperature (Apple et al., 2006), which is also associated
uptake in the dark (Fig. 5). A likely explanation is that bac- with differences in environmental factors such as light, nu-
terial uptake of DOC was stimulated through the provision trient concentrations, and dissolved organic matter (DOM)
of labile carbon from MPBs (Morán et al., 2011; Hardi- quality and availability (Geider, 1987; Herrig and Falkowski,
son et al., 2013). As such, DOC appeared to fuel much of 1989). Although the relative availability of light and nutri-
the dark cycle respiration, as DOC uptake in the dark re- ents does influence productivity rates (Kana et al., 1997)
flected dark DIC production (respiration), except for sedi- and would be expected to influence in situ seasonal produc-
ments at 1−3 ◦ C under current pCO2 conditions. Under cur- tion, the current study controlled light and initial nutrient
rent pCO2 conditions, uptake of DOC in the dark accounted concentrations in the water column to isolate the effect of
for only ∼ 50 % of the DIC respired in the dark. The portion temperature. Thus, decreasing GPP was driven by warming,
of DIC accounted for by dark DOC uptake increased from suggesting that MPBs in these subtropical sediments likely
50 to 100 % under the high-pCO2 conditions. In part, this had a temperature optimum around current mean summer
may have been due to increased availability of labile organic temperatures of ∼ 23 ◦ C (GPP: 1515 ± 37 µmol O2 m−2 h−1 ;
carbon (Moran and Hodson, 1990) arising from the increase Fig. 2c). Longer-term warming could allow for possible mi-
in NPP under high-pCO2 conditions across all temperatures gration of more tolerant species to settle from lower latitudes
(Fig. 2b), which would reduce the need for bacteria to syn- (Hallett et al., 2018), shifting the composition of the benthic
thesize ectoenzymes (Chróst, 1991, 1992), resulting in more community. The introduction of more tolerant species could
rapid turnover of carbon to the water column. reduce the increase in heterotrophy and net DOC removal
from the water column seen here. However, the species di-
4.3 Warming drives increased heterotrophy and DOC versity of the estuarine sediments will ultimately decrease
assimilation as they are pushed to temperature extremes (Thomas et al.,
2012), reducing the functional redundancy of the microbial
Sediments in this study, like other manipulative studies in community. This decreased functional redundancy has the
both permeable sands (Lantz et al., 2017; Trnovsky et al., potential to make unvegetated estuarine sediments less re-
2016) and cohesive sediments (Apple et al., 2006), demon- silient to environmental perturbations under future climate
strated increased heterotrophy with increased temperature. conditions.
This shift to heterotrophy is often attributed to the imbalance
in the thermal sensitivity of heterotrophic over autotrophic 4.3.2 Warming increases respiration and DOC
metabolism (Yang et al., 2016; Allen et al., 2005). More assimilation
specifically, differences in activation energy dictated by dif-
ferences in physiology and biochemical processes (Patching Unlike photosynthetic productivity, heterotrophic respiration
and Rose, 1970; Apple et al., 2006) result in increases in often has a linear rate increase with temperature to the ther-
heterotrophic activity with increasing temperature than ex- mal optimum due to heterotrophs not being constrained by
ceed increases in autotrophic activity (Yang et al., 2016). the same abiotic variables (e.g. nutrient and light availabil-
However, in this study, under current pCO2 conditions, the ity) as primary producers (Apple et al., 2006, 2008; Geider,
increases in R and GPP from 1−3 ◦ C to control tempera- 1987; Yap et al., 1994). In this study, respiration rates under
tures were similar (∼ 16 and ∼ 11 %, respectively), whereas both current and high pCO2 conditions increased from the
at higher temperatures GPP decreases far exceeded increases lowest rates measured at 1−3 ◦ C to maximum rates (> 50 %
in R (7× and 3× for 26 and 28 ◦ C, respectively). There- greater) at 1 + 5 ◦ C (Fig. 2a). Consistent with overall lower
https://doi.org/10.5194/bg-18-1823-2021 Biogeosciences, 18, 1823–1838, 20211834 M. N. Simone et al.: Warming and OA may decrease DOC export
respiration rates relative to other subtropical unvegetated sed- change. The following estimates should be considered in this
iments (∼ 900 to ∼ 1500 µmol O2 m−2 h−1 ; Ferguson and context, and it should be expected that different hydrody-
Eyre, 2013), the temperature dependence of respiration un- namic settings, sediment and/or sediment community com-
der both current and high-pCO2 conditions (Q10 = 1.66 and position, and sources of organic matter could affect the out-
1.69, respectively) was slightly lower than is typical for bio- come. For example, the response to warming and pCO2 may
logical systems (Q10 = 2; Valiela, 1995) but similar to tem- be different for pelagic communities and/or in deeper waters
perature dependence described in other estuarine systems that are subject to stratification (Li et al., 2020), where ac-
(Q10 = 1.5–1.9; Morán et al., 2011), with values towards the cess to nutrients and CO2 may become limiting (Rost et al.,
lower end of this range possibly being a result of resource 2008). We have applied our results to global coastal DOC
limitation (López-Urrutia and Morán, 2007). exports (Maher and Eyre, 2010; Duarte, 2017) as an initial
A potential limiting resource for bacteria in estuarine sed- step in estimating responses of unvegetated sediment habitats
iments is DOM (Church, 2008), ultimately controlling the to future high-pCO2 climate. We do not assume that the re-
flow of carbon through the microbial loop (Kirchman and sponses of unvegetated sediments to the future climate found
Rich, 1997). However, in the presence of sufficient DOM, here are applicable to other ecosystems dominated by macro-
warming has been associated with increased bacterial DOM phytes, and we thus did not apply our findings to vegetated
incorporation (Kirchman and Rich, 1997). In line with this, coastal habitats.
increased uptake of DOC at higher temperatures and efflux at To estimate total DOC export from coastal zone in a future
lower temperatures was observed. Although DOC is mainly high-pCO2 climate of 1+3 ◦ C and OA, the sediment uptake
produced by photoautotrophs, DOC can be produced in the rate of 19 ± 4 mmol C m−2 d−1 was scaled to the global sur-
dark through, for example, chemodegradation of detrital or- face area of unvegetated estuarine sediments (1.8 × 10¹² m2 ;
ganic carbon and cell lysis by viruses and during grazing Costanza et al., 1997). On this basis, an estimated 150 Tg C
(Carlson, 2002). As such, the efflux of DOC in the dark at would be removed from the coastal zone by unvegetated es-
1−3 ◦ C suggests that heterotrophic bacterial productivity, tuarine sediments annually under OA conditions with an ac-
and therefore DOC uptake, was reduced by lowered tem- companying 3 ◦ C temperature increase. To then calculate the
peratures (Raymond and Bauer, 2000), resulting in a failure potential impact of this uptake, we applied our estimates to
to intercept all DOC produced in the pore waters. This fail- existing future global coastal DOC export estimates (Ma-
ure to intercept DOC may be compounded if nutrient supply her and Eyre, 2010; Duarte, 2017). Mean benthic DOC ex-
is limited (Brailsford et al., 2019), as it is common for het- port from estuaries, including intertidal and vegetated habi-
erotrophic bacteria to rely on refractory DOC when labile tats, has been estimated at 168 Tg C yr−1 (90–247 Tg C yr−1 )
sources are not readily available (Chróst, 1991), which can (Maher and Eyre, 2010). Under this scenario, the switch to
occur under conditions of nutrient-limited biological produc- DOC uptake by sediments under future climate conditions
tivity (Allen, 1978). (Fig. 5a) would result in ∼ 90 % reduction in total mean
estuarine DOC export (Maher and Eyre, 2010), decreasing
4.3.3 Global estuarine loss of DOC from unvegetated the load from ∼ 168 to ∼ 18 Tg C yr−1 . Other global esti-
sediments in the future mates of DOC exported from coastal vegetated ecosystems
range from 114 up to 1853 Tg C yr−1 (Duarte, 2017), with
Up to 3.5× more DOC reaches the ocean interior from scaled estimates suggesting unvegetated estuarine sediments
coastal areas than the open ocean (Duarte, 2017; Krause- may consume 8 to 132 % of this DOC under a future high-
Jensen and Duarte, 2016; Hansell et al., 2009). As such, pCO2 climate. As such, this basic upscaling suggests that,
small changes to the coastal export of DOC may have a dis- by impacting DOC fluxes in unvegetated sediments, future
proportionately large influence on the global DOC budget. climate conditions have the potential to significantly impact
Our findings suggest a reduced export of DOC to the ocean global DOC export from coastal systems to the open ocean.
from the coastal zone under high-pCO2 conditions, across This has implications for global marine productivity and car-
the full 8 ◦ C temperature range due to changes in carbon pro- bon transfer to the ocean interior (Krause-Jensen and Duarte,
cessing within unvegetated sediments. Despite the lack of 2016). However, to get a more accurate insight into global
seasonality in the study, the inclusion of an 8 ◦ C temperature carbon cycling, the response of DOC export from estuarine
range, including temperatures below current mean tempera- vegetated habitats to future climate also needs to be studied.
tures, suggests that seasonal temperature variation is unlikely
to have a significant effect on the relative change in DOC in
the future (Fig. 5). Although any upscaling of a single con- Data availability. Archived data will be accessible on PAN-
trolled experiment to a global scale is highly speculative, we GAEA at https://doi.org/10.1594/PANGAEA.924460 (Simone et
believe it is valuable to demonstrate the potential for a high- al., 2020).
pCO2 climate to cause globally significant change in DOC
export from coastal zones. Furthermore, putting our findings
in a global context provides a guideline value for potential
Biogeosciences, 18, 1823–1838, 2021 https://doi.org/10.5194/bg-18-1823-2021M. N. Simone et al.: Warming and OA may decrease DOC export 1835
Supplement. The supplement related to this article is available on- Bauer, J. and Bianchi, T.: Dissolved Organic Carbon Cycling and
line at: https://doi.org/10.5194/bg-18-1823-2021-supplement. Transformation, in: Treatise on estuarine and coastal science,
edited by: Wolanski, E. and McLusky, D. S., Academic Press,
Waltham, 7–67, 2011.
Author contributions. All listed authors have contributed substan- Bauer, J. E. and Druffel, E. R. M.: Ocean margins as a significant
tially to preparation and drafting of this paper and have approved source of organic matter to the deep open ocean, Nature, 392,
the final submitted manuscript. Specifically, MNS conceived the 482–485, https://doi.org/10.1038/33122, 1998.
project, collected data, ran data analysis and interpretation, and led Boto, K. G., Alongi, D. M., and Nott, A. L.: Dissolved organic
the writing of the manuscript. KGS, JMO, and BDE helped con- carbon-bacteria interactions at sediment-water interface in a
ceive the project, contributed to interpretation, and helped draft the tropical mangrove system, Mar. Ecol.-Prog. Ser., 51, 243–251,
manuscript. https://doi.org/10.3354/meps051243, 1989.
Boudreau, B. P. and Jørgensen, B. B.: The benthic boundary layer:
Transport processes and biogeochemistry, Oxford University
Competing interests. The authors declare that they have no conflict Press, New York, 2001.
of interest. Brailsford, F. L., Glanville, H. C., Golyshin, P. N., Johnes,
P. J., Yates, C. A., and Jones, D. L.: Microbial uptake ki-
netics of dissolved organic carbon (DOC) compound groups
from river water and sediments, Sci. Rep.-UK, 9, 11229,
Acknowledgements. Thanks are extended to Paul Kelly,
https://doi.org/10.1038/s41598-019-47749-6, 2019.
Iain Alexander, Matheus Carvalho, Natasha Carlson-Perret,
Carlson, C. A.: Production and Removal Processes, in: Biogeo-
Jacob Yeo, and Nicola Camillini for their assistance in the field and
chemistry of Marine Dissolved Organic Matter, edited by:
support in the laboratory. Special thanks to Zoey Kennedy allowing
Hansell, D. A. and Carlson, C. A., Academic Press, San Diego,
access to her property for sample collection. This work was
2002.
supported by an SESE Postgraduate Scholarship from Southern
Chróst, R. J.: Ectoenzymes in aquatic environments: Microbial
Cross University, Lismore, NSW, Australia.
strategy for substrate supply, SIL Proceedings, 1922–2010, 24,
2597–2600, https://doi.org/10.1080/03680770.1989.11900030,
1991.
Financial support. This research has been supported by ARC Dis- Chróst, R. J.: Significance of bacterial ectoenzymes in
covery projects (grant nos. DP150102092 and DP160100248). aquatic environments, Hydrobiologia, 243, 61–70,
https://doi.org/10.1007/BF00007020, 1992.
Church, M. J.: Resource control of bacterial dynamics in the sea,
Review statement. This paper was edited by Christoph Heinze and in: Microbial ecology of the oceans, edited by: Kirchman, D. L.,
reviewed by two anonymous referees. 335–382, 2008.
Cook, P. L., Veuger, B., Böer, S., and Middelburg, J. J.: Ef-
fect of nutrient availability on carbon and nitrogen incorpo-
ration and flows through benthic algae and bacteria in near-
References shore sandy sediment, Aquat. Microb. Ecol., 49, 165–180,
https://doi.org/10.3354/ame01142, 2007.
Admiraal, W.: The ecology of estuarine sediment-inhabiting di- Cook, P. L. M. and Røy, H.: Advective relief of CO2
atoms, in: Progress in phycological Research, edited by: Round, limitation in microphytobenthos in highly productive
F. E., and Chapman, D. J., Biopress, Bristol, 269–322, 1984. sandy sediments, Limnol. Oceanogr., 51, 1594–1601,
Allen, A., Gillooly, J., and Brown, J.: Linking the global car- https://doi.org/10.4319/lo.2006.51.4.1594, 2006.
bon cycle to individual metabolism, Funct. Ecol., 19, 202–213, Cook, P. L. M., Butler, E. C., and Eyre, B. D.: Carbon and nitro-
https://doi.org/10.1111/j.1365-2435.2005.00952.x, 2005. gen cycling on intertidal mudflats of a temperate Australian es-
Allen, H. L.: Low molecular weight dissolved organic matter in five tuary. I. Benthic metabolism, Mar. Ecol.-Prog. Ser., 280, 25–38,
soft-water ecosystems: a preliminary study and ecological impli- https://doi.org/10.3354/meps280025, 2004.
cations: With 3 figures and 2 tables in the text and on 1 folder, In- Costanza, R., d’Arge, R., De Groot, R., Farber, S., Grasso, M., Han-
ternationale Vereinigung für theoretische und angewandte Lim- non, B., Limburg, K., Naeem, S., O’Neill, R. V., and Paruelo, J.:
nologie: Verhandlungen, 20, 514–524, 1978. The value of the world’s ecosystem services and natural capital,
Apple, J., Smith, E., and Boyd, T.: Temperature, Salinity, Nutrients, Nature, 387, 253, https://doi.org/10.1038/387253a0, 1997.
and the Covariation of Bacterial Production and Chlorophyll- Cyronak, T. and Eyre, B. D.: The synergistic effects of ocean acid-
a in Estuarine Ecosystems, J. Coast. Res., 2008, 59–75, ification and organic metabolism on calcium carbonate (CaCO3 )
https://doi.org/10.2112/SI55-005.1, 2008. dissolution in coral reef sediments, Mar. Chem., 183, 1–12,
Apple, J. K., del Giorgio, P. A., and Kemp, W. M.: Temperature https://doi.org/10.1016/j.marchem.2016.05.001, 2016.
regulation of bacterial production, respiration, and growth effi- Czerny, J., Schulz, K. G., Boxhammer, T., Bellerby, R. G. J., Bü-
ciency in a temperate salt-marsh estuary, Aquat. Microb. Ecol., denbender, J., Engel, A., Krug, S. A., Ludwig, A., Nachtigall,
43, 243–254, https://doi.org/10.3354/ame043243, 2006. K., Nondal, G., Niehoff, B., Silyakova, A., and Riebesell, U.:
Azam, F.: Microbial control of oceanic carbon Implications of elevated CO2 on pelagic carbon fluxes in an
flux: the plot thickens, Science, 280, 694–696, Arctic mesocosm study – an elemental mass balance approach,
https://doi.org/10.1126/science.280.5364.694, 1998.
https://doi.org/10.5194/bg-18-1823-2021 Biogeosciences, 18, 1823–1838, 2021You can also read