Biomass-burning-induced surface darkening and its impact on regional meteorology in eastern China
←
→
Page content transcription
If your browser does not render page correctly, please read the page content below
Atmos. Chem. Phys., 20, 6177–6191, 2020
https://doi.org/10.5194/acp-20-6177-2020
© Author(s) 2020. This work is distributed under
the Creative Commons Attribution 4.0 License.

Biomass-burning-induced surface darkening and its impact on
regional meteorology in eastern China
Rong Tang1,2 , Xin Huang1,2 , Derong Zhou1,2 , and Aijun Ding1,2
1 School   of Atmospheric Sciences, Nanjing University, Nanjing, 210023, China
2 Collaborative  Innovation Center of Climate Change, Jiangsu Province, Nanjing, 210023, China

Correspondence: Xin Huang (xinhuang@nju.edu.cn)

Received: 18 October 2019 – Discussion started: 10 December 2019
Revised: 18 April 2020 – Accepted: 28 April 2020 – Published: 27 May 2020

Abstract. Biomass burning has attracted great concerns for       1   Introduction
the emission of particular matters and trace gases, which
substantially impacts air quality, human health, and climate
change. Meanwhile, large areas of dark char, carbon residue      Biomass burning (BB) refers to open or quasi-open com-
produced in incomplete combustion, can stick to the sur-         bustion of plants or organic fuels, including forest fires,
face over fire-prone areas after open burning, leading to a      savannah fires, peat burning, and crop residue burning in
sharp drop in surface albedo, so-called “surface darkening”.     fields (Andreae, 1991; Andreae and Merlet, 2001; Fearnside,
However, exploration into such surface albedo declines and       2000; Thompson, 1996). Intensive BB events occur across
the radiative and meteorological effects is still fairly lim-    the world every year and pose great threats to life and the
ited. As one of the highest-yield agricultural areas, east-      property of human beings (Bowman and Panton, 1994; Dun-
ern China features intensive straw burning every early sum-      can et al., 2003; Kaiser et al., 2012; Streets et al., 2003;
mer, the harvest season for winter wheat, which was partic-      Uhl and Kauffman, 1990). Apart from this, BB has received
ularly strong in 2012. Satellite retrievals show that the sur-   widespread attention due to air pollution, health threats, and
face albedo decline over fire-prone areas was significant, es-   climate change caused by the large amount of particulate
pecially in the near-infrared band, which can reach − 0.16.      matter, trace gases, and greenhouse gases it releases (Chan
Observational evidence of abnormal surface warming was           and Yao, 2008; Chang and Song, 2010; Chen et al., 2017;
found by comparing radiosonde and reanalysis data. Most          Crutzen and Andreae, 1990; Crutzen et al., 1979; Hansen et
sites around intensive burned scars show a positive deviation,   al., 2005; Haywood and Ramaswamy, 1998; Hobbs et al.,
extending especially in the downwind area. Comparisons be-       1997; Langmann et al., 2009; Podgorny et al., 2003). How-
tween “pre-fire” and “post-fire” from 2007 to 2015 indicated     ever, the impact of BB is much more than that. BB can di-
a larger temperature bias of the forecast during the post-fire   rectly destruct vegetation covers and affect soil properties
stage. The signal becomes more apparent between 14:00 and        over fire-prone areas (Certini, 2005), and it is considered as
20:00 LT. Weather Research and Forecasting model coupled         one of the most important factors influencing the global ter-
with Chemistry (WRF-Chem) simulations suggest that in-           restrial ecosystem (Fearnside, 2000).
cluding surface darkening can decrease model bias and well-         Since open BB tends to occur directly on land surface, veg-
captured temperature variation after burning at sites in fire    etation covers will be destructed, and the underlying surface
areas and their adjacent area. This work highlights the impor-   properties will be affected straightway (Certini, 2005; Myhre
tance of biomass burning induced albedo change in weather        et al., 2005). Among them, surface albedo is highly sensi-
forecast and regional climate.                                   tive to BB (Jin and Roy, 2005). Due to the cover of black
                                                                 charcoal produced in incomplete combustion, sharp surface
                                                                 albedo decline can be observed over fire-prone areas, which
                                                                 has been proven on several kinds of vegetation covers, in-
                                                                 cluding savannah and forest (Govaerts et al., 2002; Jin and

Published by Copernicus Publications on behalf of the European Geosciences Union.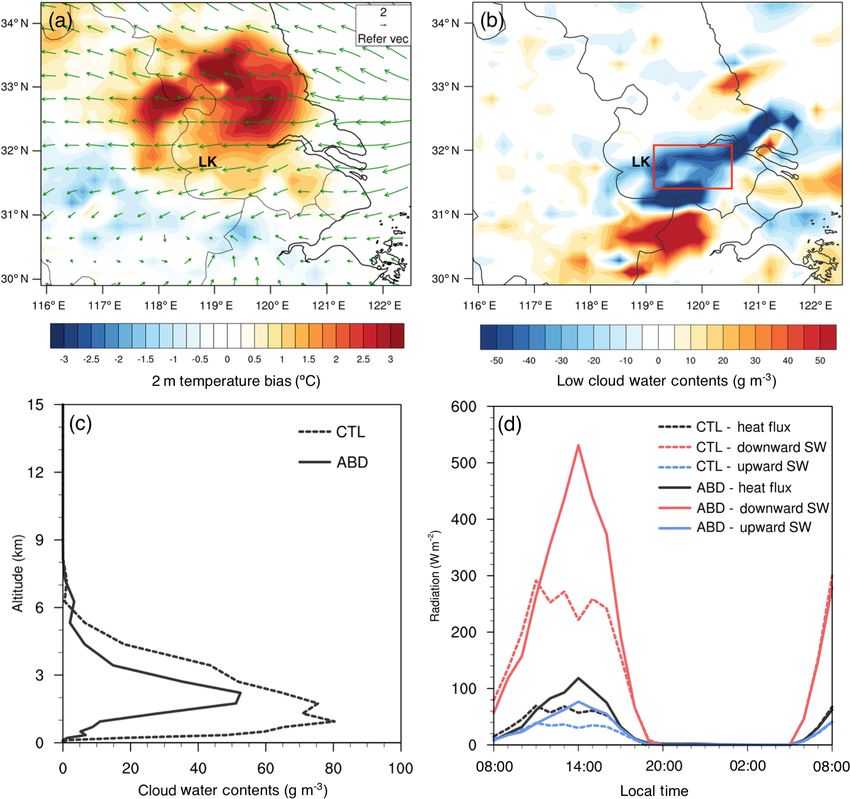
6178                  R. Tang et al.: Biomass-burning-induced surface darkening and its impact on regional meteorology

Roy, 2005; Myhre et al., 2005; Roy and Landmann, 2005).             et al., 2016; Wang et al., 2018; Xu et al., 2018; Zhou et al.,
This kind of “surface darkening” can last for about 1 week          2018).
or even longer if it is dryer and calmer, before char ma-              Based on years of satellite fire counts in eastern China, the
terials are removed by weathering and vegetation starts to          most severe straw burning happened in June 2012 (Huang et
regenerate (Amiro et al., 2006; Beringer et al., 2003; Bre-         al., 2012b). The most concentrated area of burning in east-
mer and Ham, 1999; Trigg and Flasse, 2000; Tsuyuzaki et             ern China is the Yellow–Huai River area (YHR), which con-
al., 2008; Veraverbeke et al., 2012). The magnitude of such         nects the middle and lower reaches of the Yellow River and
surface albedo decline depends on fire intensity and can be         Yangtze River. YHR is the major wheat-producing area in
up to half of pre-fire values (Veraverbeke et al., 2012). De-       China (Lei and Yuan, 2013). An extremely typical pollu-
creased surface albedo enhances the capacity of fire-affected       tion episode was triggered by BB emissions from YHR in
surface to absorb solar radiation under clear-sky conditions,       June 2012, during which a yellow haze blanketed the Yangtze
perturbing the surface energy budget and the process of land–       River Delta (YRD) (Ding et al., 2013a; Huang et al., 2012b;
atmosphere interaction, and then modifying local or even re-        Xie et al., 2015). The intensive BB events and the result-
gional circulation (Gatebe et al., 2014). These changes in me-      ing heavy pollution put weather forecast in trouble, during
teorological parameters will be important for weather and air       which a series of meteorological anomalies were observed,
quality forecast (Ding et al., 2013a; Yang et al., 2019; Zhang      such as air temperature changes and precipitation redistribu-
et al., 2016).                                                      tion (Ding et al., 2013a; Gao et al., 2018; Huang et al., 2016).
   Though restrictions have been imposed, severe and large-         On one hand, these anomalies have been partly attributed
scale BB events still occurred frequently all over the world        to aerosols, particularly absorbing aerosols like black car-
in recent years (Abatzoglou and Williams, 2016; Nolan et            bon (BC), considering the interaction between air quality
al., 2020). Moreover, threats from global fire activities are       and meteorology (Huang et al., 2016). On the other hand,
still increasing dramatically with climatic and anthropogenic       the fire-induced decreased surface albedo and its radiative
drivers (Marlon et al., 2009; Pechony and Shindell, 2010;           and meteorological effects on a regional scale should not
Van Der Werf et al., 2006). These facts emphasize the ur-           be ignored (Myhre et al., 2005). The striking spectral con-
gent need for further research on the impact of BB, to im-          trast between dark charcoal deposits over burned surface and
prove the human ability to predict future weather and climate       bright ripe wheat could cause distinct physical signals, so-
(Hansen et al., 2005). Globally, BB events occur with signif-       called surface darkening (Govaerts et al., 2002; Pereira et
icant seasonal variations and distinct regional characteristics     al., 1999). The influence of such surface albedo decline on
(Duncan et al., 2003; Hao and Liu, 1994; Kaiser et al., 2012;       the local and regional energy budget can be significant (Jin
Streets et al., 2003; Uhl and Kauffman, 1990). It is notewor-       and Roy, 2005), especially in summer when solar radiation
thy that agricultural burning is still very common in many          is extremely strong. It could be another key issue that needs
developing countries, mainly during post-harvest periods, for       to be well understood so as to figure out the meteorological
the purpose of clearing farmland and providing ash fertiliza-       anomalies during the burning season. Since many developing
tion for the crop rotation (Gao, 2002; Ravindra et al., 2019;       areas are still carrying out large-scale agricultural burning,
Tipayarom and Kim Oanh, 2020). However, exploration into            better understanding of such fire-induced albedo change and
such fire-induced decreased surface albedo and its radiative        its meteorological effects is of great significance for weather
and meteorological effects is still fairly limited.                 and climate forecast (Ravindra et al., 2019).
   As for China, with the world’s top-ranked crop production           In this study, signals of surface albedo decline induced by
across the world, about 122 Tg of crop residue is burned on         crop residue burning in eastern China were found based on
site annually (Yan et al., 2006). Eastern China, especially the     satellite retrievals, defined as surface darkening. The mag-
middle and lower reaches of the Yellow River and Yangtze            nitude and spatial distribution of the declines were investi-
River, features a large plain area and dense population with        gated combining fire counts by Moderate Resolution Imag-
high agricultural production (Li et al., 2016). Eastern China       ing Spectroradiometer (MODIS) based on straw burning in
has been characterized by intensive straw burning every June,       June 2012. Temperature anomalies after BB were also ex-
the harvest season for winter wheat (He et al., 2007; Huang et      plored using long-term site observations from 2007 to 2015
al., 2012a, 2018; Li et al., 2016; Yang et al., 2013; Yin et al.,   in eastern China, and comparisons were made between two
2019). After revolution in rural fuel structure, farmers, who       statuses: “pre-fire” and “post-fire”. Moreover, with the aid of
are eager to deal with tons of wheat straw, always resort to        the Weather Research and Forecasting model coupled with
burning on site rather than taking it as fuel (Lu et al., 2011;     Chemistry (WRF-Chem model), decreased surface albedo
Yan et al., 2006; Zhu et al., 2019). Hence, the wheat straw         over fire-prone areas were taken into consideration in the
burning is exceedingly dense in both time and space (Huang          simulation targeting temperature anomalies in June 2012.
et al., 2012b; Yang et al., 2008). This phenomenon not only         The further impact of surface darkening on the radiation bud-
poses alarming threats to air quality and human health (Ding        get, energy reallocation in the Earth–atmosphere system, and
et al., 2016; Nie et al., 2015) but also brings great challenges    meteorology were discussed on a local and regional scale,
to weather and climate forecast (Ding et al., 2013b; Huang

Atmos. Chem. Phys., 20, 6177–6191, 2020                                               https://doi.org/10.5194/acp-20-6177-2020

R. Tang et al.: Biomass-burning-induced surface darkening and its impact on regional meteorology                              6179

which is of assignable climatological significance and should       sounding.html, last access: 28 December 2019), which is the
not be neglected.                                                   only sounding site in the YHR area. The radiosondes were
                                                                    launched twice a day (08:00 and 20:00 LT) and made mea-
                                                                    surements both on the mandatory pressure levels (e.g. sur-
2     Data and methods                                              face, 1000, 900, and 850 hPa) and additional key levels. They
                                                                    measure vertical profiles of atmospheric parameters like air
2.1    Fire counts and surface albedo
                                                                    temperature and water mixing ratio.
The intensity of fire counts and the magnitude of surface
albedo decline induced by crop residue burning were anal-           2.3   Experiment design and model configuration
ysed based on standard MODIS products provided by NASA
(Giglio and Justice, 2015a, b; Vermote, 2015).                      Version 3.6.1 of WRF-Chem, an online-coupled chemical
   The MODIS Surface Reflectance product (MOD09A1)                  transport model, was employed in this study, in which mul-
provides an estimate of the surface spectral reflectance of         tiple physical and chemical processes are depicted, includ-
MODIS bands 1 through 7 at a horizontal resolution of 500 m         ing emission, transport, mixing, and chemical transformation
and uses the Bidirectional Reflectance Distribution Function        of trace gases and aerosols simultaneously with meteorol-
(BRDF) database to better constrain the different threshold         ogy (Grell et al., 2005). In order to take fire-induced albedo
used (Schaaf et al., 2002). Wavelengths of the seven MODIS          change into consideration and figure out the impact of sur-
spectral narrowbands range relatively from 0.62 to 0.67, 0.84       face darkening on the radiation budget and meteorology in
to 0.87, 0.46 to 0.48, 0.54 to 0.56, 1.23 to 1.25, 1.63 to 1.65,    eastern China, a pair of parallel experiments in WRF-Chem
and 2.11 to 2.15 µm. The narrowband albedo can be con-              with surface albedo as a variable were designed: in the con-
verted to specified broadband albedo for shortwave and near-        trol (CTL) experiment, a default value of monthly surface
infrared broadband through valid algorithms (Liang, 2001;           albedo in the model was adopted, while in the ABD experi-
Liang et al., 2003). It has been corrected for atmospheric con-     ment we applied satellite-detected albedo decline over fire-
ditions such as gases, aerosols, and Rayleigh scattering. The       prone areas. In particular, the fire-affected grids were ex-
dataset is updated every 8 d, for selecting one value from all      tracted out by a certain threshold of fire count density in June
acquisitions in an 8 d composite period for each pixel unit.        2012, and the surface albedo decline in each grid is defined
The criteria for grid cell value selection include cloud condi-     as the difference between MODIS-detected surface albedo
tions and solar zenith angle.                                       post-fire and pre-fire based on the satellite data analysis in
   The MODIS Thermal Anomalies/Fire Daily L3 Global                 Sect. 3.1. In YHR, most fire from wheat straw is charac-
product (MOD/MYD14A1) consists of daily surface thermal             terized by short-lived and incomplete smoldering (Huang et
anomaly data obtained by Terra and Aqua satellites with spa-        al., 2016). The relationship between the fire radiative power
tial resolution of 1 km (Giglio et al., 2009, 2013, 2016; Haw-      (FRP) and fire sizes varies at a global scale, and FRP of
baker et al., 2008), and fire counts with low confidence were       such straw burning is much weaker than grassland fires in
got rid of for quality control. The “fire count” described in the   North American (Laurent et al., 2019). Based on the MODIS
following part indicates the central location of MODIS pix-         Thermal Anomalies product (MOD/MYD14A1), the average
els with surface thermal anomalies. The actual geographic           maximum FRP for the most severe burning area in June 2012
size of the pixel varies depending on the angle at which a          is almost less than 0.02 kW m−2 , the energy disturbance of
satellite scans. When counting the number of pixels in the          which is much smaller than the continuous radiative distur-
target region, the pixels are abstracted into points on a two-      bance of surface albedo decline in summer. Consequently,
dimensional plane.                                                  the heat released by fire was not treated in the model.
                                                                       The domain is centred at 33.0◦ N, 115.0◦ E with a grid res-
2.2    Temperature observation and forecast                         olution of 20 km covered the eastern China and its surround-
                                                                    ing areas. The initial and lateral boundary conditions of me-
To obtain the surface meteorological conditions, meteorolog-        teorological variables are obtained from NCEP FNL, which
ical observations of air temperature at 2 m height were ac-         updates every 6 h. MIX, a mosaic Asian anthropogenic emis-
quired from the Integrated Surface Dataset from the US Na-          sion inventory developed by Tsinghua University (Li et al.,
tional Centers for Environmental Information (NCEI). The            2017), and the Fire Inventory from NCAR (FINN), providing
temperature observations were used to compare with the              high-resolution global emission estimates from open burning
US National Centers for Environmental Prediction (NCEP)             (Wiedinmyer et al., 2011), were applied in WRF-Chem as
global final analysis data (FNL) with a 1◦ × 1◦ spatial reso-       anthropogenic and BB emissions, respectively. The simula-
lution which is updated every 6 h, and they were also applied       tions were conducted for the time period of 2–18 June 2012
for verification and analysis of numerical simulations.             and split into eight independent 72 h runs for the meteorolog-
   The radiosonde data at Xuzhou (34.28◦ N, 117.15◦ E;              ical fields, while the chemical outputs from the preceding run
WMO station number 58027) were collected from the                   were used as the initial conditions for the following run. Only
University of Wyoming (http://weather.uwyo.edu/upperair/            the last 48 h results of each run were kept for analysis, and

https://doi.org/10.5194/acp-20-6177-2020                                             Atmos. Chem. Phys., 20, 6177–6191, 2020
6180                  R. Tang et al.: Biomass-burning-induced surface darkening and its impact on regional meteorology

Table 1. WRF-Chem domain setting and configuration selections.     with the low temporal resolution of MODIS may increase
                                                                   the difficulty of signal capture and lead to underestimation
              Domain setting                                       of fire counts (Chang and Song, 2009, 2010; Giglio et al.,
              Horizontal grids   130 × 130
                                                                   2009; Randerson et al., 2012; Yin et al., 2019). As illus-
              Grid spacing       20 km × 20 km                     trated in Fig. 1a, severe and intensive BB events happened
              Vertical layers    30                                in mid–early June, especially 7–13 June, a tense and busy
              Map projection     Lambert conformal                 period in the crop cycle for harvest of wheat and sowing of
                                                                   maize. Among them, burning on 13 June is the most serious.
              Configuration selections
                                                                   Black charcoal deposits produced in highly intensive open
              Land surface       Noah                              straw burning would adhere to exposed soil and bound sur-
              Boundary layer     MYJ                               face albedo over a period of time before removal of the char
              Microphysics       Lin et al.                        by natural process or regeneration of vegetation (Veraver-
              Cumulus            Grell–Freitas                     beke et al., 2012). The strong spectral contrast between dark
              Radiation          RRTMG                             burned surface and original bright, dry ripe wheat cover can
              Chemistry          CBMZ
                                                                   cause distinct physical signals (Govaerts et al., 2002; Pereira
              Aerosol            MOSAIC
                                                                   et al., 1999).
                                                                      Understanding the saliency and persistence of signals is
                                                                   important for estimation of albedo change amplitude and fur-
the first 7 d were regarded as the model spin-up period for at-    ther analysis of its radiative and meteorological effects. The
mospheric chemistry, so as to allow the model to reach a state     signals of surface darkening were a relatively short duration
of statistical equilibrium under the applied forcing (Berge et     of about 1 week and much more sensitivity in shortwave
al., 2001; Lo et al., 2008).                                       near-infrared bands (Trigg and Flasse, 2000). Considering
   The main configurations for WRF-Chem physical and               higher resolution and better depiction of narrowband satel-
chemical processes in both CTL and ABD experiment are              lite observations, and the outstanding capacity of the near-
listed in Table 1. A new version of the rapid radiative transfer   infrared band to separate the signals between vegetation and
model for general circulation model applications (RRTMG)           charcoal (Jin and Roy, 2005; Trigg and Flasse, 2000), the
was employed to depict the radiative transfer process for          shortwave near-infrared band (0.84–0.87 µm) was chosen.
both shortwave and longwave radiation (Iacono et al., 2008;        Figure 1b and c show the surface albedo distribution before
Mlawer et al., 1997). The Noah land surface scheme (Ek et          and after the severe burning separately, based on the MODIS
al., 2003) was used to describe the land–atmosphere inter-         Surface Reflectance product (MOD09A1), which updates ev-
actions, implemented with the MYJ boundary Layer scheme            ery 8 d and has ruled out the interference of clouds. Data on
(Janjic, 1994) to describe the diurnal evolution of the planet     1 June have not been adopted because of too few valid data.
boundary layer (PBL). As for cloud and precipitation pro-          For the shortwave near-infrared band, the decrease induced
cesses, the new Grell–Freitas cumulus ensemble parameteri-         by fire is about 0.30 to 0.14, almost half of original values.
zation (Grell and Freitas, 2014) along with Lin microphysics       The immediate surface albedo decline after fire can be at-
(Lin et al., 1983) accounting for six forms of hydrometers         tributed to the large-scale replacement of ripe wheat with
was employed. Moreover, since the experiments were de-             black charcoal over fire-prone areas, so-called “burned scar”.
signed on the basis of MODIS products, the MODIS sur-              Char materials strongly absorb the incoming solar radiation,
face classification options of the International Geosphere–        causing a significant decline of the reflection-to-incoming-
Biosphere Programme (IGBP) was adopted to keep consis-             solar-radiation ratio (Veraverbeke et al., 2012), and this could
tency.                                                             disturb surface radiation balance at a level that cannot be ig-
                                                                   nored (Jin and Roy, 2005), which needs further exploration.
3     Results and discussion                                          The total satellite-detected fire counts with high-
                                                                   confidence from 24 May to 17 June, the highly inten-
3.1    Fire-induced surface albedo change                          sive straw burning period, are shown in Fig. 2a. Combined
                                                                   satellite-derived surface albedo changes of the same time pe-
In 2012, About 160 Tg of crop residue was burned, and 36 %         riod in the shortwave near-infrared broadband at fire loca-
of the total fires were recorded on farmland, the majority of      tions are shown in Fig. 2b. As illustrated, the fire counts are
which occurred in June, the harvest season for wheat (Li et        fairly concentrated, especially in the northern part of An-
al., 2016). YHR, the major wheat-producing area in China,          hui (AH) province, an agricultural area mainly dominated by
is located in the vast flat plain in eastern China. Figure 1a      winter wheat (Yan et al., 2006). Correspondingly, extensive
shows the daily number of satellite fire counts in YHR, where      negative values in Fig. 2b demonstrate substantial signals of
cropland, especially wheat, dominates the vegetation cover         surface albedo decline over fire-prone areas in June 2012. For
(Gong et al., 2019; Lei and Yuan, 2013; Van Der Werf et            the near-infrared broadband, the declines range from −0.16
al., 2010). The limited duration of agricultural fire combined     to −0.02. In addition, the surface albedo declines show ob-

Atmos. Chem. Phys., 20, 6177–6191, 2020                                              https://doi.org/10.5194/acp-20-6177-2020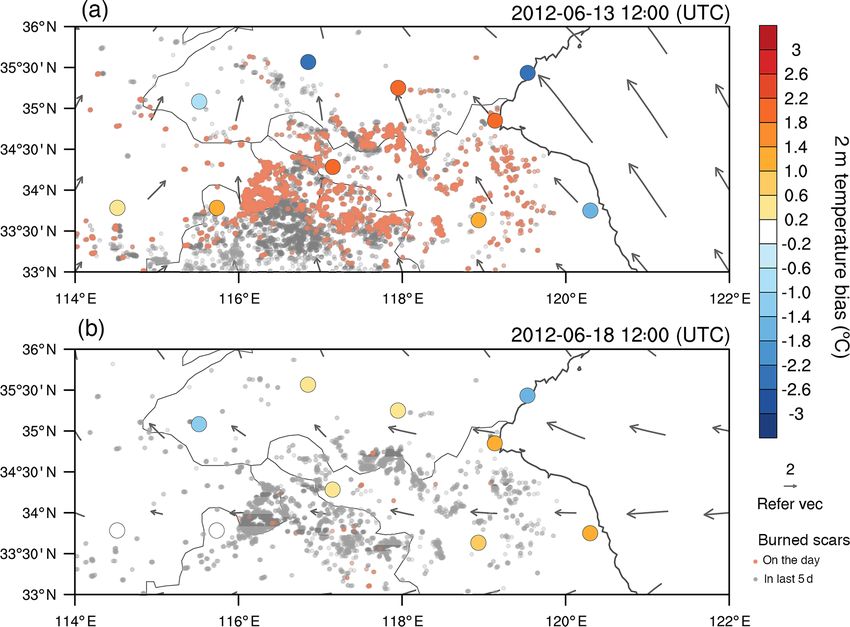
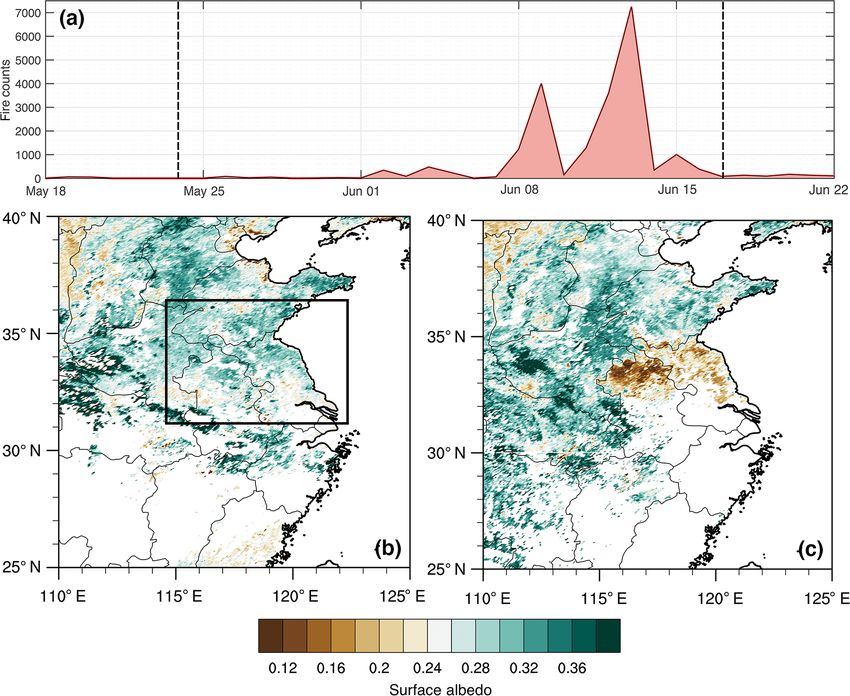
R. Tang et al.: Biomass-burning-induced surface darkening and its impact on regional meteorology                                      6181

Figure 1. (a) Daily number of satellite fire counts in the black-boxed zone marked in panel (b). Distribution of satellite-retrieved surface
albedo in the northern part of Anhui and Jiangsu provinces (b) on 24 May and (c) on 17 June in 2012. Note that the two dates are marked by
black dashed lines in panel (a).

vious spatial heterogeneity and have a larger decline margin            is in accordance with the spatial heterogeneity of fire in AH
in northern AH than Jiangsu (JS). The effect of fire surface            and JS. Peak values for the shortwave band are distributed
albedo is complex, determined by combustion completeness,               between −0.02 and −0.06, and for the near-infrared band be-
fire intensity, pre-fire land cover structure, and underlying           tween −0.06 and −0.10. Since nearly half of the solar energy
soil reflectance (Roy and Landmann, 2005). Here, the burn-              that reaches the surface is at wavelengths longer than 0.7 µm,
ing in AH was indeed more severe, which is consistent with              albedo change in the near-infrared band is rather significant
the satellite fire detection. Though the surface albedo prod-           for the energy budget of the surface (Hartmann, 1994). Con-
uct applied here has ruled out cloud interference, inevitable           sequently, to better characterize the surface albedo decline in
noise from cloud shadow still exists, as reflected in the scat-         aspects of both spatial distribution and scope in the severely
tered positive values in the north-western region in Fig. 2b.           burned area, the difference of the satellite-derived surface
   To better understand the signals of agricultural-fire-               albedo in the shortwave near-infrared band was adopted as
induced surface albedo decline and provide a basis for the              the albedo decline between the parallel experiments over fire-
following numerical experiments, frequency distributions of             prone areas.
surface albedo decline in the near-infrared (0.7–2.5 µm) and
short-wave (0.25–2.5 µm) broadband are shown in Fig. 3, to              3.2    Observational evidence on surface warming in the
clarify the magnitude of surface albedo decline. The sample                    post-fire period
size of fire counts is 9477 pixels, consistent with the sample
of those marked in Fig. 2a. Surface albedo change in most               Surface albedo is defined as the fraction of the downward
fire-affected pixel changes is distributed in the negative re-          solar flux density that is reflected by the surface, directly de-
gion, while the noise in the positive region corresponds to the         termining the absorptivity of the surface (Hartmann, 1994).
positive values in the north-western area in Fig. 2b owing to           In other words, when the flux of downward solar radiation
cloud shadows. The frequency distribution of both the near-             reaching the surface is the same, more solar radiation will be
infrared and shortwave broadband shows two apexes, which                absorbed by surface with decreased albedo. Without green

https://doi.org/10.5194/acp-20-6177-2020                                                   Atmos. Chem. Phys., 20, 6177–6191, 2020

6182                   R. Tang et al.: Biomass-burning-induced surface darkening and its impact on regional meteorology

                                                                       Figure 3. Frequency distributions of satellite-retrieved surface
                                                                       albedo changes in all pixels with highly confident satellite fire
                                                                       counts. Changes equal values on 17 June minus those on 24 May.
                                                                       The wavelength ranges of broadband “near IR” and “shortwave” are
Figure 2. (a) Accumulated satellite fire counts with high-confidence   0.7–2.5 µm and 0.25–2.5 µm, respectively.
from 24 May to 17 June in 2012. (b) Surface albedo changes for
the period by MOD09A1 over the corresponding burned area in
panel (a). Declines equal values on 17 June minus those on 24 May.     surface warming, extending especially in the downwind di-
Note that a certain uniform data interval was adopted considering      rection.
the dots’ density.
                                                                          In fact, intensive straw burning occurred in YHR every
                                                                       June, during the post-harvest period of wheat, over the past
                                                                       20 years before the launch of strict regulations in recent years
                                                                       (Li et al., 2016; Yin et al., 2019), which stress the signifi-
plants to photosynthesize over fire-prone areas, the immedi-           cance of understanding the signals of surface warming after
ate fire-induced increase in radiation absorption is used to           BB from the perspective of climatology.
heat the ground primarily and then warm the near-surface at-              Xuzhou (XZ) station (marked in Fig. 4), the only ra-
mosphere (Andrews, 2010; Wallace and Hobbs, 2006), lead-               diosonde observatory located in the most intensive fire-prone
ing to the signal of surface warming. What is more, straw              area in YHR. The radiosonde observations at XZ from 2007
burning in YHR bursts in summer, when solar radiation is               to 2015 were compared with FNL data in the PBL. The sam-
the strongest and the response of surface albedo can be the            ple of days was selected out according to burning conditions
fiercest. Hence, the air temperature observations over fire-           in each year and has been classified into specific statuses:
prone areas after BB were investigated.                                pre-fire and post-fire. Post-fire days must be within 5 d after
    Near-surface air temperature observations at meteorolog-           a severe burning, while pre-fire days must be among the 5 d
ical sites were compared with FNL data in 2012. Refer to               before fire but not within 5 d after a previous fire. Only days
Fig. 1a: burning in YHR is the most severe on 13 June, while           under clear-sky conditions were selected. The statistical dis-
18 June is the end date of the wheat straw burning “season”            tribution of temperature bias on different isobaric levels at
in 2012. Temperature bias at 2 m height in the observational           20:00 LT in the two statuses is shown in Fig. 5a and b. Tem-
network at 20:00 LT on 13 and 18 June is shown in Fig. 4,              perature bias was defined as the value of radiosonde observa-
filled according to the value of observation minus FNL. In             tion minus FNL data. As illustrated, temperature biases are
addition, fire counts on the day and accumulated during the            mostly positive on the lower levels in both two statuses, and
past 5 d, so-called burned scars, are marked. The scattered            absolute values of post-fire are larger than pre-fire. Combined
positive values of temperature bias in Fig. 4 show that obser-         with Fig. 5c, this means observations post-fire have a bigger
vational temperature at those sites is higher than predictions         positive deviation from forecast results, a signal of abnormal
from the forecast model with only a small fraction of assim-           warming post-fire. In addition, with regards to the vertical
ilated observations. Most sites around intensive burned scars          profile of bias post-fire (Fig. 5b), deviations on lower lev-
shows a positive deviation, which is an abnormal signal of             els tend to be bigger and more positive than those on higher

Atmos. Chem. Phys., 20, 6177–6191, 2020                                                  https://doi.org/10.5194/acp-20-6177-2020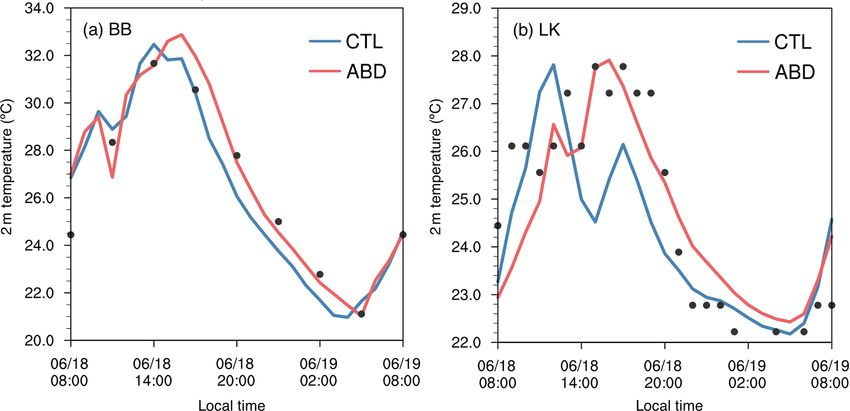
R. Tang et al.: Biomass-burning-induced surface darkening and its impact on regional meteorology                                        6183

Figure 4. Temperature bias at 2 m height (colour-filled circles) between FNL analysis data and station observations (OBS) in YHR (a) on
13 June 2012 and (b) on 18 June 2012 at 20:00 LT. Bias is defined as the value of OBS minus FNL. Grey arrows mark the 10 m wind field in
FNL. Grey dots mark the “burned scars”, which are defined as accumulated fire counts in the past 5 d. Orange dots mark fire counts on the
day. Note that the small black box in panel (a) marks the location of XZ (Xuzhou).

Figure 5. Temperature bias on isobaric levels between FNL analysis data and radiosonde observations (OBS) at 20:00 LT at XZ (Xuzhou)
on clear-sky days before and after BB in June 2007–2015: (a) pre-fire and (b) post-fire. Black circles mark the original value of temperature
bias (OBS−FNL); the dash line marks zero; and the five curves of filled parts are the 10th, 25th, 75th, and 90th percentile and the average
line in proper order. Bars in panel (c) are the mean value at separate levels, and the curve is the corresponding bias between “post-fire” and
“pre-fire”. Note that the small black box in Fig. 4a marks the location of XZ (Xuzhou).

levels. A larger absolute value of deviation means lower pre-            of absorbed radiation during the daytime, the change of ther-
dictability of temperature post-fire. Radiosonde data update             mal states near the ground level can be notable by 20:00 LT.
2 times a day, at 08:00 and 20:00 LT, and only patterns at               The abnormal warming signal tends to be more obvious near
20:00 LT are shown here since no significant difference ex-              the surface, which can be explained by the enhancement of
ists between the two statuses at 08:00 LT. After accumulation            surface heat absorptivity caused by decreased surface albedo.

https://doi.org/10.5194/acp-20-6177-2020                                                    Atmos. Chem. Phys., 20, 6177–6191, 2020
6184 R. Tang et al.: Biomass-burning-induced surface darkening and its impact on regional meteorology
gions with large-scale BB events. Hence, WRF-Chem exper-
iments targeting surface albedo change induced by agricul-
tural BB in eastern China were conducted. The most severe
episode, which happened in June 2012, was selected as the
case. Surface albedo set in the two parallel experiments, CTL
and ABD, is shown in Fig. 7a and b. Figure 7c shows the sur-
face albedo difference between the two experiments, which
is defined as the difference between MODIS-detect surface
albedo post-fire (17 June) and pre-fire (24 May) in each grid.
Model results were compared with site observational air tem-
perature in concentrated fire-prone areas (Fig. 8a) and their
southern adjacent area, YRD (Fig. 8b). In Fig. 8, the ABD
experiment shows an increase in temperature and enjoys a
better fit with observations at both sites in the afternoon
and evening compared to the CTL experiment. Temperature
anomalies can be simulated to some extent, after considering
Figure 6. Temperature bias at 2 m height, defined as the value the decreased surface albedo caused by BB.
of OBS minus FNL, at stations over fire-prone areas at 08:00, The local surface energy budget at Bengbu is shown in
14:00, 20:00, and 02:00 LT under clear-sky conditions pre/post-fire Fig. 9. Bengbu is located in the fire-affected area with de-
in 2007–2015.
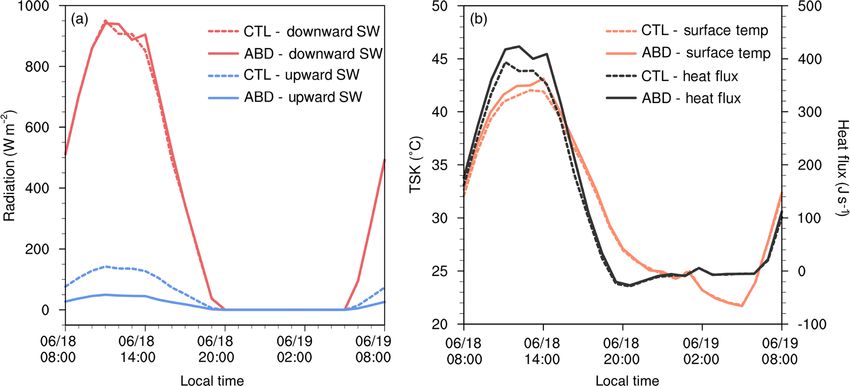
creased albedo. As shown in Fig. 9a, upward shortwave ra-
diation at the surface reduces a lot, while only a little change
For the same sample of days in 2007–2015, the diurnal exists in downward shortwave radiation reaching the surface.
variation of 2 m temperature bias between site observations The smaller ratio of solar radiation reflected to the atmo-
and FNL in the two statuses is shown in Fig. 6. Negative val- sphere by the surface can be attributed to surface albedo de-
ues of deviation at 08:00 and 14:00 LT show that FNL tends cline. Accordingly, with more solar radiation absorbed by
to overestimate temperature during daytime and underesti- the surface, the ground will be heated and the surface tem-
mate at night. It is noteworthy that the absolute values of perature will be higher in the ABD experiment (Fig. 9b).
deviations post-fire are always larger than those pre-fire no Higher surface temperature would give rise to larger upward
matter during the day or night. With regard to the median val- heat flux, thereby heating the atmosphere near the surface
ues, deviations post-fire gradually surpass over those pre-fire by vertical mixing (Stull, 1988). So the local radiation bud-
between 14:00 and 20:00 LT, consistent with the warming get change induced by surface albedo change would directly
signal revealed by radiosonde analysis at 20:00 LT. The con- influence the near-surface air temperature and cause an ab-
tinuous uptrend during the daytime demonstrates a needed normal warming signal over fire-prone areas in the afternoon
response time of heat accumulation, which may be attributed and evening with a certain lag.
to the radiative effect of surface darkening (Andrews, 2010; Meanwhile, the temperature influence of fire-induced
Myhre et al., 2005). Thus, the signal of abnormal warming albedo change is also obvious in adjacent areas like LK
becomes more apparent between 14:00 and 20:00 LT, with (Lukou) (Fig. 8b), located in YRD. Some other stations in
the gradual accumulation process. YRD also show similar patterns. Local temperature can be
affected by various factors such as local radiation budget
3.3 Improved temperature simulation by considering change and advection transport caused by thermal distur-
surface albedo change bance. As illustrated in Fig. 10a, surface warming shows up
in the upwind area of LK station, which indicates influence of
As mentioned earlier, fire-induced surface albedo change and warm advection. According to Fig. 10b and c, sharp decrease
observational evidence of abnormal surface warming were in low cloud water contents was found in the upwind area in
substantial in eastern China. However, the radiative effects the ABD experiment. Low clouds, effective reflectors of so-
on meteorology and the underlying physical images of sur- lar radiation (Hartmann, 1994), would cause large perturba-
face warming have not been figured out yet, which should tions to the surface radiation budget. In Fig. 10d, downward
resort to model simulation. In existing studies, radiative ef- shortwave radiation reaching the surface in the ABD experi-
fects of albedo changes over burned scars were investigated ment reduces quit a lot due to reflection and occlusion of low
on land covers like boreal forests (Lyons et al., 2008) and sa- clouds. The additional heat by decreased albedo over fire-
vannas (Jin and Roy, 2005; Myhre et al., 2005), but few of prone areas would increase the surface temperature, change
them were conducted on open agricultural fire in farmlands. both sensible heat flux and latent heat flux, and then change
Exploration into the disturbance of surface albedo decline the vertical velocity in the boundary layer and even disturb
induced by agricultural BB using model simulation can be the process of cloud formation (Stull, 1988). Thus, surface
meaningful for improving weather and climate forecast of re- albedo declines near fire locations also have great impacts on
Atmos. Chem. Phys., 20, 6177–6191, 2020 https://doi.org/10.5194/acp-20-6177-2020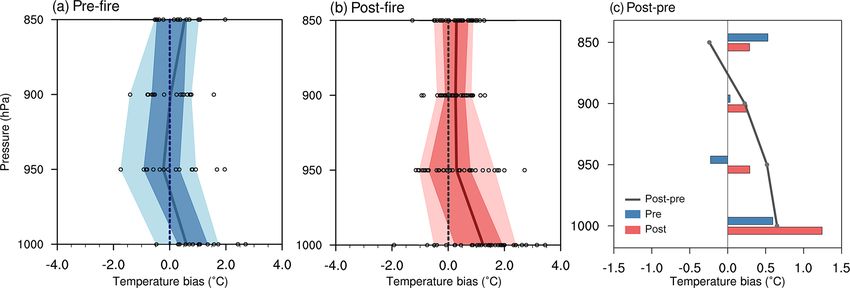
R. Tang et al.: Biomass-burning-induced surface darkening and its impact on regional meteorology                                6185

Figure 7. Surface albedo distribution in experiments (a) CTL and (b) ABD, and (c) difference between the parallel ones (ABD−CTL). Note
that the region in panel (c) corresponds to the black box in panel (b).

Figure 8. Simulated and observed 2 m temperature at meteorological stations (a) BB (Bengbu) and (b) LK (Lukou) on 18 June 2012. Note
that locations of BB (Bengbu) and LK (Lukou) are marked in Fig. 7c.

areas where surface albedo was barely changed, by distur-            albedo change and temperature anomalies was conducted
bance to cloud formation and advection transmission.                 based on meteorological observations and satellite retrievals,
   These burned scars can remain over the surface for about          combined with WRF-Chem simulations. This study focuses
1 week under rainy conditions, or even longer if dryer and           on the intensive wheat straw burning that occurred every
calmer (Trigg and Flasse, 2000). The length of the period            early summer in the YHR area, the major wheat-producing
allows for the process of local radiative accumulation and           area in eastern China. A typical and severe burning episode
disturbance in regional circulation, and it influences the tem-      in 2012 was chosen to be the study case.
perature over both fire-prone areas and adjacent areas.                 Fire-induced surface darkening over fire-prone areas was
                                                                     verified based on satellite retrievals. A large area of surface
                                                                     albedo decline is shown over fire-prone areas in YHR. It also
4   Conclusions                                                      shows obvious spatial heterogeneity and has a larger decline
                                                                     margin in AH, where fire counts are more concentrated and
To figure out surface albedo change induced by biomass               the burning is much more severe. For the near-infrared broad-
burning and its impact on regional meteorology in eastern            band, the absolute surface albedo decline ranges from −0.16
China, an investigation into the relationship between surface

https://doi.org/10.5194/acp-20-6177-2020                                               Atmos. Chem. Phys., 20, 6177–6191, 2020
6186                  R. Tang et al.: Biomass-burning-induced surface darkening and its impact on regional meteorology

Figure 9. Thermal physical quantities at surface level on 18 June 2012 in experiments CTL and ABD. (a) Downward and upward shortwave
radiation. (b) Surface temperature and upward heat flux.

Figure 10. (a) Average 10 m wind field in ABD and difference of 2 m temperature between ABD and CTL (ABD−CTL) during the afternoon
(12:00–17:00 LT) on 18 June. (b) Average difference in low cloud water contents between ABD and CTL (ABD−CTL). (c) Vertical profile of
cloud water content during the afternoon (12:00–17:00 LT) and (d) shortwave radiation and upward heat flux averaged in the region marked
by the red rectangle in panel (b) on 18 June.

Atmos. Chem. Phys., 20, 6177–6191, 2020                                                  https://doi.org/10.5194/acp-20-6177-2020
R. Tang et al.: Biomass-burning-induced surface darkening and its impact on regional meteorology                                   6187

to −0.02, which can be an obvious signal on a regional scale          Competing interests. The authors declare that they have no conflict
and cause large radiative disturbance. Peak values of reduc-          of interest.
tion in the shortwave broadband (0.7–2.5 µm) range between
−0.06 and −0.02, and those in the near-infrared broadband
(0.25–2.5 µm) range between −0.10 and −0.06.                          Acknowledgements. The numerical modelling was conducted on
   Evidence of abnormal surface warming was found in east-            computing facilities at the High Performance Computing Centering
ern China. Most sites around intensive burned scars show a            (HPCC) at Nanjing University.
positive deviation in June 2012, an abnormal signal of sur-
face warming which extends especially in the downwind di-
                                                                      Financial support. This research has been supported by the Na-
rection. Comparisons were made between the statuses of pre-
                                                                      tional Natural Science Foundation of China (grant nos. 91544231,
fire and post-fire under clear-sky conditions, based on multi-        41922038, 91744311, and 41422504) and the International Cooper-
year temperature observations from 2007 to 2015. Observa-             ation project of Jiangsu Provincial Science and Technology Agency
tions post-fire have a bigger positive deviation from fore-           (BZ2017066).
cast results at 20:00 LT, especially on lower levels. This kind
of abnormal surface warming signal post-fire will lead to
lower predictability of temperature. In terms of diurnal vari-        Review statement. This paper was edited by Leiming Zhang and
ation, the signal becomes more apparent between 14:00 and             reviewed by three anonymous referees.
20:00 LT, with the accumulation of absorbed radiation.
   To explore the direct radiative effects and the potential
regional meteorological impacts of surface albedo change,             References
WRF-Chem experiments targeting the surface albedo change
induced by agricultural BB in eastern China were carried              Abatzoglou, J. T. and Williams, A. P.: Impact of anthro-
out. The ABD experiment shows an increase in tempera-                   pogenic climate change on wildfire across western US
ture and enjoys a better fit with observations in concentrated          forests, P. Natl. Acad. Sci. USA, 113, 11770–11775,
fire-prone areas and its southern adjacent area compared to             https://doi.org/10.1073/pnas.1607171113, 2016.
CTL, especially in the afternoon and evening. Surface albedo          Amiro, B. D., Orchansky, A. L., Barr, A. G., Black, T. A.,
                                                                        Chambers, S. D., Chapin Iii, F. S., Goulden, M. L., Litvak,
change over fire-prone areas influences the surface tempera-
                                                                        M., Liu, H. P., McCaughey, J. H., McMillan, A., and Ran-
ture through both direct local radiation budget change and
                                                                        derson, J. T.: The effect of post-fire stand age on the bo-
indirect disturbance in cloud formation and advection trans-            real forest energy balance, Agr. Forest Meteorol., 140, 41–50,
mission.                                                                https://doi.org/10.1016/j.agrformet.2006.02.014, 2006.
   This study shows that either human or naturally induced            Andreae, M. O.: Biomass burning – its history, use, and distribu-
biomass burning will not only influence the weather and re-             tion and its impact on environmental-quality and global climate,
gional climate by emission of aerosols and trace gases. The             Global Biomass Burning: Atmospheric, Climatic, and Biospheric
change in surface albedo could also cause significant impacts           Implications, edited by: Levine, J. S., MIT Press, Cambridge,
at a regional scale during the post-fire periods, particular in         USA, 3–21, 1991.
regions with strong solar radiation. This kind of short-term          Andreae, M. O. and Merlet, P.: Emission of trace gases and aerosols
disturbance should be considered in future weather, climate,            from biomass burning, Global Biogeochem. Cy., 15, 955–966,
                                                                        https://doi.org/10.1029/2000gb001382, 2001.
and air quality forecast models.
                                                                      Andrews, D. G.: An Introduction to Atmospheric Physics, Cam-
                                                                        bridge University Press, UK, 2010.
                                                                      Berge, E., Huang, H. C., Chang, J., and Liu, T. H.: A study
Data availability. Meteorological datasets used in this work can        of the importance of initial conditions for photochemical ox-
be acquired from https://rda.ucar.edu/datasets/ds083.2/ (National       idant modeling, J. Geophys. Res.-Atmos., 106, 1347–1363,
Centers for Environmental Prediction et al., 2000), http://weather.     https://doi.org/10.1029/2000jd900227, 2001.
uwyo.edu/upperair/sounding.html (University of Wyoming, 2019),        Beringer, J., Hutley, L. B., Tapper, N. J., Coutts, A., Kerley, A.,
and https://www7.ncdc.noaa.gov/CDO/cdoselect.cmd (Smith et al.,         and O’Grady, A. P.: Fire impacts on surface heat, moisture and
2011). The MODIS dataset can be obtained from the Level-1 and           carbon fluxes from a tropical savanna in northern Australia, Int.
Atmosphere Archive & Distribution System (LAADS) Distributed            J. Wildland Fire, 12, 333–340, https://doi.org/10.1071/wf03023,
Active Archive Center (DAAC), located in the Goddard Space              2003.
Flight Center in Greenbelt, Maryland (https://ladsweb.nascom.nasa.    Bowman, D. and Panton, W. J.: Fire and cyclone dam-
gov; Giglio and Justice, 2015a, b; Vermote, 2015).                      age to woody vegetation on the north coast of the
                                                                        northern-territory, australia, Aust. Geogr., 25, 32–35,
                                                                        https://doi.org/10.1080/00049189408703096, 1994.
Author contributions. RT and XH led the manuscript writing. RT        Bremer, D. J. and Ham, J. M.: Effect of spring burning on the sur-
and DZ conducted the data analysis and model simulations. AD            face energy balance in a tallgrass prairie, Agr. Forest Meteo-
contributed to the research design.                                     rol., 97, 43–54, https://doi.org/10.1016/s0168-1923(99)00034-9,
                                                                        1999.

https://doi.org/10.5194/acp-20-6177-2020                                                Atmos. Chem. Phys., 20, 6177–6191, 2020
6188 R. Tang et al.: Biomass-burning-induced surface darkening and its impact on regional meteorology Certini, G.: Effects of fire on properties of forest soils: a review, Fearnside, P. M.: Greenhouse gas emissions from land-use change Oecologia, 143, 1–10, https://doi.org/10.1007/s00442-004-1788- in Brazil’s Amazon region, Global Climate Change and Tropical 8, 2005. Ecosystems, edited by: Lal, R., Kimble, J. M., and Stewart, B. A., Chan, C. K. and Yao, X.: Air pollution in mega Crc Press-Taylor & Francis Group, Boca Raton, USA, 231–249, cities in China, Atmos. Environ., 42, 1–42, 2000. https://doi.org/10.1016/j.atmosenv.2007.09.003, 2008. Gao, M., Ji, D. S., Liang, F. C., and Liu, Y.: Attribu- Chang, D. and Song, Y.: Comparison of L3JRC and MODIS global tion of aerosol direct radiative forcing in China and In- burned area products from 2000 to 2007, J. Geophys. Res., 114, dia to emitting sectors, Atmos. Environ., 190, 35–42, D16106, https://doi.org/10.1029/2008jd011361, 2009. https://doi.org/10.1016/j.atmosenv.2018.07.011, 2018. Chang, D. and Song, Y.: Estimates of biomass burning emis- Gao, X.: Analysis on the Current Status of Utilization of Crop Straw sions in tropical Asia based on satellite-derived data, Atmos. in China, Journal of Huazhong Agricultural, 354, 4031–4036, Chem. Phys., 10, 2335–2351, https://doi.org/10.5194/acp-10- 2002. 2335-2010, 2010. Gatebe, C. K., Ichoku, C. M., Poudyal, R., Román, M. O., Chen, J. M., Li, C. L., Ristovski, Z., Milic, A., Gu, Y. T., Islam, and Wilcox, E.: Surface albedo darkening from wildfires in M. S., Wang, S. X., Hao, J. M., Zhang, H. F., He, C. R., Guo, northern sub-Saharan Africa, Environ. Res. Lett., 9, 065003, H., Fu, H. B., Miljevic, B., Morawska, L., Thai, P., Fat, L., https://doi.org/10.1088/1748-9326/9/6/065003, 2014. Pereira, G., Ding, A. J., Huang, X., and Dumka, U. C.: A re- Giglio, L. and Justice, C.: Aqua/MODIS Level-3 Thermal Anoma- view of biomass burning: Emissions and impacts on air quality, lies/Fire Daily Global 1km SIN Grid, NASA Level-1 and Atmo- health and climate in China, Sci. Total Environ., 579, 1000–1034, sphere Archive & Distribution System (LAADS) Distributed Ac- https://doi.org/10.1016/j.scitotenv.2016.11.025, 2017. tive Archive Center (DAAC), G. S. F. C., Greenbelt, MD, USA, Crutzen, P. J. and Andreae, M. O.: Biomass burning 2015a. in the tropics – impact on atmospheric chemistry Giglio, L. and Justice, C.: Terra/MODIS Level-3 Thermal Anoma- and biogeochemical cycles, Science, 250, 1669–1678, lies/Fire Daily Global 1km SIN Grid, NASA Level-1 and Atmo- https://doi.org/10.1126/science.250.4988.1669, 1990. sphere Archive & Distribution System (LAADS) Distributed Ac- Crutzen, P. J., Heidt, L. E., Krasnec, J. P., Pollock, W. H., and tive Archive Center (DAAC), G. S. F. C., Greenbelt, MD, USA, Seiler, W.: Biomass burning as a source of atmospheric gases 2015b. CO, H2 , N2 O, NO, CH3 Cl and COS, Nature, 282, 253–256, Giglio, L., Loboda, T., Roy, D. P., Quayle, B., and Justice, C. https://doi.org/10.1038/282253a0, 1979. O.: An active-fire based burned area mapping algorithm for Ding, A. J., Fu, C. B., Yang, X. Q., Sun, J. N., Petäjä, T., Kerminen, the MODIS sensor, Remote Sens. Environ., 113, 408–420, V.-M., Wang, T., Xie, Y., Herrmann, E., Zheng, L. F., Nie, W., https://doi.org/10.1016/j.rse.2008.10.006, 2009. Liu, Q., Wei, X. L., and Kulmala, M.: Intense atmospheric pol- Giglio, L., Randerson, J. T., and van der Werf, G. R.: Analy- lution modifies weather: a case of mixed biomass burning with sis of daily, monthly, and annual burned area using the fourth- fossil fuel combustion pollution in eastern China, Atmos. Chem. generation global fire emissions database (GFED4), J. Geophys. Phys., 13, 10545–10554, https://doi.org/10.5194/acp-13-10545- Res.-Biogeo., 118, 317–328, https://doi.org/10.1002/jgrg.20042, 2013, 2013a. 2013. Ding, A. J., Fu, C. B., Yang, X. Q., Sun, J. N., Zheng, L. F., Xie, Giglio, L., Schroeder, W., and Justice, C. O.: The col- Y. N., Herrmann, E., Nie, W., Petäjä, T., Kerminen, V.-M., and lection 6 MODIS active fire detection algorithm and Kulmala, M.: Ozone and fine particle in the western Yangtze fire products, Remote Sens. Environ., 178, 31–41, River Delta: an overview of 1 yr data at the SORPES station, At- https://doi.org/10.1016/j.rse.2016.02.054, 2016. mos. Chem. Phys., 13, 5813–5830, https://doi.org/10.5194/acp- Gong, P., Liu, H., Zhang, M. N., Li, C. C., Wang, J., Huang, H. 13-5813-2013, 2013b. B., Clinton, N., Ji, L. Y., Li, W. Y., Bai, Y., Chen, B., Xu, B., Ding, A. J., Huang, X., Nie, W., Sun, J. N., Kerminen, V. M., Petäjä, Zhu, Z., Yuan, C., Ping Suen, H., Guo, J., Xu, N., Li, W., Zhao, T., Su, H., Cheng, Y. F., Yang, X. Q., Wang, M. H., Chi, X. G., Y., Yang, J. N., Yu, C., Wang, X., Fu, H., Yu, L., Dronova, Wang, J. P., Virkkula, A., Guo, W. D., Yuan, J., Wang, S. Y., I., Hui, F., Cheng, X., Shi, X., Xiao, F., Liu, Q. F., and Song, Zhang, R. J., Wu, Y. F., Song, Y., Zhu, T., Zilitinkevich, S., Kul- L. C.: Stable classification with limited sample: transferring a mala, M., and Fu, C. B.: Enhanced haze pollution by black car- 30-m resolution sample set collected in 2015 to mapping 10-m bon in megacities in China, Geophys. Res. Lett., 43, 2873–2879, resolution global land cover in 2017, Sci. Bull., 64, 370–373, https://doi.org/10.1002/2016gl067745, 2016. https://doi.org/10.1016/j.scib.2019.03.002, 2019. Duncan, B. N., Martin, R. V., Staudt, A. C., Yevich, R., and Logan, Govaerts, Y. M., Pereira, J. M., Pinty, B., and Mota, J. A.: Interannual and seasonal variability of biomass burning B.: Impact of fires on surface albedo dynamics over emissions constrained by satellite observations, J. Geophys. Res., the African continent, J. Geophys. Res., 107, 4629, 108, 4100, https://doi.org/10.1029/2002jd002378, 2003. https://doi.org/10.1029/2002jd002388, 2002. Ek, M. B., Mitchell, K. E., Lin, Y., Rogers, E., Grunmann, P., Ko- Grell, G. A. and Freitas, S. R.: A scale and aerosol aware ren, V., Gayno, G., and Tarpley, J. D.: Implementation of Noah stochastic convective parameterization for weather and air land surface model advances in the National Centers for Environ- quality modeling, Atmos. Chem. Phys., 14, 5233–5250, mental Prediction operational mesoscale Eta model, J. Geophys. https://doi.org/10.5194/acp-14-5233-2014, 2014. Res.-Atmos., 108, 8851, https://doi.org/10.1029/2002jd003296, Grell, G. A., Peckham, S. E., Schmitz, R., McKeen, S. A., Frost, G., 2003. Skamarock, W. C., and Eder, B.: Fully coupled “online” chem- Atmos. Chem. Phys., 20, 6177–6191, 2020 https://doi.org/10.5194/acp-20-6177-2020
R. Tang et al.: Biomass-burning-induced surface darkening and its impact on regional meteorology                                         6189

   istry within the WRF model, Atmos. Environ., 39, 6957–6975,             Suttie, M., and van der Werf, G. R.: Biomass burning emis-
   https://doi.org/10.1016/j.atmosenv.2005.04.027, 2005.                   sions estimated with a global fire assimilation system based
Hansen, J., Mki, S., Ruedy, R., Nazarenko, L., Lacis, A., Schmidt,         on observed fire radiative power, Biogeosciences, 9, 527–554,
   G., Russell, G., Aleinov, I., Bauer, M., Bauer, S., Bell, N.,           https://doi.org/10.5194/bg-9-527-2012, 2012.
   Cairns, B., Canuto, V., Chandler, M., Cheng, Y., Delgenio,           Langmann, B., Duncan, B., Textor, C., Trentmann, J., and Van
   A., Faluvegi, G., Fleming, E., Friend, A., and Zhang, S.: Ef-           Der Werf, G. R.: Vegetation fire emissions and their impact
   ficacy of climate forcings, J. Geophys. Res., 110, D18104,              on air pollution and climate, Atmos. Environ., 43, 107–116,
   https://doi.org/10.1029/2005JD005776, 2005.                             https://doi.org/10.1016/j.atmosenv.2008.09.047, 2009.
Hao, W. M. and Liu, M.: Spatial and temporal distribution of            Laurent, P., Mouillot, F., Moreno, M. V., Yue, C., and Ciais,
   tropical biomass burning, Global Biogeochem. Cy., 8, 495–503,           P.: Varying relationships between fire radiative power and
   https://doi.org/10.1029/94gb02086, 1994.                                fire size at a global scale, Biogeosciences, 16, 275–288,
Hartmann, D. L.: Global Physical Climatology, Phys. Sci., Aca-             https://doi.org/10.5194/bg-16-275-2019, 2019.
   demic Press, America, Cambridge, Massachusetts, USA, 1994.           Lei, L. G. and Yuan, H. M.: China Agricultural Statistical Yearbook
Hawbaker, T. J., Radeloff, V. C., Syphard, A. D., Zhu, Z. L., and          2013, China Agricultural Press, Beijing, China, 2013.
   Stewart, S. I.: Detection rates of the MODIS active fire product     Li, J., Bo, Y., and Xie, S. D.: Estimating emissions from
   in the United States, Remote Sens. Environ., 112, 2656–2664,            crop residue open burning in China based on statistics
   https://doi.org/10.1016/j.rse.2007.12.008, 2008.                        and MODIS fire products, J. Environ. Sci., 44, 158–170,
Haywood, J. M. and Ramaswamy, V.: Global sensitivity studies               https://doi.org/10.1016/j.jes.2015.08.024, 2016.
   of the direct radiative forcing due to anthropogenic sulfate and     Li, M., Zhang, Q., Kurokawa, J.-I., Woo, J.-H., He, K., Lu, Z.,
   black carbon aerosols, J. Geophys. Res.-Atmos., 103, 6043–              Ohara, T., Song, Y., Streets, D. G., Carmichael, G. R., Cheng,
   6058, https://doi.org/10.1029/97jd03426, 1998.                          Y., Hong, C., Huo, H., Jiang, X., Kang, S., Liu, F., Su, H.,
He, L. M., Wang, W. J., Wang, Q., Wei, B., Li, Q., Wang, C. Z.,            and Zheng, B.: MIX: a mosaic Asian anthropogenic emission
   and Liu, X. M.: Evaluation of the Agricultural Residues Burning         inventory under the international collaboration framework of
   Reduction in China Using MODIS Fire Product, Environmental              the MICS-Asia and HTAP, Atmos. Chem. Phys., 17, 935–963,
   Monitoring in China, 23, 42–50, 2007.                                   https://doi.org/10.5194/acp-17-935-2017, 2017.
Hobbs, P. V., Reid, J. S., Kotchenruther, R. A., Ferek, R. J., and      Liang, S. L.: Narrowband to broadband conversions of land
   Weiss, R.: Direct radiative forcing by smoke from biomass burn-         surface albedo I, Remote Sens. Environ., 76, 213–238,
   ing, Science, 275, 1776–1778, 1997.                                     https://doi.org/10.1016/s0034-4257(00)00205-4, 2001.
Huang, X., Li, M. M., Li, J. F., and Song, Y.: A high-resolution        Liang, S. L., Shuey, C. J., Russ, A. L., Fang, H. L., Chen, M. Z.,
   emission inventory of crop burning in fields in China based on          Walthall, C. L., Daughtry, C. S. T., and Hunt, R.: Narrowband to
   MODIS Thermal Anomalies/Fire products, Atmos. Environ., 50,             broadband conversions of land surface albedo: II. Validation, Re-
   9–15, https://doi.org/10.1016/j.atmosenv.2012.01.017, 2012a.            mote Sens. Environ., 84, 25–41, https://doi.org/10.1016/s0034-
Huang, X., Song, Y., Li, M. M., Li, J. F., and Zhu, T.: Harvest sea-       4257(02)00068-8, 2003.
   son, high polluted season in East China, Environ. Res. Lett., 7,     Lin, Y. L., Farley, R. D., and Orville, H. D.: Bulk Parame-
   044033, https://doi.org/10.1088/1748-9326/7/4/044033, 2012b.            terization Of The Snow Field In A Cloud Model, J. Clim.
Huang, X., Ding, A., Liu, L., Liu, Q., Ding, K., Niu, X., Nie, W.,         Appl. Meteorol., 22, 1065–1092, https://doi.org/10.1175/1520-
   Xu, Z., Chi, X., Wang, M., Sun, J., Guo, W., and Fu, C.: Effects        0450(1983)0222.0.Co;2, 1983.
   of aerosol–radiation interaction on precipitation during biomass-    Lo, J. C. F., Yang, Z. L., and Pielke, R. A.: Assessment of three
   burning season in East China, Atmos. Chem. Phys., 16, 10063–            dynamical climate downscaling methods using the Weather Re-
   10082, https://doi.org/10.5194/acp-16-10063-2016, 2016.                 search and Forecasting (WRF) model, J. Geophys. Res.-Atmos.,
Huang, X., Wang, Z. L., and Ding, A. J.: Impact of Aerosol-                113, D09112, https://doi.org/10.1029/2007jd009216, 2008.
   PBL Interaction on Haze Pollution: Multiyear Observational Ev-       Lu, B., Kong, S. F., Han, B., Wang, X. Y., and Bai, Z. P.: Inventory
   idences in North China, Geophys. Res. Lett., 45, 8596–8603,             of atmospheric pollutants discharged from biomass burning in
   https://doi.org/10.1029/2018gl079239, 2018.                             China continent in 2007, China Environmental Science, 31, 186–
Iacono, M. J., Delamere, J. S., Mlawer, E. J., Shephard, M.                194, 2011.
   W., Clough, S. A., and Collins, W. D.: Radiative forcing             Lyons, E. A., Jin, Y. F., and Randerson, J. T.: Changes in surface
   by long-lived greenhouse gases: Calculations with the AER               albedo after fire in boreal forest ecosystems of interior Alaska
   radiative transfer models, J. Geophys. Res., 113, D13103,               assessed using MODIS satellite observations, J. Geophys. Res.-
   https://doi.org/10.1029/2008jd009944, 2008.                             Biogeo., 113, G02012, https://doi.org/10.1029/2007jg000606,
Janjic, Z. I.: The Step-Mountain Eta Coordinate Model                      2008.
   – Further Developments Of The Convection, Viscous                    Marlon, J. R., Bartlein, P. J., Carcaillet, C., Gavin, D. G., Harri-
   Sublayer, And Turbulence Closure Schemes, Mon.                          son, S. P., Higuera, P. E., Joos, F., Power, M. J., and Prentice, I.
   Weather Rev., 122, 927–945, https://doi.org/10.1175/1520-               C.: Erratum: Climate and human influences on global biomass
   0493(1994)1222.0.Co;2, 1994.                               burning over the past two millennia, Nat. Geosci., 2, 307–307,
Jin, Y. and Roy, D. P.: Fire-induced albedo change and its radiative       https://doi.org/10.1038/ngeo468, 2009.
   forcing at the surface in northern Australia, Geophys. Res. Lett.,   Mlawer, E. J., Taubman, S. J., Brown, P. D., Iacono, M.
   32, L13401, https://doi.org/10.1029/2005gl022822, 2005.                 J., and Clough, S. A.: Radiative transfer for inhomoge-
Kaiser, J. W., Heil, A., Andreae, M. O., Benedetti, A., Chubarova,         neous atmospheres: RRTM, a validated correlated-k model for
   N., Jones, L., Morcrette, J.-J., Razinger, M., Schultz, M. G.,

https://doi.org/10.5194/acp-20-6177-2020                                                   Atmos. Chem. Phys., 20, 6177–6191, 2020
You can also read