A metabolomics comparison of plant based meat and grass fed meat indicates large nutritional differences despite comparable Nutrition Facts panels
←
→
Page content transcription
If your browser does not render page correctly, please read the page content below
www.nature.com/scientificreports
OPEN A metabolomics comparison
of plant‑based meat and grass‑fed
meat indicates large nutritional
differences despite comparable
Nutrition Facts panels
Stephan van Vliet1*, James R. Bain1, Michael J. Muehlbauer1, Frederick D. Provenza2,
Scott L. Kronberg3, Carl F. Pieper1 & Kim M. Huffman1
A new generation of plant-based meat alternatives—formulated to mimic the taste and nutritional
composition of red meat—have attracted considerable consumer interest, research attention, and
media coverage. This has raised questions of whether plant-based meat alternatives represent proper
nutritional replacements to animal meat. The goal of our study was to use untargeted metabolomics
to provide an in-depth comparison of the metabolite profiles a popular plant-based meat alternative
(n = 18) and grass-fed ground beef (n = 18) matched for serving size (113 g) and fat content (14 g).
Despite apparent similarities based on Nutrition Facts panels, our metabolomics analysis found
that metabolite abundances between the plant-based meat alternative and grass-fed ground beef
differed by 90% (171 out of 190 profiled metabolites; false discovery rate adjusted p < 0.05). Several
metabolites were found either exclusively (22 metabolites) or in greater quantities in beef (51
metabolites) (all, p < 0.05). Nutrients such as docosahexaenoic acid (ω-3), niacinamide (vitamin B3),
glucosamine, hydroxyproline and the anti-oxidants allantoin, anserine, cysteamine, spermine, and
squalene were amongst those only found in beef. Several other metabolites were found exclusively
(31 metabolites) or in greater quantities (67 metabolites) in the plant-based meat alternative (all,
p < 0.05). Ascorbate (vitamin C), phytosterols, and several phenolic anti-oxidants such as loganin,
sulfurol, syringic acid, tyrosol, and vanillic acid were amongst those only found in the plant-based
meat alternative. Large differences in metabolites within various nutrient classes (e.g., amino acids,
dipeptides, vitamins, phenols, tocopherols, and fatty acids) with physiological, anti-inflammatory,
and/or immunomodulatory roles indicate that these products should not be viewed as truly
nutritionally interchangeable, but could be viewed as complementary in terms of provided nutrients.
The new information we provide is important for making informed decisions by consumers and health
professionals. It cannot be determined from our data if either source is healthier to consume.
By 2050, global food systems will need to meet the dietary demands of almost 10 billion people. To meet these
demands in a healthy and sustainable manner, it is put forward that diets would benefit from a shift towards con-
sumption of more plant-based foods and less meat, particularly in Western c ountries1. This has raised questions
eat2–5.
whether novel plant-based meat alternatives represent healthy and nutritionally adequate alternatives to m
The new generation of plant-based meat alternatives such as the Impossible Burger and Beyond Burger are
becoming increasingly popular with consumers. Their success has led other international food companies—
including traditional meat companies—to invest in their own product versions6. The global plant-based meat
alternative sector has experienced substantial growth and is projected to increase from $11.6 billion in 2019 to
$30.9 billion by 2026 with a compound annual growth rate (CAGR) of 15% (Fig. 1). In contrast, the meat sector
is expecting a CAGR of 3.9% during this time and to reach a market value of $1142.9 billion by 2 0237.
1
Duke Molecular Physiology Institute, Duke University Medical Center, Durham, NC, USA. 2Department of Wildland
Resources, Utah State University, Logan, UT, USA. 3Northern Great Plains Research Laboratory, USDA-Agricultural
Research Service, Mandan, ND, USA. *email: stephan.vanvliet@duke.edu
Scientific Reports | (2021) 11:13828 | https://doi.org/10.1038/s41598-021-93100-3 1
Vol.:(0123456789)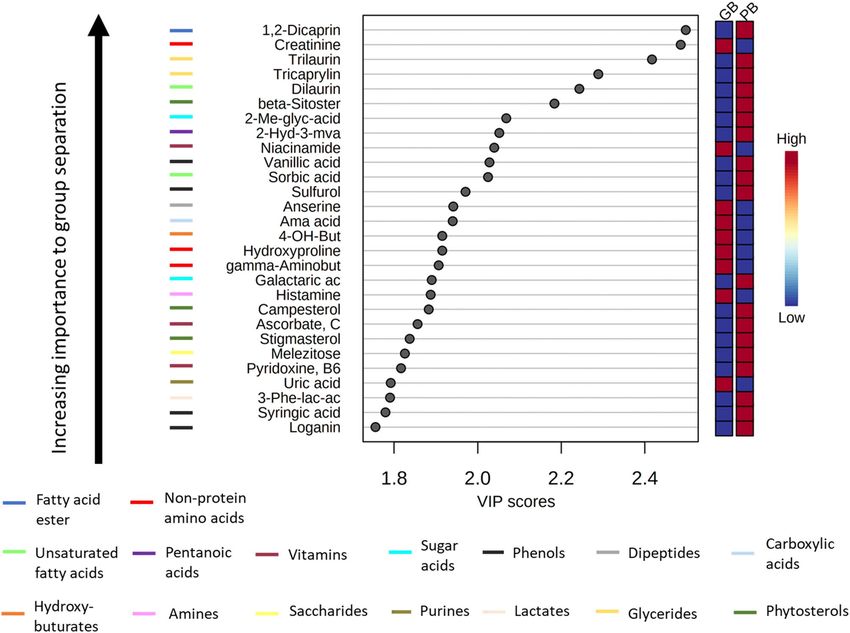
www.nature.com/scientificreports/
a Projected global market value
b Compound annual growth rate c Compound annual growth rate
of plant-based meats (CAGR) of plant-based meats (CAGR)
35 20 20
by region
30
CAGR from 2018 to 2023 (%)
CAGR from 2018 to 2026 (%)
15.9%
Market value (billion USD)
14.6% 14.4% 14.8%
15 15
25
20
10 10
15
10
5 5
5
0 0
0
18
23
24
26
20
21
19
22
25
t
t
ea
ea
a
c
e
al
20
20
20
20
20
20
20
20
20
ifi
ic
p
M
m
b
ro
er
Year
c
lo
ed
Pa
Eu
m
G
as
A
a
si
t-b
th
A
or
an
N
Pl
Figure 1. The global market value of plant-based meat alternatives and meat. Market data on plant-based meat
alternatives and meat were obtained from STATISTA7. (a) The projected global market value of plant-based
meats from 2018 to 2026 in Billion US Dollars. (b) The compound annual growth rate (CAGR) of the plant-
based meat sector globally and by region. (c) The relative growth of the global plant-based meat sector (+ 14.8%)
is expected to exceed the relative growth global animal meat market (+ 3.9%). Despite growth in absolute terms,
the value share of the global animal meat sector as a percentage of the overall food industry is expected to
remain more or less similar during 2018–20237.
The production of plant-based meats as a replacement for animal-sourced meat is nothing new. One of
the earliest engineered meat alternatives was Protose, a plant-based meat alternative made from wheat gluten,
peanuts, and soybean oil, which was designed by John Kellogg in the late nineteenth century. In 1899, Kellogg
wrote the following in his patent application for Protose:
“The objective of my invention is to furnish a vegetable substitute for meat which shall possess equal or
greater nutritive value in equal or more favorable form for digestion and assimilation and which shall con-
tain the essential nutritive elements in approximately the same proportion as beef and mutton and which
substitute has a similar flavor and is as easily digestible as the most tender meat” (U.S. Patent No 670283A).
More than a century later, the objective of plant-based meat alternative production has arguably remained
the same; however, contemporary products have arguably accomplished to create a sensory experience that more
closely resembles red meat. For example, soy leghemoglobin in a popular plant-based meat alternative imitates
the “bloody” appearance and taste of heme proteins in meat, while extracts from red beets, red berries, carrots,
and/or other similarly colored vegetables are often embedded in plant-based meat alternatives to give them a
reddish “meat-like” a ppearance6. Methyl cellulose is often used to give plant-based meat alternatives a “meat-like”
texture, while flavoring agents are added to mimic the taste of cooked meat. Modern meat alternatives also match
the protein content of meat by using isolated plant proteins (e.g., soy, pea, potato, mung bean, rice, mycoprotein,
and/or wheat), and they are sometimes fortified with vitamins and minerals found in red meat (e.g., vitamins
B12, zinc, and iron) to provide an even more direct nutritional r eplacement4,8.
For example, a commercially available plant-based alternative closely matches the Nutrition Facts panel of beef
(Fig. 2), and to consumers reading nutritional labels they may appear nutritionally interchangeable9. Nonetheless,
food sources have considerable complexity and contain a wide variety of nutrients (e.g., phenols, anti-oxidants,
peptides, amino acids, fatty acids, biogenic amines etc.), the majority of which do not appear on nutrition labels,
but can have potential health i mplications10. Important nutritional differences may exist between beef and novel
plant-based alternatives; however, this has not been thoroughly assessed.
Given the scientific and commercial interest in plant-based meat alternatives, the goal of our study was to
use untargeted metabolomics to provide an in-depth comparison of the metabolite profiles of grass-fed ground
beef and a popular plant-based meat alternative, both of which are sometimes considered as healthier and more
environmentally friendly sources of “beef ”4,5,8. Metabolomics is an analytical profiling technique that allows
researchers to measure and compare large numbers of nutrients and metabolites present in biological samples.
Results
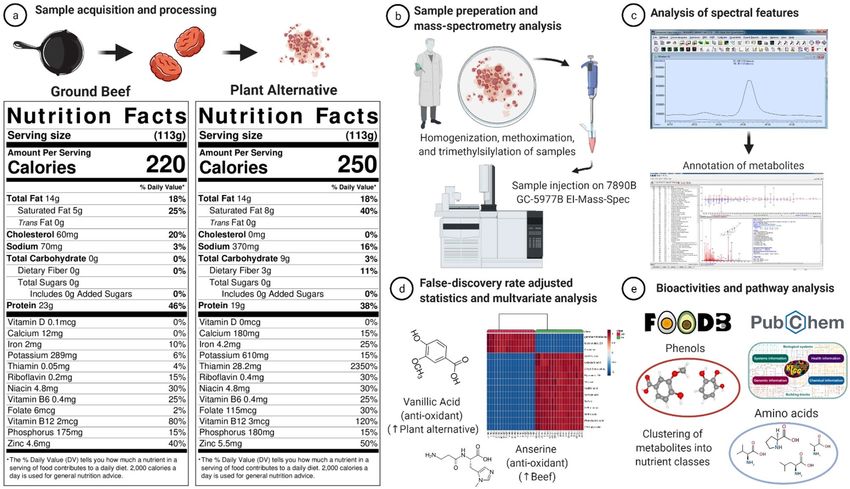
Product information. A schematic representation of the study flow is provided in Fig. 2. Eighteen different
packages (340 g or 12 oz each) of a commercially-available plant-based meat alternative was purchased from a
local grocery store in Raleigh, NC, USA. Ground beef from eighteen grass-fed, black angus cattle (454 g or 16 oz
each) was purchased from Alderspring Ranch (May, ID) and matched for total fat content to the plant-based
alternative, which was confirmed using proximate analysis (method AOAC 960.39; Microbac Laboratories, War-
Scientific Reports | (2021) 11:13828 | https://doi.org/10.1038/s41598-021-93100-3 2
Vol:.(1234567890)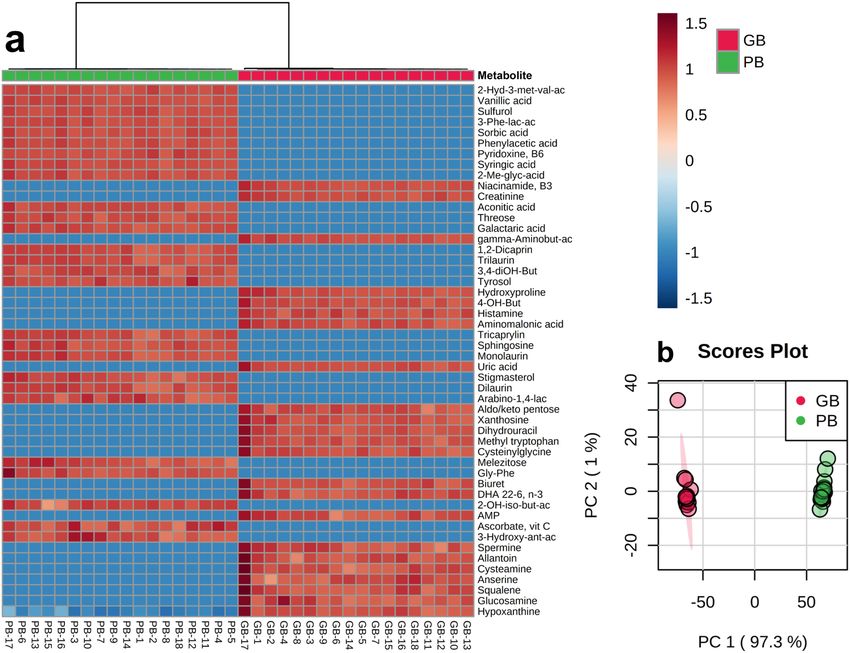
www.nature.com/scientificreports/
Figure 2. Schematic description of sample preparation and metabolomics analysis. (a) Nutrition Facts panels
of grass-fed ground beef and the plant-based meat alternative. (b) Samples were homogenized, methoximated
and trimethylsilylated, and untargeted metabolomic analysis was conducted via gas chromatography/electron-
ionization mass spectrometry (GC/EI-MS). (c) Raw spectral data were imported into the freeware (Automatic
Mass Spectral Deconvolution and Identification Software or AMDIS), and annotated as metabolites using
an orthogonal approach that incorporates both retention time (RT) from GC and the fragmentation pattern
observed in EI-MS. (d) To determine differences in abundance of metabolites between beef and plant-based
meat alternative, deconvoluted peak areas from AMDIS analysis were log-base-two transformed prior to
analysis and tested using the Wilcoxon rank sum test with Benjamini-Hochberg adjusted p values at 5% (False
Discovery Rate adjusted p < 0.05). (e) Bioactivities and potential health effects of annotated metabolites were
explored using FooDB (https://foodb.ca/) and/or PubChem (https://pubchem.ncbi.nlm.nih.gov/) databases,
while metabolic pathway identification of metabolites was performed using the Kyoto Encyclopedia of Genes
and Genomes (KEGG) (https://www.genome.jp/)11. Figure was created with BioRender.com.
rendale, PA). The macronutrient composition and energy content of 113 g (4oz) grass-fed beef was 24 g of
protein, 0 g of carbohydrates, 14 g of fat (5 g saturated fat), and 220 kcal. The macronutrient composition and
energy content of 113 g (4oz) the soy-based meat alternative was 19 g of protein, 9 g of carbohydrates, 14 g of
fat (8 g saturated fat), and 250 kcal. The Nutrition Facts panels of both food sources, including micronutrients,
can be found in Fig. 2. The plant-based alternative is fortified with iron (from soy leghemoglobin), ascorbic acid
(vitamin C), thiamin, riboflavin, niacin, vitamin B6, vitamin B12, and zinc. The micronutrients within grass-fed
beef are part of the natural food matrix.
Metabolomics analysis. We found that a total of 171 out of 190 annotated metabolites (90%) were differ-
ent (p < 0.05) between beef and the plant-based alternative. Several compounds were found either exclusively
(22 metabolites total) or in greater quantities in beef (51 metabolites total) compared with the plant-based meat
alternative (all, p < 0.05). Nutrients only found in beef included allantoin (alkaloid; anti-oxidant)12, anserine
(dipeptide; anti-oxidant)13, cysteamine (amine; anti-oxidant)14, docosahexaenoic acid (DHA, C22:6, ω-3 essen-
tial fatty acid)15, glucosamine (hexoamines; collagen biosynthesis)16, hydroxyproline (non-protein amino acid;
collagen biosynthesis)17, gamma-aminobutyric acid (non-protein amino acid; anti-hypertensive)18, spermine
(biogenic polyamine; anti-oxidant)19, niacinamide (vitamin B 3; neuroprotective)20, and squalene (terpenoid
21
phenolic; anti-bacterial) . Several other compounds were found exclusively (31 metabolites total) or in greater
quantities (67 metabolites total) in the plant-based meat alternative when compared to beef (Supplemental
Table 1) (all, p < 0.05). Nutrients only found in the plant-based meat alternative included 2-hydroxy-3-methyl-
valeric acid (pentanoic acids; flavor)22, 3-hydroxyanthranilic acid (phenolic; anti-oxidant)23, aconitic acid (car-
boxylic acid; flavor)24, ascorbate (vitamin C; anti-oxidant)25, beta-sitosterol (phytosterol; anti-carcinogenic)26,
campesterol (phytosterol; anti-carcinogenic)26, loganin (terpenoid phenolic; anti-inflammatory)27, melezitose
or similar disaccharides (flavor)28, monolaurin (glyceride; anti-microbial)29, phenylacetic acid (phenylacetates;
anti-oxidant)30, sorbic acid (unsaturated fatty acid; food preservative)31, sulfurol (phenolic; flavor)32, syringic
acid (phenolic; anti-oxidant)33, trilaurin (glyceride; anti-microbial)29, and tyrosol (phenolic; anti-oxidant)34. A
Scientific Reports | (2021) 11:13828 | https://doi.org/10.1038/s41598-021-93100-3 3
Vol.:(0123456789)www.nature.com/scientificreports/
Metabolite class # ↑Plant ↑Beef p value Key compound Metabolic pathway, potential bioactivities
Amino acids 19 13 6 < .001 Glutamine (↑Plant) Protein metabolism, neurotransmitter
Non-protein AAs 14 5 6 < .001 Creatinine (↑Beef) Energy metabolism, neuroprotective
Saccharides 13 8 4 < .001 Keto pentose-5-phos (↑Beef) Energy metabolism, flavor
Saturated FAs 13 5 6 < .001 Pentadecanoic acid (↑Beef) Odd-chain fatty acid biosynthesis, anti-oxidant
Dicarboxylic acids 11 4 7 < .001 Aminomalonic acid (↑Beef) Glycine metabolism, unknown
Phenols 8 6 2 < .001 Vanillic acid (↑Plant) Plant/microbial metabolism, anti-inflammatory
Dipeptides 8 2 4 < .001 Anserine (↑Beef) Carnosine metabolism, antioxidant
Purines 7 3 4 < .001 Uric acid (↑Beef) Microbrial/purine metabolism, unknown
Sugar alcohols 7 4 2 < .001 Myoinositol (↑Beef) Biosynthesis, liver-protective, neuroprotective
Hydroxybuyrates 6 4 2 < .001 4-Hydroxybutyric acid (↑Beef) Biosynthesis, neuroprotective
Vitamins 5 3 2 < .001 Vitamin C (↑Plant) Biosynthesis, anti-oxidant, liver-protective
Glycerides 5 4 0 .002 Monolaurin (↑Plant) Lipid metabolism, anti-inflammatory
Pentoses 4 2 2 < .001 Arabinose/aldopentose (↑Beef) Energy metabolism, antioxidant, flavor
Sugar acids 4 3 1 < .001 Glyceric acid (↑Beef) Biosynthesis, cholesterolytic, kidney-protective
Amino alcohols 4 3 1 < .001 Phosphoethanolamine (↑Beef) Sphingolipid metabolism, neurotransmitter
Pyrimidines 4 1 2 .001 Dihydrouracil (↑Beef) Pyrimidine metabolism, neuro-protective
Amines 4 0 3 .001 Cysteamine (↑Beef) Taurine metabolism, antioxidant,
Unsaturated FAs 3 2 2 .003 Sorbic Acid (↑Plant) Fatty acid biosynthesis, preservative
Phytosterols 3 3 0 .003 Stigmasterol (↑Plant) Biosynthesis, antioxidant, cancer-protective
Tocopherols 3 3 0 .003 α-Tocopherol (↑Plant) Biosynthesis, antioxidant, cardio-protective
Biogenic amines 3 2 1 .003 Spermidine (↑Plant) Glutathione metabolism, antioxidant
Polyunsaturated FAs 3 0 2 .007 DHA, 22-6, ω-3 (↑Beef) Essential fatty acid, neuroprotective
Pyridines 3 0 2 .014 3-Hydroxypyridine (↑Beef) Maillard reaction end-product, flavor
Fatty acid esters 3 1 0 1.00 1,2-Dicaprin (↑Plant) Energy metabolism, biosynthesis
Table 1. Metabolites clustered into nutrient classes according to structural similarity using ChemRICH
software procedures11. Arrow (↑) indicates higher abundance for a particular nutrient class or nutrient.
Abbreviations used: AA, amino acids; DHA; docosahexaenoic; FA, fatty acid.
full list of annotated metabolites, their respective pathway classification (KEGG-identified)11, and their potential
bioactivates/health effects (FoodDB and PubChem-identified) can be found in Supplemental Table 1. While sev-
eral of these nutrients are considered non-essential or conditionally-essential based on life-stages (e.g., infancy,
pregnancy, or advanced age) and are often less appreciated in discussions of human nutritional r equirements10,
their importance should not be ignored, as their absence (or presence) can potentially impact human metabo-
lism and health.
To visualize differences and identify the top metabolites contributing to the nutritional disparity between beef
and plant-based meat, we created a ranked heatmap of the top fifty metabolites based on the Pearson distance
measure and the Ward clustering algorithm, and performed unsupervised principal component analysis using
software procedures from MetaboAnalyst 4.0 (http://www.metaboanalyst.ca)35. Both the heatmap (Fig. 3A) and
unsupervised principal component (PCA) analysis (Fig. 3B) revealed a distinct separation in nutritional com-
ponents, with 97.3% of the variance explained within the first principal component (PC1)—further illustrating
that large metabolite differences exist between beef and the plant-based meat alternative.
Chemical similarity enrichment analysis. To identify the main metabolite classes that differed between
beef and the plant-based alternative, we clustered individual metabolites into metabolite classes according to
their structural similarity using Chemical Similarity Enrichment Analysis (ChemRICH) software procedures
(http://chemrich.fiehnlab.ucdavis.edu/). We identified 24 classes (enrichment clusters) with ≥ 3 structurally sim-
ilar metabolites regardless of whether these metabolites were found in beef or the plant-based meat alternative
(Table 1). We found that 23 out of the 24 identified metabolite classes differed significantly (false discovery rates
adjusted p < 0.05) between beef and the plant-based meat alternative.
Amongst the metabolite classes emerging as most discriminating between beef and the plant-based meat alter-
native were amino acids, non-protein amino acids, saccharides, saturated fatty acids, dicarboxylic acids, phenols,
dipeptides, sugar alcohols, vitamins, glycerides, unsaturated fatty acids, and amino alcohols (all, p < 0.05). We
then used partial least squares-discriminant analysis (PLS-DA) (Fig. 4) and identified the metabolites responsible
for their overall discrimination ability between groups (ranked according to Variable Importance in Projection
[VIP] scores).
Scientific Reports | (2021) 11:13828 | https://doi.org/10.1038/s41598-021-93100-3 4
Vol:.(1234567890)www.nature.com/scientificreports/
Figure 3. Metabolomics revealed distinct differences in metabolite profiles between grass-fed ground beef (GB)
and the plant-based meat alternative (PB). (a) Heatmap of the top 50 metabolites, ranked by p values (lowest
to highest), that were significantly different (p < 0.05) between beef and the plant-based meat alternative. Red
(intensity ranges from 0 to 1.5) means higher abundance of the corresponding metabolite, whereas blue means
lower abundance (intensity ranges from − 0 to − 1.5). The numbers below the heatmap represent individual
samples (GB-1 to 18 and PB-1 to 18 respectively; n = 18 for each group). Metabolites in beef and the plant-based
meat alternative were compared by the Wilcoxon rank sum test with Benjamini–Hochberg adjusted p values at
5% (p < 0.05). (b) Principal Component Analysis (PCA) analysis of beef and plant-based meat revealed a distinct
difference in metabolite composition between the grass-fed ground beef and the plant-based meat, with 97.3%
of the variance explained within the first principal component (PC1)—which illustrates that large differences
exist between beef and the plant-based meat alternative. Red and green colors above the heatmap (a) and the
PCA plot (b) represent the ground beef and the plant-based meat, respectively. The 95% confidence interval
of the groups is depicted in their respective color. A full list of potential bioactivities and health effects of each
individual metabolite is reported in Supplemental Table 1. Figure was created with MetaboAnalyst 4.0 (http://
www.metaboanalyst.ca)35.
Discussion
A new generation of plant-based meat alternatives have recently entered global consumer markets. Novel plant-
based meat alternatives are often formulated and marketed to facilitate the replacement of animal-based foods in
the diet, both in terms of sensory experience and nutrition. The plant-based meat alternative and grass-fed, beef
studied in our work, have largely similar Nutrition Facts panels and may appear nutritionally interchangeable
to consumers9. Despite these apparent similarities based on Nutrition Facts panels, our metabolomics analysis
found that metabolite abundance between the plant-based meat alternative and grass-fed ground beef differed
by 90% (171 out of 190 profiled metabolites; p < 0.05). Substantial differences in metabolites within various
classes (e.g., amino acids, dipeptides, vitamins, phenols, tocopherols, odd-chain saturated and unsaturated fatty
acids, antioxidants) indicate that these products should not be viewed as nutritionally interchangeable. The new
information we provide is important for making informed decisions by consumers, and to inform dietary advice
by health professionals.
Scientific Reports | (2021) 11:13828 | https://doi.org/10.1038/s41598-021-93100-3 5
Vol.:(0123456789)www.nature.com/scientificreports/
Figure 4. Partial least squares-discriminant analysis (PLS-DA) was used to rank metabolites according to
their prognostic importance (VIP scores) in separating the metabolite profiles of beef and the plant-based
meat alternative. The boxes on the right of the plot indicates the relative concentrations of the corresponding
metabolite in the plant-based meat alternative and beef. Red means higher abundance of the corresponding
metabolite, whereas blue means lower abundance. Metabolite classes were identified using Chemical Similarity
Enrichment Analysis (ChemRICH) software procedures (http://chemrich.fiehnlab.ucdavis.edu/)11 and indicated
by the colored bars left of the metabolites.
Several metabolites with potentially important regulatory roles in human health were found either exclusively
or in greater quantities in beef samples than in the plant-based alternative and vice versa. Creatinine (product
of creatine), hydroxyproline (a non-proteinogenic amino acid), anserine (a carnosine metabolite), glucosamine
(a saccharide), and cysteamine (an aminothiol) are examples of nutrients only found in beef and appeared as
discriminating metabolites within their respective nutrient class (Table 1). These nutrients have potentially
important physiological, anti-inflammatory, and/or immunomodulatory roles17,36, and low intakes are associated
with cardiovascular, neurocognitive, retinal, hepatic, skeletal muscle, and connective tissue d ysfunction17,36. For
example, creatine and anserine were found to provide neurocognitive protection in randomized controlled trials
in older a dults37,38. Cysteamine, a potent antioxidant, also has neuroprotective effects and is a precursor of glu-
tathione—one of the most potent intracellular anti-oxidants14. Squalene has potential anti-oxidant, anti-bacterial,
and anti-tumor a ctivity21, while dietary hydroxyproline and glucosamine can stimulate collagen biosynthesis and
are considered important for maintaining the structure and strength of connective tissue and blood v essels16,17.
Metabolites in nutrient classes such as phenols, tocopherols, and phytosterols (Table 1) were found exclusively
or in greater abundance in the plant-based meat when compared to beef. For instance, the plant-based meat
alternative contained more tocopherols (α, γ, and δ)—a class of nutrients with vitamin E activity best known for
their anti-oxidant e ffects39. We also found several phytosterols such as beta-sitosterol, campesterol, and stigmas-
terol in the plant-based meat; compounds that collectively may possess anti-oxidant, anti-inflammatory, and/or
cancer-protective properties26. We also found a wider variety and greater abundance of phenolic compounds in
the plant-based alternative when compared to beef (Table 1). Identified compounds include sulfurol, syringic
acid, vanillic acid, and methylated/hydroxylated forms of valeric acid, which may benefit human health by damp-
ening oxidative stress and inflammation40. Lastly, we found higher amounts of spermidine in the plant-based
Scientific Reports | (2021) 11:13828 | https://doi.org/10.1038/s41598-021-93100-3 6
Vol:.(1234567890)www.nature.com/scientificreports/
meat alternative, which is a biogenic polyamine that has been studied for its potential neurocognitive and car-
diovascular benefits41.
Within the nutrient class of polyunsaturated fatty acids (PUFAs), the fatty acids arachidonic acid (ARA, C20:4,
ω-6) and docosahexaenoic acid (DHA, C22:6, ω-3) were found exclusively (DHA) or in greater quantities (ARA)
in grass-fed beef samples (Table 1). These essential fatty acids are major constituents of the brain phospholipid
membrane and have important roles in cognition, immunomodulation, platelet function, and cell s ignaling15,36.
Their deficiencies are associated with cognitive decline and increased risk of cardiovascular d isease15,36.
Important differences were also observed in saturated fatty acid and glyceride classes (Table 1). The main
saturated fatty acids and glycerides (Table 1) in the plant-based meat were coconut oil-derived lauric acid and
monolaurin, which may possess anti-microbial and/or anti-inflammatory p roperties29,42. On the other hand,
we found higher levels of the dietary odd-chain saturated fatty acids (OCFAs) pentadecanoic acid (C15:0) and
heptadecanoic acid (C17:0) in beef than in the plant-based alternative. These compounds are believed to exert
their beneficial effects by attenuating inflammation, dyslipidemia, and cell fibrosis43, and increased dietary intake
is associated with a lower risk of metabolic disease44,45. Other notable metabolites in the plant-based meat alter-
native were the vitamins niacin (B3), pyridoxine ( B6), and ascorbic acid (C), which are added as fortificants to
the product.
When considering the health effects of foods there is a need to appreciate the complexity of whole food
sources beyond simply their protein, fat, vitamin, and mineral c ontent46. Considerations of how diet affects
health is generally limited to 150 nutritional components routinely tracked in nutritional databases of which
only 13 routinely appear on nutritional labels (e.g., fat, saturated fat, trans fat, cholesterol, sodium, carbohydrate,
fiber, sugar, protein, vitamin A, vitamin C, calcium, and iron)10. These nutrients represent only a small fraction
of the more than 26,000 metabolites in the ‘human foodome’—many of which have potential health effects but
often remain underappreciated in discussions of diet and human h ealth10,46. The complexity of the whole food
matrix—as indicated here by our metabolomics findings—highlights that attempting to mimic food sources using
single constituents such as isolated proteins, vitamins, and minerals is challenging and arguably underestimates
the complexity of the food source it is meant to mimic.
While additional fortification and technological advancement could potentially somewhat increase the nutri-
tional similarity of plant-based meat alternatives and meat, since foods contain thousands of constituents that
can synergistically impact human metabolism, consuming isolated nutrients or fortified foods often do not
confer similar benefits when compared to ingesting nutrients as part of their whole-food matrix47. For exam-
ple, supplementation of a low-meat diet with zinc and other minerals found in meat did not result in a similar
in vivo zinc status when equivalent amounts of these minerals were provided as part of the natural meat m atrix48.
Similar findings have been made for other nutrients, such as copper, calcium and vitamins A, C, and D, which
are associated with disease protection when obtained from food, but often not when obtained from fortified or
supplemental sources49,50.
The uptake of minerals such as i ron51 and z inc52 is also reduced when obtained from legumes (the common
protein source in plant-based meat alternatives) when compared to animal foods. That is because iron in animal
foods is found in the heme form, which is more bioavailable than the non-heme form found in plant f oods53. Of
note is that the iron in a novel plant-based meat alternative is also present in the heme form, and is produced
from Pichia pastori yeast encoded with the leghemoglobin protein gene that is normally expressed in root nod-
ules of soy plants (i.e., soy leghemoglobin)54. Work performed in an in vitro human epithelial model found that
iron uptake from leghemoglobin is comparable to bovine h emoglobin55, and future work is needed to confirm
the potential ability of soy leghemoglobin in plant-based meat alternatives to contribute to iron status in vivo in
humans. Uptake of zinc from plant foods is also reduced due to the presence of phytates, lectins, and other anti-
nutrients52, but can be improved when consumed at higher meal-like protein levels56, which is the case for novel
plant-based meat alternatives given their use of isolated plant proteins. For an in-depth discussion on potential
nutrient uptake from meat and plant-based meat alternatives we refer to a recent publication5.
Similarities in terms of total protein content (~20 g protein) and several vitamins/minerals (e.g., zinc, iron,
vitamin B12, and niacin) between beef and the plant-based alternative, studied in this work (Fig. 2), does indi-
cate that a “flexitarian approach” (replacing limited amounts of animal foods with plant-based alternatives) is
unlikely to negatively impact essential nutritional status of consumers, but this also depends on what other foods
are part of the diet and the degree to which plant-based substitutes replace animal foods (e.g., the occasional
replacement or full replacement). Caution is warranted for vulnerable populations such as children, women of
childbearing age, and older individuals who may be at increased risk for suboptimal nutritional status with low
intakes of animal f oods57,58.
Plant-based diets are commonly associated with higher dietary quality and lower chronic metabolic disease
risk when compared to typical omnivorous d iets59–61. Several prospective studies have found that consumption
of plant foods such as legumes, whole grains, and nuts is associated with lower cancer rates, cardiovascular
disease risk, and all-cause mortality, whereas red and processed meat is generally associated with an elevated
risk62,63, particularly when consumed as part of Standard American/Western d iets64–66. It must be noted that in
the context of healthful dietary patterns, plant-based (vegan/vegetarian) and omnivorous diets may be equally
associated with lower chronic metabolic disease risk and/or m ortality67–70.
While plant foods are generally considered healthy to consume, Hu and c olleagues2 have expressed reservation
in extending these notions to several novel plant-based meat alternatives given their ultra-processed nature. Not
all plant-based diets are necessarily healthy either, and diets rich in ultra-processed foods are associated with
increased chronic metabolic disease risk, irrespective of whether they are plant-based or mixed (omnivorous)71,72.
Whether several novel plant-based meat alternatives fit the description of a desirable plant food in healthy dietary
patterns is currently d ebated2,4,5,73, and likely depends on product formulations, frequency of consumption, and
the background diet of the individual. Further work is needed to inform these discussions; however, we consider
Scientific Reports | (2021) 11:13828 | https://doi.org/10.1038/s41598-021-93100-3 7
Vol.:(0123456789)www.nature.com/scientificreports/
it important to not lose sight of the “bigger picture” in these discussions, which is the overall dietary pattern
in which individual foods are consumed. That is arguably the predominant factor dictating health outcomes to
individual foods74. Of note is a recent 8-week randomized controlled trial that found that a “flexitarian approach”
(swapping moderate amounts of meat with novel plant-based alternatives as part of an omnivorous diet) may
have positive benefits in terms of weight control and lipoprotein profiles (e.g., LDL-cholesterol)73.
Our work has limitations. While the plant-based meat alternative studied here is one of the most popular
products currently on the market, product formulations of novel plant-based meat alternatives differ in terms of
the type of isolated plant proteins (e.g., soy, pea, potato, mung bean, rice, mycoprotein and/or wheat), fats (e.g.,
canola, soy, coconut, and/or sunflower oil), and/or other novel ingredients (e.g., soy leghemoglobin, different
vegetable extracts, and/or different flavoring agents)8. Furthermore, we used GC-MS for metabolic profiling and
it is possible that other platforms (e.g., LC-MS) may reveal additional differences or similarities in metabolite
profiles. Nonetheless, our metabolomics analysis and a recent comparison of fatty acids and volatile (flavor)
compounds in other plant-based meat alternatives with a beef burger suggests that, in general, plant-based meat
alternatives are substantially different from animal meat when considering expanded nutritional p rofiles75. As
the field of food-omics (the application of metabolomics in food and nutrition sciences) progresses, we will
undoubtedly gain further appreciation of the complexity of natural food matrices and the ability of manifold
nutritional constituents to synergistically modulate human h ealth10.
In conclusion, metabolomics revealed that abundance of 171 out of 190 profiled metabolites differed between
beef and a commercially-available plant-based meat alternative, despite comparable Nutrition Facts panels.
Amongst identified metabolites were various nutrients (amino acids, phenols, vitamins, unsaturated fatty acids,
and dipeptides) with potentially important physiological, anti-inflammatory, and/or immunomodulatory roles—
many of which remained absent in the plant-based meat alternative when compared to beef and vice versa. Our
data indicates that these products should not be viewed as nutritionally interchangeable, but could be viewed as
complementary in terms of provided nutrients. It cannot be determined from our data if either source is healthier
to consume. Just a peanut is not really an e gg76, we conclude that a plant burger is not really a beef burger. Thus,
our work adds to the notion that caution is warranted when categorizing foods as equivalent for consumers
simply based on their protein content (“protein foods”), which is typical in dietary r ecommendations76,77.
Future studies are needed to better understand how the presence and absence of metabolites and nutrients
in plant-based meat alternatives and meat impacts short- and long-term consumer health. Studies performed
in various populations (children, elderly, those with metabolic disease etc.), and in response to various types
and amounts of plant-based meat alternatives are required to evaluate their healthfulness and appropriateness
within the human diet.
Materials and methods
Sample preparation. Individual patties (113 g or 4 oz each) were formed from each package of plant-based
meat (n = 18) and beef (n = 18), respectively. Individual patties were cooked in a non-stick skillet until the inter-
nal temperature of each patty read 71 °C as determined by a meat thermometer. One-gram microcore samples
were obtained from the middle of each patty using a bioptome device, immediately frozen in liquid nitrogen,
and stored at − 80 °C until metabolomics analysis. Microcore samples the plant-based meat replacement and
bovine skeletal muscle (i.e., beef) were powdered under liquid N2 and homogenized in 50% aqueous acetonitrile
containing 0.3% formic acid (50 mg wet weight sample per ml homogenate) using a Qiagen Retsch Tissue Lyser
II set to a frequency of 30 oscillations/s for a total of 2 min with one 5 mm glass ball (GlenMills, Inc, #7200-
005000TM) per tube. 100 µl of each sample homogenate was then transferred into a fresh, 1.5-ml, Reduced
Surface Activity (RSATM) glass autosampler vial (catalog number 9512C-1MP-RS, MicroSolv Technology Cor-
poration, Leland, NC). Proteins in sample homogenates were subsequently “crash" precipitated with 750 µl dry
methanol and centrifuged at 13.500×g rcf for 5 min (Vial C entrifugeTM, MicroSolv, catalog C2417). The crash
solvent was spiked with D 27-deuterated myristic acid (D27-C14:0) (Sigma 366889, 6.25 mg/l) an internal stand-
ard for retention-time locking (described below). 700 µl of the supernatant of each sample homogenate was
subsequently transferred to fresh RSATM glass vials (catalog number 9512C-1MP-RS, MicroSolv Technology
Corporation, Leland, NC). Methanolic extracts were then dried in a Savant SPD111V SpeedVac Concentrator
(Thermo Scientific, Asheville, NC), with the help of a final pulse of toluene (Fisher Scientific, catalog number
T324-50) as an azeotropic drying agent. 25 µl methoxyamine hydrochloride (18 mg/ml in dry pyridine: Fisher
Scientific, catalog number T324-50) was then added to each sample and incubated at 50 °C for 30 min for meth-
oximation of certain reactive carbonyl groups. Finally, metabolites were rendered volatile by replacement of
easily exchangeable protons with trimethylsilyl (TMS) groups using N-methyl-N-(trimethylsilyl) trifluoroaceta-
mide (MSTFA; 75 µl per sample Cerilliant M-132, Sigma, St. Louis, MO) at 50 °C for 30 min.
GC/EI‑MS analysis. Biological comparators (beef vs. plant-meat based alternative) were run in direct suc-
cession (e.g., the order A-B-A-B) on a 7890B GC/5977B single-quadrupole, Inert MS (Agilent Technologies,
Santa Clara, CA). This system was equipped with a MultiMode Inlet (MMI), which, in combination with a
mid-column, purged ultimate union (PUU), enabled hot back-flushing of the upstream half of the column at
the end of each run to reduce fouling of both GC and MS with heavy contaminants (“high boilers”) and car-
ryover between injections. Briefly, the two wall-coated, open-tubular (WCOT) GC columns connected in series
were both from J&W/Agilent (part 122-5512 UI), DB5-MS UI, 15 m in length, 0.25 mm in diameter, with a
0.25-µm luminal film. This film is a nonpolar, thermally stable, phenyl-arylene polymer, similar in performance
to traditional 5%-phenyl-methylpolysiloxane films. Prior to each daily run (2 total), the starting inlet pressure
was empirically adjusted such that the retention time of the TMS-D27-C14:0 standard is set at ~ 16.727 min.
Following an initial distillation within the MMI, the GC oven ramps from 60 to 325 °C at a speed of 10 °C/min.
Scientific Reports | (2021) 11:13828 | https://doi.org/10.1038/s41598-021-93100-3 8
Vol:.(1234567890)www.nature.com/scientificreports/
Under these conditions, derivatized metabolites elute from the column and reach the MS detector at known
times (e.g., bis-TMS-lactic acid at ~ 6.85 min, and TMS-cholesterol at ~ 27.38 min) within specific tolerance of
< 0.1 min. Radical cations generated with conventional electron ionization via a tungsten-rhenium filament set
to an energy of 70 eV were scanned broadly from 600 to 50 m/z in the detector throughout the run. Cycle time
was approximately 38 min. Our GC/MS methods are based on validated methods and follow those reported by
Roessner et al.78, Fiehn et al.79, Kind et al.80, McNulty et al.81, Banerjee et al.82, and Clinton et al.83.
Data reduction. Raw data from Agilent’s MassHunter software environment were imported into the free-
ware, Automatic Mass Spectral Deconvolution and Identification Software or AMDIS (version 2.73)—84–86; cour-
tesy of NIST (http://chemdata.nist.gov/mass-spc/amdis/). Peaks were not normalized, with all samples run in
a single batch sequence, for which we have found normalization of peak intensities to not be necessary. Decon-
voluted spectra were annotated as metabolites using an orthogonal approach that incorporates both retention
time (RT) from GC and the fragmentation pattern observed in EI-MS. Peak annotation was based primarily
on our own RT-locked spectral library of metabolites (2059 spectra from 1174 unique compounds at the time
of analysis; January 2020). Our library is built upon the Fiehn GC/MS Metabolomics RTL Library (a gift from
Agilent, their part number G1676-90000; Kind et al. 2 00980. Additional spectra have been gleaned from running
pure reagent standards in our lab, from the Golm Metabolome Library87 (http://csbdb.mpimp-golm.mpg.de/
csbdb/gmd/gmd.html), and from the Wiley 10th-NIST 2014 commercial library (Agilent G1730-64000). Peak
alignment and chemometrics of log-base-two-transformed areas of deconvoluted peaks were performed with
our own custom macros, written in our lab in Visual Basic (version 6.0) for use in the Excel (Microsoft Office
Professional Plus 2019) software environment (both from Microsoft, Redmond, WA).
Data processing. Three investigators (S.V.V., J.R.B., and M.J.M.) subsequently performed line-by-line man-
ual curation to fix miscalls and highlighted ambiguities inherent in certain isomeric or otherwise similar metab-
olites. Metabolites were retained for further analysis if detected in ≥ 80% of samples of either the plant-based
meat replacement or ground beef (i.e., 14 out of 18 samples per group). If a discernable signal for a biochemical
was observed in ≥ 80% of samples of one group (beef or plant), but remained absent in all samples of the other
group, we assumed absence of meaningful amounts and imputed a small value close to 1 prior to log-base-two-
transformation. As can be observed from Supplemental Table 1, this was the case for 53 metabolites, which were
readily detected in one source (e.g., beef or the plant-based alternative) but not the other.
This decision was made after careful deliberation with a biostatistician (C.F.P.) and the Metabolomics Core
at the Duke Molecular Physiology Institute, and was based on the expectation that in such cases the metabolite
feature was truly nonexistent (or at least below the Level of Detection) for a given group (beef or plant-based meat
alternative) and not due to chromatographic non-detection. In other words, had the metabolite been present in
the food source at meaningful levels, it would have registered as we detected this metabolite in ≥ 80% of samples
in the other group (i.e., 14 out of 18 samples).
To illustrate this with an example; anserine (β-alanyl-1-methyl-l-histidine; a methylated product of carnos-
ine) is metabolite that is well-known to occur in beef and other animal meats, but known to be absent in plant
samples17. Similarly, isoflavones such as β-sitosterol and campesterol would normally not be found in grass-fed
beef, but were readily detected in all plant-based meat samples. If we used-nearest neighbor (KNN) imputation
(or other commonly used imputation methods such as Partial Least Squares, Singular Value Decomposition,
Bayesian Principal Component Analysis etc.) without accounting for true absence of metabolites in a given
group, our data set would falsely imply that some metabolites are in the plant or beef source of which their
presence is implausible. In the case of remaining missing values for other metabolites, for which a signal was
detected in ≥ 14 of samples of one group (beef or plant) and ≥ 1 sample of the other group, k-nearest neighbor
imputation was p erformed88,89. The full list of annotated metabolites and their retention times are presented in
Supplemental Table 2.
Data analysis. After data processing, individual metabolites were tested for normality using Kolmogorov-
Smirnov tests (p < 0.05) using SAS 9.4 (Cary, North Carolina, USA). Several metabolites did not show a normal
distribution after log transformation, which may be expected based on the observed large differences in metabo-
lites abudance between beef and the plant-based meat alternative—53 metabolites were detected exclusively in
either the plant-based meat alternative or beef. To test differences in individual metabolites between groups, we
subsequently used the non-parametric Wilcoxon with Benjamini–Hochberg adjusted p values at 5% to account
for false discovery in our statistical analysis (FDR adjusted p < 0.05).
To visualize differences in individual metabolites between groups and identify the top metabolites that con-
tributed to the nutritional differences between beef and the plant-based meat alternative, we created a ranked
heatmap of the top fifty metabolites based on the Pearson distance measure and the Ward clustering algorithm
and performed unsupervised principal component analysis using software procedures from MetaboAnalyst
4.0 (https://www.metaboanalyst.ca) (Fig. 3)35. Partial Least Square-Discriminant Analysis (PLS-DA) was used
to determine the variable importance in projection (VIP) of each compound. The VIP plot generated from the
PLS-DA models ranks individual metabolites for their ability to discriminate the grass-fed beef from the plant-
based meat alternative and those with score ≥ 1.75 are reported in Fig. 4.
Potential bioactivities and health effects of annotated metabolites were explored by entering Chemical
Abstracts Service (CAS) # of individual metabolites in FooDB (https://foodb.ca/) and/or PubChem (https://
pubchem.ncbi.nlm.nih.gov/) databases, while metabolic pathway identification of individual metabolites was
performed using the Kyoto Encyclopedia of Genes and Genomes (KEGG) (https://w ww.g enome.j p/)11. To inform
discussions, we clustered metabolites by chemical class using freely-available ChemRICH software procedures
Scientific Reports | (2021) 11:13828 | https://doi.org/10.1038/s41598-021-93100-3 9
Vol.:(0123456789)www.nature.com/scientificreports/
(http://chemrich.fiehnlab.ucdavis.edu/)90. To enable cluster analysis via structural similarity and ontology map-
ping, InChiKeys, PubChemID and SMILES canonicals for each metabolite was retrieved by entering its respective
Chemical Abstracts Service (CAS) # in the PubChem database (https://pubchem.ncbi.nlm.nih.gov/).
After ChemRICH analysis, the lead investigator (S.V.V.) performed line-by-line manual curation to fix any
apparent miscalls or apparent misclassification of individual metabolites, and to perform manual adjustment
of metabolite classification when appropriate, after which analysis was re-ran (e.g., ChemRICH classified pyro-
dixine as a separate “Vitamin B 6” category in which case the metabolite was subsequently lumped into a larger
class labeled “Vitamins”).
Received: 23 January 2021; Accepted: 14 June 2021
References
1. Godfray, H. C. J. et al. Meat consumption, health, and the environment. Science 361, eaam5324. https://doi.org/10.1126/science.
aam5324 (2018).
2. Hu, F. B., Otis, B. O. & McCarthy, G. Can plant-based meat alternatives be part of a healthy and sustainable diet?. JAMA 322,
1547–1548. https://doi.org/10.1001/jama.2019.13187 (2019).
3. Godfray, H. C. J. Meat: The future series—Alternative proteins. World Economic Forum, Geneva, Switzerland, http://www3.wefor
um.org/docs/WEF_White_Paper_Alternative_Proteins.pdf. Accessed 24 July 2020 (2019).
4. Curtain, F. & Grafenauer, S. Plant-based meat substitutes in the flexitarian age: An audit of products on supermarket shelves.
Nutrients. https://doi.org/10.3390/nu11112603 (2019).
5. Van Vliet, S., Kronberg, S. L. & Provenza, F. D. Plant-based meats, human health, and climate change. Front. Sust. Food. Syst. https://
doi.org/10.3389/fsufs.2020.00128 (2020).
6. Sha, L. & Xiong, Y. L. Plant protein-based alternatives of reconstructed meat: Science, technology, and challenges. Trends. Food.
Sci. Technol. 20, S0924-2244. https://doi.org/10.1016/j.tifs.2020.05.022 (2020).
7. STATISTA. Meat substitutes market in the U.S. https://www.statista.com/ (2020).
8. Bohrer, B. M. An investigation of the formulation and nutritional composition of modern meat analogue products. Food Sci. Hum.
Well. 8, 320–329. https://doi.org/10.1016/j.fshw.2019.11.006 (2019).
9. International Food Council. A consumer survey on plant alternatives to animal meat. https://foodinsight.org/wp-content/uploa
ds/2020/01/IFIC-Plant-Alternative-to-Animal-Meat-Survey.pdf (2020).
10. Barabási, A.-L., Menichetti, G. & Loscalzo, J. The unmapped chemical complexity of our diet. Nat. Food 1, 33–37. https://doi.org/
10.1038/s43016-019-0005-1 (2020).
11. Kanehisa, M. Toward understanding the origin and evolution of cellular organisms. Protein Sci. 28, 1947–1951. https://doi.org/
10.1002/pro.3715 (2019).
12. Shestopalov, A. V. et al. Biological functions of allantoin. Biol. Bull. 33, 437–440. https://doi.org/10.1134/S1062359006050037
(2006).
13. Kohen, R., Yamamoto, Y., Cundy, K. C. & Ames, B. N. Antioxidant activity of carnosine, homocarnosine, and anserine present in
muscle and brain. Proc. Natl. Acad. Sci. U.S.A. 85, 3175–3179. https://doi.org/10.1073/pnas.85.9.3175 (1988).
14. Paul, B. D. & Snyder, S. H. Therapeutic applications of cysteamine and cystamine in neurodegenerative and neuropsychiatric
diseases. Front. Neurol. 10, 1–9. https://doi.org/10.3389/fneur.2019.01315 (2019).
15. Ruxton, C. H. S., Reed, S. C., Simpson, M. J. A. & Millington, K. J. The health benefits of omega-3 polyunsaturated fatty acids: A
review of the evidence. J. Hum. Nutr. Diet. 17, 449–459. https://doi.org/10.1111/j.1365-277X.2004.00552.x (2004).
16. Kumar, M. N. V. R., Muzzarelli, R. A. A., Muzzarelli, C., Sashiwa, H. & Domb, A. J. Chitosan chemistry and pharmaceutical per-
spectives. Chem. Rev. 104, 6017–6084. https://doi.org/10.1021/cr030441b (2004).
17. Wu, G. Important roles of dietary taurine, creatine, carnosine, anserine and 4-hydroxyproline in human nutrition and health.
Amino Acids 20, 329–360. https://doi.org/10.1007/s00726-020-02823-6 (2020).
18. Briguglio, M. et al. Dietary neurotransmitters: A narrative review on current knowledge. Nutrients 10, 591. https://doi.org/10.
3390/nu10050591 (2018).
19. Løvaas, E. & Carlin, G. Spermine: An anti-oxidant and anti-inflammatory agent. Free Radic. Biol. Med. 11, 455–461. https://doi.
org/10.1016/0891-5849(91)90061-7 (1991).
20. Fricker, R. A., Green, E. L., Jenkins, S. I. & Griffin, S. M. The influence of nicotinamide on health and disease in the central nervous
system. Int. J. Tryptophan Res. 11, 1178646918776658. https://doi.org/10.1177/1178646918776658 (2018).
21. Reddy, L. H. & Couvreur, P. Squalene: A natural triterpene for use in disease management and therapy. Adv. Drug Deliv. Rev. 61,
1412–1426. https://doi.org/10.1016/j.addr.2009.09.005 (2009).
22. Wang, X., Guo, M., Song, H., Meng, Q. & Guan, X. Characterization of key odor-active compounds in commercial high-salt liquid-
state soy sauce by switchable GC/GC × GC–olfactometry–MS and sensory evaluation. Food Chem. 342, 128224. https://doi.org/
10.1016/j.foodchem.2020.128224 (2021).
23. Leipnitz, G. et al. In vitro evidence for an antioxidant role of 3-hydroxykynurenine and 3-hydroxyanthranilic acid in the brain.
Neurochem. Int. 50, 83–94. https://doi.org/10.1016/j.neuint.2006.04.017 (2007).
24. Tawaraya, K. et al. Metabolite profiling of soybean root exudates under phosphorus deficiency. Soil Sci. Plant. Nutr. 60, 679–694.
https://doi.org/10.1080/00380768.2014.945390 (2014).
25. Frei, B., England, L. & Ames, B. N. Ascorbate is an outstanding antioxidant in human blood plasma. Proc. Natl. Acad. Sci. U.S.A.
86, 6377–6381. https://doi.org/10.1073/pnas.86.16.6377 (1989).
26. Othman, R. A. & Moghadasian, M. H. Beyond cholesterol-lowering effects of plant sterols: clinical and experimental evidence of
anti-inflammatory properties. Nutr. Rev. 69, 371–382. https://doi.org/10.1111/j.1753-4887.2011.00399.x (2011).
27. Yamabe, N. et al. Evaluation of loganin, iridoid glycoside from Corni Fructus, on hepatic and renal glucolipotoxicity and inflam-
mation in type 2 diabetic db/db mice. Eur. J. Pharmacol. 648, 179–187. https://doi.org/10.1016/j.ejphar.2010.08.044 (2010).
28. Côté, G. L. Novel Enzyme Technology for Food Applications 243–269 (Woodhead Publishing, 2007).
29. Kabara, J. J. Antimicrobial agents derived from fatty acids. J. Am. Oil Chem. Soc. 61, 397–403. https://doi.org/10.1007/BF02678802
(1984).
30. Chen, J. et al. Structure-antioxidant activity relationship of methoxy, phenolic hydroxyl, and carboxylic acid groups of phenolic
acids. Sci. Rep. 10, 2611. https://doi.org/10.1038/s41598-020-59451-z (2020).
31. Piper, J. D. & Piper, P. W. Benzoate and sorbate salts: A systematic review of the potential hazards of these invaluable preservatives
and the expanding spectrum of clinical uses for sodium benzoate. Compr. Rev. Food Sci. Food Saf. 16, 868–880. https://doi.org/10.
1111/1541-4337.12284 (2017).
32. Goodner, K. & Rouseff, R. Practical Analysis of Flavor and Fragrance Materials (Wiley, 2011).
Scientific Reports | (2021) 11:13828 | https://doi.org/10.1038/s41598-021-93100-3 10
Vol:.(1234567890)www.nature.com/scientificreports/
33. Vo, Q. V. et al. Theoretical and experimental studies of the antioxidant and antinitrosant activity of syringic acid. J. Organ. Chem.
85, 15514–15520 (2020).
34. Karković Marković, A., Torić, J., Barbarić, M. & Jakobušić Brala, C. Hydroxytyrosol, tyrosol and derivatives and their potential
effects on human health. Molecules 24, 2001. https://doi.org/10.3390/molecules24102001 (2019).
35. Chong, J., Wishart, D. S. & Xia, J. Using MetaboAnalyst 4.0 for comprehensive and integrative metabolomics data analysis. Curr.
Protoc. Bioinformatics 68, e86. https://doi.org/10.1002/cpbi.86 (2019).
36. Tallima, H. & El Ridi, R. Arachidonic acid: Physiological roles and potential health benefits—A review. J. Adv. Res. 11, 33–41.
https://doi.org/10.1016/j.jare.2017.11.004 (2018).
37. Rokicki, J. et al. Daily carnosine and anserine supplementation alters verbal episodic memory and resting state network connectivity
in healthy elderly adults. Front. Aging Neurosci. 7, 1–11. https://doi.org/10.3389/fnagi.2015.00219 (2015).
38. Avgerinos, K. I., Spyrou, N., Bougioukas, K. I. & Kapogiannis, D. Effects of creatine supplementation on cognitive function of
healthy individuals: A systematic review of randomized controlled trials. Exp. Gerontol. 108, 166–173. https://doi.org/10.1016/j.
exger.2018.04.013 (2018).
39. Fang, Y. Z., Yang, S. & Wu, G. Y. Free radicals, antioxidants, and nutrition. Nutrition 18, 872–879. https://doi.org/10.1016/s0899-
9007(02)00916-4 (2002).
40. Márquez Campos, E., Stehle, P. & Simon, M.-C. Microbial metabolites of flavan-3-ols and their biological activity. Nutrients 11,
2260. https://doi.org/10.3390/nu11102260 (2019).
41. Madeo, F., Eisenberg, T., Pietrocola, F. & Kroemer, G. Spermidine in health and disease. Science 359, eaan2788. https://doi.org/10.
1126/science.aan2788 (2018).
42. Dayrit, F. M. The properties of lauric acid and their significance in coconut oil. J. Am. Oil Chem. Soc. 92, 1–15. https://doi.org/10.
1007/s11746-014-2562-7 (2015).
43. Venn-Watson, S., Lumpkin, R. & Dennis, E. A. Efficacy of dietary odd-chain saturated fatty acid pentadecanoic acid parallels broad
associated health benefits in humans: could it be essential?. Sci. Rep. 10, 8161. https://doi.org/10.1038/s41598-020-64960-y (2020).
44. Forouhi, N. G. et al. Differences in the prospective association between individual plasma phospholipid saturated fatty acids and
incident type 2 diabetes: the EPIC-InterAct case-cohort study. Lancet Diabetes Endocrinol. 2, 810–818. https://doi.org/10.1016/
S2213-8587(14)70146-9 (2014).
45. Liu, S., van der Schouw, Y. T., Soedamah-Muthu, S. S., Spijkerman, A. M. & Sluijs, I. Intake of dietary saturated fatty acids and
risk of type 2 diabetes in the European Prospective Investigation into Cancer and Nutrition-Netherlands cohort: associations by
types, sources of fatty acids and substitution by macronutrients. Eur. J. Nutr. 58, 1125–1136 (2019).
46. Fardet, A. & Rock, E. Perspective: Reductionist nutrition research has meaning only within the framework of holistic and ethical
thinking. Adv. Nutr. 9, 655–670. https://doi.org/10.1093/advances/nmy1044 (2018).
47. Jacobs, D. R. Jr. & Tapsell, L. C. Food, not nutrients, is the fundamental unit in nutrition. Nutr. Rev. 65, 439–450. https://doi.org/
10.1111/j.1753-4887.2007.tb00269.x (2007).
48. Hunt, J. R., Gallagher, S. K., Johnson, L. K. & Lykken, G. I. High- versus low-meat diets: Effects on zinc absorption, iron status,
and calcium, copper, iron, magnesium, manganese, nitrogen, phosphorus, and zinc balance in postmenopausal women. Am. J.
Clin. Nutr. 62, 621–632. https://doi.org/10.1093/ajcn/62.3.621 (1995).
49. Xiao, Q. et al. Dietary and supplemental calcium intake and cardiovascular disease mortality: The National Institutes of Health–
AARP Diet and Health Study. JAMA Intern. Med. 173, 639–646. https://doi.org/10.1001/jamainternmed.2013.3283 (2013).
50. Chen, F. et al. Association among dietary supplement use, nutrient intake, and mortality among U.S. adults: A cohort study. Ann.
Intern. Med. 170, 604–613. https://doi.org/10.7326/m18-2478 (2019).
51. Hurrell, R. F. et al. Soy protein, phytate, and iron absorption in humans. Am. J. Clin. Nutr. 56, 573–578. https://doi.org/10.1093/
ajcn/56.3.573 (1992).
52. Welch, R. M. in Zinc in Soils and Plants: Proceedings of the International Symposium on ‘Zinc in Soils and Plants’ held at The Uni-
versity of Western Australia, 27–28 September, 1993 (ed A. D. Robson) 183–195 (Springer, 1993).
53. Hurrell, R. & Egli, I. Iron bioavailability and dietary reference values. Am. J. Clin. Nutr. 91, 1461s–1467s. https://doi.org/10.3945/
ajcn.2010.28674F (2010).
54. Fraser, R. Z., Shitut, M., Agrawal, P., Mendes, O. & Klapholz, S. Safety evaluation of soy leghemoglobin protein preparation derived
from Pichia pastoris, intended for use as a flavor catalyst in plant-based meat. Int. J. Toxicol. 37, 241–262. https://doi.org/10.1177/
1091581818766318 (2018).
55. Proulx, A. K. & Reddy, M. B. Iron bioavailability of hemoglobin from soy root nodules using a Caco-2 cell culture model. J. Agric.
Food. Chem. 54, 1518–1522. https://doi.org/10.1021/jf052268l (2006).
56. Sandström, B., Almgren, A., Kivistö, B. & Cederblad, Å. Effect of protein level and protein source on zinc absorption in humans.
J. Nutr. 119, 48–53. https://doi.org/10.1093/jn/119.1.48 (1989).
57. Adesogan, A. T., Havelaar, A. H., McKune, S. L., Eilittä, M. & Dahl, G. E. Animal source foods: Sustainability problem or malnu-
trition and sustainability solution? Perspective matters. Glob. Food. Secur. 25, 100325. https://doi.org/10.1016/j.gfs.2019.100325
(2020).
58. Phillips, S. M. et al. Commonly consumed protein foods contribute to nutrient intake, diet quality, and nutrient adequacy. Am. J.
Clin. Nutr. 101, 1346S-1352S. https://doi.org/10.3945/ajcn.114.084079 (2015).
59. Satija, A. et al. Plant-based dietary patterns and incidence of type 2 diabetes in US men and women: Results from three prospective
cohort studies. PLoS Med 13, e1002039. https://doi.org/10.1371/journal.pmed.1002039 (2016).
60. Key, T. J. et al. Cancer in British vegetarians: updated analyses of 4998 incident cancers in a cohort of 32,491 meat eaters, 8612 fish
eaters, 18,298 vegetarians, and 2246 vegans. Am. J. Clin. Nutr. 100(Suppl 1), 378S-385S. https://doi.org/10.3945/ajcn.113.071266
(2014).
61. Kim, H. et al. Plant-based diets are associated with a lower risk of incident cardiovascular disease, cardiovascular disease mortal-
ity, and all-cause mortality in a general population of middle-aged adults. JAMA 8, e012865. https://doi.org/10.1161/JAHA.119.
012865 (2019).
62. Zhong, V. W. et al. Protein foods from animal sources, incident cardiovascular disease and all-cause mortality: A substitution
analysis. Int. J. Epidemiol. 50, 223–233. https://doi.org/10.1093/ije/dyaa205 (2021).
63. Schwingshackl, L. et al. Food groups and risk of all-cause mortality: A systematic review and meta-analysis of prospective studies.
Am. J. Clin. Nutr. 105, 1462–1473. https://doi.org/10.3945/ajcn.117.153148 (2017).
64. Kappeler, R., Eichholzer, M. & Rohrmann, S. Meat consumption and diet quality and mortality in NHANES III. Eur. J. Clin. Nutr.
67, 598–606. https://doi.org/10.1038/ejcn.2013.59 (2013).
65. Schulze, M. B., Manson, J. E., Willett, W. C. & Hu, F. B. Processed meat intake and incidence of Type 2 diabetes in younger and
middle-aged women. Diabetologia 46, 1465–1473. https://doi.org/10.1007/s00125-003-1220-7 (2003).
66. Grosso, G. et al. Health risk factors associated with meat, fruit and vegetable consumption in cohort studies: A comprehensive
meta-analysis. PLOS ONE 12, e0183787. https://doi.org/10.1371/journal.pone.0183787 (2017).
67. Key, T. J. et al. Mortality in British vegetarians: Review and preliminary results from EPIC-Oxford. Am. J. Clin. Nutr. 78, 533S-538S.
https://doi.org/10.1093/ajcn/78.3.533S (2003).
68. Mihrshahi, S. et al. Vegetarian diet and all-cause mortality: Evidence from a large population-based Australian cohort—The 45
and up study. Prev. Med. 97, 1–7. https://doi.org/10.1016/j.ypmed.2016.12.044 (2017).
Scientific Reports | (2021) 11:13828 | https://doi.org/10.1038/s41598-021-93100-3 11
Vol.:(0123456789)You can also read