Urban storm water infiltration systems are not reliable sinks for biocides: evidence from column experiments
←
→
Page content transcription
If your browser does not render page correctly, please read the page content below
www.nature.com/scientificreports
OPEN Urban storm water infiltration
systems are not reliable sinks
for biocides: evidence from column
experiments
Marcus Bork1,2*, Jens Lange1, Markus Graf‑Rosenfellner2, Birte Hensen3, Oliver Olsson3,
Thomas Hartung2, Elena Fernández‑Pascual3,4 & Friederike Lang2
Groundwater quality in urban catchments is endangered by the input of biocides, such as those used
in facade paints to suppress algae and fungal growth and washed off by heavy rainfall. Their retention
in storm water infiltration systems (SIS) depends, in addition to their molecular properties, on
chemical properties and structure of the integrated soil layer. These soil properties change over time
and thus possibly also the relevance of preferential flow paths, e.g. due to ongoing biological activity.
To investigate the mobility of biocides in SIS, we analyzed the breakthrough of differently adsorbing
tracers (bromide, uranine, sulforhodamine B) and commonly used biocides (diuron, terbutryn,
octhilinone) in laboratory column experiments of undisturbed soil cores of SIS, covering ages from 3
to 18 years. Despite similar soil texture and chemical soil properties, retention of tracers and biocides
differed distinctly between SIS. Tracer and biocide breakthrough ranged from 54% and 5%, to 96% and
54%, respectively. We related the reduced solute retention to preferential transport in macropores
as could be confirmed by brilliant blue staining. Our results suggest an increasing risk of groundwater
pollution with increasing number of macropores related to biological activity and the age of SIS.
Urban storm water management concepts such as green infrastructure (GI) have become increasingly imple-
mented worldwide for their numerous environmental b enefits1–4. One example of GI is local infiltration of urban
storm water that, in Germany, is required by the German federal water law5 due to benefits for micro-climate6
and urban hydrology such as reducing storm water quantity7, 8, restoring groundwater levels9–11 and relieving
sewer systems12. However, the direct infiltration of urban storm water could lead to groundwater pollution since
storm water may be loaded with n utrients13, heavy metals14, 15 and organic pollutants such as hydrocarbons16, 17
and pesticides18–20. Recently, biocides used in facade renders and paints to suppress algae and fungal growth21 are
receiving increasing attention as they can be washed off from facades by heavy r ainfall22–25. This biocide wash-off
occurs during entire rain e vents26, depends on the conditions of the rainfall and on transport processes within
the facade m aterial27 and happens even fourteen years after painting of the facade28.
Biocide-loaded storm water either infiltrates into the soil around h ouses29 or is directed into SIS such as
swales and swale-trench-systems. Together with local infiltration of storm water, the purpose of SIS is to reduce
moderate contaminant load30, 31. Reviews of17 and32 showed that this may be the case for hydrocarbons or pes-
ticides. However28, recently showed that SIS could be pathways for biocides and their transformation products
into groundwater. Consequently, further research is needed on factors that may favor the leaching of organic
pollutants in SIS.
Generally, the uppermost layer of swales and swale-trench-systems consists of topsoil m aterial33. In these
layers, organic pollutants such as biocides may be retained by similar processes as in natural soils: transforma-
tion, mineralization, plant uptake and sorption (in the following we will call the uppermost soil filter media of
SIS only soil). These processes depend on molecular properties of the solutes, on the vegetation cover and on the
physical and chemical soil properties such as pH, organic matter (OM) content, texture and s tructure34, which
1
Hydrology, Faculty of Environment and Natural Resources, University of Freiburg, 79098 Freiburg,
Germany. 2Soil Ecology, Faculty of Environment and Natural Resources, University of Freiburg, 79098 Freiburg,
Germany. 3Institute of Sustainable and Environmental Chemistry, Leuphana University Lüneburg,
21335 Lünbeburg, Germany. 4Environmental Research Institute, University College Cork, Cork T23 XE10,
Ireland. *email: marcus.bork@hydrology.uni-freiburg.de
Scientific Reports | (2021) 11:7242 | https://doi.org/10.1038/s41598-021-86387-9 1
Vol.:(0123456789)www.nature.com/scientificreports/
Figure 1. Depth-dependent soil properties: (a) stone content [% (w/w)], (b) bulk density (g cm−3), (c) pH
(0.01 M CaCl2) and (d) organic carbon content (OC) [% (w/w)] of the three sites F3, W.10, V18. The error bars
are the standard deviation (n = 4).
change with time. Furthermore, the retention can be limited by the formation of preferential flow paths. Evidence
regarding the relevance of these different processes is missing so far.
Typically, soil pores are clogged by the entry of suspended solids with storm w ater35 thus reducing water
infiltration. Nevertheless, the hydraulic efficiency of SIS has been reported to be maintained even after long-
term operation8, 33, 36. To the best of our knowledge, no study has systematically addressed this contradiction
so far. One explanation could be an increased number of preferential flow paths due to root growth and other
biological activity that compensates for soil pore clogging. Yet preferential flow paths induce solute t ransport37
as observed for pesticides in agricultural s oils38, 39. Thus, we investigated three SIS with regard to the influence
of preferential flow paths on the transport of biocides.
We analyzed the depth distributions of physical and chemical soil properties and conducted laboratory-
scale percolation experiments using undisturbed soil core samples from three SIS established 3, 10 and 18
years ago (F.3, W.10 and V.18). In these experiments we investigated the breakthrough of three commonly used
biocides29, 40: diuron (3-(3,4-dichlorophenyl)-1,1-dimethylurea), terbutryn (N2-tert-butyl-N4-ethyl-6-methyl-
sulfanyl-1,3,5-triazine-2,4-diamine), and OIT (2-octyl-1,2-thiazol-3-one). Furthermore, we applied a tracer
mix of non-adsorbing bromide (Br−) and chloride (Cl−), together with the variously adsorbing fluorescent dyes
uranine (UR) and sulforhodamine B (SRB) that are often used to investigate preferential flow41–44. With this
multi-tracer approach and a staining of the soil column using brilliant blue, we aimed to investigate pollutant
retention capacity of different SIS.
Results and discussion
Soil properties. Stone content. The stone content ranged from 15 ± 8% (w/w) at V.18 to 44 ± 13% (w/w)
at F.3 (Fig. 1a, Table 1). These differences between sites may partly be due to different sources of the raw material
used to create the SIS. Further, the stone content increased with depth within the first 15 cm (V.18) and 10 cm
(W.10), but remained approximately constant over depth at F.3. Hence, the stone content in the upper layers of
the older SIS (W.10 and V.18) was lower than in the lower layers. These depth-related differences at each site
may be related to time-dependent developments within the SIS. In the uppermost layers of V.18 and W.10, stone
content was comparatively low probably due to input of fine mineral and organic particles by storm water. For
Scientific Reports | (2021) 11:7242 | https://doi.org/10.1038/s41598-021-86387-9 2
Vol:.(1234567890)www.nature.com/scientificreports/
Sand Silt Clay
Site.age Stones [% (w/w)] pHa (–) OC [% (w/w)] Bulk density (g cm−3) [% (w/w)]
F.3 44 ± 13 7.5 ± 0.1 1.1 ± 0.2 1.6 ± 0.2 80 ± 2 16 ± 2 5±1
W.10 34 ± 10 7.2 ± 0.1 1.6 ± 0.8 1.4 ± 0.2 73 ± 4 20 ± 3 7±1
V.18 15 ± 8 7.1 ± 0.1 1.9 ± 1.2 1.3 ± 0.2 57 ± 7 34 ± 6 9±2
Table 1. Soil properties of SIS. They are calculated as the mean of all depth steps of four soil cores ± standard
deviation. Since the number of depth steps differed between the sites and the number of laboratory repetitions
differed, the number of repetitions varied among the methods and the sites (pH: n = 51–69, OC: n = 17–23,
Stones: n = 16–22, Bulk density: n = 16–22; for details see Table S4). a pH in 0.01 M CaCl2.
the oldest SIS (V.18), this assumption is supported by the field observation of soil material lying on a bricked
stone border near the inflow within the SIS.
Bulk density. The bulk density in the upper layers of the different SIS increased in the following order: V.18
< W.10 < F.3 (Fig. 1b, Table 1). At V.18, we observed the strongest change with depth from 1.0 ± 0.1 g cm−3
(0–5 cm) to 1.5 ± 0.1 g cm−3 (15–20 cm). In contrast, we observed almost no depth-dependent change of bulk
density at the youngest site of F.3 (1.6 ± 0.2 g cm−3).
In samples of the older sites of V.18 and W.10, low bulk densities in the uppermost layers compared to deeper
layers were probably caused by the activity of macrofauna, an intensive rooting, a higher organic carbon (OC)
content and the input of strongly sorted fine material. The older the SIS, the stronger the effect of these factors.
At F.3 the bulk density was relatively high. Here, we supposed an uniform compaction of the soil layer under
the topsoil during construction. This assumption was supported by the observation of redox characteristics
(iron-red stains next to grey iron-depleted areas) in the soil at approximately 25 cm depth caused by the lack of
oxygen due to accumulating w ater45 in compacted soil.
Texture. The mean texture of fine soil at all SIS was very similar: 57–80% (w/w) sand, 16–34% (w/w) silt and
5–9% (w/w) clay, since similar textured materials were used for construction to guarantee solute retention and
sufficient hydraulic c onductivity31. Average clay contents of all SIS were within acceptable ranges of Best Man-
agement Practice (BMP) claimed by ATV-DVWK A-138 (< 10% (w/w) clay)31.
The clay fraction at the oldest SIS (V.18) decreased slightly with depth from 12% (w/w) at 0–5 cm to 7% (w/w)
at 20–25 cm (Figure S4) while it remained constant with depth at W.10 and F.3. Since a homogeneous texture
after SIS construction can be assumed for each SIS, a higher clay content in the uppermost layers suggested fine
particle deposition by storm water, as was observed b y46.
pH. The pH was above 7.0 at nearly all sites and depths (Fig. 1c, Table 1) and was thus within the range of
BMP31.
The pH increased slightly in the following order: V.18 < W.10 < F.3. These slight pH differences among the
SIS could be either due to age (stronger acidification of older soils) or due to different initial pH values of the
topsoil materials.
Furthermore, the pH increased with depth at all sites, which was stronger at older sites (V.18 and W.10) than
at F.3. These larger depth-gradients at older sites indicate a relationship between pH and age of the sites: older
SIS were more acidified in the upper layers than the youngest SIS (F.3) due to the input of acids by precipitation,
the production of CO2 by soil respiration and the release of protons and organic acids by roots45.
Organic carbon content. The OC content and the slope of depth-gradients within the upper 15 cm increased
from 1.15 ± 0.3% (w/w) at the youngest SIS to 2.85 ± 0.9% (w/w) at the oldest SIS (Fig. 1d, Table 1). This indi-
cates that, in general, OC accumulated during soil development in upper soil layers while the stone content, the
bulk density and the pH decreased. Overall, the OC contents of all SIS were within the BMP r anges31.
Soil development and spatial variability. All soil parameters described above and especially the development
of depth gradients indicate continuous soil development (alteration of important soil properties such as pH,
texture, OC content and distribution) in the investigated SIS due to physical and chemical processes and sedi-
ment input with storm water. Consequently, biological activity also increased, as shown by the observation of
macrofauna at V.18 (earthworms) and W.10 (ants) while no macrofauna was observed at F.3. Overall, age of SIS
is reflected in the soil properties after only a few years.
We assumed that the spatial variability of the soils within each SIS was relatively small, as probably only
one material was used to build up the upper soil layer. As described above, a low spatial variability within each
SIS was confirmed by the low variability of analyzed soil properties of the soil samples (n = 4). Therefore, we
assumed in the present study that one soil column with a wide diameter (20 cm) at each SIS can be considered
representative of the SIS inflow area. To determine the influence of flow paths on solute transport we thus
considered a column experiment without repetition as sufficient to further investigate the differences between
the SIS. This is common for such complex column experiments with undisturbed soils (see e.g.47–49) since their
performance is very time-consuming.
Scientific Reports | (2021) 11:7242 | https://doi.org/10.1038/s41598-021-86387-9 3
Vol.:(0123456789)www.nature.com/scientificreports/
qavc qmind qmaxc Kse
Column (site.age) dcol (cm) Lcol (cm) PVtot,est a (L) Time (h) TPSb (L) (cm h−1)
F.3 20 21 1.29 28.0 5.2 0.59 0.32 0.97 0.18
W.10 20 25 1.91 12.7 7.6 1.91 1.58 2.60 0.66
V.18 20 25 2.80 12.7 11.2 2.82 2.40 3.70 0.98
Table 2. Soil column properties, water fluxes q [average (av), minimum (min) and maximum (max)]
and total percolated water (L) during the column experiment in the three soil columns F3, W.10 and V.18.
a
PVtot,est : estimated total pore volume: estimated from pedotransfer functions according t o50 and corrected
by stone content (see Eq. 1). b TPS: total percolated biocide/tracer solution (L) after the percolation of four
pore volumes. cqav is the average water flux through the soil column and is the slope of the linear regression
of the outflow (L) over time (h). dqmin and qmax are the lowest and the highest calculated water flux during the
column experiment. e Calculated according to Eq. (2) with qav and a hydraulic head gradient of 3.2 cm cm−1
(F.3) and 2.9 cm cm−1 (W.10 and V.18).
Percolation experiment. Saturated hydraulic conductivity and water flux. The saturated hydraulic con-
ductivity K s (cm h−1) differed strongly between the soil columns (Table 2). It was lowest in the youngest SIS F.3
(0.18 cm h−1), four times higher at W.10 (0.66 cm h−1), and approximately six times higher in the oldest SIS V.18
(0.98 cm h−1). Water flow velocities at all sites and time steps were in the optimal range for urban swale systems
defined by BMP (0.006 cm h−1 < q < 6 cm h−1)31.
The water flux decreased continuously with time in all soil columns: in W.10 and V.18 approximately 1.5
times and in F.3 approximately 3 times (Table 2, Figure S7 and Fig. S8). This could be due to clogging of pores
in the 0.45 µm nylon membrane by c olloids51 or dissolved organic m atter52. In our experiment, the existence of
colloids was likely as they could be mobilized by a decreased ionic strength of the infiltrating deionized w ater53.
Tracer breakthrough. Breakthrough curves (BTCs) of Br− and Cl− reached 90–100% at the outlet of all soil
columns after percolation of four pore volumes (PV) (Fig. 2). Both ions showed the fastest breakthrough of all
tracers suggesting only a weak interaction with the soil matrix; as in other studies, they can be considered as con-
servative tracers54, 55. Nevertheless, in our experiment, this assumption was challenged by the observation in the
youngest SIS (F.3): after the percolation of one PV, only 30% Br− and Cl− broke through. Under the assumption
that the transport of Br− and Cl− is only determined by convection, diffusion and dispersion, 50% of the solutes
should have reached the outlet after one PV was e xchanged56. The 20% deficit indicated that weak adsorption
of Br− and Cl− occurred in F.3 as was also observed by other researchers, e.g.57. In contrast, at W.10 and V.18
substantially more than 50% Br− reached the outlet after one PV, indicating fast transport of Br− in macropores.
However, since the PV of the individual soil columns are only rough estimates, they are subject to uncertainty.
Therefore, the deviation from 50% solute breakthrough at a PV equals one could also be partly explained by the
uncertainties in the calculation of the PV.
With the exception of UR at V.18, BTCs of UR and SRB did not reach 100% after four PV. Instead, their
breakthrough maxima were 51 ± 2% (F.3) and 79 ± 1% (W.10) for UR; and 25 ± 1% (F.3), 70 ± 1%
(W.10), and 90 ± 2% (V.18) for SRB. Maxima of BTCs at F.3 and W.10 increased in the following order:
SRB < UR < Br− ≈ Cl−. At V.18, this order slightly differed (SRB < UR ≈ Br− ≈ Cl−). These results indicated
a stronger retention of the fluorescent tracers compared to Br− and Cl− most likely due to their higher adsorp-
tion affinity58. The higher retention of SRB compared to UR was in accordance with literature59, 60 and linear
sorption coeffients (Kd-values) for SRB that were about twice as high compared to UR (Table S1 and Figure S11)
for all SIS. However, the high discrepancy between the retention of conservative tracers (Br−, Cl−) and UR at
F.3 revealed that UR ought to be considered as a non-conservative tracer with respect to its sorption properties.
This was described previously for UR application in soils with comparable OC content, texture and p H44, 61, 62.
We observed a faster breakthrough of all substances in W.10 and V.18 than in F.3 as indicated by higher slopes
and higher maxima of BTCs (Fig. 2). After the percolation of one PV, 29% (F.3), 73% (W.10), and 93% (V.18) of
the Br− inflow concentrations were reached. Due to the small differences between the chemical soil properties
of the SIS and the Kd values of UR and SRB (Table S1), we would have expected similar tracer BTCs. Yet, this
was not the case; tracer retention decreased with age from the youngest to the oldest SIS (F.3www.nature.com/scientificreports/
Figure 2. Breakthrough curves (BTCs) of the tracers bromide, chloride, UR, SRB and the biocides diuron,
terbutryn, OIT and the sum of biocides (diuron+terbutryn+OIT; represented by diamonds). The normalized
concentrations c/c0 (%) in the outflow from soil columns was plotted against the pore volume (–).
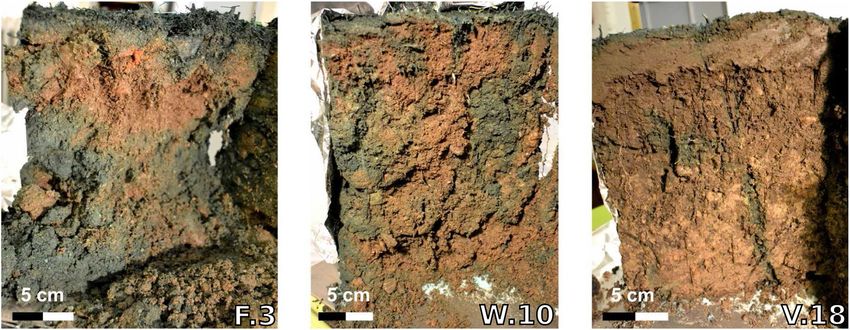
Figure 3. Brilliant blue stained soil columns (F.3, W.10 and V.18).
Furthermore, similar BTCs of conservative and non-conservative tracers with different adsorption affinities
ow63–65.
indicate strong transport in macropores by preferential fl
Brilliant blue staining. Roughly 65% of F.3, 38% of W.10 and 8% of V.18 (Figure S10) were stained. Along the
cut profile large blue patches were visible for F.3 while only single blue fingers were observable for V.18 (Fig. 3).
These macropores, especially in V.18, were most probably caused by earthworms45, 66. In fact, approximately ten
Scientific Reports | (2021) 11:7242 | https://doi.org/10.1038/s41598-021-86387-9 5
Vol.:(0123456789)www.nature.com/scientificreports/
Table 3. Characterisation of fluorescent tracers and biocides. aColor Index (Name:Number): UR (Acid Yellow
73 : 45350)58 ; SRB (Acid Rd 52 : 45100)58; b log(KOW ) for the twofold protonated (neutral) species (dominant
species between pH 1.95 and 5.05), Calculated with Estimation Programs Interface Suite for Microsoft
Windows, v 4.1199; c log(KOW ) for the disodium salt (twofold negative charged) species (dominant species above
pH 7.00), Calculated with Estimation Programs Interface Suite for Microsoft Windows, v 4.1199; dlog(KOW ) at
pH 7.15100; e Source:58; f Source:94; g Source:101; hSource:102; i Source:103; j Source:29.
individuals were observed on the laboratory columns after saturation from bottom to top. Earthworm holes
were visible on the soil surface as well as on horizontal and vertical cuts through the soil column (approximately
2–3 mm, Figure S9). At W.10 several ants were observed that also could cause macropores67, 68. In contrast, no
macrofauna was visible at F.3. Overall, brilliant blue patterns supported the assumption of an increasing fraction
of preferential flow in the older SIS W.10 and V.18.
Brilliant blue staining also revealed partial water flow on the soil column s idewall69 that bypassed a part of
the soil column F.3 and entered the soil again further down (Fig. 3). This partial sidewall flow could potentially
explain the fast initial Br−, Cl− and UR breakthrough in F.3 where 5–10% of the tracers was measured in the first
sample taken after 30 min (Fig. 2). However, this effect was limited since concentrations remained only initially
constant and increased again after approximately 0.5 PV. Interestingly, this effect could not be observed for the
stronger adsorbing SRB. Possibly, SRB was initially retained and therefore could not be measured in the first
percolates. Similar transport characteristics of UR and SRB in the beginning of the experiment were observed
e.g. in the study conducted by70.
Biocide breakthrough. At all sites, the biocide breakthrough increased in the following order: OIT < terbutryn <
diuron. This order followed the polarity of the substances as indicated by the KOW -values (Table 3) which can be
interpreted as a rough estimate for the sorption affinity of non-polar substances to organic m atter71, 72. Further-
more, except for diuron at W.10 and V.18, biocides were more strongly retained than the tracers in all SIS. This
observation may be explained as follows: the walls of macropores caused by earthworms may be enriched with
soil organic matter73. These macropores may provide hydrophobic sorption sites (organic matter) for non-polar
substances such as biocides and less for the polar tracers.
Analogous to UR and SRB, the retention of biocides was highest in F.3 (Fig. 2), followed by W.10 and V.18
and was negatively related to the OC content of all SIS (Table 1). Similar to the tracers, the large differences in
BTCs of biocides between the SIS cannot be explained by chemical soil properties but rather by soil structure.
In F.3, biocides had more intense contact with the soil matrix than in W.10 and V.18 due to a higher fraction of
matrix flow. As a result, biocide retention was highest in F.3 despite the lowest OC content. Thus, the influence
of biocide properties on their retention was strongly reduced by preferential flow in m acropores74, 75.
Although biocide degradation is unlikely due to the short duration of the experiment (approximately 13–28 h)
and due to immediate cooling and freezing of the samples after sampling, these processes could not be completely
ruled out. However, if a small amount of biocide degradation occurred, then concentrations would have been
reduced by the same amount in all samples. The differences in biocide concentrations between the individual
soil columns should not have been affected.
The rapid leaching of organic pollutants through macropores, has also been observed in several studies for
pesticides in agricultural soils38, 39. More biocide breakthrough in W.10 and V.18, especially that of diuron in
V.18 is in line with findings of76, who reported leaching of diuron due to complexation of diuron with dissolved
organic matter (DOM). This indicates that DOM molecules have a dual role on pollutant transport in soils: they
compete for adsorption of the organic pollutants and enhance their mobility by complexation. But their leaching
is enhanced by preferential transport in macropores following intense r ainfall77 or in strongly structured soils
with connection to shallow g roundwater78.
Important factors of fast solute breakthrough in urban SIS and implications for storm water
treatment. Despite similar chemical soil properties between the SIS, W.10 and V.18 showed a much faster
tracer and biocide breakthrough compared to F.3. Brilliant blue patterns and saturated hydraulic conductivities
indicated prevailing preferential flow conditions in macropores in SIS W.10 and V.18 that lead to fast solute
Scientific Reports | (2021) 11:7242 | https://doi.org/10.1038/s41598-021-86387-9 6
Vol:.(1234567890)www.nature.com/scientificreports/
breakthrough. Macropores can be caused by biological activity41, 79, which is supported by the observation of the
highest activity of macrofauna (earthworms and ants) in the older SIS W.10 and V.18. Therefore, in our experi-
ment the age of SIS is closely related to macrofauna activity. This observation is in agreement with results f rom80
who found an increasing earthworm population density with increasing age of different urban landscapes. Simi-
lar observations were made b y81 in technosols but they concluded that the existence of an initial addition of
topsoil is required, which was the case in all SIS of our study.
Beside the age of a soil, the abundance of earthworms is also controlled by bulk density and soil depth82. In
SIS V.18 bulk density was lowest and soil depth highest, both factors favoring high earthworm abundance. Thus,
different relevance of preferential flow in the different SIS may also be due to differences in the construction of the
SIS. If a SIS is built with a less thick topsoil layer or a high bulk density, or if other macrofauna-inhibiting factors
play a role, the development of the macrofauna may be restricted, making the development of preferential flow
paths in aging SIS less likely. Furthermore, climate can influence the population dynamics of e arthworms83, 84.
Therefore, we conclude that factors supporting higher activity of macrofauna (e.g. earthworms and ants) in SIS
may also lead to faster solute breakthrough.
Additional influence on macropore formation can be exerted by the vegetation of the swales, directly by
plants with thicker or deeper roots colonizing as development of the swales progresses, or indirectly by influ-
encing the diversity of i nvertebrates85. Due to necessary time for colonization and establishment of species also
the age of swales may be linked to the biodiversity. In addition to vegetation and soil structure, the shape of the
swales could also have an influence on diversity of invertebrate and thus on macropore formation. Reference85
supposed that biodiversity may be higher in round systems than in linear ones. However, we observed rather
the opposite, suggesting that age played a greater role for macrofauna diversity and macropore formation than
swale shape in our experiments.
Our experiment has shown that SIS can retain biocides by adsorption when the substances have sufficient
contact with the soil matrix. Inversely, our study also suggests a decrease in biocide retention capacity in urban
SIS due to preferential flow pathways caused by an increasing biological activity and changing soil properties
already after 10–18 years of operation. However, biological activity in SIS is also desirable due to several benefits.
Higher biodiversity of vegetation and soil fauna may enhance degradation of several organic pollutants and
higher infiltration rates, e.g. due to a higher number of macropores, may guaranty fast water infiltration even
after long-term operation. Overall, we recommend regular monitoring of the pollutant retention capacity of SIS
to detect its reduction in time, which could be done, for example, by tracer experiments.
One approach to address this problem is to treat storm water with special adsorbent m aterials86, 87 before it
enters the swales, or integrate additional adsorbent layers in the swales. However, these options are complex
and expensive and, furthermore, a large portion of urban runoff often infiltrates diffusely and does not reach the
swales at all. Therefore, a more sustainable approach, is to avoid biocide pollution at the s ource88, 89, which would
allow a targeted urban water management by SIS that preserves urban groundwater quality.
Methods
Study sites and soil characterization. We selected three SIS of different age (F.3, W.10 and V.18) in
the city of Freiburg, south-west Germany (Figure S1). F.3 (3 years old) was a nearly rectangular shaped swale
(approx. 600 m2) that drained a commercial area, W.10 (10 years old) a rectangular multilevel swale system
(approx. 700 m2), and V.18 (18 years old) an elongated swale-trench system (approx. 3000 m2), both drained a
residential area. F.3 consisted of a 25–30 cm topsoil layer over the natural soil layer. Beneath a 30–50 cm top-
soil layer of W.10 and V.18 there was a 20 cm sand layer followed by a gravel-filled drain trench to collect and
drain the seepage water. To ensure comparability despite different SIS geometry, all samples were taken in the
intermediate vicinity of the inflow and from similar depths (20–25 cm). Moreover, the inflow area is particularly
interesting because it represents the entry point of pollutants in the SIS. The vegetation of the swales consisted
mainly of grass as well as clover (Trifolium), dandelion (Taraxacum) and ribwort (Plantago).
From each SIS, four fixed volume soil cores (diameter: 8 cm, length: 15 cm) were taken with a root auger in a
2 × 2 m square at two depths (0–15 cm and 15–30 cm). This was performed in two steps (Figure S2): after taking
the upper soil core (0–15 cm), the deeper one was taken from the same bore hole (15–30 cm).
Using a knife, each soil core was cut into 5 cm wide pieces resulting in five (F.3, W.10) and six (V.18) depth-
related soil samples (0–5 cm, 5–10 cm, 10–15 cm, 15–20 cm, 20–25 cm, 25–30 cm; n = 4). Soil samples were
air-dried and weighed to calculate bulk density. Subsequently, the soil samples passed through a 2 mm sieve and
stones (inorganic particles > 2 mm) and roots were weighed separately. We determined the residual gravimetric
water content as the difference between the weight of an air-dried soil sample before and after 24 h of drying at
105 ◦ C. The pH was measured from over-night, 25 ml 0.01 M CaCl2 supsensions of 10 g soil at room temperature
(23 ◦ C ± 2 ◦ C) with a pH meter (Deutsche METROHM GmbH & Co KG, Filderstadt, Germany). The content
of sand, silt and clay (inorganic particles < 2 mm; fine soil) were determined by sieving, sedimentation and the
pipette method90. The OC content was determined by a CNS-analyzer (vario EL cube, Elementar Analysensys-
teme GmbH, Germany). Due to the possible carbonate content ( pH > 7.0), the OC content of the soil samples
was determined as the difference of total carbon before and after heating at 550 ◦ C. At this temperature OC had
been transformed to CO291. Additionally, sorption isotherms for UR and SRB were produced according to OECD
guideline 10692 described i n62 and linear sorption coeffients (Kd-values) were calculated.
Percolation experiment. In every SIS, one intact soil column was collected using a stainless steel cylinder
(diameter: 20 cm, length: 30 cm) that was knocked into the soil. The cylinder was excavated and the embedded
soil column was pushed into a second steel cylinder (Figure S3). The bottom of the soil column was straightened
with a knife and approx. 1–2 cm sand was added to ensure connection to a 0.45 µm nylon membrane. The height
Scientific Reports | (2021) 11:7242 | https://doi.org/10.1038/s41598-021-86387-9 7
Vol.:(0123456789)www.nature.com/scientificreports/
of soil column F.3 was lower (21 cm) than of W.10 and V.18 (25 cm) because the soil layer of F.3 was shallower.
During sampling, the vegetation was left on the soil column as far as possible. Where it was too long, it was
superficially shortened. Plants were not removed so as not to disturb the soil structure.
The top of the soil column was connected to two storage vessels (Figures S5, S6). The first storage vessel was
connected via a tube with a small liquid layer on the top of the soil (approximately 2 cm). The second storage
vessel was connected to the first one with two tubes that kept the water level between the storage vessels and the
soil column constant. At the bottom of the soil column, the solution was placed under tension with a 45 cm water
head to quicken flow rates and thus reduce anaerobic conditions in the soil column.The bottom of the column
was enclosed with a 0.45 µm nylon membrane. The percolate was collected in 1 L-glass bottles that were placed
on weighing devices (Figure S5) to calculate the flow rate. To avoid photodegradation, all vessels, tubes and
bottles were wrapped with aluminum foil. The soil columns were saturated with deionized water from bottom
to top at 7 cm d−1. Thereafter, deionized water was percolated to reach constant flow conditions and to decrease
the DOC load of the percolate. Pre-tests with Br− (NaBr, Carl Roth GmbH & Co KG, Karlsruhe, Germany) were
conducted to set up a sampling protocol for each soil column. Before starting the main experiment, Br− was
washed out by deionized water.
The main percolation experiment started with a 1.5 h flushing of the soil columns with deionized water.
Subsequently, all water in the storage vessels and on the soil surface was replaced by a tracer/biocide solution.
For each soil column, 15 L of initial solution consisting of deionized water, tracers and biocides were prepared.
Target tracer concentrations were 50 mg L−1 Br−, 25 mg L−1 Cl− (CaCl2, VWR International GmbH, Darmstadt,
Germany), 10 mg L−1 UR (Simon & Werner GmbH, Flörsheim, Germany), 400 mg L−1 SRB (Chroma GmbH &
Co KG, Münster, Germany). Target biocide concentrations are based on commonly measured concentrations
in facade r unoff93 and were 50 mg L−1 each of diuron, terbutryn (NEOCHEMA GmbH, Bodenheim, Germany)
and OIT (Sigma-Aldrich Chemie GmbH, Taufkirchen, Germany). The tracer stock solutions were prepared with
deionized water and solid substances, while the biocides were already dissolved in acetonitrile by the manu-
facturer. UR and SRB solutions were stored in amber glass bottles and wrapped with aluminum foil to prevent
photolytic decay.
The measured initial concentrations only slightly deviated from the intended concentrations (Table S5).
The experiment lasted for 28 h (F.3) and 12.7 h (W.10, V.18) depending on the flow velocity. We excluded bio-
degradation of biocides since their half-times in soils are much higher than the duration of the e xperiment29.
Furthermore, terbutryn, diuron and OIT are assumed to be stable to aqueous h ydrolysis28, 94. In the beginning
of the experiment, samples of the percolate were taken every 15 min, later every 20, 30, 45 or 60 min. An aliquot
of the collected percolate was filled into 100 mL amber glass bottles for UR, SRB and biocide measurements,
and 100 mL polyethylene bottles for Br−, Cl− and pH measurements. Samples were stored at approximately 6◦ C
for measurement for a maximum of ten days and frozen for longer storage. No changes in concentrations were
observed in preliminary laboratory tests measuring biocide concentrations before and after storage (freezing of
samples for multiple weeks).
The estimated total pore volume PVtot,est (L) of each soil column (Table 2) was calculated by the following:
stone content (%)
PVtot,est (L) = porosity (−) · 1 − · total volumn of the soil column (L). (1)
100%
The porosity (–) was estimated according t o50, who provide average porosities for soils in dependence of their
texture and OM content. The estimated water volume that flowed through the column at time t (PVt L L−1) was
calculated by dividing the outflow (L) at a certain time step by PVtot,est . PVt was used to normalize the perco-
lated amount of water and make solute transport comparable. Maxima of BTCs of the solutes were estimated by
calculating the mean breakthrough (%) between PVs of three and four. The saturated hydraulic conductivity Ks
(cm h−1) was calculated according to Darcy’s law:
H
q = Ks · . (2)
L
where q (cm h−1) is the water flow through the soil column, H (cm) is the hydraulic head difference between
upper and lower boundary of the soil column, and L (cm) is the length of the column. Data analysis was per-
formed with R statistics (version 3.3.4)95.
Brilliant blue staining. To identify preferential flow in soils of SIS we used brilliant blue staining as was
done before e.g. b y42, 96. In each soil column about 3.5 L (approximately one PV) brilliant blue FCF (Waldeck
GmbH & Co KG, Germany) solution (c = 2 g L−1) was applied. Due to different flow velocities, it took 23 h
(F.3), 8.2 h (W.10) and 5.2 h (V.18) until the brilliant blue solution infiltrated. Subsequently, we removed the soil
column from the steel cylinders, cut them in half using a knife and photographed them (Canon 450D) to make
flow pathways visible. Pictures were processed by Gimp 2.10 (The GIMP team, www.gimp.org) and ImageJ-win
64 (Fiji Is Just ImageJ, fiji.sc)97 (see Note S1). The correlation between the brilliant blue stained area of the soil
columns and the breakthrough maxima was tested with Pearson correlation coefficients.
Measurement of salt and fluorescent tracers. UR and SRB (Table 3) fluorescence was measured
at 488 nm (UR) and 560 nm (SRB) in a synchronous scan method (wavelength range: = 250–650 nm,
= 25 nm) using the luminescence spectrometer LS-50B (Perkin Elmer, MA, USA). Due to sensitivity of
H98, it was buffered before measurement at 9–10 using one drop of 1.5 M EDTA to ensure
tracer fluorescence to p
100% fluorescence intensity for both tracers. To ensure a linear calibration range, the calibration solutions were
Scientific Reports | (2021) 11:7242 | https://doi.org/10.1038/s41598-021-86387-9 8
Vol:.(1234567890)www.nature.com/scientificreports/
prepared in the ranges 0.25–5 µg L−1 (UR) and 5–90 µg L−1 (SRB). The calibration of UR and SRB was per-
formed separately for each SIS (extracting agent: 0.01 M CaCl2 solution, soil:solution-ratio: 1:5). Samples for the
measurement of UR and SRB were diluted 1:10 to reduce DOC background fluorescence and to maintain the
calibration range. Br− and Cl− were measured by ion chromatography (790 Personal IC, Deutsche METROHM
GmbH & Co KG, Filderstadt, Germany).
Measurement of biocides. Analysis of terbutryn, diuron and OIT was already described in detail i n28, 104.
For measurement of biocides, 3 mL of the percolates were evaporated to dryness with a Büchi Syncore Polyvap
(BÜCHI Labortechnik GmbH, Essen, Germany) and taken up in 0.3 mL acetonitrile (enrichment factor of 10).
90 µL of the percolate sample containing biocides were spiked with 10 µL of terbutryn-D5 as an internal stand-
ard. Measurements of percolate samples were conducted with a Triple Quadrupole mass spectrometer (Agilent
Technologies, 1200 Infinity LC-System and 6430 Triple Quad, Waldbronn, Germany). Therefore, a NUCLEO-
DUR RP-C18 column (125/2 100–3 µL C18 ec; MACHEREY-NAGEL GmbH & Co KG, Düren, Germany) was
used as stationary phase, whereas 0.01% formic acid (A) and acetonitrile (B) were used as mobile phases with a
flow of 0.4 mL min−1 and the following concentration gradient: 10% B (0–1 min), 10–50% B (1-11 min), 50–85%
B (11–18 min), 85–90% B (18–21 min), 90% B (21–24 min), 90–10% B (24–26 min), 10% B (26–30 min). Oven
temperature was T = 30 ◦ C and injection volume 5 µL. Mass spectrometric settings are listed in Table S2. The
linearity between peak area and concentration of substances were obtained in a range of 0–5 µg L−1. Hence, lim-
its of detection (LOD) and quantitation (LOQ) were calculated with DINTEST (2003) according to DIN 32645
and amounted to 1 and 2.65 µg L−1 (diuron), 0.76 and 2.94 µg L−1 (terbutryn), 0.86 and 2.99 µg L−1 (OIT),
respectively.
Data availability
All data generated or analyzed during this study are included in this published article (and its Supplementary
Information files).
Received: 15 September 2020; Accepted: 15 March 2021
References
1. Barbosa, A. E., Fernandes, J. N. & David, L. M. Key issues for sustainable urban stormwater management. Water Res. 46,
6787–6798. https://doi.org/10.1016/j.watres.2012.05.029 (2012).
2. Fletcher, T. D., Andrieu, H. & Hamel, P. Understanding, management and modelling of urban hydrology and its consequences
for receiving waters: A state of the art. Adv. Water Resour. 51, 261–279. https://doi.org/10.1016/j.advwatres.2012.09.001 (2013).
3. Eckart, K., McPhee, Z. & Bolisetti, T. Performance and implementation of low impact development—a review. Sci. Total Environ.
607–608, 413–432. https://doi.org/10.1016/j.scitotenv.2017.06.254 (2017).
4. Li, C. et al. Mechanisms and applications of green infrastructure practices for stormwater control: A review. J. Hydrol. 568,
626–637. https://doi.org/10.1016/j.jhydrol.2018.10.074 (2019).
5. Bundesministerium der Justiz und für Verbraucherschutz. Gesetz zur ordnung des wasserhaushalts (wasserhaushaltsgesetz-whg)
(2009).
6. Göbel, P. et al. Near-natural stormwater management and its effects on the water budget and groundwater surface in urban areas
taking account of the hydrogeological conditions. J. Hydrol. 299, 267–283. https://doi.org/10.1016/j.jhydrol.2004.08.013 (2004).
7. Shuster, W. D., Gehring, R. & Gerken, J. Prospects for enhanced groundwater recharge via infiltration of urban storm water
runoff: A case study. J. Soil Water Conserv. (J. Soil Water Conserv.) 62, 129–137 (2007).
8. Lucke, T. & Nichols, P. W. B. The pollution removal and stormwater reduction performance of street-side bioretention basins
after ten years in operation. Sci. Total Environ. 536, 784–792. https://doi.org/10.1016/j.scitotenv.2015.07.142 (2015).
9. Endreny, T. & Collins, V. Implications of bioretention basin spatial arrangements on stormwater recharge and groundwater
mounding. Ecol. Eng. 35, 670–677. https://doi.org/10.1016/j.ecoleng.2008.10.017 (2009).
10. Dillon, P. et al. Managed aquifer recharge: Rediscovering nature as a leading edge technology. Water Sci. Technol. 62, 2338–2345.
https://doi.org/10.2166/wst.2010.444 (2010).
11. Schirmer, M., Leschik, S. & Musolff, A. Current research in urban hydrogeology—a review. Adv. Water Resour. 51, 280–291.
https://doi.org/10.1016/j.advwatres.2012.06.015 (2013).
12. Boller, M. Towards sustainable urban stormwater management. Water Sci. Technol. Water Supply 4, 55–65 (2004).
13. Davis, A. P., Shokouhian, M., Sharma, H. & Minami, C. Water quality improvement through bioretention media: Nitrogen and
phosphorus removal. Water Environ. Res. Res. Publ. Water Environ. Feder. 78, 284–293. https://doi.org/10.2175/106143005X
94376 (2006).
14. Mikkelsen, P. S. et al. Pollution of soil and groundwater from infiltration of highly contaminated stormwater—a case study.
Water Sci. Technol.https://doi.org/10.1016/S0273-1223(97)00578-7 (1997).
15. Wong, C. S. C., Li, X. & Thornton, I. Urban environmental geochemistry of trace metals. Environ. Pollut. 142, 1–16. https://doi.
org/10.1016/j.envpol.2005.09.004 (2006).
16. Göbel, P., Dierkes, C. & Coldewey, W. G. Storm water runoff concentration matrix for urban areas. J. Contam. Hydrol. 91, 26–42.
https://doi.org/10.1016/j.jconhyd.2006.08.008 (2007).
17. LeFevre, G. H. et al. Review of dissolved pollutants in urban storm water and their removal and fate in bioretention cells. J.
Environ. Eng. 141, 04014050. https://doi.org/10.1061/(ASCE)EE.1943-7870.0000876 (2015).
18. Bucheli, T. D., Müller, S. R., Heberle, S. & Schwarzenbach, R. P. Occurrence and behavior of pesticides in rainwater, roof runoff,
and artificial stormwater infiltration. Environ. Sci. Technol. 32, 3457–3464. https://doi.org/10.1021/es980317n (1998).
19. Zgheib, S., Moilleron, R. & Chebbo, G. Priority pollutants in urban stormwater: Part 1—case of separate storm sewers. Water
Res. 46, 6683–6692. https://doi.org/10.1016/j.watres.2011.12.012 (2012).
20. Ensminger, M. P., Budd, R., Kelley, K. C. & Goh, K. S. Pesticide occurrence and aquatic benchmark exceedances in urban surface
waters and sediments in three urban areas of california, usa, 2008–2011. Environ. Monit. Assess. 185, 3697–3710. https://doi.
org/10.1007/s10661-012-2821-8 (2013).
21. Paulus, W. (ed.) Directory of Microbicides for the Protection of Materials (Springer, 2005).
22. Burkhardt, M. et al. Leaching of additives from construction materials to urban storm water runoff. Water Sci. Technol. 63, 1974.
https://doi.org/10.2166/wst.2011.128 (2011).
Scientific Reports | (2021) 11:7242 | https://doi.org/10.1038/s41598-021-86387-9 9
Vol.:(0123456789)www.nature.com/scientificreports/
23. Burkhardt, M. et al. Leaching of biocides from façades under natural weather conditions. Environ. Sci. Technol. 46, 5497–5503.
https://doi.org/10.1021/es2040009 (2012).
24. Wittmer, I. K., Scheidegger, R., Stamm, C., Gujer, W. & Bader, H.-P. Modelling biocide leaching from facades. Water Res. 45,
3453–3460. https://doi.org/10.1016/j.watres.2011.04.003 (2011).
25. Bollmann, U. E. et al. Leaching of terbutryn and its photodegradation products from artificial walls under natural weather
conditions. Environ. Sci. Technol. 50, 4289–4295. https://doi.org/10.1021/acs.est.5b05825 (2016).
26. Bollmann, U. E., Vollertsen, J., Carmeliet, J. & Bester, K. Dynamics of biocide emissions from buildings in a suburban stormwater
catchment—concentrations, mass loads and emission processes. Water Res. 56, 66–76. https://doi.org/10.1016/j.watres.2014.02.
033 (2014).
27. Schoknecht, U., Mathies, H. & Wegner, R. Biocide leaching during field experiments on treated articles. Environ. Sci. Eur. 28,
2850. https://doi.org/10.1186/s12302-016-0074-9 (2016).
28. Hensen, B. et al. Entry of biocides and their transformation products into groundwater via urban stormwater infiltration systems.
Water Res. 144, 413–423. https://doi.org/10.1016/j.watres.2018.07.046 (2018).
29. Bollmann, U. E. et al. Biocide runoff from building facades: Degradation kinetics in soil. Environ. Sci. Technol. 51, 3694–3702.
https://doi.org/10.1021/acs.est.6b05512 (2017).
30. U.S. Environmental Protection Agency. Low impact development (lid): A literature review (2000).
31. German Association for Water, Wastewater and Waste. Planning, construction and operation of facilities for the percolation of
precipitation water: Standard DWA-A 138E. German DWA rules and standards (DWA, Hennef, 2006), April 2005, engl. version
edn.
32. Tedoldi, D. et al. Spatial distribution of heavy metals in the surface soil of source-control stormwater infiltration devices - inter-
site comparison. Sci. Total Environ. 579, 881–892. https://doi.org/10.1016/j.scitotenv.2016.10.226 (2017).
33. Kluge, B. et al. Metal accumulation and hydraulic performance of bioretention systems after long-term operation. J. Soils Sedim.
55, 193. https://doi.org/10.1007/s11368-016-1533-z (2016).
34. Gavrilescu, M. Fate of pesticides in the environment and its bioremediation. Eng. Life Sci. 5, 497–526. https://doi.org/10.1002/
elsc.200520098 (2005).
35. Bergman, M. et al. Evaluation of two stormwater infiltration trenches in central copenhagen after 15 years of operation. Water
Sci. Technol. 63, 2279–2286. https://doi.org/10.2166/wst.2011.158 (2011).
36. Rujner, H., Leonhardt, G., Marsalek, J., Perttu, A.-M. & Viklander, M. The effects of initial soil moisture conditions on swale
flow hydrographs. Hydrol. Process. 32, 644–654. https://doi.org/10.1002/hyp.11446 (2018).
37. Larsbo, M., Stenström, J., Etana, A., Börjesson, E. & Jarvis, N. J. Herbicide sorption, degradation, and leaching in three Swedish
soils under long-term conventional and reduced tillage. Soil Tillage Res. 105, 200–208. https://doi.org/10.1016/j.still.2009.08.
003 (2009).
38. Zehe, E. & Flühler, H. Preferential transport of isoproturon at a plot scale and a field scale tile-drained site. J. Hydrol. 247,
100–115. https://doi.org/10.1016/S0022-1694(01)00370-5 (2001).
39. Dousset, S., Thevenot, M., Pot, V., Simunek, J. & Andreux, F. Evaluating equilibrium and non-equilibrium transport of bromide
and isoproturon in disturbed and undisturbed soil columns. J. Contam. Hydrol. 94, 261–276. https://doi.org/10.1016/j.jconhyd.
2007.07.002 (2007).
40. Burkhardt, M. et al. Biozide in gebäudefassaden-ökotoxikologische effekte, auswaschung und belastungsabschätzung für
gewässer. Umweltwiss. Schadst. Forsch. 21, 36–47. https://doi.org/10.1007/s12302-008-0033-1 (2009).
41. Weiler, M. & Naef, F. An experimental tracer study of the role of macropores in infiltration in grassland soils. Hydrol. Process.
17, 477–493. https://doi.org/10.1002/hyp.1136 (2003).
42. Vanderborght, J., Gähwiller, P. & Flühler, H. Identification of transport processes in soil cores using fluorescent tracers. Soil Sci.
Soc. Am. J. 66, 774–787. https://doi.org/10.2136/sssaj2002.0774 (2002).
43. Albrecht, A. et al. Behavior of a surface applied radionuclide and a dye tracer in structured and repacked soil monoliths. J.
Environ. Radioact. 68, 47–64. https://doi.org/10.1016/S0265-931X(03)00029-8 (2003).
44. Torrentó, C. et al. Adsorbing vs. nonadsorbing tracers for assessing pesticide transport in arable soils. Vadose Zone J. 17, 0.
https://doi.org/10.2136/vzj2017.01.0033 (2018).
45. Blume, H.-P. et al. Scheffer/Schachtschabel Soil Science (Springer, 2016).
46. Li, H. & Davis, A. P. Urban particle capture in bioretention media. ii: Theory and model development. J. Environ. Eng. 134,
419–432. https://doi.org/10.1061/(ASCE)0733-9372(2008)134:6(419) (2008).
47. Totsche, K. U., Danzer, J. & Kögel-Knabner, I. Dissolved organic matter-enhanced retention of polycyclic aromatic hydrocarbons
in soil miscible displacement experiments. J. Environ. Qual. 26, 1090–1100. https://doi.org/10.2134/jeq1997.004724250026000
40021x (1997).
48. Meyer-Windel, S., Lennartz, B. & Widmoser, P. Bromide and herbicide transport under steady-state and transient flow condi-
tions. Eur. J. Soil Sci. 50, 23–33. https://doi.org/10.1046/j.1365-2389.1999.00210.x (2003).
49. Jaesche, P., Totsche, K. U. & Kögel-Knabner, I. Transport and anaerobic biodegradation of propylene glycol in gravel-rich soil
materials. J. Contam. Hydrol. 85, 271–286. https://doi.org/10.1016/j.jconhyd.2006.02.003 (2006).
50. Eckelmann, W. et al.Bodenkundliche Kartieranleitung. KA 5 (Schweizerbart Science Publishers, Stuttgart, Germany, 2006) 5.
verbess. und erw. auflage edn.
51. Torkzaban, S. et al. Colloid release and clogging in porous media: Effects of solution ionic strength and flow velocity. J. Contam.
Hydrol. 181, 161–171. https://doi.org/10.1016/j.jconhyd.2015.06.005 (2015).
52. Howe, K. J. & Clark, M. M. Fouling of microfiltration and ultrafiltration membranes by natural waters. Environ. Sci. Technol.
36, 3571–3576. https://doi.org/10.1021/es025587r (2002).
53. Kjaergaard, C., Moldrup, P., de Jonge, L. W. & Jacobsen, O. H. Colloid mobilization and transport in undisturbed soil columns.
ii. the role of colloid dispersibility and preferential flow. Vadose Zone J. 3, 424. https://doi.org/10.2136/vzj2004.0424 (2004).
54. Levy, B. S. & Chambers, R. M. Bromide as a conservative tracer for soil-water studies. Hydrol. Process. 1, 385–389. https://doi.
org/10.1002/hyp.3360010406 (1987).
55. Flury, M. & Wai, N. N. Dyes as tracers for vadose zone hydrology. Rev. Geophys.https://doi.org/10.1029/2001RG000109 (2003).
56. Radcliffe, D. E. & Simunek, J. Soil Physics with HYDRUS: Modeling and Applications/David E. Radcliffe and Jirí Šimůnek (CRC
Press, 2010).
57. Korom, S. F. & Seaman, J. C. When conservative anionic tracers aren’t. Ground Water 50, 820–824. https://doi.org/10.1111/j.
1745-6584.2012.00950.x (2012).
58. Leibundgut, C., Maloszewski, P. & Klls, C. Tracers in Hydrology (Wiley, 2009).
59. Lange, J. et al. Multi-tracer experiments to characterise contaminant mitigation capacities for different types of artificial wetlands.
Int. J. Environ. Anal. Chem. 91, 768–785. https://doi.org/10.1080/03067319.2010.525635 (2011).
60. Durst, R., Imfeld, G. & Lange, J. Transport of pesticides and artificial tracers in vertical-flow lab-scale wetlands. Water Resour.
Res. 49, 554–564 (2013).
61. Dollinger, J., Dages, C. & Voltz, M. Using fluorescent dyes as proxies to study herbicide removal by sorption in buffer zones.
Environ. Sci. Pollut. Res. Int. 24, 11752–11763. https://doi.org/10.1007/s11356-017-8703-4 (2017).
62. Bork, M., Lange, J., Graf-Rosenfellner, M. & Lang, F. Controls of fluorescent tracer retention by soils and sediments. Hydrol.
Earth Syst. Sci. 24, 977–989. https://doi.org/10.5194/hess-24-977-2020 (2020).
Scientific Reports | (2021) 11:7242 | https://doi.org/10.1038/s41598-021-86387-9 10
Vol:.(1234567890)www.nature.com/scientificreports/
63. Kung, K.-J. et al. Impact of preferential flow on the transport of adsorbing and non-adsorbing tracers. Soil Sci. Soc. Am. J. 64,
1290. https://doi.org/10.2136/sssaj2000.6441290x (2000).
64. Aeby, P. et al. Fluorescence imaging of tracer distributions in soil profiles. Environ. Sci. Technol. 35, 753–760. https://doi.org/10.
1021/es000096x (2001).
65. Allaire, S. E., Roulier, S. & Cessna, A. J. Quantifying preferential flow in soils: A review of different techniques. J. Hydrol. 378,
179–204. https://doi.org/10.1016/j.jhydrol.2009.08.013 (2009).
66. Katagi, T. Soil column leaching of pesticides. Rev. Environ. Contam. Toxicol. 221, 1–105 (2013).
67. Lobry de Bruyn, L. A. & Conacher, A. J. The role of termites and ants in soil modification—a review. Soil Res. 28, 55. https://doi.
org/10.1071/SR9900055 (1990).
68. Cerdà, A. & Jurgensen, M. F. The influence of ants on soil and water losses from an orange orchard in eastern spain. J. Appl.
Entomol. 132, 306–314. https://doi.org/10.1111/j.1439-0418.2008.01267.x (2008).
69. Corwin, D. L. Evaluation of a simple lysimeter-design modification to minimize sidewall flow. J. Contam. Hydrol. 42, 35–49.
https://doi.org/10.1016/S0169-7722(99)00088-1 (2000).
70. Fernández-Pascual, E., Bork, M., Hensen, B. & Lange, J. Hydrological tracers for assessing transport and dissipation processes
of pesticides in a model constructed wetland system. Hydrol. Earth Syst. Sci. 24, 41–60. https://doi.org/10.5194/hess-24-41-2020
(2020).
71. Calvet, R. Adsorption of organic chemicals in soils. Environ. Health Perspect. 83, 145–177. https://doi.org/10.1289/ehp.89831
45 (1989).
72. Gerstl, Z. Estimation of organic chemical sorption by soils. J. Contam. Hydrol. 6, 357–375. https://d oi.o
rg/1 0.1 016/0 169-7 722(90)
90034-E (1990).
73. Leue, M., Gerke, H. H. & Ellerbrock, R. H. Millimetre-scale distribution of organic matter composition at intact biopore and
crack surfaces. Eur. J. Soil Sci. 64, 757–769. https://doi.org/10.1111/ejss.12098 (2013).
74. Larsson, M. H. & Jarvis, N. J. Quantifying interactions between compound properties and macropore flow effects on pesticide
leaching. Pest Manag. Sci. 56, 133–141. https://doi.org/10.1002/(SICI)1526-4998(200002)56:23.0.CO;2-N
(2000).
75. Tiktak, A., Hendriks, R., Boesten, J. & van der Linden, A. A spatially distributed model of pesticide movement in dutch macropo-
rous soils. J. Hydrol. 470–471, 316–327. https://doi.org/10.1016/j.jhydrol.2012.09.025 (2012).
76. Thevenot, M., Dousset, S., Hertkorn, N., Schmitt-Kopplin, P. & Andreux, F. Interactions of diuron with dissolved organic matter
from organic amendments. Sci. Total Environ. 407, 4297–4302. https://doi.org/10.1016/j.scitotenv.2009.04.021 (2009).
77. Pot, V. et al. Impact of rainfall intensity on the transport of two herbicides in undisturbed grassed filter strip soil cores. J. Contam.
Hydrol. 81, 63–88. https://doi.org/10.1016/j.jconhyd.2005.06.013 (2005).
78. Brown, C. D., Hollis, J. M., Bettinson, R. J. & Walker, A. Leaching of pesticides and a bromide tracer through lysimeters from
five contrasting soils. Pest Manag. Sci. 56, 83–93. https://doi.org/10.1002/(SICI)1526-4998(200001)56:13.0.
CO;2-8 (2000).
79. Hillel, D. & Warrick, A. W. Environmental Soil Physics (AP Acad. Press, 2009), [nachdr. der ausg. 1998] edn.
80. Smetak, K. M., Johnson-Maynard, J. L. & Lloyd, J. E. Earthworm population density and diversity in different-aged urban systems.
Appl. Soil. Ecol. 37, 161–168. https://doi.org/10.1016/j.apsoil.2007.06.004 (2007).
81. Vergnes, A. et al. Initial conditions during technosol implementation shape earthworms and ants diversity. Landsc. Urban Plan.
159, 32–41. https://doi.org/10.1016/j.landurbplan.2016.10.002 (2017).
82. Amossé, J. et al. Patterns of earthworm, enchytraeid and nematode diversity and community structure in urban soils of different
ages. Eur. J. Soil Biol. 73, 46–58. https://doi.org/10.1016/j.ejsobi.2016.01.004 (2016).
83. Hackenberger, D. K. & Hackenberger, B. K. Earthworm community structure in grassland habitats differentiated by climate type
during two consecutive seasons. Eur. J. Soil Biol. 61, 27–34. https://doi.org/10.1016/j.ejsobi.2014.01.001 (2014).
84. Singh, J., Schädler, M., Demetrio, W., Brown, G. G. & Eisenhauer, N. Climate change effects on earthworms—a review. Soil
Organ. 91, 114–138. https://doi.org/10.25674/so91iss3pp114 (2019).
85. Kazemi, F., Beecham, S., Gibbs, J. & Clay, R. Factors affecting terrestrial invertebrate diversity in bioretention basins in an
Australian urban environment. Landsc. Urban Plan. 92, 304–313. https://doi.org/10.1016/j.landurbplan.2009.05.014 (2009).
86. Deng, Y. Low-cost adsorbents for urban stormwater pollution control. Front. Environ. Sci. Eng. 14, 327. https://doi.org/10.1007/
s11783-020-1262-9 (2020).
87. Markiewicz, A., Strömvall, A.-M. & Björklund, K. Alternative sorption filter materials effectively remove non-particulate organic
pollutants from stormwater. Sci. Total Environ. 730, 139059. https://doi.org/10.1016/j.scitotenv.2020.139059 (2020).
88. Kümmerer, K., Dionysiou, D. D., Olsson, O. & Fatta-Kassinos, D. A path to clean water. Science (New York, N.Y.) 361, 222–224.
https://doi.org/10.1126/science.aau2405 (2018).
89. Kümmerer, K., Dionysiou, D. D., Olsson, O. & Fatta-Kassinos, D. Reducing aquatic micropollutants—increasing the focus on
input prevention and integrated emission management. Sci. Total Environ. 652, 836–850. https://doi.org/10.1016/j.scitotenv.
2018.10.219 (2019).
90. Gee, G. W. & Or, D. Particle-size analysis. In Dane, J. H. & Topp, C. G. (eds.) Methods of Soil Analysis: Part 4 Physical Methods,
vol. 5 of SSSA Book Series, 255–293 (Soil Science Society of America, Madison, Wisconsin, USA, 2002).
91. Bisutti, I., Hilke, I. & Raessler, M. Determination of total organic carbon—an overview of current methods. Trends Anal. Chem.
23, 716–726. https://doi.org/10.1016/j.trac.2004.09.003 (2004).
92. OOECD. Test No 106: Adsorption—Desorption Using a Batch Equilibrium Method (2000).
93. Paijens, C., Bressy, A., Frère, B. & Moilleron, R. Biocide emissions from building materials during wet weather: Identification of
substances, mechanism of release and transfer to the aquatic environment. Environ. Sci. Pollut. Res. Int.https://doi.org/10.1007/
s11356-019-06608-7 (2019).
94. Lewis, K. A., Tzilivakis, J., Warner, D. J. & Green, A. An international database for pesticide risk assessments and management.
Human Ecol. Risk Assess. Int. J. 22, 1050–1064. https://doi.org/10.1080/10807039.2015.1133242 (2016).
95. R Development Core Team. R: A Language and Environment for Statistical Computing (2008).
96. Stamm, C. et al. Multiple tracing of fast solute transport in a drained grassland soil. Geoderma 109, 245–268. https://doi.org/
10.1016/S0016-7061(02)00178-7 (2002).
97. Schindelin, J. et al. Fiji: An open-source platform for biological-image analysis. Nat. Methods 9, 676–682. https://doi.org/10.
1038/nmeth.2019 (2012).
98. Smart, P. L. & Laidlaw, I. M. S. An evaluation of some fluorescent dyes for water tracing. Water Resour. Res. 13, 15–33. https://
doi.org/10.1029/WR013i001p00015 (1977).
99. U.S. Environmental Protection Agency. Estimation programs interface suite for microsoft windows, v 4.11. United States Envi-
ronmental Protection Agency, Washington, DC, USA (2012).
100. Scientific Committee on Consumer Products. Opinion on acid red 52, 24 June 2008, European Commission (2008).
101. Bester, K. et al. Activated soil filters for removal of biocides from contaminated run-off and waste-waters. Chemosphere 85,
1233–1240. https://doi.org/10.1016/j.chemosphere.2011.07.017 (2011).
102. Zanker, V. & Peter, W. Die prototropen formen des fluoresceins. Chem. Ber. 91, 572–580. https://doi.org/10.1002/cber.19580
910316 (1958).
Scientific Reports | (2021) 11:7242 | https://doi.org/10.1038/s41598-021-86387-9 11
Vol.:(0123456789)You can also read