Low Fe Availability for Photosynthesis of Sea-Ice Algae: Ex situ Incubation of the Ice Diatom Fragilariopsis cylindrus in Low-Fe Sea Ice Using an ...
←
→
Page content transcription
If your browser does not render page correctly, please read the page content below
ORIGINAL RESEARCH
                                                                                                                                                 published: 22 March 2021
                                                                                                                                          doi: 10.3389/fmars.2021.632087

                                            Low Fe Availability for
                                            Photosynthesis of Sea-Ice Algae:
                                            Ex situ Incubation of the Ice Diatom
                                            Fragilariopsis cylindrus in Low-Fe
                                            Sea Ice Using an Ice Tank
                             Edited by:
                                            Kazuhiro Yoshida 1,2* † , Andreas Seger 2 , Matthew Corkill 2,3 , Petra Heil 3,4,5 , Kristen Karsh 3 ,
                           Chris Dupont,    Andrew McMinn 2,3* and Koji Suzuki 1,6*
J. Craig Venter Institute, United States    1
                                             Graduate School of Environmental Science, Hokkaido University, Sapporo, Japan, 2 Institute for Marine and Antarctic
                        Reviewed by:        Studies, University of Tasmania, Battery Point, TAS, Australia, 3 Antarctic Climate and Ecosystems Cooperative Research
                     Nadine Schubert,       Centre, University of Tasmania, Battery Point, TAS, Australia, 4 Australian Antarctic Programme Partnership, University
        University of Algarve, Portugal     of Tasmania, Battery Point, TAS, Australia, 5 Australian Antarctic Division, Kingston, TAS, Australia, 6 Faculty of Environmental
                               Gang Li,     Earth Science, Hokkaido University, Sapporo, Japan
         South China Sea Institute of
            Oceanology (CAS), China
                                            Sea-ice algae play a crucial role in the ecology and biogeochemistry of sea-ice
                 *Correspondence:
                   Kazuhiro Yoshida         zones. They not only comprise the base of sea-ice ecosystems, but also seed
            sv8269@cc.saga-u.ac.jp          populations of extensive ice-edge blooms during ice melt. Ice algae must rapidly
                    Andrew McMinn
        Andrew.McMinn@utas.edu.au           acclimate to dynamic light environments, from the low light under sea ice to high
                         Koji Suzuki        light within open waters. Recently, iron (Fe) deficiency has been reported for diatoms
             kojis@ees.hokudai.ac.jp
                                            in eastern Antarctic pack ice. Low Fe availability reduces photosynthetic plasticity,
                   † Present
                           address:
                                            leading to reduced ice-algal primary production. We developed a low-Fe ice tank
                  Kazuhiro Yoshida,
Graduate School of Agriculture, Saga        to manipulate Fe availability in sea ice. Over 20 days in the ice tank, the Antarctic
            University, Saga, Japan         ice diatom Fragilariopsis cylindrus was incubated in artificial low-Fe sea ice ([total
                   Specialty section:
                                            Fe] = 20 nM) in high light (HL) and low light (LL) conditions. Melted ice was also
         This article was submitted to      exposed to intense light to simulate light conditions typical for melting ice in situ.
                 Aquatic Microbiology,      When diatoms were frozen in, the maximum photochemical quantum efficiency of
               a section of the journal
          Frontiers in Marine Science       photosystem II (PSII), F v /F m , was suppressed by freezing stress. However, the diatoms
       Received: 22 November 2020           maintained photosynthetic capability throughout the ice periods with a stable F v /F m
        Accepted: 19 February 2021          value and increased photoprotection through non-photochemical quenching (NPQ)
         Published: 22 March 2021
                                            via photoprotective xanthophyll cycling (XC) and increased photoprotective carotenoid
                               Citation:
         Yoshida K, Seger A, Corkill M,
                                            levels compared to pre-freeze-up. Photoprotection was more pronounced in the HL
        Heil P, Karsh K, McMinn A and       treatment due to greater light stress. However, the functional absorption cross section
   Suzuki K (2021) Low Fe Availability      of PSII, σPSII , in F. cylindrus consistently increased after freezing, especially in the LL
 for Photosynthesis of Sea-Ice Algae:
  Ex situ Incubation of the Ice Diatom      treatment (σPSII > 10 nm2 PSII−1 ). Our study is the first to report such a large σPSII in ice
Fragilariopsis cylindrus in Low-Fe Sea      diatoms at low Fe conditions. When the melted sea ice was exposed to high light, F v /F m
                 Ice Using an Ice Tank.
             Front. Mar. Sci. 8:632087.
                                            was suppressed. NPQ and XC were slightly upregulated, but not to values normally
    doi: 10.3389/fmars.2021.632087          observed when Fe is not limiting, which indicates reduced photosynthetic flexibility to

Frontiers in Marine Science | www.frontiersin.org                                   1                                              March 2021 | Volume 8 | Article 632087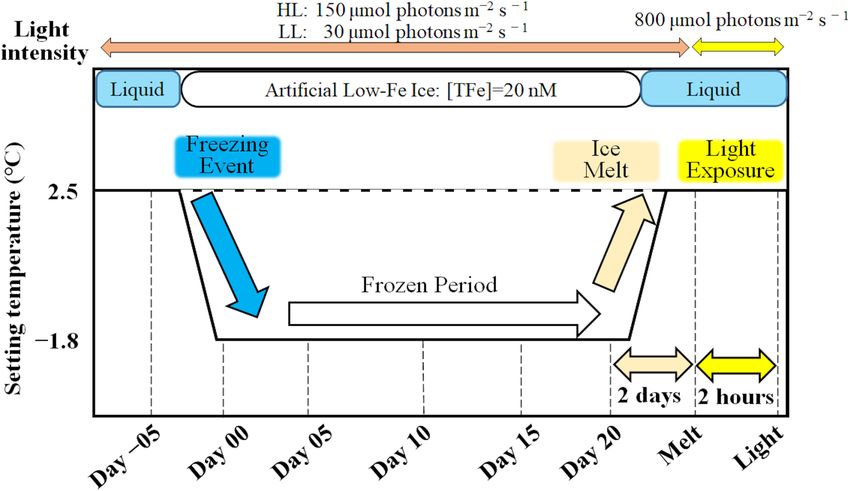
Yoshida et al.                                                                                                                    Low-Fe Stress on Ice Diatom

                                            adapt to environmental changes during ice melt under low Fe conditions. Although ice
                                            algae can optimize their photosynthesis to sea-ice environments, chronic Fe starvation
                                            led to less flexibility of photoacclimation, particularly in low light conditions. This may
                                            have detrimental consequences for ice algal production and trophic interactions in
                                            sea-ice ecosystems if the recent reduction in sea-ice extent continues.
                                            Keywords: sea-ice diatom, pack ice, iron limitation, ice-edge bloom, Southern Ocean, chlorophyll a fluorescence,
                                            gene expression, photoprotection

INTRODUCTION                                                                       energy that overruns the reduced electron transport capacity due
                                                                                   to decreased Fe-containing electron donors (e.g., cytochromes
Sea ice is one of the largest biomes on Earth and a significant                    and Photosystem I; van Oijen et al., 2004; Petrou et al., 2014;
driver of the biogeochemistry of polar oceans (Arrigo, 2017;                       Roncel et al., 2016). This would pose a significant challenge when
van Leeuwe et al., 2018). Sea ice harbors diverse and productive                   Fe-limited ice algal cells are exposed to high light during release
microbial communities that occur mainly at the bottom of sea                       from the bottom of the sea ice into open waters during ice melt
ice (Meiners et al., 2012, 2018; van Leeuwe et al., 2018). Ice                     (i.e., the setting of ice-edge blooms). It is thus ecologically and
algae, sympagic microalgae proliferating near the bottom of sea                    biogeochemically important to investigate how Fe availability and
ice, are a major primary producer, estimated to contribute 9–                      light combine to control the photosynthetic performance of ice
25% of the annual primary production (PP) in perennial ice                         algae to further understand their role in sea-ice and marginal
zones (e.g., Legendre et al., 1992; Arrigo et al., 1997; Arrigo,                   ice-zone ecosystems.
2017). In addition, they also contribute more than 50% of                              Sea ice can act as a reservoir of Fe, especially close to
the total PP in ice-covered zones (Satoh et al., 1989; McMinn                      lithogenic coastal iron sources in the case of fast ice (e.g., de
et al., 2010; Fernández-Méndez et al., 2015). When sea ice                         Jong et al., 2013), but also in pack ice far from the coast
melts, algal cells are released from the sea ice and can seed                      (Lannuzel et al., 2016b). Pack ice might accumulate biogenic Fe
extensive ice-edge microalgal blooms (Smith and Nelson, 1986;                      by directly incorporating it during growth in autumn and winter
Syvertsen, 1991). Ice algae therefore are a significant player                     (Lannuzel et al., 2016a) or by transferring DFe from seawater into
in the ecology and biogeochemistry of sea ice and marginal                         particulate Fe (PFe) (e.g., van der Merwe et al., 2011). According
ice zones. However, sea ice is a challenging environment for                       to the limited data available, pack-ice DFe concentrations range
photosynthesis due to low temperatures, high salinities, low light                 from about 0.2–36.8 nM (average 5.9 ± 6.2 nM from 40 cores;
availability, and reduced access to nutrients. In these conditions,                Lannuzel et al., 2007, 2008, 2016a; van der Merwe et al., 2011; de
light and nutrient availability effectively control photosynthesis                 Jong et al., 2015; Janssens et al., 2016), up to about two orders of
in ice algae, although salinity stress can also be important.                      magnitude greater than the underlying seawater (Tagliabue et al.,
Pankowski and McMinn (2008) first reported iron (Fe) limitation                    2012). When sea ice melts in spring and summer, 70% of the DFe
in Antarctic pack ice in spring/summer. They suggested that                        can be lost within 10 days (Lannuzel et al., 2008), but PFe, which
it was due to the low Fe supply from the Fe-deficient surface                      is about an order of magnitude greater in average concentration,
waters of the Southern Ocean, where off the continental shelf, the                 needs to be physically released from both the ice, and gel-
average concentration of dissolved Fe (DFe), which is considered                   like exopolymeric substances (EPS) lining the brine network
the most bio-available form (Lannuzel et al., 2014), is 0.31 ± 0.45                (Krembs et al., 2002; van der Merwe et al., 2011; Lannuzel et al.,
nM (Tagliabue et al., 2012). It is well-known that Fe is a crucial                 2013, 2016b). These gel-like EPS are produced in situ by sea-
element for photosynthesis in microalgae, as it is required for                    ice organisms in response to the evolving sea-ice environment
pigments and cytochrome synthesis, nitrate reduction, and the                      and could in turn control the solubility of Fe transferred back to
detoxification of reactive oxygen species (ROS) (Geider and                        the dissolved fraction (Thomas and Dieckmann, 2002; Lannuzel
LaRoche, 1994; Sunda and Huntsman, 1995; Behrenfeld and                            et al., 2015, 2016b; Genovese et al., 2018), possibly maintaining
Milligan, 2013; Twining and Baines, 2013). Ice algae are able to                   in-ice DFe within the concentration range described.
acclimate to the dark environment frequently encountered in sea                        With regard to climate change, it has been reported that ocean
ice by increased synthesizing of chlorophylls and carotenoids to                   acidification (OA), associated with the increasing anthropogenic
maximize the efficiency of light utilization (e.g., Falkowski and                  CO2 input, modifies Fe availability (Millero et al., 2009). OA
Owens, 1980; Morel and Bricaud, 1981; Bricaud et al., 1995).                       can suppress Fe availability by stabilizing Fe-ligand complexation
However, pigment synthesis requires Fe; the low availability of                    (Sunda and Huntsman, 2003; Shi et al., 2010) and also extending
Fe can thus be exacerbated due to the antagonistic Fe-light co-                    the oxidation rate of Fe(II), which is believed to be the most
limitation (i.e., more Fe required in a darker environment; Sunda                  prolific bio-available source of Fe (Millero et al., 1987, 2009;
and Huntsman, 1997; Maldonado et al., 1999; Moore et al., 2007).                   Breitbarth et al., 2009). Although Boyd et al. (2015) estimated
The reduced cellular chlorophyll a and accessory carotenoids due                   that climate change enhances Fe availability in the Southern
to Fe-limited conditions (e.g., Greene et al., 1992; Behrenfeld                    Ocean, sea ice has greater fluctuations in pH than in pelagic
and Milligan, 2013) would lead to serious photo-damage by ROS                      waters (Matson et al., 2014; McMinn et al., 2014). In addition,
because Fe-limited cells cannot cope with the excess absorbed                      future predictions of sea-ice algal biomass and photosynthesis in

Frontiers in Marine Science | www.frontiersin.org                              2                                        March 2021 | Volume 8 | Article 632087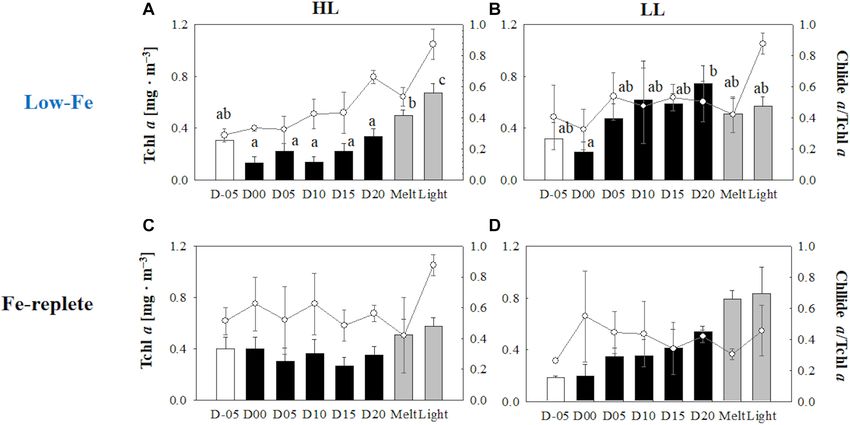
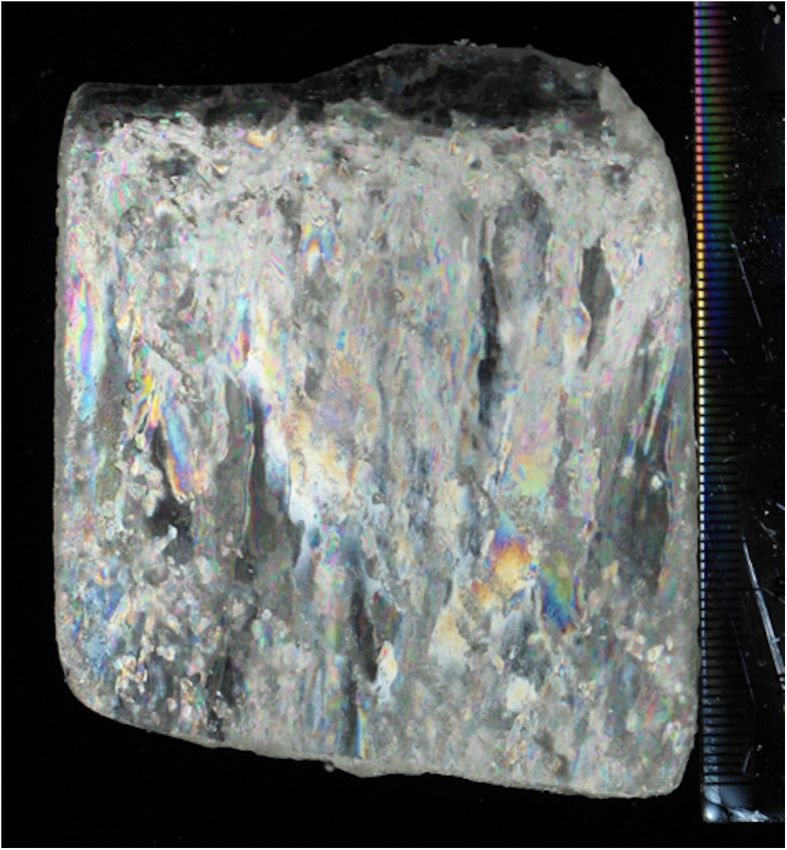
Yoshida et al.                                                                                                             Low-Fe Stress on Ice Diatom

the changing polar oceans are one of the major missing pieces                 approximately 5.5 cm to be maintained during the experiment.
in sea-ice biogeochemical models (Vancoppenolle et al., 2013;                 Incubations were conducted in Aquil media (Price et al., 1989;
Constable et al., 2014; Steiner et al., 2016; van Leeuwe et al., 2018).       Pankowski and McMinn, 2009; Yoshida et al., 2020) buffered with
Recently, Tedesco et al. (2019) has demonstrated future changes               ethylenediaminetetraacetic acid (EDTA) (final concentration 20
in algal productivity in the Arctic combining a biogeochemical                µM) at a salinity of 35 and at 150 and 30 µmol photons
model for sympagic algae with sea-ice drivers from an ensemble                m−2 s−1 (PAR; white LED, PANEL-300-18W; LED Lighting
of 18 CMIP5 climate models. However, little is known about                    Products, Sydney, NSW, Australia) as high light (HL) and low
temporal changes in sea-ice algal biomass and productivity in the             (LL) treatments, respectively. The diatom was pre-incubated in
changing Southern Ocean.                                                      the same low-Fe Aquil media at 2.5◦ C and 150 µmol photons
   Methodological limitations to the investigation of ice-algal               m−2 s−1 before inoculation of the ice tank. DFe concentrations
photosynthesis, however, still remain—almost all studies so                   were set at 20 nM, which is within the concentration range of
far have worked on ice algal photosynthesis in the laboratory,                0.2–36.8 nM that has been found in pack ice (Lannuzel et al.,
during which ice algae are resuspended in a water medium                      2007, 2008, 2016a; van der Merwe et al., 2011; de Jong et al.,
after being melted out from ice samples. This melt process                    2015; Janssens et al., 2016), where the concentrations of total
hinders obtaining realistic photophysiological information                    inorganic forms of Fe (Fe0 ) were 4.0 pM calculated using the
because water media cannot reproduce the temperatures in                      software Visual MINTEQ, ver. 31 . Pankowski and McMinn (2009)
sea ice (
Yoshida et al.                                                                                                       Low-Fe Stress on Ice Diatom

  FIGURE 1 | A schematic of the ice tank incubation experiments.

(Model S-22, BOECO). Exponential growth rate (r; d−1 ) of               solution (Trace metal grade, Wako), was added to the sample.
F. cylindrus in the ice was calculated (Wood et al., 2005):             The buffered sample was incubated at room temperature for
                                                                        24 h to fully recover Fe in the sample (Farid et al., 2018).
                              ln(NDay 20 − NDay 00 )                    Fe concentrations were determined with a spectrophotometer
                        µ=
                                       20                               measuring the absorbance of Fe(II)-ferrozine complexes at a
where N Day20 and N Day00 were algal cell abundance (cells mL−1 )       wavelength of 562 nm (UV-2450, Shimadzu) with a 50 mm path
at day 20 and day 00, respectively.                                     length glass tube. An Fe standard curve was drawn with a series
                                                                        of known Fe concentrations by diluting an Fe standard solution
Total Dissolvable Fe Concentration                                      (Wako) (r> 0.999, n = 7). The detection limit of the measurement
                                                                        was 10 nM, which was consistent with previous studies (Farid
Concentrations of total dissolvable Fe (TDFe) in the under-ice
                                                                        et al., 2018). The quantification limit, defined as 3 SD, was 15 nM.
seawater were monitored to check whether contamination by
external Fe (e.g., sampling-induced aerosol deposition on the
ice) had occurred. Fe concentrations in the ice were difficult          Ice Structure
to determine because the ice was too thin to obtain a brine             Prior to the low-Fe incubation experiments, an ice section
sample. In addition, the Fe source for the ice algae in the             was collected to assess the ice structure. Artificial sea ice was
artificial sea ice would have been restricted to from the under-        produced using the same seawater medium, and a 5 cm × 10
ice water. Fe concentrations in the water samples were thus             cm × 5.5 cm ice sample was collected from the ice tank using
determined by the Ferrozine colorimetric method in a laminar            a metal saw. The ice sample was thinned to a 0.5 cm thick
flow hood (Stookey, 1970; Farid et al., 2018). Fe samples were          vertical section using a band saw (BARNES Junior, BARNCO,
placed into a 60 mL low-density polyethylene (LDPE), previously         Australia) in a −20◦ C temperature-controlled laboratory. The
acid-cleaned, bottle (Thermo Fisher Scientific) following the           ice section was planned smooth with a handheld microtome
GEOTRACES protocol (Cutter et al., 2017). Fe samples were               blade before being photographed between cross-polarizing filters.
acidified to pH < 2 with Suprapur HCl (Merck) at least 2 months         Ice structural measurements were performed in accordance with
before the measurements (Farid et al., 2018). A 50 mL ferrozine         Langway (1958) and Wongpan et al. (2018).
cocktail was prepared with 10 mM Ferrozine (Sigma), 1.44
M hydroxylamine hydrochloride (Trace metal analysis grade,              Fast Repetition Rate (FRR) Fluorometry
Wako) and ultrapure water acidified with ultrapure hydrochloric         A bench-top type Fast Repetition Rate fluorometer (FRRf;
acid (HCl) (Ultrapure grade, Wako). The 0.4 mL of ferrozine             FastOcean Act2Run Systems, Chelsea Technologies) was used
cocktail was added to a 20 mL sample. The sample was heated             to monitor the photophysiology of F. cylindrus during the ice
at 70◦ C for 15 min to accelerate the reduction of Fe(III) to           tank experiments. Variable chlorophyll a fluorescence data were
Fe(II) and for detaching Fe(II) from the Fe-EDTA complex. After         processed with Act2Run software (Chelsea Technologies). Melted
cooling down the sample, 0.4 mL of an ammonium acetate (Fe              ice samples were buffered with filtered seawater (FSW) (ice:
analysis grade, Wako) buffer solution, prepared with an ammonia         FSW = 1: 1) at 2◦ C and kept in the dark for 30 min. Variable

Frontiers in Marine Science | www.frontiersin.org                   4                                      March 2021 | Volume 8 | Article 632087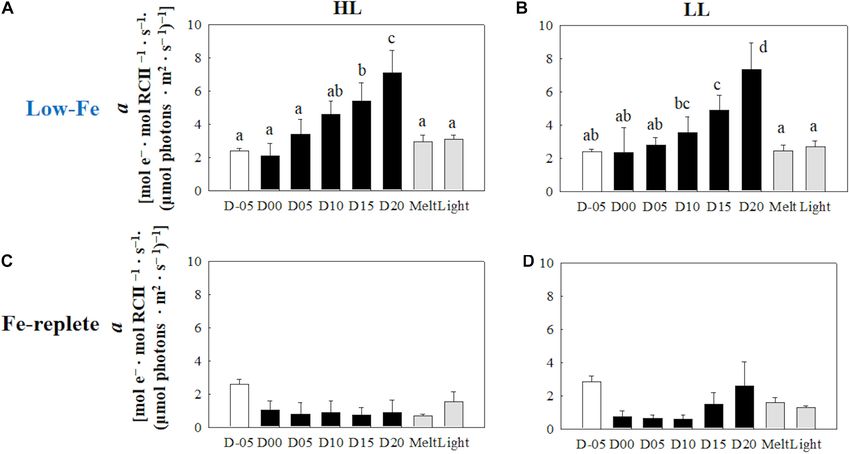
Yoshida et al.                                                                                                                                 Low-Fe Stress on Ice Diatom

chl a fluorescence of the melted ice samples was measured with                             where F o 0 is minimum fluorescence yield after a relaxation
a single turnover protocol. Briefly, one hundred 2-µs flashlets at                         sequence following Oxborough and Baker (1997; Table 1).
a wavelength 450 nm excited reaction centers of PSII (RCII) with                           NPQNSV 0 were measured at the incubation light intensities (i.e.,
2 µs intervals, and twenty 1-µs flashlets were used for relaxation.                        HL: 150 µmol photons m−2 s−1 ; LL: 30 µmol photons m−2 s−1 )
Eighteen light steps were applied to generate a rapid light curve                          throughout the ice tank experiments.
(RLC) from 0 to 800 µmol photons m−2 s−1 . Each step took
∼15 s; one RLC was thus completed in 5 min. To obtain chl                                  Pigment Composition
a fluorescence parameters, six induction and relaxation curves                             Algal chlorophylls and carotenoids were quantified with Ultra-
were averaged and fitted to the model of Kolber et al. (1998;                              High Performance Liquid Chromatography (UHPLC) (Suzuki
Table 1). Absolute electron transport rate through the reaction                            et al., 2015). Fast and directly melted ice samples and seawater
centers of PSII (RCII) (ETRRCII ) was calculated as follows:                               samples were filtered onto a 25 mm GF/F filter (Whatman)
                                          Fq0 /Fm
                                                0                                          with gentle vacuum (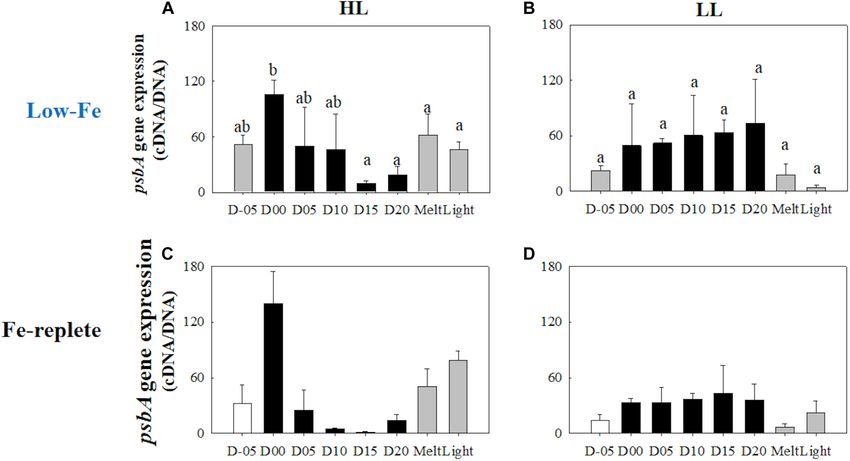
Yoshida et al.                                                                                                               Low-Fe Stress on Ice Diatom

F. cylindrus, the ratio of photoprotective carotenoids (PPC: DD,          RESULTS
DT, and β,β-carotene) to photosynthetic carotenoids (PSC: only
fucoxanthin here) in diatoms (PPC/PSC) and xanthophyll pool               Ice Physics and Ice Algal Growth
size [(DD + DT)/Tchl a] were also calculated.                             The ice thickness was stable at 5.5 cm with little basal ice melting
                                                                          or sublimation of ice from the ice-air interface. During the
                                                                          experiments, the temperature within the ice matrix increased
Gene Expression of                                                        from the ice-air interface (−22.5◦ C) to the ice-water interface
Photosynthesis-Related Genes, psbA                                        (−2.2◦ C), and seawater temperature beneath was maintained at
and rbcL                                                                  ∼ −1.8◦ C throughout the incubations, as also found in Yoshida
Gene expression measurement shows the potential mechanisms                et al. (2020). The artificial sea ice growth had commenced with
of responses to drastic changes such as freezing and melting              the settling out of individual frazil crystals at the surface of the
of sea ice. The two photosynthesis-related genes, psbA and                cooled water column. This layer of fine crystals accumulated to a
rbcL, were targeted for gene expression measurements. The                 thickness of 1 cm before downward-growing larger crystals were
psbA and rbcL genes encode the D1 protein in PSII reaction                quickly geometrically selected which favored downward growth.
center and the large subunit of ribulose-1,5-bisphosphate                 Indeed, the latter resembled columnar ice growth and contained
carboxylase/oxygenase (RuBisCO), respectively. To stabilize the           brine channels and pockets (Figure 2). There were also some
RNA, RNAlater (Sigma) was immediately added to the ice core               incorporated granular crystals, which indicate turbulence, in the
after collection. Melted ice and seawater samples were filtered           under-ice seawater, possibly due to convection driven by the basal
onto two 25 mm, 2 µm polycarbonate Isopore membrane filters               heater (Figure 2). Convection driven by the basal heater could
(Millipore) with gentle vacuum (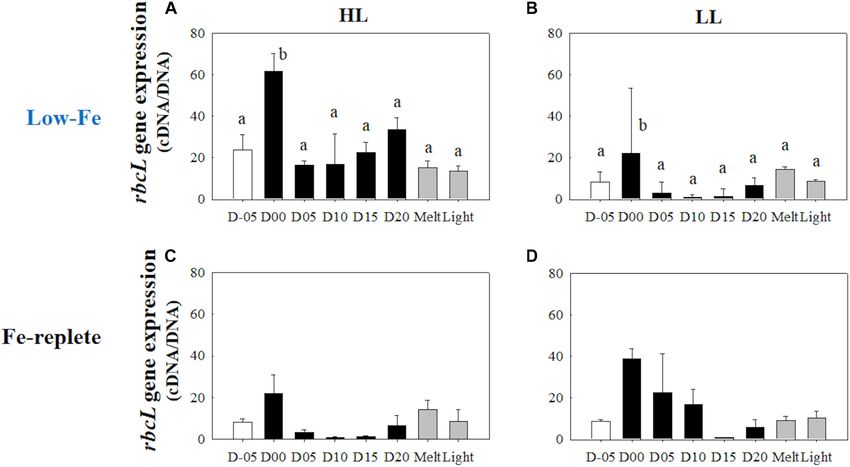
Yoshida et al.                                                                                                                           Low-Fe Stress on Ice Diatom

TABLE 2 | Concentrations of macronutrients, total dissolvable Fe (TDFe), and inorganic Fe species (Fe0 ).

Treatment                   Day                     NO3 + NO2                     PO4                         SiO4                  TDFe                       Fe0
                                                       (µM)                       (µM)                        (µM)                   (nM)                     (pM)

HL                          D-05                    290.7 ± 0.1                 8.4 ± 0.0                   71.3 ± 0.5             23 ± 25                  4.6 ± 5.0
                            D00                          –                          –                           –                   32 ± 0                  6.5 ± 0.0
                            D05                          –                          –                           –                  22 ± 15                  4.4 ± 3.1
                            D10                          –                          –                           –                  38 ± 32                  7.6 ± 6.5
                            D15                          –                          –                           –                  22 ± 15                  4.4 ± 3.0
                            D20                          –                          –                           –                   27 ± 8                  5.4 ± 1.5
                            Melt                    189.8 ± 0.5                 5.9 ± 0.0                   14.3 ± 0.1              27 ± 8                  5.4 ± 1.5

LL                          D-05                    297.1 ± 0.1                 8.9 ± 0.0                   86.6 ± 0.5              20 ± 0                  4.1 ± 0.0
                            D00                          –                          –                           –                   22 ± 0                  4.3 ± 0.0
                            D05                          –                          –                           –                  43 ± 22                  8.7 ± 4.4
                            D10                          –                          –                           –                   22 ± 0                  4.4 ± 0.0
                            D15                          –                          –                           –                  33 ± 39                  6.6 ± 7.9
                            D20                          –                          –                           –                  22 ± 15                  4.4 ± 3.1
                            Melt                    264.3 ± 0.8                 5.4 ± 0.0                   13.2 ± 0.1              25 ± 0                  5.1 ± 0.0

Concentrations of macronutrients (NO3 + NO2 , PO4 , SiO4 ) were determined with an autoanalyzer (Britton et al., 2019) and a spectrophotometer (Parsons et al., 1984).
TDFe concentrations were determined with the Ferrozine method (Stookey, 1970; Farid et al., 2018). The quantification limit of TDFe was 15 nM. Fe0 was calculated with
the software Visual MINTEQ, ver 3.1.
No significant variation in TDFe concentration was observed throughout the low-Fe ice tank incubation experiments [One-way ANOVA, F(6, 13) = 0.52, p < 0.05].

were 23 nM and 20 nM (Fe0 = 4.5 and 4.0 pM), while final                                not change and rather reflected the values at day 20 (HL: q = 1.02,
TDFe concentrations in under-ice seawater were 27 and 25 nM                             p> 0.05; LL: q = 2.31, p> 0.05) (Figures 4A,B). The responses of
(Fe0 = 5.4 and 5.1 pM) for HL and LL treatments, respectively. No                       σPSII to light exposure were also minimal (HL: q = 0.71, p> 0.05;
significant variation in Fe concentration during the incubations                        LL: q = 1.75, p> 0.05; Figures 4A,B), being different from those
was observed in either treatment (p> 0.05). F. cylindrus was                            of F v /F m .
certainly incorporated into the ice, and they showed slow but
constant positive growth in both light treatments within the                            Non-photochemical Quenching (NPQNSV 0 )
ice environments (HL: 0.022 ± 0.006; LL: 0.019 ± 0.009 d−1 ),                           Non-photochemical quenching (NPQNSV 0 ) was relatively high at
showing no significant difference in growth rate between the light                      the initial stage on day −05 (Figures 5A,B). Freezing enhanced
treatments (Welch’s t-test, t = 0.41, p > 0.05).                                        NPQNSV 0 in the HL treatment (q = 5.14, p = 0.016), whereas no
                                                                                        significant change was observed in the LL treatment (q = 2.49, p>
                                                                                        0.05). However, NPQNSV 0 was also significantly upregulated in
Variable Chl a Fluorescence                                                             the early stage of the frozen period at day 05 in the LL treatment
Dark Values (F v /F m and σPSII )                                                       (q = 5.55, p = 0.008). In addition, NPQNSV 0 was gradually
At the beginning of the incubations on day −05, planktonic                              upregulated and reached plateaus in both light treatments
F. cylindrus showed relatively low F v /F m values (HL: 0.32 ± 0.03;                    (Figures 5A,B). After the ice melt, NPQNSV 0 decreased to similar
LL: 0.31 ± 0.01) (Figures 3A,B). Once algal cells were frozen                           levels observed on day −05 in both light treatments, while light
into the ice, F v /F m gradually dropped to  0.05),
q = 12.58, p< 0.001) (Figures 3A,B). During the frozen period                           whereas the NPQNSV 0 in the LL treatment was upregulated upon
after day 05, F v /F m showed stable values at ∼0.2 in both light                       light exposure (q = 6.25, p = 0.002).
treatments. When the ice melted, the F v /F m values recovered
to the values before ice formation at day −05, whereas light                            Photosynthesis-Irradiance (ETRRCII -E) Curve
exposure to the melted samples significantly decreased the F v /F m                     The initial slopes of ETRRCII -E curves; α, regarded as light
(HL: 18% decreased; LL: 30% decreased, HL: q = 6.31, p = 0.002;                         utilization efficiency, did not exhibit any change as the
LL: q = 11.11, p< 0.001). Both treatments showed an identical                           F. cylindrus cells were integrated into the freezing ice matrix
σPSII value at day −05 (HL: 7.41 ± 0.09; 7.53 ± 0.22, Welch’s test,                     (Figures 6A,B). During the frozen periods, α values gradually
t = 0.874, p> 0.05). In the HL incubation, the σPSII was stable                         and constantly increased under both HL and LL conditions.
until day 05 (q = 2.70, p> 0.05), whereas that in the LL treatment                      The ice melt event decreased α values to the initial levels. The
significantly decreased at day 05 compared to day −05 (q = 6.18,                        light exposure did not change α (Figures 6A,B) (HL: q = 0.47,
p = 0.002) (Figures 4A,B). After day 05, σPSII gradually increased                      p> 0.05; LL: q = 0.77, p> 0.05). Maximum electron transport
and reached quite high values near the end of the ice incubation                        rates (ETRmax ) showed significant decreases in both treatments
(HL: 9.59 ± 0.44; LL: 10.66 ± 1.96). After the ice melt, σPSII did                      during the frozen period compared with the initial ETRmax values

Frontiers in Marine Science | www.frontiersin.org                                   7                                         March 2021 | Volume 8 | Article 632087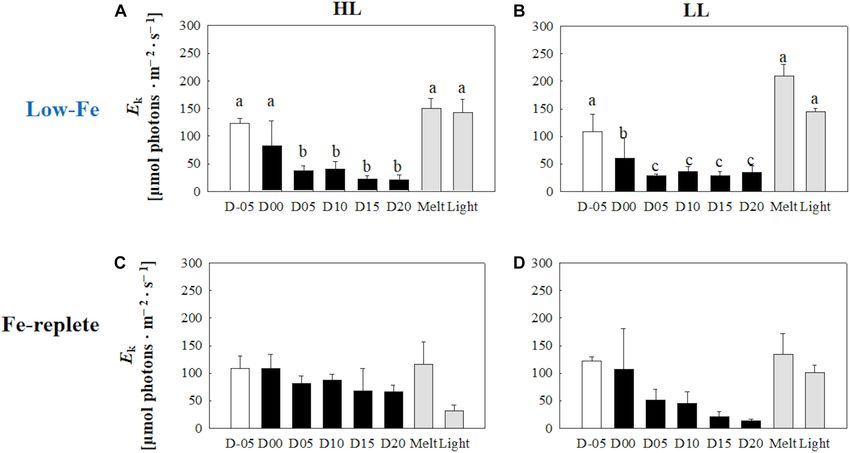
Yoshida et al.                                                                                                                                   Low-Fe Stress on Ice Diatom

  FIGURE 3 | Maximum photochemical quantum yield of PSII (F v /F m ) at each sampling time point during the ice tank incubation experiments. Panels (A,B) show
  F v /F m values of the low-Fe ice tank runs in this study, whereas panels (C,D) show those of Fe-replete ice tank runs modified from Yoshida et al. (2020). Left (A,C)
  and right (B,D) panels indicate data from the HL and LL treatments, respectively. Open, closed, and shaded bars indicate values of pre-freeze seawater, ice, melted
  seawater samples, respectively. Letters above bars in a panel indicate significant differences in values between sampling days with one-way ANOVA with Tukey’s
  test; there is no significant difference between values if a given letter is shown in the combination of letters of the counterparts. The D stands for “day,” while Melt and
  Light indicate values after melting and light exposure experiments, respectively. Error bars show 1 standard deviation (n = 6). One-way ANOVA with Tukey’s test, HL:
  F (7, 47) = 57.53, p< 0.001; LL: F (7, 47) = 55.64, p< 0.001; Two-way ANOVA test with Tukey’s test, Light: F (1, 90) = 0.0254, p> 0.05; Day: F (7, 90) = 24.88, p<
  0.001; Light*Day: F (7, 90) = 3.05, p = 0.007. The results of Tukey’s test, as q-values, are given in the text.

  FIGURE 4 | Functional absorption cross-section of PSII (σPSII ) at each sampling time point during the ice tank incubation experiments. Panels (A,B) show σPSII
  values of the low-Fe ice tank runs in this study, whereas panels (C,D) show those of Fe-replete ice tank runs modified from Yoshida et al. (2020). Left (A,C) and right
  (B,D) panels indicate data from the HL and LL treatments, respectively. Open, closed, and shaded bars indicate values of pre-freeze seawater, ice, melted seawater
  samples, respectively. Letters above bars in a panel indicate significant differences in values between sampling days and light treatments with one-way/two-way
  ANOVA with Tukey’s test; there is no significant difference between values if a given letter is shown in the combination of letters of the counterparts. The D stands for
  “day,” while Melt and Light indicate values after melting and light exposure experiments, respectively. Error bars show 1 standard deviation (n = 6). One-way ANOVA
  with Tukey’s test, HL: F (7, 47) = 18.80, p< 0.001; LL: F (7, 47) = 21.98, p< 0.001. Two-way ANOVA test with Tukey’s test, Light: F (1, 90) = 1.37, p> 0.05; Day: F (7,
  90) = 20.04, p< 0.001; Light*Day: F (7, 90) = 2.13, p> 0.05. The results of Tukey’s tests, as q-values, are given in the text.

Frontiers in Marine Science | www.frontiersin.org                                      8                                              March 2021 | Volume 8 | Article 632087
Yoshida et al. Low-Fe Stress on Ice Diatom
FIGURE 5 | Non-photochemical quenching based on the normalized Stern-Volmer quenching coefficient under the actinic light (150 and 30 µmol photons m−2 s−1
for HL and LL, respectively) (NPQNSV 0 ) at each sampling time point during the ice tank incubation experiments. Panels (A,B) show NPQNSV 0 values of the low-Fe ice
tank runs in this study, whereas panels (C,D) show those of Fe-replete ice tank runs modified from Yoshida et al. (2020). Left (A,C) and right (B,D) panels indicate
data from the HL and LL treatments, respectively. Open, closed, and shaded bars indicate values of pre-freeze seawater, ice, melted seawater samples, respectively.
Letters above bars in a panel indicate significant differences in values between sampling days with one-way ANOVA with Tukey’s test; there is no significant
difference between values if a given letter is shown in the combination of letters of the counterparts. The D stands for “day,” while Melt and Light indicate values after
melting and light exposure experiments, respectively. Error bars show 1 standard deviation (n = 6). One-way ANOVA with Tukey’s test, HL: F (7, 47) = 36.03, p<
0.001; LL:. F (7, 47) = 29.12, p< 0.001. Two-way ANOVA test with Tukey’s test, Light: F (1, 75) = 24.40, p< 0.001; Day: F (7, 90) = 45.74, p< 0.001; Light*Day:
F (7, 90) = 34.49, p< 0.001. A significant interaction between the light availabilities and sampling time points was observed. The results of Tukey’s test, as q-values,
are given in the text.
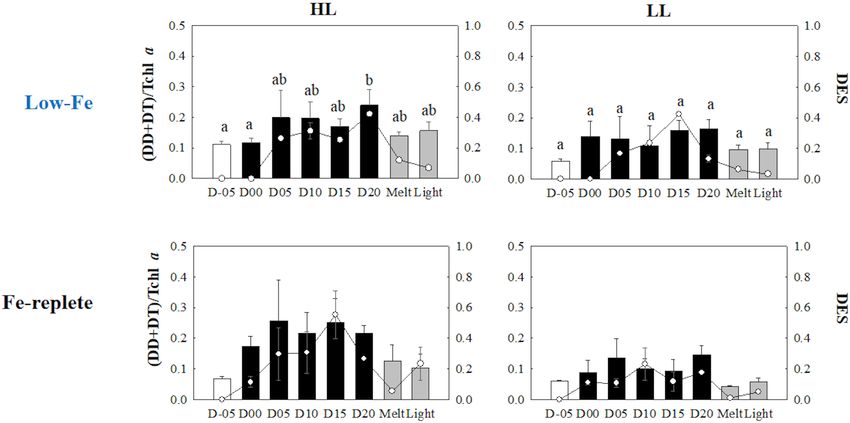
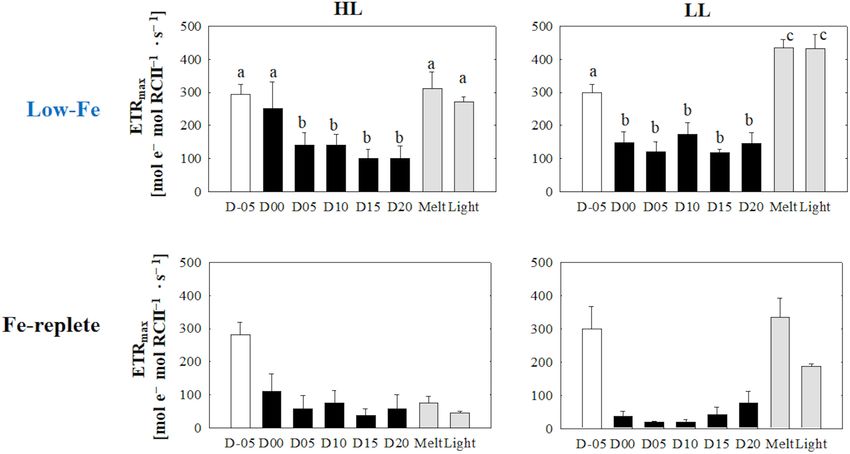
(Figures 7A,B) (HL: q observed in the LL treatment (p> 0.05, Figure 10B). Values of
0.05; LL: q = 0.26, p> 0.05). Values of the light saturation index, DES increased slightly later than the algal cells that had been
Ek , first gradually decreased over the course of the incubation frozen into the ice and remained stable in both light treatments
experiments but no conspicuous variation was observed after day (Figures 10A,B). The DES levels decreased when algal cells were
05 during the frozen period (HL: 0.45 < q< 2.81, p> 0.05; LL: melted out in both light treatments (HL: q = 55.89, p< 0.001;
0.16 < q< 2.15, p> 0.05, Figures 8A,B). Melting increased the Ek LL: q = 14.83, p< 0.001). Light exposure did not change the
values to the initial levels before freezing on day −05, whereas the DES levels in the HL treatment (q = 4.56, p> 0.05, Figure 10A);
light exposure did not change the Ek values in either treatment however, the DES in the LL treatment significantly decreased
(Figures 8A,B) (HL: q = 2.50, p> 0.05; LL: q = 1.05, p > 0.05). after the light exposure (q = 5.91, p = 0.013, Figure 10B).
The HL treatment showed a gradual and sharp increase in
Pigment Composition PPC/PSC during the frozen period (Figure 11A), whereas
Initial Tchl a concentrations were comparable regardless of light no conspicuous change was observed in the LL treatment
availability (Welch’s test, t = 0.19, p> 0.05, Figures 9A,B); throughout the incubation (p> 0.05, Figure 11B). When the
however, the LL treatment showed higher Tchl a biomass during ice melted, there was a significant decrease in the PPC/PSC
the frozen period (q = 6.24, p< 0.001). The contribution of in the HL treatment (q = 5.73, p = 0.016), down to the level
chlide a to Tchl a gradually increased during the course of the prior to the start of the frozen period (Figure 11A). The
incubations (Figures 9A,B). When the cells were exposed to high light exposure little affected the PPC/PSC ratios in both light
light after the ice had melted, there were substantial increases treatments (HL: q = 0.21, p< 0.05, LL: p< 0.05, Figures 11A,B).
in the chlide a to Tchl a ratio in both light treatments (HL: The PPC/PSC level of the HL treatment was significantly higher
q = 7.25, p = 0.002; LL: q = 5.20, p = 0.033, Figures 9A,B). than that of the LL treatment throughout the incubations
The DD-DT pool size in the HL treatment was significantly (q = 5.39, p < 0.001).
Frontiers in Marine Science | www.frontiersin.org 9 March 2021 | Volume 8 | Article 632087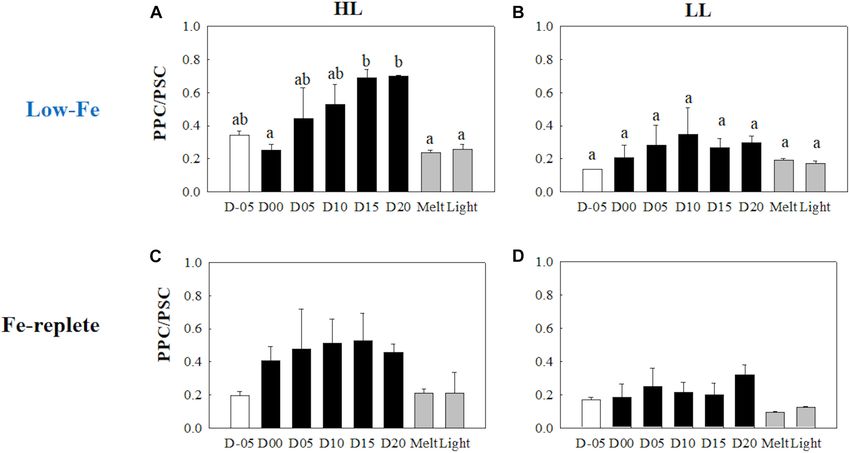
Yoshida et al.                                                                                                                             Low-Fe Stress on Ice Diatom

  FIGURE 6 | Light utilization index (α) calculated from the photosynthesis-irradiance (ETRRCII -E) relationship at each sampling time point during the ice tank
  incubation experiments. Panels (A,B) show α values of the low-Fe ice tank runs in this study, whereas panels (C,D) show those of Fe-replete ice tank runs modified
  from Yoshida et al. (2020). Left (A,C) and right (B,D) panels indicate data from the HL and LL treatments, respectively. Open, closed, and shaded bars indicate
  values of pre-freeze seawater, ice, melted seawater samples, respectively. Letters above bars in a panel indicate significant differences in values between sampling
  days with one-way ANOVA with Tukey’s test; there is no significant difference between values if a given letter is shown in the combination of letters of the
  counterparts. The D stands for “day,” while Melt and Light indicate values after melting and light exposure experiments, respectively. Error bars show 1 standard
  deviation (n = 6). One-way ANOVA with Tukey’s test, HL: F (7, 47) = 26.84, p< 0.001; LL: F (7, 47) = 21.03, p< 0.001. Two-way ANOVA test with Tukey’s test, Light:
  F (1, 90) = 3.68, p > 0.05; Day: F (7, 90) = 36.02, p< 0.001; Light*Day: F (7, 90) = 0.88, p> 0.05. The results of Tukey’s test, as q-values, are given in the text.

Gene Expression of                                                                      (Figure 12A). The LL treatment, on the other hand, showed
Photosynthesis-Related Genes                                                            a constant psbA gene expression with no significant change
                                                                                        (p> 0.05) (Figure 13B). Both ice melt and light exposure had
rbcL
                                                                                        minimal effects on the transcriptional activity of the psbA gene
Gene expressions of the rbcL gene were highly upregulated when
                                                                                        in both light treatments (HL: q> 1.15, p> 0.05; LL: p> 0.05,
the algal cells were frozen into the ice in both light treatments
                                                                                        Figures 13A,B).
(HL: q = 9.23, p< 0.001; LL: q = 5.14, p = 0.036, Figures 12A,B).
During the frozen periods, however, gene expression levels
dropped sharply (HL: q = 10.39, p< 0.001; LL: q = 7.10, p = 0.003),
to a lower level than that of the values from the seawater prior
                                                                                        DISCUSSION
to the initiation of freezing (Figures 12A,B). The low level was
sustained throughout the frozen period. Ice melt also did not                           Ice Physics and Chemistry
affect the transcriptional activity of the rbcL gene. In addition,                      Our experiments resulted in the first successful incubation
the rbcL gene expression did not show any conspicuous changes                           of the diatom Fragilariopsis cylindrus in artificial sea ice at
in either treatment after light exposure (HL: q = 0.44, p> 0.05; LL:                    a low Fe concentration using a purpose-designed low Fe ice
q = 0.24, p> 0.05, Figures 12A,B). Interestingly, the HL treatment                      tank (Figure 1). Our prolonged ice tank runs demonstrated
showed a significantly higher rbcL gene expression than the LL                          the photophysical responses and competency of the ice algae,
treatment throughout the incubations (q = 3.93, p = 0.009).                             F. cylindrus, to low Fe availability in the Southern Ocean. The
                                                                                        thick section of artificial ice contained elongated brine channels
                                                                                        with some brine pockets in the ice matrix, which consisted
psbA                                                                                    of frazil ice granules at the top and columnar ice below the
Unlike the rbcL gene, gene expression of the psbA gene behaved                          upper 1 cm (Figure 2). This structure suggests that the ice
differently with differences in light availability (Figures 13A,B).                     tank realistically reproduced a natural sea-ice environment (e.g.,
Under HL conditions, transcriptional levels of the psbA gene                            Petrich and Eicken, 2017). As discussed in our previous work
dynamically changed; the highest value was observed while algal                         using the same ice tank (Yoshida et al., 2020), the sharp decrease
cells were frozen within the ice matrix (Figure 13A). This peak                         in temperature (top: −22.5◦ C; bottom: −2.2◦ C in 5.5 cm) was
value was significantly higher than the low expression levels at                        consistent with the winter-time pack ice environment (Petrich
the end of the frozen period (q = 7.17, p = 0.002, Figure 13A),                         and Eicken, 2017). Macro-nutrients were sufficient to maintain
which was similar to the rbcL variation in the HL treatment                             growth throughout the experiments and to ensure that Fe was

Frontiers in Marine Science | www.frontiersin.org                                  10                                            March 2021 | Volume 8 | Article 632087
Yoshida et al. Low-Fe Stress on Ice Diatom
FIGURE 7 | Maximum electron transport rate (ETRmax ) calculated from the photosynthesis-irradiance (ETRRCII -E) relationship at each sampling time point during the
ice tank incubation experiments. Panels (A,B) show ETRmax values of the low-Fe ice tank runs in this study, whereas panels (C,D) show those of Fe-replete ice tank
runs modified from Yoshida et al. (2020). Left (A,C) and right (B,D) panels indicate data from the HL and LL treatments, respectively. Open, closed, and shaded bars
indicate values of pre-freeze seawater, ice, melted seawater samples, respectively. Letters above bars in a panel indicate significant differences in values between
sampling days with one-way ANOVA with Tukey’s test; there is no significant difference between values if a given letter is shown in the combination of letters of the
counterparts. The D stands for “day,” while Melt and Light indicate values after melting and light exposure experiments, respectively. Error bars show 1 standard
deviation (n = 6). One-way ANOVA with Tukey’s test, HL: F (7, 47) = 25.85, p< 0.001; LL: F (7, 47) = 118.16, p< 0.001. Two-way ANOVA test with Tukey’s test, Light:
F (1, 90) = 10.09, p> 0.05; Day: F (7, 90) = 35.07, p< 0.001; Light*Day: F (7, 90) = 6.36, p< 0.001. A significant interaction between the light availabilities and
sampling time points was observed. The results of Tukey’s test, as q-values, are given in the text.
the limiting nutrient. The consistently low Fe0 concentration incubated ice algae under low-Fe conditions for the first time.
confirmed that the ice tank runs had been conducted at low Fe The freezing event gradually decreased both F v /F m and σPSII
levels throughout the experiments (Table 2). Although low Fe values until day 05 (Figures 3A,B, 4A,B). In principle, σPSII is a
availability suppressed PSII photochemical efficiency (discussed function of the optical absorption cross section of PSII (σopt PSII )
below in 4.2), the observed growth rates (HL: 0.022 ± 0.006; and maximal quantum yield of PSII photochemistry (8max PSII ,
LL: 0.019 ± 0.009 d−1 ) were identical to those in Fe-replete or F v /F m ) (e.g., Huot and Babin, 2011):
ice tanks runs (0.020 d−1 ; Yoshida et al., 2020). This suggests opt max
acclimation to the low Fe condition. Pankowski and McMinn σPSII = σPSII × σPSII
(2008) reported that moderate Fe limitation occurred at ∼5
pM Fe0 for F. cylindrus, which is a similar level to that of this The concomitant decrease thus suggests that the reduced
study (HL: 4.6-6.5 pM Fe0 ; LL: 4.1-8.7 pM Fe0 ; Table 2). It is photochemical efficiency of PSII (i.e., F v /F m ) lowered the σPSII
thus suggested that our ice tank incubation experiments were when F. cylindrus cells were frozen into the ice. Also, NPQNSV 0
appropriate to assess how freezing and melting stress under gradually increased, while F v /F m conversely decreased with
chronic Fe starvation affects the photosynthetic physiology of ice the freezing stress (Figures 3A,B, 5A,B), suggesting that the
algal F. cylindrus. photosynthetic apparatus of F. cylindrus was well-protected from
freezing stress even under the Fe-starved condition. Although
σPSII decreased (Figures 4A,B), the light utilization index, α, did
Freezing Event not respond to the freezing event (Figures 6A,B). In general,
Freezing stress lowered the photochemical efficiency and α is a product of σPSII and the concentration of functional
stemmed the electron transport. At the beginning of RCII (nPSII ):
the incubation, F v /F m values were reasonably low (∼0.3) α = σPSII × nPSII
(Figures 3A,B), which was ca. 30 % lower than the previous Fe-
replete ice tank incubation experiments (F v /F m = ∼0.45; Yoshida The stable α values suggest that F. cylindrus could increase
et al., 2020; Figures 3C,D). Kolber et al. (1994) and Suzuki et al. nPSII in response to low-light acclimation (nPSII strategy,
(2002) demonstrated that Fe availability affects photochemical hereafter) with freezing stress. However, these were unexpected
reactions at RCII, since PSII has 2 Fe atoms and a high turnover physiological responses, because it is Fe-costly to synthesize PSII
rate (Greene et al., 1992; Geider and LaRoche, 1994; Govindjee (e.g., Geider and LaRoche, 1994; Twining and Baines, 2013).
et al., 2010). These observations demonstrate that we successfully Interestingly, ETRmax maintained higher values (Figures 7A,B),
Frontiers in Marine Science | www.frontiersin.org 11 March 2021 | Volume 8 | Article 632087Yoshida et al. Low-Fe Stress on Ice Diatom FIGURE 8 | Light saturation index (E k ) calculated from the photosynthesis-irradiance (ETRRCII -E) relationship at each sampling time point during the ice tank incubation experiments. Panels (A,B) show E k values of the low-Fe ice tank runs in this study, whereas panels (C,D) show those of Fe-replete ice tank runs modified from Yoshida et al. (2020). Left (A,C) and right (B,D) panels indicate data from the HL and LL treatments, respectively. Open, closed, and shaded bars indicate values of pre-freeze seawater, ice, melted seawater samples, respectively. Letters above bars in a panel indicate significant differences in values between sampling days with one-way ANOVA with Tukey’s test; there is no significant difference between values if a given letter is shown in the combination of letters of the counterparts. The D stands for “day,” while Melt and Light indicate values after melting and light exposure experiments, respectively. Error bars show 1 standard deviation (n = 6). One-way ANOVA with Tukey’s test, HL: F (7, 47) = 12.88, p< 0.001; LL: F (7, 47) = 41.46, p< 0.001. Two-way ANOVA test with Tukey’s test, Light: F (1, 90) = 0.62, p> 0.05; Day: F (7, 90) = 22.86, p< 0.001; Light*Day: F (7, 90) = 1.54, p > 0.05. The results of Tukey’s test, as q-values, are given in the text. FIGURE 9 | Total chlorophyll a (Tchl a) concentrations contributions of chlide a to Tchl a at each sampling time point during the ice tank incubation experiments. Panels (A,B) show Tchl a concentrations (bars, left axis) and contributions of chlide a to Tchl a (open circles, right axis) of the low-Fe ice tank runs in this study, whereas panels (C,D) show those of Fe-replete ice tank runs modified from Yoshida et al. (2020). Left (A,C) and right (B,D) panels indicate data from the HL and LL treatments, respectively. Open, closed, and shaded bars indicate values of pre-freeze seawater, ice, melted seawater samples, respectively. Letters above bars in a panel indicate significant differences in values between sampling days and light treatments with one-way ANOVA with Tukey’s test; there is no significant difference between values if a given letter is shown in the combination of letters of the counterparts. The D stands for “day,” while Melt and Light indicate values after melting and light exposure experiments, respectively. Error bars show 1 standard deviation (n = 3). Tchl a: One-way ANOVA with Tukey’s test, HL: F (7, 23) = 24.17, p< 0.001; LL: F (7, 23) = 2.78, p = 0.48; Two-way ANOVA with Tukey’s test, Light: F (1, 46) = 19.44, p< 0.001; Day: F (7, 46) = 5.68, p< 0.001; Light*Day: F (7, 46) = 2.15, p> 0.05. Chlide a/Tchl a: One-way ANOVA with Tukey’s test, HL: F (7, 23) = 18.40, p< 0.001; LL: F (7, 23) = 3.53, p = 0.017. Two-way ANOVA test with Tukey’s test, Light: F (1, 46) = 1.71, p> 0.05; Day: F (7, 46) = 9.29, p< 0.001; Light*Day: F (7, 46) = 2.40, p > 0.05. The results of Tukey’s test, as q-values, are given in the text. Frontiers in Marine Science | www.frontiersin.org 12 March 2021 | Volume 8 | Article 632087
Yoshida et al.                                                                                                                                 Low-Fe Stress on Ice Diatom

  FIGURE 10 | Xanthophyll pool size [(DD + DT)/Tchl a] and xanthophyll de-epoxidation states (DES) at each sampling time point during the ice tank incubation
  experiments. Panels (A,B) show xanthophyll pool size (bars, left axis) and DES (markers, right axis) of the low-Fe ice tank runs in this study, whereas panels (C,D)
  show those of Fe-replete ice tank runs modified from Yoshida et al. (2020). Left (A,C) and right (B,D) panels indicate data from the HL and LL treatments,
  respectively. Open, closed, and shaded bars indicate values of pre-freeze seawater, ice, melted seawater samples, respectively. Letters above bars in a panel
  indicate significant differences in values between sampling days and light treatments with one-way/two-way ANOVA with Tukey’s test; there is no significant
  difference between values if a given letter is shown in the combination of letters of the counterparts. The D stands for “day,” while Melt and Light indicate values after
  melting and light exposure experiments, respectively. Error bars show 1 standard deviation (n = 3). Xanthophyll pool size: One-way ANOVA with Tukey’s test, HL: F (7,
  23) = 3.03, p = 0.032, LL: F (7, 23) = 2.00, p> 0.05; Two-way ANOVA with Tukey’s test, Light: F (1, 46) = 4.55, p = 0.041; Day: F (7, 46) = 2.26, p> 0.05; Light*Day:
  F (1, 46) = 0.40, p< 0.05. DES: One-way ANOVA with Tukey’s test, HL: F (7, 23) = 771.14, p< 0.001; LL: F (7, 23) = 188.50, p< 0.001. Two-way ANOVA test with
  Tukey’s test, Light: F (1, 46) = 61.35, p< 0.001; Day: F (7, 46) = 11.51, p< 0.001; Light*Day: F (7, 46) = 14.01, p< 0.001. A significant interaction between the light
  availabilities and sampling time points was observed. The results of Tukey’s test, as q-values, are given in the text.

which were similar to those of the Fe-replete ice tank experiments                        activity by increasing the cellular enzyme concentration (Devos
(Yoshida et al., 2020; Figures 7C,D). Schuback et al. (2015)                              et al., 1998; Lyon and Mock, 2014; Young et al., 2015; Yoshida
also reported relatively high ETRmax values in Fe-limited                                 et al., 2018). A contrasting response was found for the psbA
waters. They hypothesized the existence and upregulation of                               gene, i.e., upregulation in the HL treatment while constant in
alternative pathways for electrons to dissipate the excess energy,                        the LL treatment (Figures 13A,B). The upregulation of the psbA
rather than xanthophyll cycling. These included pseudo-cyclic                             in the HL treatment could be a strategy to overcome over-
and cyclic electron flow (Prášil et al., 1996; Feikema et al.,                            excitation associated with HL and possibly the freezing stress
2006; Cardol et al., 2011), which would have reduced the                                  causing electron clogging. This upregulation also suggests that
high transmembrane 1pH under low Fe conditions. The                                       the turnover rate of D1 proteins was accelerated due to a higher
resultant Ek value eventually showed the dark-acclimated state                            rate of PSII photodamage.
(Figures 8A,B). The contribution of chlide a to Tchl a was stable
when cells had frozen into the ice, indicating a smaller effect of                        Frozen Period
the melting process on pigment breakdown and the production                               Sea ice provides a stable platform for photosynthesis of ice algae,
of chlide a (Figures 9A,B). The size of DD-DT pool was also                               which might optimize their photophysiology in spite of the low
stable, and the xanthophyll cycle had not been activated at day                           Fe availability. Regardless of light intensity, F v /F m values during
00 (Figures 10A,B). This suggests that other non-photochemical                            the frozen period were comparable to the previous study under
quenching pathways were responsible for the NPQ. However,                                 Fe-replete conditions (Yoshida et al., 2020; Figures 3C,D). This
the xanthophyll cycle activated at day 05 with the upregulation                           suggests that both Fe and light availability had little effect on PSII
of NPQNSV 0 , suggesting that diatoms had gradually acclimated                            reaction center activity and growth of F. cylindrus in the sea-ice
to the ice environment by employing their photoprotective                                 environment. Pankowski and McMinn (2008) reported similar
capability (Figures 5A,B, 10A,B). Gene expression of the rbcL                             growth rates of F. cylindrus both in Fe-replete and Fe-starved
gene were upregulated in both light treatments (Figures 12A,B),                           culturing media. Although F v /F m values were stable in our
emphasizing the cold acclimation strategy. The carboxylation rate                         experiments, σPSII showed gradual increases during the course
of RuBisCO critically slows down at low temperatures (Young                               of the incubation (Figures 3A,B, 4A,B). Interestingly, the other
et al., 2015). The rbcL gene upregulation could enhance the                               index of light absorption efficiency, α, increased synchronously
synthesis rate of RuBisCO to complement the low enzymatic                                 with σPSII (Figures 4A,B, 6A,B), suggesting that the increase

Frontiers in Marine Science | www.frontiersin.org                                    13                                              March 2021 | Volume 8 | Article 632087
Yoshida et al.                                                                                                                                  Low-Fe Stress on Ice Diatom

  FIGURE 11 | Ratio of Photoprotective to photosynthetic carotenoids (PPC/PSC) at each sampling time point during the ice tank incubation experiments. Panels
  (A,B) show PPC/PSC ratios of the low-Fe ice tank runs in this study, whereas panels (C,D) show those of Fe-replete ice tank runs modified from Yoshida et al.
  (2020). Left (A,C) and right (B,D) panels indicate data from the HL and LL treatments, respectively. Open, closed, and shaded bars indicate values of pre-freeze
  seawater, ice, melted seawater samples, respectively. Letters above bars in a panel indicate significant differences in values between sampling days with one-way
  ANOVA with Tukey’s test; there is no significant difference between values if a given letter is shown in the combination of letters of the counterparts. The D stands for
  “day,” while Melt and Light indicate values after melting and light exposure experiments, respectively. Error bars show 1 standard deviation (n = 3). One-way ANOVA
  with Tukey’s test, HL: F (7, 23) = 5.62, p = 0.002; LL: F (7, 23) = 2.39, p> 0.05. Two-way ANOVA test with Tukey’s test, Light: F (1, 46) = 14.52, p< 0.001; Day: F (7,
  46) = 2.87, p = 0.02; Light*Day: F (7, 46) = 1.57, p> 0.05. The results of Tukey’s test, as q-values, are given in the text.

  FIGURE 12 | Gene expression of the rbcL gene. Panels (A,B) show rbcL gene expression of the low-Fe ice tank runs in this study, whereas panels (C,D) show
  those of Fe-replete ice tank runs modified from Yoshida et al. (2020). Left (A,C) and right (B,D) panels indicate data from the HL and LL treatments, respectively.
  Open, closed, and shaded bars indicate values of pre-freeze seawater, ice, melted seawater samples, respectively. Letters above bars in a panel indicate significant
  differences in values between sampling days with one-way ANOVA with Tukey’s test; there is no significant difference between values if a given letter is shown in the
  combination of letters of the counterparts. The D stands for “day,” while Melt and Light indicate values after melting and light exposure experiments, respectively.
  Error bars show 1 standard deviation (n = 3). One-way ANOVA with Tukey’s test, HL: F (7, 23) = 14.94, p< 0.001; LL: F (7, 23) = 8.36, p< 0.001. Two-way ANOVA
  test with Tukey’s test, Light: F (1, 45) = 7.74, p< 0.001; Day: F (7, 45) = 1.00, p> 0.05; Light*Day: F (7, 45) = 0.79, p> 0.05. The results of Tukey’s test, as q-values,
  are given in the text.

Frontiers in Marine Science | www.frontiersin.org                                     14                                             March 2021 | Volume 8 | Article 632087
Yoshida et al.                                                                                                                                    Low-Fe Stress on Ice Diatom

  FIGURE 13 | Gene expression of the psbA gene. Panels (A,B) show psbA gene expression of the low-Fe ice tank runs in this study, whereas panels (C,D) show
  those of Fe-replete ice tank runs modified from Yoshida et al. (2020). Left (A,C) and right (B,D) panels indicate data from the HL and LL treatments, respectively.
  Open, closed, and shaded bars indicate values of pre-freeze seawater, ice, melted seawater samples, respectively. Letters above bars in a panel indicate significant
  differences in values between sampling days with one-way ANOVA with Tukey’s test; there is no significant difference between values if a given letter is shown in the
  combination of letters of the counterparts. The D stands for “day,” while Melt and Light indicate values after melting and light exposure experiments, respectively.
  Error bars show 1 standard deviation (n = 3). One-way ANOVA with Tukey’s test, HL: F (7, 23) = 4.65, p = 0.005; LL: F (7, 23) = 2.33, p> 0.05. Two-way ANOVA test
  with Tukey’s test, Light: F (1, 45) = 3.82, p> 0.05; Day: F (7, 45) = 2.58, p = 0.036; Light*Day: F (7, 45) = 3.16, p = 0.014. The results of Tukey’s test, as q-values, are
  given in the text.

in α was due to increasing photosynthetic antennae size (i.e.,                              Laudenbach et al., 1988; Geider and LaRoche, 1994; Lommer
increase in σPSII ; “σPSII strategy,” hereafter), but not increasing the                    et al., 2012; Georg et al., 2017). The DD-DT xanthophyll cycle
number of photosynthetic units (nPSII strategy). By conducting                              was thus largely responsible for photoprotection in diatoms
culture incubation experiments using representative Southern                                under the low-Fe condition, as well as high-Fe environments
Ocean species, Strzepek et al. (2012, 2019), demonstrated that                              (Yan et al., 2019; Yoshida et al., 2020). The pool size of
Southern Ocean phytoplankton in Fe-limited waters employed                                  DD plus DT in the HL treatment was larger than that
the σPSII strategy (σPSII > 10 nm2 PSII−1 ; Strzepek et al., 2019,                          of the LL counterpart (Figures 10A,B), again suggesting
similar in value to those of this study; Figures 4A,B). They                                more photoprotective capability under the HL condition. The
proposed that the σPSII strategy is used to overcome Fe-light                               significantly higher PPC/PSC ratio in the HL treatment was
co-limitation in the Southern Ocean; this study is the first                                also supportive evidence of the large range of photoprotective
to demonstrate that ice algae in the Antarctic also appear to                               capability (Figures 11A,B). NPQ0 NSV capability (maximum
employ the same strategy. On the contrary, the Fe-replete ice                               values of NPQ0 NSV ) was, however, comparable between the HL
tank experiments did not show any increase in both σPSII and α                              and LL treatments (Figures 5A,B). This was possibly due to
(Figures 4C,D, 6C,D), indicating that the σPSII strategy could be                           the effectiveness of the xanthophyll cycle rather than other
a unique photophysiological response of polar diatoms to low-                               factors, e.g., the cyclic electron flow via ferredoxin or flavodoxin
Fe and low-light conditions. Also, F. cylindrus had changed their                           (Prášil et al., 1996; Feikema et al., 2006; Cardol et al., 2011).
low-light acclimation strategy; they increased nPSII while being                            The DD-DT xanthophyll cycle prevents further build-up of the
frozen in (nPSII strategy; discussed above), whereas they enhanced                          transmembrane 1pH because further electron sinks might not
σPSII over the duration of the frozen periods (σPSII strategy). This                        have been active. Indeed, Yoshida et al. (2020) reported that
physiological switching in F. cylindrus could be significant for                            DES was not exclusively responsible for NPQNSV 0 ; other electron
acclimation to ice environments.                                                            pathways play supportive roles for photoprotection.
   Interestingly, NPQNSV 0 seemed to synchronize with DES                                      It is also of interest that both Schuback et al. (2015)
during the frozen periods, whereas NPQNSV 0 and DES did not                                 and this study reported higher ETRmax values even under Fe
covary during the freezing event at day 00 (Figures 5A,B, 10A,B),                           starvation compared with Fe-replete conditions (Yoshida et al.,
which was another evidence of the physiological switching.                                  2020). The higher ETRmax values might also be due to charge
This response was feasible because DD and DT do not possess                                 recombination at PSII (i.e., reflux of electrons back to RCII
Fe, although there are some effects of Fe availability on the                               after the excitation event; electron recoupling to RCII; Vass,
genetic translations of the pigments, such as operon regions (e.g.,                         2011), leading to overestimation of electron transportation at

Frontiers in Marine Science | www.frontiersin.org                                      15                                              March 2021 | Volume 8 | Article 632087
Yoshida et al.                                                                                                           Low-Fe Stress on Ice Diatom

PSII (Schuback et al., 2016). The freezing stress could lead                20.9% increase; LL: 57.8% increase) than in those of the Fe-
to high excitation pressure to the electron transport chain.                replete conditions (HL: 98.5%; LL: 89.5% increase) reported in
Also, if the xanthophyll cycle was exclusively responsible for              our previous ice-tank work (Yoshida et al., 2020; Figure 5).
photoprotection, as discussed above, electron recoupling could              This indicates that the low Fe conditions suppressed NPQ
be one of the possible pathways to address the enigmatic high               ability. Moreover, the xanthophyll activity, shown as DES, was
ETRmax values under Fe starvation. Transcriptional activity of the          downregulated in the high light stress in the LL treatment, but
rbcL gene was sharply downregulated in the ice and maintained               not in the HL treatment (Figures 10A,B). This different response
at a low level (Figures 12A,B), suggesting that algal cells                 to light exposure reflects their different light history during the
acclimated to their ice environment and optimized the balance               frozen period; lower photoprotective ability under lower light
between photochemical reactions and energy allocation to the                availability. In addition, the small change and lower DES after
dark reaction processes, such as carbon fixation by RuBisCO. It             light provide a reasonable explanation of the lower NPQNSV 0
was of interest that rbcL gene expression in the HL treatment               enhancement. The xanthophyll pool and PPC/PSC ratio were,
was significantly higher than the LL treatment (Figures 12A,B),             however, relatively stable, because pigment synthesis is slower
suggesting that more RuBiSCO might be required as an electron               than photoprotective processes (i.e., xanthophyll cycles and D1
sink with the higher excitation pressure in the HL treatment. The           protein repair) (Kuczynska et al., 2015).
constant gene expression of the psbA gene in the LL treatment                   The significant accumulation of chlide a after light exposure
seems reasonable, as the constant freezing stress in the ice could          reflected the high level of absorbed energy that subsequently
have damaged the fragile D1 protein in PSII by over-reduction               broke down intact chl a, possibly due to the presence of
(Figure 13A). Downregulation in the transcriptional activity of             ROS (Figures 9A,B). The stable contribution of chlide a again
the psbA gene in the HL treatment, however, was enigmatic                   implied that the production of chlide a was not due to ice
because light stress was more evident at the higher light intensity.        melt events. Large concentrations of chlide a, however, have
The relationship between the psbA gene and the transcription                been observed at the surface of the Southern Ocean during ice
of the D1 protein is not directly inferred by the considerable              retreat in spring (Bidigare et al., 1986; Wright et al., 2010).
post-transcriptional regulation (e.g., mRNA splicing and RNA                Exposure to high light after ice algae are released from ice
editing; Kettunen et al., 1997). The significant upregulation of            is more likely the reason for the high chlide a contributions
the psbA gene when frozen in (discussed above), associated with             in situ. Interestingly, repair of damaged PSII, as indicated from
the sudden freezing stress, might thus provide excess mRNA to               gene expression of the psbA gene, was not activated after light
maintain synthesis of the D1 proteins.                                      exposure (Figures 13A,B). In addition, the slower repair of
                                                                            damaged PSII at low temperature (Kropuenske et al., 2009;
Light Exposure After the Ice Melt Event                                     van de Poll et al., 2011; Lacour et al., 2018) could exacerbate
Even under low Fe availability, ice algae coped with light stress           the photoinhibition. The diatom F. cylindrus displayed high
when they were released from sea ice. The high ETRmax, values,              photosynthetic flexibility and successfully acclimated to the low-
which were higher than or similar to the Fe-replete values,                 Fe availability even after chronic Fe starvation in a simulated
also support the photosynthetic plasticity of F. cylindrus to the           sea-ice environment. However, the chronic Fe starvation led
chronic low-Fe stress even after ice melt and light exposure                to reduced photoprotective capability, which could affect the
(Figure 7; Yoshida et al., 2020). The σPSII strategy, which                 survival of ice algae when the cells are released to high-light
enlarges photosynthetic antenna size, was quite effective for               pelagic waters. This might lead to changes in ice-edge bloom
photosynthetic acclimation to overcome low-Fe and low-light                 species and the extent of ice-edge blooms unless an ample amount
availability in sea ice (Strzepek et al., 2012, 2019). This low-Fe          of Fe is supplied to the cells during ice melt.
acclimation, at low temperatures, resulted in the similar growth
rate to that of the Fe-replete ice tank runs. Light exposure
significantly decreased F v /F m values due to the excess excitation        CONCLUSION
pressure in the reaction centers of PSII, i.e., photoinhibition
(Figures 3A,B; Melis, 1999). This photoinhibition was also                  For the first time, we successfully incubated the polar diatom
evident even in the Fe-replete ice tank incubation experiments              F. cylindrus under low Fe conditions in artificial sea ice using the
(Yoshida et al., 2020; Figures 3C,D). NPQNSV 0 also responded               ice tank. The artificial sea ice was similar to natural winter sea-
to light exposure to dissipate excess energy (Figures 5A,B);                ice characteristics including vertically elongated ice crystals and
however, photoprotective capability was not evident compared                brine channels as well as brine pockets underneath a thin layer of
with Fe-replete condition (Figures 5C,D). The NPQ NSV 0                     fine granular frazil ice. Ice algae are capable of optimizing their
values in this low-Fe study were higher than those of the Fe-               photosynthesis for sea-ice environments during the freezing,
replete ice tank runs after the ice melt event (Figure 5). This             ice melt and light exposure events even under chronic Fe
upregulation of NPQ could be related to the σPSII strategy                  starvation in sea ice. However, chronic Fe starvation led to
with the quite large photosynthetic antenna size. A larger                  reduced photoprotective capabilities. This may have detrimental
antenna has a longer residence time of excitons within the PSII,            consequences for ice algal production if the recent reduction in
which results in more energetic loss as NPQ (Raven, 1990;                   sea ice extent continues, although regional variabilities in the
Wientjes et al., 2013; Strzepek et al., 2019). After the light              sea ice extent are evident around Antarctica (Stammerjohn and
exposure, the NPQNSV 0 enhancement was less efficient (HL:                  Maksym, 2017; Parkinson, 2019). Our study has revealed that Fe

Frontiers in Marine Science | www.frontiersin.org                      16                                      March 2021 | Volume 8 | Article 632087
You can also read