Vitamin D and lumisterol derivatives can act on liver X receptors (LXRs) - Nature
←
→
Page content transcription
If your browser does not render page correctly, please read the page content below
www.nature.com/scientificreports
OPEN Vitamin D and lumisterol
derivatives can act on liver X
receptors (LXRs)
Andrzej T. Slominski1,2,3*, Tae‑Kang Kim1, Shariq Qayyum1, Yuwei Song1, Zorica Janjetovic1,
Allen S. W. Oak1, Radomir M. Slominski1, Chander Raman1, Joanna Stefan1,4,
Carlos A. Mier‑Aguilar1, Venkatram Atigadda1,5, David K. Crossman6, Andriy Golub7,
Yaroslav Bilokin7, Edith K. Y. Tang8, Jake Y. Chen9, Robert C. Tuckey8, Anton M. Jetten10 &
Yuhua Song11*
The interactions of derivatives of lumisterol (L3) and vitamin D3 (D3) with liver X receptors (LXRs)
were investigated. Molecular docking using crystal structures of the ligand binding domains (LBDs) of
LXRα and β revealed high docking scores for L3 and D3 hydroxymetabolites, similar to those of the
natural ligands, predicting good binding to the receptor. RNA sequencing of murine dermal fibroblasts
stimulated with D3-hydroxyderivatives revealed LXR as the second nuclear receptor pathway for
several D3-hydroxyderivatives, including 1,25(OH)2D3. This was validated by their induction of
genes downstream of LXR. L3 and D3-derivatives activated an LXR-response element (LXRE)-driven
reporter in CHO cells and human keratinocytes, and by enhanced expression of LXR target genes.
L3 and D3 derivatives showed high affinity binding to the LBD of the LXRα and β in LanthaScreen
TR-FRET LXRα and β coactivator assays. The majority of metabolites functioned as LXRα/β agonists;
however, 1,20,25(OH)3D3, 1,25(OH)2D3, 1,20(OH)2D3 and 25(OH)D3 acted as inverse agonists of
LXRα, but as agonists of LXRβ. Molecular dynamics simulations for the selected compounds, including
1,25(OH)2D3, 1,20(OH)2D3, 25(OH)D3, 20(OH)D3, 20(OH)L3 and 20,22(OH)2L3, showed different
but overlapping interactions with LXRs. Identification of D3 and L3 derivatives as ligands for LXRs
suggests a new mechanism of action for these compounds.
Vitamin D3 is a product of ultraviolet B (UVB)-induced photochemical transformation of 7-dehydrocholestrol
(7DHC), of which the intermediate, pre-vitamin D3, can also isomerize to lumisterol and t achysterol1–4. It has
pleotropic activities that, in addition to regulation of body calcium homeostasis and musculoskeletal system,
include a vast spectrum of actions including stimulation of differentiation and inhibition of proliferation of cells
of different lineages, anti-cancerogenic effects and stimulation of innate and inhibition of adaptive immunity
and inflammation, and photoprotection2,5–8. It also regulates endocrine and central nervous systems and plays
an important role in development, and regulates various skin functions in a heterogeneous m anner2,3,9,10. It
was believed that these various, sometime contradictory, activities were mainly mediated by 1,25(OH)2D3/2, a
product of the sequential hydroxylation of vitamin D3, through interaction with the nuclear vitamin D recep-
tor (VDR)7,11–14. However, the interaction of other non-vitamin D low affinity ligands such as lithocholic acid,
docosahexaenoic acid, and curcumin with the VDR have been r eported13,15. It was also assumed that lumisterol
1
Department of Dermatology, University of Alabama at Birmingham, 1670 University Blvd, Rm 476, Birmingham,
AL 35249, USA. 2Comprehensive Cancer Center, Cancer Chemoprevention Program, University of Alabama
at Birmingham, Birmingham, AL 35249, USA. 3Pathology and Laboratory Medicine Service, VA Medical
Center, Birmingham, AL 35249, USA. 4Department of Oncology, Nicolaus Copernicus University Medical
College, Romanowskiej str. 2, 85‑796 Bydgoszcz, Poland. 5Department of Chemistry, University of Alabama
at Birmingham, Birmingham, AL 35249, USA. 6Department of Genetics, Genomics Core Facility, University of
Alabama at Birmingham, Birmingham, AL 35249, USA. 7OTAVA LTD, Vaughan, ON L4K 0C3, Canada. 8School of
Molecular Sciences, The University of Western Australia, Perth, WA, Australia. 9Informatics Institute, University of
Alabama at Birmingham, Birmingham, AL 35249, USA. 10Cell Biology Section, National Institute of Environmental
Health Sciences, National Institutes of Health, Research Triangle Park, NC 27709, USA. 11Department of
Biomedical Engineering, University of Alabama at Birmingham, Shelby 803, Birmingham, AL 35249, USA. *email:
aslominski@uabmc.edu; yhsong@uab.edu
Scientific Reports | (2021) 11:8002 | https://doi.org/10.1038/s41598-021-87061-w 1
Vol.:(0123456789)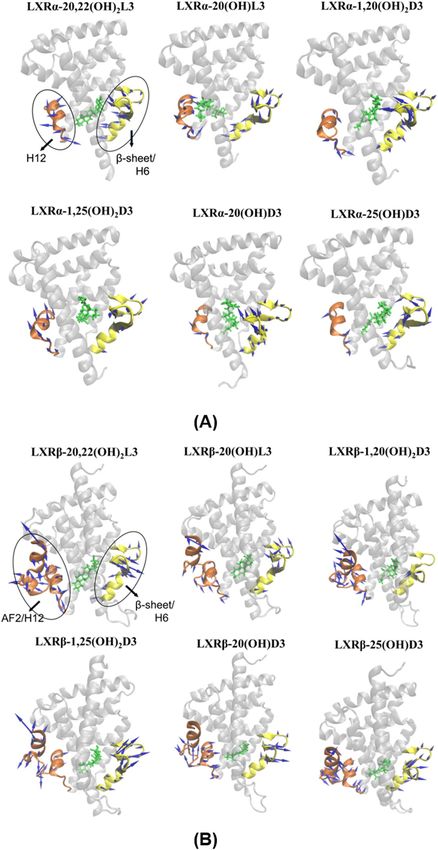
www.nature.com/scientificreports/
neither affects calcium metabolism nor has any significant biological activity, except that UVB-led phototrans-
formation of pre-D3 into lumisterol explained the lack of systemic intoxication by vitamin D 3 2.
We have challenged these dogmas by questioning whether these diverse and sometime opposite effects are
regulated by only one receptor (VDR) and one molecule (1,25(OH)2D3). This challenge is based on the discov-
ery of an alternative pathway of D3 activation by CYP11A1 with involvement of other CYPs producing at least
15 hydroxyderivatives ((OH)nD3) with 20(OH)D3 being the main product of the pathway, which is present in
human serum and the epidermis, and in a drenals16,17. CYP11A1 also produces 7-dehydropregnenolone (7DHP),
which can be modified by steroidogenic enzymes generating Δ7-steroids that upon UVB action, phototransform
to novel s ecosteroids16–19. Lastly, CYP11A1 and CYP27A1 act on lumisterol leading to production of at least 9
biologically active d erivatives20–22. Thus, new pathways generating a large number of biologically active secos-
teroids and lumisterol-derivatives have now been discovered.
The phenotypic effects of these new hydroxyvitamin D and hydroxylumisterol compounds are elicited by
their interactions with specific nuclear receptors (NRs)23,24. Recent evidence from our laboratory has shown that
CYP11A1-derived (OH)nD3, in addition of acting as biased agonists on VDR25–27, can, together with lumisterol
hydroxyderivatives, act as inverse agonists of retinoic acid-related orphan receptors (ROR) α and γ26,28 and as
agonists on the arylhydrocarbon receptor (AhR)29. This breaks the dogma that VDR serves as the only NR for
active forms of vitamin D3.
Liver X receptors (LXR) α and β are NRs for oxysterols (oxygenated derivatives of cholesterol) which after
binding of the ligand heterodimerize with the retinoid X receptor (RXR), translocate to the nucleus and activate
transcriptional activity of genes containing LXR response elements (LXREs)30–35. While being widely distributed
in the body and regulating various physiological functions, these receptors show marked tissue selectivity in
their expression levels32,36–39. Functional LXRs are expressed in the s kin40–43, the site of lumisterol and vitamin
D3 production and also a site of their metabolism5,10,24.
Guided by the information above, the similarity of chemical structures of lumisterols and 7DHC (pro-vita-
min D3) to cholesterol/oxysterols and retrospective analysis of microarray data deposited at the NCBI GEO
(GSE117351)29,44 identifying LXR/RXR as a potential NR for 1,25(OH)2D3 and 20,23(OH)2D3, we have per-
formed extensive experimental and in silico analyses to define LXRα and β as the nuclear receptors for vitamin
D3 and lumisterol derivatives.
Results and discussion
RNA sequencing (RNA‑Seq), bioinformatics and molecular analyses. Retrospective analysis of the
microarray data deposited at the NCBI GEO (GSE117351)44, identified LXR/RXR as the second nuclear recep-
tor complexes after VDR/RXR, based on ranking in the canonical (p = 0.0039) and toxicity-related (p = 0.0041)
pathways activated in primary human keratinocytes treated with 1,25(OH)2D3 for 24 h. For treatment with
20,23(OH)2D3, LXR/RXR was identified as the fourth nuclear receptor complex base on ranking in the canoni-
cal and toxicity-related pathways, p = 0.0174 and p = 0.02, respectively. LXR/RXR was also implicated in the acti-
vation of these pathways (p = 0.0085 p = 0.0089, respectively) in cells treated with 1,25(OH)2D3 for 6 h. Analysis
of the relative expression of the known LXR target gene, ABCA1, showed that 1,25(OH)2D3 and 20,23(OH)2D3
stimulated ABCA1 expression 2.4- and 2.3-fold, respectively, in immortalized human epidermal keratinocytes
(HaCaT cells) after 24 h of treatment and 2.4 and 2.8 times after 6 h treatment with 1,25(OH)2D3 (Fig. 1A,B).
The regulation of LXR targets by these secosteroids was supported by chromatin immunoprecipitation (ChIP)
analysis with chromatin isolated from HaCaT keratinocytes treated with 1,25(OH)2D3 and antibodies against
LXRα and β, which showed significant stimulation of LXRα/β binding to the LXRE within the ABCA1 promoter
region (Fig. 1C,D). In addition, qPCR analysis confirmed the stimulation of ABCA1 RNA expression in HaCaT
keratinocytes treated with 20(OH)D3 (precursor of 20,23(OH)2D3) and 1,25(OH)2D3 and its precursor 25(OH)
D3. Increased expression was also observed with CYP11A1-derived hydroxylumisterols (Fig. 1E).
RNA-Seq analysis was performed on RNA from newborn murine dermal fibroblasts cultured for 24 h in
the presence or absence of 1 0−7 M 1,25(OH)2D3, 20,23(OH)2D3, 1,20,23(OH)3D3 or a natural ligand for LXR,
20-hydroxycholesterol (20(OH)C), which served as the positive control. The raw data are deposited at the NCBI
GEO (GSE145818). The relative gene expression patterns for one time point (24 h) and one fixed concentration
of the ligand ( 10−7 M) were normalized vs vehicle (negative control) and their hierarchical clustering revealed
distinct, opposite or overlapping patterns (Fig. 2). The common up- and downregulated protein coding genes
using FC ≥ 2 are shown in the heat map (Fig. 2A) and Supplementary Table 1. A list of all genes with their raw
values is accessible at the NCBI GEO (GSE145818). The Venn diagrams (Fig. 2B,C) show that the number of
genes upregulated by either 20,23(OH)2D3, 1,20,23(OH)3D3, 1,25(OH)2D3 or 20(OH)C, using FC ≥ 2, was 437,
531, 601 and 564, respectively, while the number of genes downregulated was 540, 520, 566 and 498, respec-
tively. The number of common genes either up- or downregulated by all compounds was 40 (2.7%) and 174
(16.4%), respectively, with the corresponding number of genes affected by only the D3 derivatives tested being
61 (4.1%) and 211 (19.9%). The number of genes solely upregulated and downregulated by 20,23(OH)2D3,
1,20,23(OH)3D3, 1,25(OH)2D3 or 20(OH)C were 193 (12.8%), 256 (17%), 322 (21.4%) or 291 (19.4%) and
116 (11%), 113 (10.7%), 159 (15%) or 109 (10.3%), respectively. The number of genes up and down-regulated
by structurally related 20,23(OH)2D3, 1,20,23(OH)3D3, and 1,20,23(OH)3D3, 1,25(OH)2D3, were 131 (8.7%),
300 (28.3%) and 159 (10.6%), 285 (26.9%), respectively. The number of genes up- and down-regulated by
20,23(OH)2D3 and 1,25(OH)2D3 were 128 (8.5%) and 302 (28.5%), respectively. The number of genes up- and
down-regulated for structurally distant molecules 20,23(OH)2D3 vs 20(OH)C, 1,20,23(OH)3D3 vs 20(OH)C and
1,25(OH)2D3 vs 20(OH)C were 138 (9.2%) and 291 (27.4%), 151 (10.1%) and 286 (26.9%), and 152 (10.1%),
and 278 (26.2%), respectively. The hypergeometric test for all pairwise upregulated genes in the intersection was
significant (p < 0.05). For down-regulated genes among conditions B (20,23(OH)2D3), C (1,20,23(OH)3D3), and
Scientific Reports | (2021) 11:8002 | https://doi.org/10.1038/s41598-021-87061-w 2
Vol:.(1234567890)
www.nature.com/scientificreports/
Figure 1. 1,25(OH)2D3 and CYP11A1-derived secosteroids stimulate LXR activated ABCA1 gene expression
in HaCaT keratinocytes. Relative expression of ABCA1 gene after treatment with 1 0–7 M 1,25(OH)2D3 and
20,23(OH)2D3 for 6 (A) and 24 h (B). Values were retrieved from microarray data deposited at the NCBI
GEO (GSE117351)44. ChIP analysis performed on isolated nuclei from HaCaT keratinocytes treated with
1,25(OH)2D3 using antibody against both LXRα and β, showed significant stimulation of the LXRα/β binding to
the LXR-RE of the ABCA1 (C) but not the control gene, GADPH. Means ± SD from 3 independent experiments
(D). QPCR quantification of ABCA1 in RNA from HaCaT keratinocytes (n = 3) treated with 20(OH)D3, 25(OH)
D3, 1,25(OH)2D3, 20(OH)L3, 20,22(OH)2L3 and 24(OH)L3 (E). *p < 0.5 and **p < 0.01 by student t-test. The
experiment was repeated 3 times. The heatmap was prepared using ClustVis software (https://biit.cs.ut.ee/clust
vis/).
Scientific Reports | (2021) 11:8002 | https://doi.org/10.1038/s41598-021-87061-w 3
Vol.:(0123456789)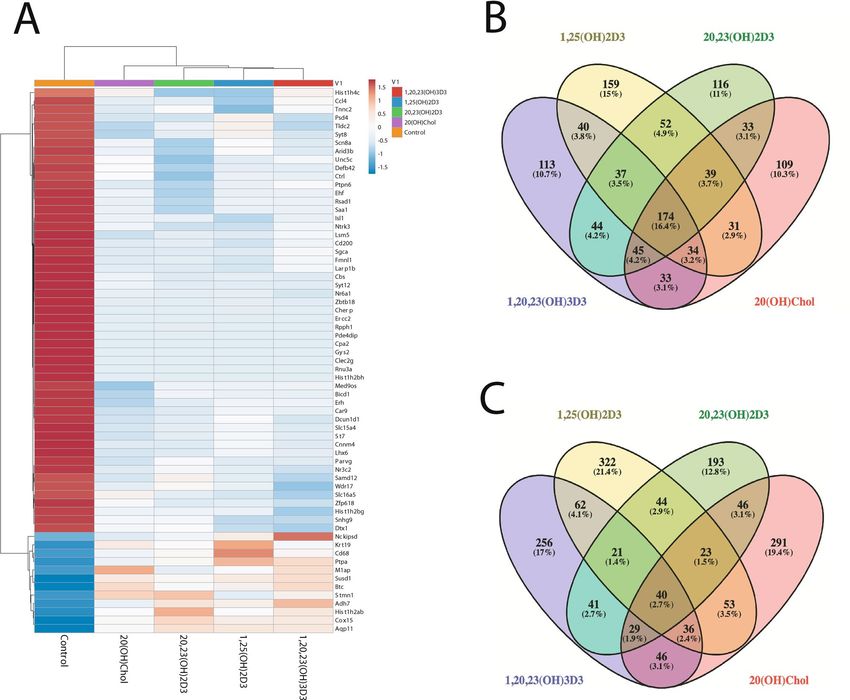
www.nature.com/scientificreports/
Figure 2. RNAseq analysis of changes in gene expression in murine dermal fibroblasts treated with 1 0–7 M
1,25(OH)2D3, 20,23(OH)2D3, 1,20,23(OH)3D3 or 20(OH)cholesterol (20(OH)C, a native LXR ligand) for
24 h. Heat map of the gene expression pattern (A) with corresponding Venn diagrams shown for down (B) or
upnregulated (C) protein coding genes for absolute fold change ≥ 2 cutoff. The Venn diagrams were prepared
using Venny version 2.1.0: https://bioinfogp.cnb.csic.es/tools/venny/index.html. The heatmap was prepared
using ClustVis: https://biit.cs.ut.ee/clustvis/.
D (20(OH)C), the non-intersection regions of the three pairwise comparisons (B+C−/B−C+, B+D−/B−D+, and
C+D−/C−D+) were found to be significant.
Ingenuity Pathway Analysis (IPA) using an absolute fold change ≥ 2 cutoff showed that after VDR/RXR, LXR/
RXR was the next top ranked nuclear receptor pathway activated by 1,25(OH)2D3 in its regulation of canonical
(p = 0.02) and toxicity-related (p = 0.022) responses (Supplementary Tables 2, 3). With respect to 20,23(OH)2D3
and 1,20,23(OH)3D3, respectively, LXR/RXR was ranked as the top nuclear receptor pathway implicated in the
induction of canonical (p = 0.013 and 0.016) and toxicity-related (p = 0.014 and 0.048) responses (Supplementary
Tables 4–7). Interestingly, estrogen-mediated S-phase entry was identified for 20,23(OH)2D3 as the top ingenuity
signaling pathway (Supplementary Table 4). Moreover, LXR/RXR was not identified as a significant target for
20(OH)C used at concentration 1 0–7 M in the canonical pathway (p = 0.30) and represented the third receptor
complex in the toxicity pathway (p = 0.31) after RAR and VDR (Supplementary Tables 8, 9).
In addition, Gene Ontology Enrichment Analysis (GO, Panther Platform) has indicated relations between
LXR and VDR signaling regulated by 20,23(OH)2D3 (one of the most active and promising, non-toxic vitamin
D3- hydroxyderivative) in mice fibroblasts (Supplementary Table 10). Similarly to IPA analysis, GO indicated
that 20,23(OH)2D3 is involved in enrichment of vitamin D response element binding- and vitamin D recep-
tor binding-gene sets, as well as influencing the expression of genes involved in the regulation of metabolic
transformations of vitamin D compounds. The main gene sets overrepresented by 20,23(OH)2D3 and involved
in regulation of the LXR/RXR pathway included low-density lipoprotein particle receptor activity, lipopro-
tein lipase activity, fatty acid synthase activity, retinoid X receptor binding, S100 protein binding, ABC-type
transmembrane transporter activity, retinoic acid-responsive element binding, low-density lipoprotein particle
Scientific Reports | (2021) 11:8002 | https://doi.org/10.1038/s41598-021-87061-w 4
Vol:.(1234567890)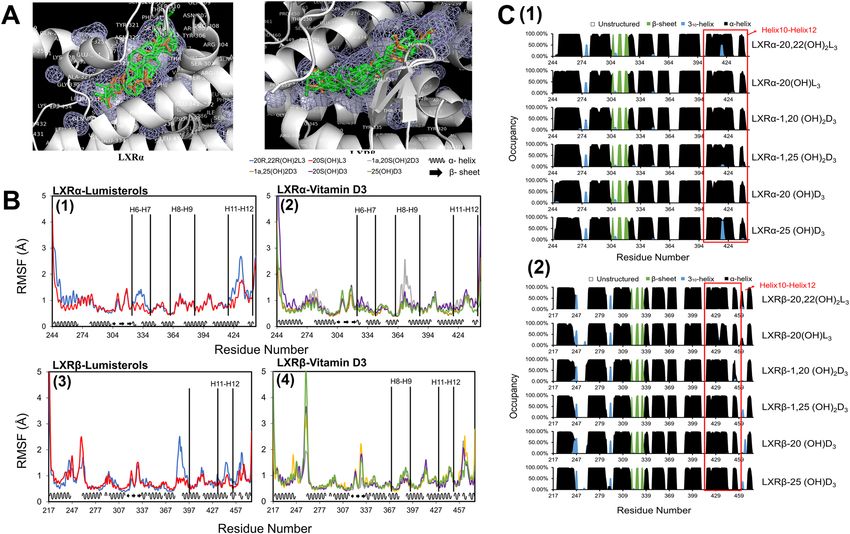
www.nature.com/scientificreports/
Figure 3. Vitamin D and lumisterol hydroxyderivatives stimulate the expression of LXR-dependent genes. (A)
QPCR analysis of changes in expression of genes downstream of LXR in murine dermal fibroblasts treated with
10–7 M 1,25(OH)2D3, 20(OH)D3, 1,20(OH)2D3, 20,23(OH)2D3, 1,20,23(OH)3D3, 20(OH)7DHC, 20(OH)L3
or 20(OH)C, or ethanol (control) for 24 h. (B) Stimulation of LXR-dependent gene expression in the brain of
SKH-1 (B) or Ptch+/−/SKH-1 (C) mice (n = 3 per group) treated with 20 µg/kg of 20(OH)D3, respectively, for
6 h. Data are presented as means ± SD, n = 3. Statistical analysis was done using the t-test: *p < 0.05, **p < 0.01,
***p < 0.001 or ****p < 0.0001 versus control (ethanol).
binding, high-density lipoprotein particle receptor activity, high-density lipoprotein particle binding, oxidized
low-density lipoprotein particle receptor activity, oxysterol binding, cholesterol transfer activity, apolipoprotein
A-I binding, peroxisome proliferator activated receptor binding, interleukin-1 type II receptor antagonist activ-
ity, hydroxymethylglutaryl-CoA synthase activity, hydroxymethylglutaryl-CoA reductase (NADPH) activity,
fatty-acyl-CoA binding, apolipoprotein receptor activity, very-low-density lipoprotein particle receptor activity,
farnesyl-diphosphate farnesyltransferase activity, chylomicron binding, bile acid receptor activity, nitric-oxide
synthase regulator activity, cholesterol binding, sterol response element binding, nitric-oxide synthase binding
and acetyl-CoA binding (Supplementary Table 10).
Since RNA-Seq analysis identified LXR as a possible target for D3-hydroxyderivatives, we compared the effects
of several D3-hydroxyderivatives (1,25(OH)2D3, 20(OH)D3, 20,23(OH)2D3, 1,20(OH)2D3, 1,20,23(OH)3D3) and
a representative hydroxylumisterol (20(OH)L3) on the expression of genes downstream of LXR32,36 with those of
20(OH)C and its precursor 20(OH)7DHC, both natural ligands of LXR that serve as positive controls (Fig. 3A).
These analyses showed that all compounds, except for 1,20(OH)2D3, stimulated Abca1 expression in murine
dermal fibroblasts, whereas 20(OH)L3 inhibited its expression. All D3-hydroxyderivatives, but not 20(OH)C or
20(OH)L3, enhanced the expression of Abcg1 and Abcg5, while 20(OH)7DHC stimulated only Abcg5. The expres-
sion of Abcg8 was induced only by 20,23(OH)2D3 and was inhibited by 20(OH)C, 20(OH)7DHC and 20(OH)
L3. Most of the compounds stimulated Lpl (lipoprotein lipase) expression except for 20(OH)L3, which inhibited
it. 1,25(OH)2D3, 20(OH)D3, 1,20,23(OH)3D3 and 20(OH)7DHC stimulated the expression of Fas (fatty acid
synthase). 1,25(OH)2D3 and 20(OH)D3 stimulated Cyp7a1 (cytochrome P450 isoform 7A1) expression, but was
inhibited by 1,20(OH)2D3, 1,20,23(OH)3D3, 20(OH)C, 20(OH)7DHC and 20(OH)L3. ApoE (apolipoprotein E)
expression was enhanced by 20,23(OH)2D3 and 1,20(OH)2D3, but inhibited by 20(OH)C, 20(OH)7DHC, and
20(OH)L3. Importantly, subcutaneous injection of 20(OH)D3 (20 µg/kg) stimulated expression of Lpl, Abca1,
ApoE and Cyp7a1 in brains of SKH-1-M mice (Fig. 3B), while 20(OH)D3 at 10 µg/kg stimulated expression of
Abca1, Abcg1, Abcg5, ApoE, Fas and Cyp7a1 in brains of SKH-1-M mice (Fig. 3C).
Molecular docking studies of a series of ligands potentially targeting LXRα and LXRβ based
on LXR crystal structures. 7DHC and lumisterol (L3) derivatives have very similar structures to those of
Scientific Reports | (2021) 11:8002 | https://doi.org/10.1038/s41598-021-87061-w 5
Vol.:(0123456789)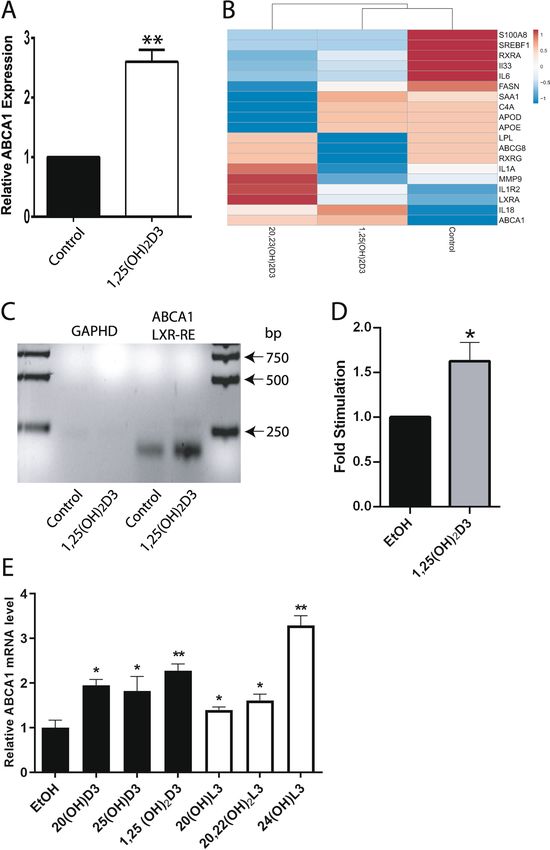
www.nature.com/scientificreports/
oxysterols10,31. Tachysterol (T3) and L3 are photoderivatives of pre-D3 formed after extended exposure to UVB4.
To obtain insights into the nature of ligand–LXR interaction, two LXRα (PDBID 5AVI, 3IPQ) and three LXRβ
(PDBID 5HJP, 1PQC, 1UPV) structures with the most diverse conformations were selected for the docking
studies (Supplementary Fig. S1) to predict the binding poses of 84 D3 and L3 hydroxyderivatives with LXRα and
LXRβ (Supplementary Tables 11–15). Docking scores were determined to evaluate the potential binding of each
tested compound with LXRα and LXRβ (Supplementary Table 16).
To test the reliability of our docking studies, we re-docked the co-crystalized ligands with LXRα and LXRβ.
All the corresponding ligand pairs (docked VS co-crystalized) displayed root mean square deviation (RMSD)
in the range 0.5 Å–0.7 Å (acceptable values are ≤ 2.0 Å), which demonstrated that the docking reproduced the
co-crystalized (experimental) ligand poses with high precision (Supplementary Fig. S2).
Overall, all 84 compounds were predicted to bind tightly to the LXRs due to significant hydrophobic inter-
actions and intermolecular hydrogen bond formation. Due to the hydrophobic nature and similar size of the
compounds tested, they all fit well into the hydrophobic cavity of the binding site (Supplementary Figs. S3 and
S4). In addition to the strong hydrophobic interactions in the central region of the ligand binding domain (LBD),
two hydrogen bonding regions on both ends of the LBP contribute to the binding stability of the ligand–LXR
complex. Detailed information about the hydrogen bonds and hydrophobic interaction for all 84 ligands is shown
in Supplementary Tables 11–15. 3-D representations for the example ligands occupying the hydrophobic cavity of
the LXRα LBD (PDBID 5AVI, 3IPQ) and LXRβ LBD (PDBID 5HJP, 1UPV) are shown in Supplementary Figs. S5,
S6, S7 and S8 of the Supplementary file. Although all these compounds can bind to the LBD of LXRs, different
ligands could have different binding affinities with LXRs and induce different conformational and dynamical
motion changes of LXRs to have different effects on gene expression. This is supported by detailed structural,
conformation and dynamical motion analyses shown in “Materials and methods”. Binding thermodynamics
analyses in “Materials and methods” further supports ligand binding specificity with LXRs.
Glide XP docking scores of top ranking poses for the tested ligands for each LXR conformation (Supplemen-
tary Table 16) show that novel secosteroidal, 7DHC, L3 and T3 derivatives with a full-length or short side chain
have similar docking scores to the natural ligands, 20(OH)C and 22(OH)C (positive controls), for LXRs. Since
T3 compounds are unstable4, and undergo oxidative modification and 7DHC is reduced to cholesterol by the
action of Δ7reductase, we focused our subsequent studies on D3 and L3 hydroxyderivatives.
Functional studies. Activation of transcriptional functions of LXRα and LXRβ. Using the luciferase re-
porter gene containing the LXR-response element (LXRE), we measured the induction of transcriptional activ-
ity in CHO cells and HaCaT keratinocytes by a series of vitamin D3 and L3 compounds (Fig. 4). Figure 4A,B
showed a dose-dependent activation of luciferases activity by hydroxyderivatives of D3 and L3, as well as their
precursors, with EC50 values ranging from 10–7 to 10–10 M. Figure 4C showed the stimulation of luciferase activ-
ity in CHO and HaCaT cells with L3- and D3-derivatives at a concentration of 1 0–7 M. While all compounds test-
ed stimulated the transcriptional activity, 1,25(OH)2D3, 1,20,23(OH)3D3, 1,20,24(OH)3D3 and 1,20,25(OH)3D3
showed the strongest stimulatory effects among the D3 derivatives. 17,20(OH)2pD, which has a 2C-side chain,
displayed the weakest stimulant in CHO cells. These results are in agreement with higher docking scores for the
former compounds in comparison to the short side chain derivatives (Supplementary Table 16). L3-hydroxy-
derivatives showed stronger stimulatory activity in HaCaT cells than in CHO cells, which indicated a degree of
cell type specificity.
Ligand binding in LanthaScreen TR‑FRET LXRα and β coactivator assays. Figure 5 shows dose dependent bind-
ing of L3 and D3 derivatives to the LBD of the LXRα and β. While the majority of metabolites including 20(OH)
D3, 25(OH)D3, 20,23(OH)2D3, D3, 20(OH)L3, 22(OH)L3, 24(OH)L3, 20,22(OH)2L3, 25(OH)L3, (25R)27(OH)
L3, (25S)27(OH)L3 and L3 acted as LXRα agonists with EC50 values ranging from 10–8 to 1 0−6 M, 17,20(OH)2pD
displayed an EC50 of only 3 × 10⁻⁵ M. 1,20,25(OH)3D3, 1,25(OH)2D3, 1,20(OH)2D3 and 25(OH)D3 acted as
inverse agonists of LXRα with IC50 values around 10–6 M. Notably, all compounds acted as agonists of LXRβ
with EC50 values ranging from 10–9–10–5 M. The average EC50 and I C50 values are shown in Table 1.
Ligand induced translocation of LXRα/β to the nucleus. To study ligand-induced translocation of LXRα to the
nucleus, HaCaT keratinocytes were treated with 1 0−7 M 25(OH)D3, 1,25(OH)2D3, 20(OH)D3, 1,20(OH)2D3,
20(OH)L3 or 20,22(OH)2L3 or ethanol (vehicle control) for 24 h, and translocation was calculated based on the
immunofluorescence stain using anti-LXRα antibodies. As shown in Fig. 6A, all compounds induced transloca-
tion of LXRα to the nucleus. As an independent approach, HaCaT keratinocytes were exposed to 20(OH)D3,
1,20(OH)2D3, 25(OH)D3, 1,25(OH)2D3, 20(OH)L3, 20,22(OH)2L3, 20,23(OH)2L3 or 1,20,23(OH)3D3 for 12 h,
harvested, fixed and incubated with polyclonal antibodies against both LXRα and β or antibodies against VDR
along Hoechst dye and analyzed by imaging flow cytometry ImageStream II. Figure 6B,C showed increased
translocation of LXRα/β and VDR (which serves as a positive control for secosteroids) from the cytoplasm to
the nucleus following ligands treatment.
Investigation of LXRα and LXRβ dynamic interactions with the selected D3 and L3 derivatives
using MD simulations and binding free energy analyses. The interactions of D3 hydroxyderivatives
with LXR ligand binding domain (LBD) could affect secondary structure, conformation and dynamical motion
changes of functionally relevant regions of LXR, further affecting LXR/RXR induced cellular activities. We per-
formed molecular dynamics simulations to provide further insight from conformation, dynamical motion and
electrostatic potential perspectives to better understand the activation mechanism of LXRs by D3 and L3 deriva-
Scientific Reports | (2021) 11:8002 | https://doi.org/10.1038/s41598-021-87061-w 6
Vol:.(1234567890)www.nature.com/scientificreports/
Figure 4. L3 and D3-derivatives activate a LXR-response element (LXRE)-driven reporter in CHO cells
(A,C) and human HaCaT keratinocytes (B,D). Representative dose response curves are in (A) and (B), while a
summary of assays performed with 10–7 M ligands is presented for each experiment separately for CHO cells
(C) and HaCaT keratinocytes (D). Data are presented as means ± SE, (n = number of assays). Analysis was done
using one-way ANOVA for dose responses and the t-test: *p < 0.05, **p < 0.01, ***p < 0.001 or ****p < 0.0001
versus control (ethanol).
Scientific Reports | (2021) 11:8002 | https://doi.org/10.1038/s41598-021-87061-w 7
Vol.:(0123456789)www.nature.com/scientificreports/
Figure 5. Binding of L3 and D3 derivatives to the LBD of the LXRα (A) and β (B) in LanthaScreen TR-FRET
LXRα and β coactivator assays. (A) and (B): representative binding curves with values presented as means ± SE,
(n = 4). Analysis was done using one-way ANOVA with significance defined as *p < 0.05, **p < 0.01, ***p < 0.001
or ****p < 0.0001.
Scientific Reports | (2021) 11:8002 | https://doi.org/10.1038/s41598-021-87061-w 8
Vol:.(1234567890)www.nature.com/scientificreports/
LXRα LXRβ
Compounds EC50 (M) IC50 (M) EC50 (M)
20(OH)D3 1.5 × 1 0–8 ± 7.1 × 10⁻¹⁰ (n = 2) N/A 2.6 × 1 0–6 ± 2.7 × 10⁻⁶ (n = 2)
–8 –8
25(OH)D3 1.1 × 1 0 ± 1.1 × 10 (n = 2) N/A 3.8 × 1 0–6 ± 1.7 × 10⁻⁶ (n = 2)
–6 –6
20,23(OH)2D3 1.1 × 1 0 ± 1.5 × 10 (n = 2) N/A 2.6 × 1 0–5 ± 3.4 × 10⁻⁵ (n = 2)
–7 –7
20,25(OH)2D3 3.5 × 1 0 ± 5.5 × 10 (n = 3) N/A 2.1 × 1 0–6
–6
D3 derivative 1,20,23(OH)3D3 N/A 2.1 × 1 0 1.6 × 1 0–6
–6 –8
1,20,25(OH)3D3 N/A 2.3 × 1 0 ± 7.1 × 10 (n = 2) 3.8 × 1 0–9
1,20(OH)2D3 N/A 3.5 × 1 0–6 ± 3.1 × 10⁻⁶ (n = 2) 2.7 × 1 0–7 ± 2.0 × 10⁻⁷ (n = 2)
1,25(OH)2D3 N/A 1.1 × 1 0–6 ± 1.3 × 10⁻⁶ (n = 2) 1.4 × 1 0–5 ± 1.8 × 10⁻⁵ (n = 2)
D3 7.6 × 1 0–7 ± 1.0 × 10⁻⁶ (n = 2) N/A 8.9 × 1 0–7 ± 3.0 × 10⁻⁷ (n = 2)
20(OH)L3 1.8 × 1 0–6 ± 2.5 × 10⁻⁶ (n = 2) N/A 2.1 × 1 0–8 ± 2.4 × 10⁻⁸ (n = 2)
22(OH)L3 6.4 × 1 0–7 ± 7.6 × 10⁻⁷ (n = 3) N/A 1.4 × 1 0–5 ± 1.7 × 10⁻⁵ (n = 2)
24(OH)L3 3.6 × 1 0–6 ± 8.5 × 10⁻⁷ (n = 2) N/A 1.3 × 1 0–6 ± 7.1 × 10⁻⁷ (n = 2)
–6 –6
20,22(OH)2L3 1.5 × 1 0 ± 1.4 × 10 (n = 2) N/A 2.0 × 1 0–6 ± 4.2 × 10⁻⁷ (n = 2)
L3 derivative –7 –7
25(OH)L3 1.4 × 1 0 ± 2.3 × 10 (n = 3) N/A 1.9 × 1 0–6
–7 –6
(25R)-27(OH)L3 8.2 × 1 0 ± 1.2 × 10 (n = 3) N/A 5.5 × 1 0–7
–8 –8
(25S)-27(OH)L3 2.6 × 1 0 ± 2.0 × 10 (n = 3) N/A 1.3 × 1 0–9
–7 –8
L3 2.5 × 1 0 ± 9.9 × 10 (n = 2) N/A 1.1 × 1 0–7
–5 –5
pD derivative 17,20(OH)2pD 3.0 × 1 0 ± 3.9 × 10 (n = 2) N/A 2.6 × 1 0–6 ± 7.1 × 10⁻⁷ (n = 2)
Table 1. Characteristics of binding of L3 and D3 derivatives to the LBD of LXRα and β.
tives. We also performed binding thermodynamics analyses based on MD simulation trajectories to demonstrate
binding specificity of D3 and L3 derivatives with LXRs.
Identification of LXRα and LXRβ crystal structures in complex with the selected four D3 and two L3 derivatives
for MD simulations, ligand force field and MD simulation equilibration. We selected 25(OH)D3, 1,25(OH)2D3,
20(OH)D3 and 1,20(OH)2D3 for the further studies, because the first two are the products of canonical path-
way of D3 a ctivation2, while 20(OH)D3 is the main product of CYP11A1 action on D 316,19,45 and 1,20(OH)2D3
46
represents a product of CYP27B1 hydroxylation, similar to 1,25(OH)2D3 . We also included 20(OH)L3 in these
detailed analysis, because of its hydroxyl group at C20, and 20,22(OH)2L3 as representatives of a dihydroxy-
lumisterol20,47.
The comparison of the alignment parameters of the four D3 and two L3 ligands selected with co-crystalized
ligands of LXRα (PDBID 5AVI, 3IPQ) and LXRβ (PDBID 5HJP, 1UPV) and the binding energy of the selected
ligands with LXRα and LXRβ receptor are shown in Supplementary Tables 17 and 18. Based on alignment param-
eters and docking score, crystal structures of LXR α (PDBID 5AVI) and LXR β (PDBID 5HJP) were chosen as
receptors for the selected four D3 and two L3 compounds for the further investigations. Molecules of interest
and the identified LXRα and LXRβ crystal structures are listed in Table 2. Docked poses for the selected D3
and L3 derivatives and co-crystallized ligands in ligand binding domain (LBD) of LXRα and LXRβ are shown
as Fig. 7A. They aligned well with the co-crystallized ligand and share the same ligand binding pocket, further
predicting ligand binding specificity with LXRs.
Ligand force field and charge parameters (Supplementary Fig. S9–S14 and Supplementary Tables 19–24) and
equilibration of MD simulations systems (Supplementary Fig. S15–S18) are detailed in the supplemental file. The
equilibrated last 150 ns of MD simulation trajectories were used for the analyses of the binding thermodynamics
of LXRα and LXRβ with the selected D3 and L3 derivatives, and the conformation and motion characteristics
of LXRs binding with these ligands.
Binding thermodynamics analysis. Using the equilibrated last 150 ns MD simulations trajectories, we calculated
the binding free energy and binding energy components of LXRα and LXRβ with the selected four D3 deriva-
tives and two L3 derivatives (Table 3). Table 3 showed that the binding free energy of LXRα with the studied
ligand: 20,22(OH)2L3, 20(OH)L3, 1,20 (OH)2D3, 1,25(OH)2D3, 20(OH)D3, or 25(OH)D3 was − 20.14 ± 4.40,
− 19.94 ± 5.91, − 21.91 ± 4.65, − 18.15 ± 9.06, − 22.92 ± 4.09, or − 16.13 ± 4.50 kcal/mol, respectively. Table 4
showed that the binding free energy of LXRβ with the studied ligand: 20,22(OH)2L3, 20(OH)L3, 1,20 (OH)2D3,
1,25(OH)2D3, 20(OH)D3, or 25(OH)D3 is − 28.19 ± 3.88, − 20.87 ± 3.07, − 23.69 ± 4.30, − 27.08 ± 3.52,
− 22.62 ± 6.40, or − 22.75 ± 6.22 kcal/mol, respectively. Thus, all the ligands were predicted to have favorable
binding with both LXRα and LXRβ, which is consistent with the experimental binding assays (Table 1, Fig. 5).
Although these ligands display favorable binding with LXRα and LXRβ, different binding energy components
such as van der Waals energy, electrostatics energy and polar solvation energy were observed between different
ligand in complex with LXRα and LXRβ. Different chemical structure and atomic charge parameters for the four
D3 and two L3 derivatives studied (Supplementary Fig. S9–S14 and Supplementary Tables 19–24) could directly
affect the interactions of each ligand with the ligand binding pocket of LXRα and LXRβ as shown in Fig. 7A.
Scientific Reports | (2021) 11:8002 | https://doi.org/10.1038/s41598-021-87061-w 9
Vol.:(0123456789)www.nature.com/scientificreports/
Figure 6. Ligand induced translocation of LXR to the nucleus. (A) Colocalization analysis of LXRα and ▸
PI (nuclear counterstain) in HaCaT cells treated with 10–7 M of 25(OH)D3, 1,25(OH)2D3, 20(OH)D3,
1,20(OH)2D3, 20(OH)L3 or 20,22(OH)2L3 or ethanol (control) for 24 h. Manders’ coefficient (0–1) (right
panel) was significantly higher for cells treated with D3 and L3-hydroxyderivatives than cells treated with
vehicle only. Data are presented as means ± SD, (n = 2). (B) Imaging flow cytometry analysis of HaCaT cells
treated with ethanol or 1 0–7 M 20(OH)D3, 1,20(OH)2D3, 25(OH)D3, 1,25(OH)2D3, 20(OH)L3, 20,22(OH)2L3,
20,23(OH)2L3 or 1,20,23(OH)3D3 for 12 h. Fixed cells were stained with Hoechst and immunostained with
antibodies against VDRR. Ratios of nuclear (co-localization with Hoechst) vs cytoplasmic localization of
VDR were determined following analysis of 515 to 2339 individual cells. (C) Imaging cytometry images of
individual HaCaT cells showing LXR localization in cytoplasm or nucleus following treatment with ethanol,
20,22(OH)2L3 or 1,20,23(OH)3D3. Bar graphs represent quantitative analysis of images acquired by imaging
cytometry. HaCaT cells treated with ethanol or 10–7 M 20(OH)D3, 1,20(OH)2D3, 25(OH)D3, 1,25(OH)2D3,
20(OH)L3, 20,22(OH)2L3, 20,23(OH)2L3 or 1,20,23(OH)3D3 for 12 h were fixed, permeabilized cells and
immunostained with Hoechst and antibodies against LXR. Ratios of nuclear vs cytoplasmic localization of
LXR were determined following analysis of 515–2339 individual cells. The data in bar graphs (A–C) show
significant differences between ligand -treated and control (ethanol treated) cells. Analysis was done using t-test:
**p < 0.01, ***p < 0.001 or ****p < 0.0001 versus control (ethanol). For part A the slides were examined using a
KEYENCE America BZ-X710 Fluorescence Microscope (Itasca, IL) and captured using KEYENCR BZ-X viewer
(version 1.3.0.5, https://www.keyence.com/products/microscope/fluorescence-microscope/bz-x700/index_
pr.jsp). The images were subsequently analyzed using the JACoP plugin (version 2.1.1, https://imagejdocu.
tudor.lu/doku.php?id=plugin:analysis:jacop_2.0:just_another_colocalization_plugin:start) for colocalization
analysis1 with ImageJ (version 1.52a, http://imageJ.nih.gov/ij). For part C, images were captured using an Amnis
ImageStreamX Mk II Imaging Flow Cytometer (Luminex Corporation) and IDEAS software version 6.2.
These different interactions could result in the varied hydrogen bond formation, van der Waals interactions and
electrostatic interactions, further contributing to the observed different energy components for binding free
energy between different ligand-LXR complexes, contributing to the observed differences in binding affinity
seen experimentally (Table 1 and Fig. 5) and supporting ligand binding specificity with LXRs.
Effects of the selected D3 and L3 derivative on conformation, secondary structure, dynamical motion and electro‑
static potential of LXRα and LXRβ. Hydrogen bond analyses. While the ligand binding pocket for LXRα
and LXRβ is hydrophobic, there are polar or charged residues at the two ends of the c avity48. Table 5 shows a
hydrogen bond occupancy of no less than 40% between LXRα and D3 or L3 derivatives. More than 80% hydro-
gen bond occupancy was predicted between 20,22(OH)2L3 and THR302 of LXRα. Table 6 shows the hydrogen
bond occupancy of no less than 40% between LXRβ and D3 or L3 derivatives. For LXRβ-ligand complexes, more
than 80% hydrogen bond occupancy was predicted between 1,20(OH)2D3 and SER278, between 1,20(OH)2D3
and HID435, between 1,25(OH)2D3 and HID435, between 20 (OH)D3 and SER278, between 20 (OH)D3 and
HID435, between 25 (OH)D3 and HID435, between 20,22(OH)2L3 and THR316, and between 20,22(OH)2L3
and GLN438. Hydrogen bond occupancy of more than 10% between D3 or L3 derivatives and LXRα and LXRβ
are shown in Supplementary Tables 25 and 26. The results showed that during the dynamic interactions pro-
cedure, in addition to the residues shown in Tables 5, 6, additional residues in LBD of LXRα and LXRβ were
involved in forming hydrogen bond with D3 or L3 derivatives although the percentage of times that hydrogen
bond exist over the equilibrated MD simulation trajectories was less than 40%. Supplementary Figs. S19 and S20
showed the 2D interaction map of D3 and L3 derivatives with ligand binding region of LXRα and LXRβ for the
representative complex structure from the clustering analysis of the equilibrated MD simulation trajectories.
The dbscan (density-based spatial clustering of applications with noise) program49 in Amber 14 was used for
the clustering analyses of the equilibrated MD simulation trajectories, and the medoid structure in the largest
cluster was chosen as representative structure. The different molecular structure of D3 or L3 derivatives leads
to the different binding position and posture in the LXRα and LXRβ binding pocket, which results in different
hydrophobic contacts and hydrogen bond occupancy. Thus, while the D3 and L3 derivatives studied were all
shown to bind to LXRα and LXRβ (Tables 1 and 3, Fig. 5), the residues in LXRs involved with hydrogen bond
formations with the ligands are predicted to be different, contributing to the observed different binding energy
component, including electrostatic potential (Table 3). This provides a molecular basis to interpret the experi-
mentally observed different binding characteristics of LXRs with D3 and L3 derivatives (Table 1, Fig. 5) and
support ligand binding specificity with LXRs.
Conformation and secondary structure analyses. The ligand-binding domain of LXRα and LXRβ is a three lay-
ered α-helical sandwich which includes two β-sheets (S1 and S2) and 12 helices (h1–h12)48,50–52. Activation func-
tion-2 (AF-2), in which helix 12 is key, is a ligand-dependent C-terminal sequence that controls LXRα and LXRβ
transcriptional activity in response to ligand binding48,50–53. Conformational fluctuation and secondary structure
changes of LXRα and LXRβ by interactions with D3 and L3 derivatives could directly affect the size and shape
of the binding pocket and conformation of AF-2 region. This could further affect the binding affinity of D3 and
L3 derivatives with LXRα and LXRβ as observed in Tables 1, 3 and Fig. 5, influence LXRα and LXRβ functions
such as LXRs binding with coactivator for their transcriptional activity affecting gene expression (Figs. 1, 2, 3, 4).
The root mean squared fluctuation (RMSF) analysis examined the conformation stability of LXRα and LXRβ
binding to different D3 and L3 derivatives (Fig. 7B). Overall, RMSF of α-helices in LXR receptors are more
stable than β-sheet and the unstructured parts of LXR receptors in the complex with D3 and L3 derivatives.
Scientific Reports | (2021) 11:8002 | https://doi.org/10.1038/s41598-021-87061-w 10
Vol:.(1234567890)www.nature.com/scientificreports/
Scientific Reports | (2021) 11:8002 | https://doi.org/10.1038/s41598-021-87061-w 11
Vol.:(0123456789)www.nature.com/scientificreports/
Compound Compound structure Receptor chosen Docking score
LXRα (5AVI) − 11.63
1α,20S(OH)2D3
LXRβ (5HJP) − 12.144
LXRα (5AVI) − 11.466
1α,25(OH)2D3
LXRβ (5HJP) − 11.226
Vitamin D3
LXRα (5AVI) − 10.918
20S(OH)D3
LXRβ (5HJP) − 12.017
LXRα (5AVI) − 10.936
25(OH)D3
LXRβ (5HJP) − 11.705
LXRα (5AVI) − 11.366
20R,22R(OH)2L3
LXRβ (5HJP) − 13.028
Lumisterol
LXRα (5AVI) − 9.825
20S(OH)L3
LXRβ (5HJP) − 10.632
Table 2. The selected compounds and the identified crystal structures of LXRα (LBD) (PDBID 5AVI) and
LXRβ (LBD) (PDBID 5HJP) for the MD studies and Glide XP docking scores for the ligands with receptors.
Conformational stability differences for LXRα and LXRβ were observed with the interactions with the differ-
ent D3 and L3 derivatives. The overall structure of helices in the LBD of LXRα and LXRβ with the interactions
with D3 and L3 derivatives was stable. Different degrees of variation in RMSFs for the residues between helices,
including the AF-2 region, could directly affect binding affinity of LXRs with D3 and L3 derivatives (Tables 1 and
3, Fig. 5) and the motion of LXRs, further influencing its binding to coactivators for its functions and affecting
gene expression (Figs. 1, 2, 3, 4).
Analysis of secondary structure by the Define Secondary Structure of Proteins (DSSP) a lgorithm54 predicted
that there are not significant differences in α-helix, 310-helix and β-strand secondary structure of LXRα and
LXRβ between the different D3 and L3 derivatives, and the LBD of both LXRα and LXRβ is mainly formed by
α-helices (Fig. 7C). The stable secondary structures are supported by the observation that there is no significant
conformational fluctuation difference for α-helix and β-sheet in LXRα and LXRβ bound with different D3 and
L3 derivatives (Fig. 7B). Small variations in α-helix occupancy between helices 10–12 for both LXRα and LXRβ
when bound with different ligand were observed (Fig. 7C). The position of helix 12 plays a key role in the control
of LXR transcriptional activity by determining the recruitment of either coactivators or c orepressors48,50–53. The
small secondary structure difference between helices 10 and 12 for LXRα and LXRβ bound with different D3 and
L3 derivatives might affect this binding with coactivators as experimentally observed (Fig. 4).
Dynamical motion analyses. Since LXRβ has a flexible ligand-binding pocket that can accommodate structur-
ally different ligands48, we performed principal component (PCA) analysis for the LBD of LXRs to calculate the
distribution of the relative contribution of the first fifty PCA modes of the LXRα (Supplementary Fig. S21) and
LXRβ (Supplementary Fig. S22) in the complexes of LXRs with D3 or L3 derivatives. Results showed that the
Scientific Reports | (2021) 11:8002 | https://doi.org/10.1038/s41598-021-87061-w 12
Vol:.(1234567890)www.nature.com/scientificreports/
Figure 7. (A) Binding modes for the selected four D3 derivatives (1,20(OH)2D3, 1,25(OH)2D3, 20(OH)D3, and
25(OH)D3) and two L3 derivatives (20,22(OH)2L3, 20(OH)L3) and co-crystalized ligands in the ligand binding
domain (LBD) of LXRα (PDBID:5AVI) and LXRβ (PDBID:5HJP). Docked poses of the studied ligands are
shown in green and the co-crystallized ligands in LXRα and in LXRβ are shown in light brown. The mesh areas
shown in the figure are hydrophobic binding regions in LXRs. (B,C) are based on last 150 ns of the equilibrated
MD trajectories (B) Different L3 and D3 derivatives resulted in varied degrees of conformational fluctuation
for the residues between helices in the LBDs of LXRα and LXRβ. (C) Different L3 and D3 derivatives could
result in the small secondary structure changes of helix 10 to helix 12 for both LDB of LXRα and LXRβ. Image
for (A) is made with PyMOL (v2.4.0, https://pymol.org/2/)99 based on our molecular docking results. Image for
(B) is made with Microsoft Excel (v2019, https://office.microsoft.com/excel)100 based on the root mean square
fluctuation (RMSF) analysis of our molecular dynamics simulation trajectories. Image for (C) is made with
Microsoft Excel (v2019, https://office.microsoft.com/excel)100 based on the secondary structural analysis of our
molecular dynamics simulation trajectories.
LXRα- LXRα-1,20 LXRα-1,25 LXRα-20 (OH) LXRα-25 (OH)
20,22(OH)2L3 LXRα-20(OH)L3 (OH)2D3 (OH)2D3 D3 D3
ΔEvdW − 12.70 ± 3.11 − 13.32 ± 1.96 − 19.63 ± 3.82 − 11.72 ± 5.40 − 5.94 ± 0.31 − 11.27 ± 1.53
ΔEelectrostatic − 57.64 ± 1.49 − 46.15 ± 6.23 − 61.81 ± 3.01 − 56.35 ± 5.17 − 61.67 ± 2.99 − 56.62 ± 2.35
ΔGnonpolar-solvation − 6.64 ± 0.11 − 5.26 ± 0.59 − 6.86 ± 0.13 − 6.92 ± 0.09 − 6.89 ± 0.11 − 6.87 ± 0.04
ΔGpolar-solvation 33.86 ± 2.84 26.63 ± 3.62 43.55 ± 3.85 35.15 ± 4.37 28.09 ± 0.29 33.60 ± 4.02
ΔTS − 22.50 ± 6.53 − 18.17 ± 8.13 − 22.96 ± 5.88 − 22.35 ± 6.61 − 23.56 ± 6.49 − 24.67 ± 7.24
ΔGbinding − 20.14 ± 4.40 − 19.94 ± 5.91 − 21.91 ± 4.65 − 18.15 ± 9.06 − 22.92 ± 4.09 − 16.13 ± 4.50
Table 3. Binding free energy between LXRα and D3 or L3 derivatives (Kcal/mol).
first fifty PCA modes covered almost 100% of the motion modes of LXRs, the first three PCA modes contributed
significantly more to the dynamical motions of LXRs compared to other PCA modes, and the first PCA mode
represented the largest motion direction of the LBD of LXRs over the equilibrated MD simulations. The ligand-
binding pocket of LXRs extends from helix 12 to the β-sheet lying between helices H6 and H 748 and helix 12 is
the key helix for the AF-2 region to bind coactivators required for LXR transcriptional a ctivity48,50–53. We gener-
ated porcupine plots to show the principal dynamic motions of the helix 12/AF-2 region relative to the β-sheet/
helix 6 in the ligand-binding pocket of LXRα and LXRβ by binding with different D3 and L3 derivatives. This
includes the first mode of dynamical motion (Fig. 8) and the second and the third modes of dynamical motion
(Supplementary Fig. S23). The porcupine arrows in Fig. 8 and Supplementary Fig. S23 represent the motion
Scientific Reports | (2021) 11:8002 | https://doi.org/10.1038/s41598-021-87061-w 13
Vol.:(0123456789)www.nature.com/scientificreports/
LXRβ- LXRβ-1,20 LXRβ-1,25 LXRβ-20 (OH) LXRβ-25 (OH)
20,22(OH)2L3 LXRβ-20(OH)L3 (OH)2D3 (OH)2D3 D3 D3
ΔEvdW − 18.34 ± 3.12 − 8.60 ± 3.78 − 21.50 ± 3.24 − 30.11 ± 2.67 − 16.43 ± 2.93 − 16.68 ± 1.05
ΔEelectrostatic − 58.95 ± 3.19 − 59.51 ± 2.73 − 64.54 ± 2.88 − 62.98 ± 3.11 − 61.06 ± 2.82 − 62.22 ± 2.91
ΔGnonpolar-solvation − 6.59 ± 0.11 − 6.66 ± 0.11 − 6.79 ± 0.04 − 7.04 ± 0.12 − 6.99 ± 0.11 − 6.98 ± 0.10
ΔGpolar-solvation 33.08 ± 2.00 31.03 ± 1.33 44.79 ± 2.52 49.50 ± 2.63 37.76 ± 0.38 39.35 ± 1.18
ΔTS − 22.70 ± 5.18 − 22.91 ± 5.92 − 24.13 ± 6.11 − 23.65 ± 6.23 − 23.93 ± 11.65 − 23.80 ± 10.95
ΔGbinding − 28.19 ± 3.88 − 20.87 ± 3.07 − 23.69 ± 4.30 − 27.08 ± 3.52 − 22.62 ± 6.40 − 22.75 ± 6.22
Table 4. Binding free energy between LXRβ and D3 or L3 derivatives (Kcal/mol). All values in this table were
expressed in term of Kcal/mol. ΔEvdW, van der Waals energy, ΔEelectrostatic, electrostatic energy; ΔGnonpolar-solvation,
nonpolar solvation energy; ΔGpolar-solvation, polar solvation energy; ΔTS, energy contributed from solute entropy;
ΔGbingding, binding free energy for the complex.
LXRα- LXRα-1,20 LXRα-1,25 LXRα-25 (OH)
20,22(OH)2L3 LXRα-20(OH)L3 (OH)2D3 (OH)2D3 LXRα-20 (OH)D3 D3
LEU260 40%
SER264 69% 54% 60%
GLU301 42%
THR302 84% 47%
ARG305 43% 45% 56%
HID421 47% 78% 42%
Table 5. Occupancy of hydrogen bond (no less than 40%) formed between LXRα and D3 or L3 derivatives.
LXRβ- LXRβ-1,20 LXRβ-1,25 LXRβ-25 (OH)
20,22(OH)2L3 LXRβ-20(OH)L3 (OH)2D3 (OH)2D3 LXRβ-20 (OH)D3 D3
THR272 57%
LEU274 51%
SER278 63% 86% 80%
GLH281 70%
GLU315 49%
THR316 86%
PHE329 40% 48% 57% 54% 50%
HID435 89% 82% 90% 93%
GLN438 88%
Table 6. Occupancy of hydrogen bond (no less than 40%) formed between LXRβ and D3 or L3 derivatives.
direction and the arrow length represents the magnitude of this motion. Results indicate that there is varied
motion of the helix 12/AF-2 region relative to β-sheet/helix 6 for LXRs bound with different D3 and L3 deriva-
tives demonstrating the flexible characteristics for ligand binding pocket of LXRα and LXRβ as observed in a
previous study48. The first three principal modes of the helix 12/AF-2 region in LXRβ showed a large amplitude
of motion that is consistent with the high degree of conformational fluctuation for residues in the AF-2 region,
as observed in RMSF results shown in Fig. 7B. The moderate motion amplitude of β-sheets for LXRs bound with
different ligands is also consistent with the fluctuation in the conformation of β-sheets observed for residues by
RMSF (Fig. 7B). In addition to the principal dynamical motion of the helix 12/AF-2 region and β-sheet/helix 6
represented with porcupine arrows (Fig. 8), the dynamical motion of the other helices and unstructured regions
that contributed to the binding of LXRs with ligands are shown in the movies: Movie_LXRAlpha_125OH2D3.
mpeg and Movie_LXRBeta_125OH2D3.mpeg in the supplemental materials. The movies show the dynamic
interaction of 1,25(OH)2D3 with LXRα or LXRβ during the equilibrated last 150 ns MD simulations. In the
movie of the interaction of 1,25(OH)2D3 with LXRβ, a large motion of the unstructured region between helix 1
and helix 3 was observed, which is consistent with the observed large conformation fluctuation for the residues
between helix 1 and helix 3 in Fig. 7B (4). Together with the different conformational fluctuation (Fig. 7B), the
varied motions for the LBD of LXRα and LXRβ by interactions with D3 and L3 derivatives could directly influ-
ence the size and shape of the ligand binding pocket, further resulting in the different binding affinities of ligand
with LXRs, as observed in Tables 1 and 3 and in Fig. 5. The different dynamic motion of the helix 12/AF-2 region
of LXRs could affect LXRs binding with coactivators required for transcriptional activity of LXR and regulation
of downstream gene expression, as observed in Figs. 1, 2, 3, 4.
Scientific Reports | (2021) 11:8002 | https://doi.org/10.1038/s41598-021-87061-w 14
Vol:.(1234567890)www.nature.com/scientificreports/
Figure 8. Varied principal dynamic motion of helix 12/AF-2 region (in brown color) and the β-sheet/helix 6 (in yellow color)
in the ligand-binding pocket of LXRα (A) and LXRβ (B) by binding with different D3 and L3 derivatives. LXRα and LXRβ
were shown as new cartoon and molecules were shown as licorice in green. Arrows for principal dynamic motion are shown
as blue. The images were made with VMD (v1.9.2, http://www.ks.uiuc.edu/Research/vmd/)101 based on principal component
analysis (PCA) of our molecular dynamics simulation trajectories.
Scientific Reports | (2021) 11:8002 | https://doi.org/10.1038/s41598-021-87061-w 15
Vol.:(0123456789)www.nature.com/scientificreports/
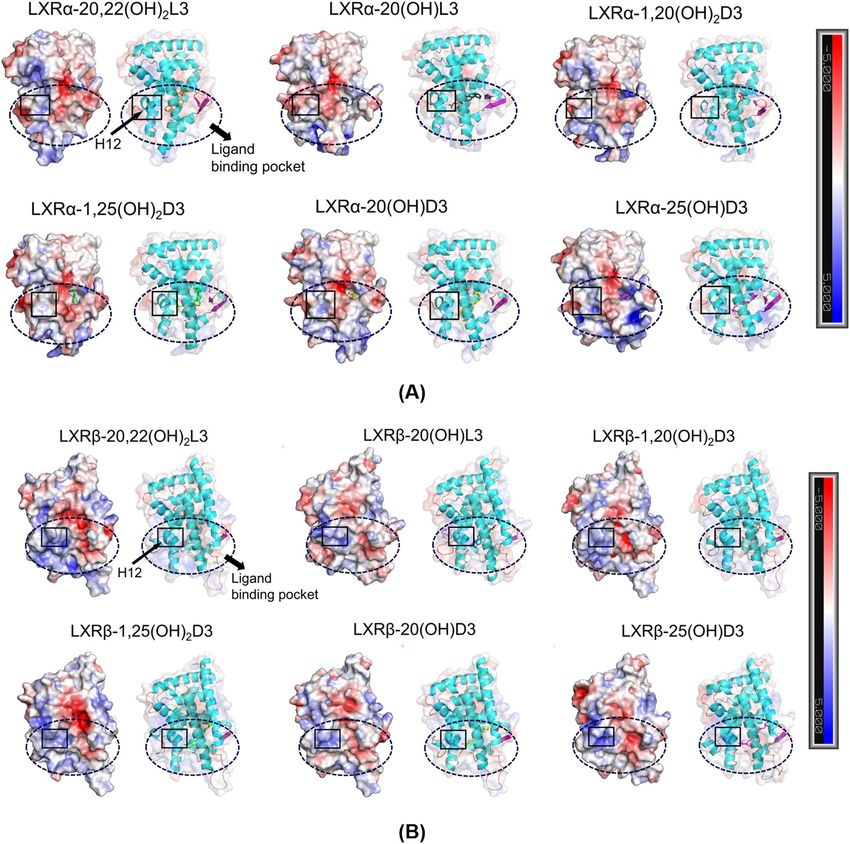
Figure 9. Varied electrostatic potential distribution for the LBD of LXRα (A) and LXRβ (B) bound with
different D3 and L3 derivatives, including for the ligand binding pocket and H12 helix. Positive electrostatic
potential is shown in blue and negative electrostatic potential is shown in red. The images were made with
PyMOL(v2.4.0, https://pymol.org/2/)99 based on electrostatic potential analyses of the representative complex
structures in our equilibrated MD simulations using APBS (v1.2.0, http://www.poissonboltzmann.org/)98.
Electrostatic potential analyses. Electrostatic potential analysis of the LBD of LXRα and LXRβ bound with
different D3 and L3 derivatives (Fig. 9A,B) could help to understand the effect of D3 and L3 derivatives on the
electrostatic potential distribution of LBD, providing a molecular insight into the binding of D3 and L3 deriva-
tives with LXRs and with its function (Table 1, Figs. 4 and 5) from an electrostatic point of view. It is known that
the ligand-binding pocket of LXRs extends from helix 12 to the β-sheet lying between helices H6 and H 748 and
helix 12 is the key helix for the AF-2 region to bind coactivators48,50–53. Varied electrostatic potential distribution
in the LBD of LXRα and LXRβ bound with different D3 and L3 derivatives as observed in Fig. 9A,B, including
in helix 12 and ligand binding pocket, could directly affect the electrostatic energy and polar solvation energy
for the complexes of LXRs with ligands. These varied electrostatic potential distribution could contribute to the
different binding free energy between LXRs with ligands, as reported in Table 3, further supporting the binding
of LXRs with D3 and L3 derivatives observed experimentally (Table 1 and Fig. 5). Therefore, it is expected that
different electrostatic potential distributions in or near helix 12 could affect dimerization of LXRs or binding
with the coactivators required for transcriptional activity, as experimentally indicated (Figs. 4, 5, 6).
Scientific Reports | (2021) 11:8002 | https://doi.org/10.1038/s41598-021-87061-w 16
Vol:.(1234567890)www.nature.com/scientificreports/
Concluding remarks
Bioinformatics analyses on deposited microarray and RNAseq data identified the LXR/RXR signaling complex
as a target for D3 hydroxyderivatives. This was further substantiated by stimulation of the expression of genes
downstream of LXR by secosteroids and by ChIP analysis of chromatin isolated from keratinocytes treated with
1,25(OH)2D3 which showed a significant stimulation of LXRα/β binding to the LXRE. The expression of genes
downstream of LXR was also stimulated by D3 and L3 hydroxyderivatives. Identification of LXR α/β as receptors
for secosteroidal and lumisterol derivatives was confirmed and strengthened by functional assays showing: (i)
the activation of the transcriptional functions of LXRα and LXR using the luciferase reporter gene containing
the LXRE in CHO and HaCaT cells, (ii) binding in LanthaScreen TR-FRET LXRα and β coactivator assays, and
(iii) ligand-induced translocation of LXRα/β to the nucleus. This was further supported by molecular docking
with favorable docking scores and favorable binding free energy based on molecular dynamics simulations. Also
docked poses for the D3 and L3 derivatives studied aligned well with the crystal structure of ligand-LXRα and
LXRβ ligand binding domain complexes and indicated that they share the same ligand binding pocket. These
findings allowed us to conclude that LXRα/β are indeed receptors for secosteroids and lumisterol hydroxyderiva-
tives. In addition, molecular docking predicted derivatives of 7DHC, 7DHP, T3 and pT as potential agonists on
LXRα/β, opening new possibilities for further experimental testing.
Binding thermodynamics analyses based on MD simulations demonstrated that 20,22(OH)2L3, 20(OH)L3,
1,20(OH)2D3, 1,25(OH)2D3, 20(OH)D3, and 25(OH)D3 favorably bind with LXRα and LXRβ, in agreement
with the experimental binding assays. Different binding energy components such as van der Waals energy,
electrostatics energy, and polar solvation energy were observed between the different ligands in complex with
LXRα and LXRβ, which can be attributed to the different dynamic interactions of LBD of LXRs with the four
D3 and two L3 derivatives studied that have the different chemical structure and atomic charge parameters. The
different D3 and L3 derivatives were predicted to display different hydrogen bonding patterns with the LXRs,
varied residue conformation fluctuations and dynamic motion for the LBD of LXRα or LXRβ. These changes
could alter the shape, size and electrostatic potential distribution of the LBD pocket, further contributing to the
different binding affinities of the D3 and L3 derivatives for LXRα or LXRβ, as experimentally observed. The varied
conformation fluctuation, motion, and electrostatic potential distribution of the helix 12/AF-2 region by D3 and
L3 derivatives shown as Figs. 7, 8, 9, Supplementary Figs. S21–23 and two movies, could affect the recruitment of
transcriptional mediators (e.g. coactivators) and might explain the observed differences in the gene expression
profiles between different derivatives. These predictions are consistent with functional and receptor binding
analyses and activation of genes with LXRE, and with LXR translocation to the nucleus. However, our study has
also some limitations. For example, crystallography, NMR and/or cryogenic electron microscopy studies with
secosteroidal or L3 compounds are needed to define the exact nature of the ligand receptor interactions. In addi-
tion, in our future studies we plan to include ChiP-Seq and use of LXR knockouts in relation to ligand activated
phenotypic activity to better define molecular and biological consequences of these interactions.
The traditional endogenous ligands for LXR are oxysterols including 22R(OH)C, 24S(OH)C, 25(OH)C,
27(OH)C and 20S(OH)C30–32,55. Considering their structural similarity, it is not surprising that hydroxyderiva-
tives of L3 (9β,10α stereoisomer of 7DHC), which are produced enzymatically by the action of CYP11A1 or
CYP27A120–22, are able to bind and upregulate the transcriptional activity of LXRs. Further, molecular modeling
results have extended the list of potential ligands for LXR to include 7DHC (photoprecursor of L3) and short side
chain derivatives of L3 and 7DHC (pL and 7DHP compounds). The significance of these findings is enhanced by
the recently reported biological activity of L3-hydroxyderivatives in the skin and their detection together with
L3 itself in the human epidermis and serum10,21. Our results predict that these compounds will exert phenotypic
effect via activation of LXRs in tissues expressing these receptors. This opens up exciting possibilities for stud-
ies on the phenotypic role of novel, endogenously produced LXR ligands at the local and systemic levels and
on the nature of the molecular signaling, further supplemented by studies on LXR knock-out mice. We predict
that molecular signaling is depend on the cell-type specific expression of nuclear receptors for L3 or related
compounds, and the actual crosstalk between LXRs and R ORs10,21,23,36.
The VDR has long been considered to be the major if not sole nuclear receptor for 1,25(OH)2D39. This study
not only breaks this dogma but also identifies its precursors and CYP11A1-derived D3-hydroxyderivatives as
ligands for LXRs, which is highly significant. The identification of hydroxyderivatives of D3 as ligands for LXRs
is unexpected, because of their major structural differences with sterols represented by their 9,10 secosteroidal
configuration opposed to the intact B ring in 7DHC and cholesterol2,46,56. On the other hand, the binding pocket
of LXR is large and potentially other oxysterols could fit rather easily and interact with different regions in the
LXR binding pocket. Nevertheless, the A, C and D rings of D3 remain intact and the side chain is identical to
cholesterol, differing only with respect to the position(s) of hydroxylation. The ligand binding pocket (LBP) of
LXR is lined with mostly non-polar residues and is flexible enough to accommodate D3-hydroxyderivatives
to allow the interaction of D3 hydroxyderivatives with LXRs, as predicted by molecular modelling and shown
by experimental results. With respect to the VDR, the CYP27B1 mediated addition of an OH to C1α enhances
selectivity of classical and non-classical hydroxy D3 compounds towards it2,9,26,27. However, this 1α-hydroxylation
does not affect their functions as agonists on LXR, except C1α(OH)-derivatives of D3 become inverse agonists on
LXRα but not β. This could be due to the different conformational fluctuation, dynamic motion and electrostatic
potentials at the AF-2 region, particularly for key helices 12, in LXRα and LXRβ by binding D3 derivatives, which
could result in the different transcription activities for LXRα and LXRβ. LXRs binds RXR to form heterodimer
for transcriptional a ctivities30–32. Conformational changes of LXRs by binding with different D3 derivatives could
result in the ligand dependent conformational changes of the LXR-RXR heterodimer, which could create a bind-
ing surface for interaction with either a co-activator or a co-repressor peptide. Whether LXR-RXR heterodimer
recruits a co-activator/repressor peptide also depends on the tissue type and the abundance of the co-activator/
Scientific Reports | (2021) 11:8002 | https://doi.org/10.1038/s41598-021-87061-w 17
Vol.:(0123456789)You can also read