Measurement report: Saccharide composition in atmospheric fine particulate matter during spring at the remote sites of southwest China and ...
←
→
Page content transcription
If your browser does not render page correctly, please read the page content below
Atmos. Chem. Phys., 21, 12227–12241, 2021
https://doi.org/10.5194/acp-21-12227-2021
© Author(s) 2021. This work is distributed under
the Creative Commons Attribution 4.0 License.

Measurement report: Saccharide composition in atmospheric fine
particulate matter during spring at the remote sites of southwest
China and estimates of source contributions
Zhenzhen Wang1 , Di Wu1 , Zhuoyu Li1 , Xiaona Shang1 , Qing Li1 , Xiang Li1 , Renjie Chen2 , Haidong Kan2 ,
Huiling Ouyang3 , Xu Tang3 , and Jianmin Chen1,3
1 Shanghai Key Laboratory of Atmospheric Particle Pollution and Prevention (LAP3), Department of Environmental Science
& Engineering, Fudan Tyndall Centre, Fudan University, Shanghai 200438, China
2 Key Lab of Public Health Safety of the Ministry of Education, NHC Key Laboratory of Health Technology Assessment,

School of Public Health, Fudan University, Shanghai 200032, China
3 IRDR International Center of Excellence on Risk Interconnectivity and Governance on Weather/Climate Extremes Impact

and Public Health, Institute of Atmospheric Sciences, Fudan University, Shanghai 200438, China

Correspondence: Jianmin Chen (jmchen@fudan.edu.cn)

Received: 29 January 2021 – Discussion started: 29 March 2021
Revised: 2 July 2021 – Accepted: 2 July 2021 – Published: 16 August 2021

Abstract. Based on source-specific saccharide tracers, the       can be further applied to regional source apportionment mod-
characteristics of biomass burning (BB) and biogenic emis-       els and global climate models.
sions of saccharides were investigated in three rural sites at
Lincang, which is 65 % covered with forest in the south-
west border of China. The total saccharides accounted for
8.4 ± 2.7 % of organic carbon (OC) and 1.6 ± 0.6 % of            1   Introduction
PM2.5 . The measured anhydrosugars accounted for 48.5 % of
total saccharides, among which levoglucosan was the most         Biomass burning (BB) and biogenic aerosols are thought to
dominant species. The high level of levoglucosan was both        play important roles in air quality, human health, and cli-
attributed to the local BB activities and biomass combustion     mate through direct or indirect effects (Jacobson et al., 2000;
smoke transported from the neighboring regions of South-         Christner et al., 2008; Pöschl et al., 2010; Després et al.,
east Asia (Myanmar) and the northern Indian subcontinent.        2012; Chen et al., 2017; Tang et al., 2019). Atmospheric sac-
The measured mono- or disaccharides and sugar alcohols ac-       charide components have been extensively reported to orig-
counted for 24.9 ± 8.3 % and 26.6 ± 9.9 % of the total sac-      inate from natural or anthropogenic biomass burning (BB),
charides, respectively, and both proved to be mostly emit-       suspended soil or dust, and primary biological aerosol par-
ted by direct biogenic volatilization from plant material or     ticles (PBAPs), e.g., fungal and fern spores, pollens, algae,
surface soils rather than byproducts of polysaccharide break-    fungi, bacteria, plant debris, and biogenic secondary organic
down during BB processes. Five sources of saccharides were       aerosol (SOA) (e.g., Rogge et al., 1993; Graham et al., 2003;
resolved by non-negative matrix factorization (NMF) anal-        Jaenicke, 2005; Medeiros et al., 2006; Elbert et al., 2007; Fu
ysis, including BB, soil microbiota, plant senescence, air-      et al., 2013). As one of the major classes of water-soluble or-
borne pollen, and plant detritus with contributions of 34.0 %,   ganic compounds, saccharides in atmospheric aerosols have
16.0 %, 21.0 %, 23.7 %, and 5.3 %, respectively. The results     been detected over urban areas, forests, mountains, and re-
provide information on the magnitude of levoglucosan and         mote marine regions (Pashynska et al., 2002; Yttri et al.,
contributions of BB, as well as the characteristic of biogenic   2007; Fu et al., 2009; Burshtein et al., 2011; Jia and Fraser,
saccharides, at the remote sites of southwest China, which       2011; Chen et al., 2013; Pietrogrande et al., 2014; Li et al.,
                                                                 2016a, b). It has been reported that saccharides account for

Published by Copernicus Publications on behalf of the European Geosciences Union.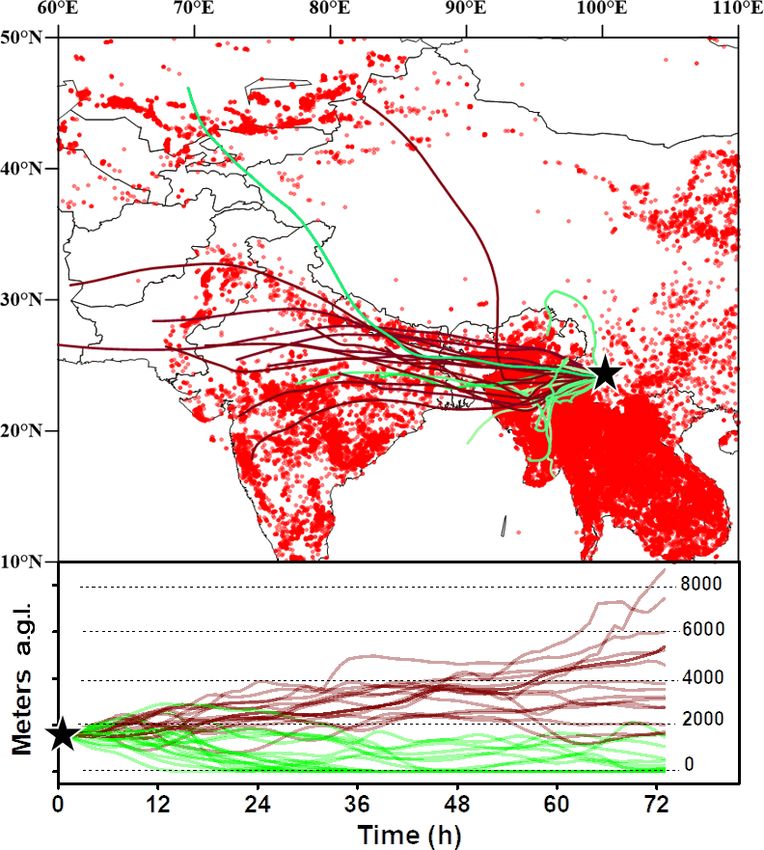
12228                                        Z. Wang et al.: Saccharide composition in atmospheric fine particulate matter

13–26 % of the total organic compound mass identified in           genic detritus, including numerous microorganisms, plants,
continental aerosols and up to 63 % of oceanic aerosols (Si-       and animals (Simoneit et al., 2004; Tominaga et al., 2011).
moneit et al., 2004).                                              As the oxidation products of isoprene, methyltetrols (includ-
   Levoglucosan and related anhydrosugar isomers (man-             ing 2-methylthreitol and 2-methylerythritol) have been sug-
nosan and galactosan), produced from pyrolysis of cellu-           gested as tracers of isoprene-derived SOA (Claeys et al.,
lose and hemicellulose, are considered to be relatively sta-       2004; Kleindienst et al., 2007; Ding et al., 2016). In a pre-
ble in the atmosphere (Schkolnik et al., 2005; Puxbaum et          vious study, the contributions of fungal spores to OC were
al., 2007); thus, have been recognized as specific molec-          estimated to be 14.1 ± 10.5 % and 7.3 ± 3.3 %, respectively,
ular markers for BB source emissions (Simoneit et al.,             at the rural and urban sites of Beijing (Liang et al., 2013b).
1999; Fraser and Lakshmanan, 2000; Sullivan et al., 2014).         Airborne pollen and fungal spores contributed 12 %–22 %
However, some studies have challenged this knowledge and           to the total OC in ambient aerosols collected in Toronto
proved that levoglucosan alone was unsuitable to be a dis-         (Womiloju et al., 2003). Jaenicke (2005) found that PBAPs
tinct marker for BB in various regions and periods. This is        could account for 20 %–30 % of the total atmospheric PM
because there is evidence that levoglucosan was also emit-         (> 0.2 mm) from Lake Baikal (Russia) and Mainz (Ger-
ted from non-BB sources (Wu et al., 2021), such as coal            many). However, studies on quantifying the abovementioned
burning (Rybicki et al., 2020; Yan et al., 2018), open waste       biogenic aerosol contributions to ambient aerosol are inade-
burning (Kalogridis et al., 2018), incense burning (Tsai et al.,   quate.
2010), and food cooking (Reyes-Villegas et al., 2018). It was         Lincang, located on the southwest border of China, is a tra-
reported that the levoglucosan emission contribution of BB         ditional agricultural area of Yunnan Province, where plant-
sources ranged from 21.3 % to 95.9 % (Wu et al., 2021). Cur-       ing large areas of tea, sugar cane, rubber, macadamia nuts,
rent studies in China have reported values of 2.6–289.1 and        etc. is common. It is the largest production base of black tea
11.6–1803.1 ng m−3 , respectively, over Beijing and Wangdu         and macadamia nuts in China. Referring to the official web-
in summer (Yan et al., 2019), 2.4–1064.1 ng m−3 over Shang-        site of Lincang Municipal People’s Government, the forest
hai all year round (Xiao et al., 2018), 15.6–472.9 ng m−3          coverage of Lincang reaches 65 %. It has a wide variety of
over Guangzhou (Zhang et al., 2010), 21.1–91.5 ng m−3 over         plant species and has six nature reserves covering an area
Hong Kong (Sang et al., 2011), 60.2–481.9 ng m−3 over              of ∼ 222 000 ha, accounting for 8.56 % of the total area. As
Xi’an (Yang et al., 2012), 36.0–1820.9 ng m−3 over Chengdu         a residential area for ethnic minorities, Lincang has unique
(Yang et al., 2012), and 10.1–383.4 ng g−1 dry weight in cry-      culture, humanity and living habits. The proportion of houses
oconites over the Tibetan Plateau (Li et al., 2019). In north      that use wood burning for cooking is very high in villages in
China, the high concentration of levoglucosan was a seri-          the vicinity as well as in a large area of Southeast Asia, and
ous problem due to the drastic enhancement of coal and BB          forest fires frequently occur in this area, especially in the dry
for house heating in winter and autumn (Zhang et al., 2008;        season (March–April). These facts imply that there are abun-
Zhu et al., 2016). The BB pollution might be exacerbated           dant biogenic aerosols in Lincang, and BB pollution may be
under unfavorable meteorological conditions, such as in the        an essential potential source of air pollution. However, little
Chengdu Plain (Chen and Xie, 2014). In general, BB with            information on the magnitude of biogenic and BB tracers in
a notable contribution to organic carbon (OC) was an im-           this area is available. The contributions of biogenic aerosol
portant source of fine particulate matter in China (Zhang          and BB, as well as BB types, are poorly understood.
et al., 2008; Cheng et al., 2013; Chen et al., 2017). Con-            In this study, the sampling was conducted from 8 March
trols on BB could be an effective method to reduce pollutant       to 9 April 2019 at three mountaintop sites of Lincang, which
emissions. Recently, a study reported that total levoglucosan      is an ideal site for investigating the BB emission characteris-
emissions in China exhibited a clear decreasing trend from         tics. BB tracers, including anhydrosugars and K+ , as well as
2014 (145.7 Gg) to 2018 (80.9 Gg) (Wu et al., 2021), sug-          biogenic aerosol tracers (primary saccharides and sugar alco-
gesting BB activities might be reduced in China.                   hols), were measured to gain the information on source and
   Saccharide compounds including a variety of primary sac-        contributions of BB and biogenic emissions to PM2.5 over
charides (monosaccharides and disaccharides) and sugar al-         the rural Lincang. This study would be useful and valuable
cohols (reduced sugars) have been measured to estimate the         for providing reliable information on sources and magnitudes
contribution of biogenic aerosols, including fungi, viruses,       of saccharides involving rural BB and biological emissions in
bacteria, pollen, and plant and animal debris (Simoneit et         China.
al., 2004; Jaenicke et al., 2007). For instance, arabitol and
mannitol have been proposed as biomarkers for airborne fun-
gal spores (Bauer et al., 2008; Zhang et al., 2010; Holden
et al., 2011; Liang et al., 2013a, b), because both of them
can function as storage or transport carbohydrates to regu-
late intracellular osmotic pressure (Bauer et al., 2008). Glu-
cose and sucrose are thought to originate from natural bio-

Atmos. Chem. Phys., 21, 12227–12241, 2021                                          https://doi.org/10.5194/acp-21-12227-2021
Z. Wang et al.: Saccharide composition in atmospheric fine particulate matter                                                12229

2     Experimental section                                           perometric detector (Engling et al., 2006; Caseiro et al.,
                                                                     2007; Zhang et al., 2013). This method developed by En-
2.1    Aerosol sampling                                              gling et al. (2006) was validated to be a powerful method for
                                                                     the detection of carbohydrates without derivatization tech-
PM2.5 samples were simultaneously collected on three                 niques, and it has been successfully applied to the atmo-
mountaintop sites in Lincang: Datian (24.11◦ N, 100.13◦ E;           spheric tracers (e.g., Zhang et al., 2010; Holden et al., 2011;
1960 m a.s.l.), Dashu (24.12◦ N, 100.11◦ E; 1840 m a.s.l.),          Liang et al., 2013a, b; Li et al., 2016a, b; Kalogridis et al.,
and Yakoutian (24.12◦ N, 100.09◦ E; 1220 m a.s.l.), which            2018; Yan et al., 2018). The separation of the saccharides was
are located ∼ 300 km west of Kunming (the capital of Yun-            performed on an ion chromatograph (Metrohm, Switzerland)
nan Province in China) and ∼ 120 km east from the Burma              equipped with a Metrosep Carb 4–250 analytical column and
border (shown in Fig. S1 in the Supplement). These sites             a guard column. The aqueous eluent of sodium hydroxide
are surrounded by massive mountains and scattered villages           and sodium acetate was pumped by a dual-pump module at a
without obvious nearby traffic or major industrial emissions.        flow rate of 0.4 mL min−1 . The low concentration of 50 mM
Each sampling was performed over a 23.5 h period every               sodium hydroxide and 10 mM sodium acetate (eluent A) was
day, and was collected on quartz by high-volume air sam-             applied to pump 1, while the high concentration of 250 mM
plers (Thermo) equipped with a size-selective inlet to sample        sodium hydroxide and 50 mM sodium acetate (eluent B) was
PM2.5 at a flow rate of 1.13 m3 min−1 . Altogether, 91 sam-          applied to pump 2. The gradient generator was set as 0–
ples were collected.                                                 10 min, 100 % of eluent A; 10–20 min, 50 % of eluent A and
    Quartz filters (Whatman, 20.32 × 25.40 cm) were pre-             50 % of eluent B; 20–50 min, 100 % of eluent B; and 50–
baked at 550 ◦ C for 4 h in a muffle furnace to remove organic       60 min, 100 % of eluent A for equilibration. The extraction
material, and they were then stored in prebaked aluminum             efficiency of this analytical method was determined to be
foils. The samples were stored at about −20 ◦ C in a refriger-       better than 90 % based on analysis of quartz filters spiked
ator until analysis. Field blanks were collected by mounting         with known amounts of mannitol. The method DL of the re-
filters in the sampler without air flow to replicate the envi-       ferred carbohydrate compounds was 0.005–0.01 mg L−1 . All
ronmental exposure. The data reported were corrected by the          carbohydrate species were below detection limits in the field
blanks at the sampling sites.                                        blanks.

2.2    Measurements                                                  2.3   Other data

The concentrations of OC and elemental carbon (EC) were              The meteorological parameters, including temperature (T ),
measured using a multiwavelength carbon analyzer (DRI                relative humidity (RH), solar irradiation (W m−2 ), and rain-
model 2015; Aerosol Inc., USA). Typically, a 0.58 cm2                fall (mm) were obtained from the Physical Sciences Labora-
punch of the filter was placed on a boat inside the thermal          tory of NOAA (https://psl.noaa.gov, last access: 8 Septem-
desorption chamber of the analyzer, and then stepwise heat-          ber 2020). The temporal changes in meteorological variables
ing was applied. Carbon fractions were obtained following            over the observation sites during the sampling periods are
the Interagency Monitoring of PROtected Visual Environ-              shown in Fig. S2.
ments (IMPROVE-A) thermal/optical reflectance (TOR) pro-                In order to characterize the origin and transport pathway
tocol (Chow et al., 2007). Replicate analyses were conducted         of the air masses to the sampling sites, 72 h back-trajectories
once every 10 samples. A blank sample was also analyzed              of the aerosol were calculated using the HYbrid Single-
and used to correct the sample results.                              Particle Lagrangian Integrated Trajectory (HYSPLIT) model
    A punch (4.7 cm2 ) of each quartz filter was ultrason-           developed by NOAA/ARL (Draxler and Hess, 1998) via
ically extracted with 10.0 mL deionized water (resistiv-             the NOAA ARL READY website (http://ready.arl.noaa.gov/
ity = 18.2 M cm−1 ) for 40 min. The aqueous extracts were           HYSPLIT.php, last access: 6 September 2020) with an end-
filtrated through syringe filters (PTFE, 0.22 µm) to remove          point height of 1500 m. To investigate the influence of BB
insoluble materials. Ion chromatography (Metrohm, Switzer-           emissions, fire pixel counts were obtained from Moderate
land) coupled with Metrosep C6-150 and A6-150 columns                Resolution Imaging Spectroradiometer (MODIS) observa-
was used to detect water-soluble ions (Cl− , NO−       3 , PO4 ,
                                                                −
                                                                     tions on NASA satellites (https://earthdata.nasa.gov/, last ac-
    2−      +     +    +      2+          2+
SO4 , Na , NH4 , K , Mg , and Ca ) with a detection                  cess: 3 September 2020).
limit (DL) range of 0.001–0.002 µg m−3 .
    Five saccharide alcohols (glycerol, erythritol, inositol, ara-   2.4   Statistical analysis
bitol, and mannitol) and five primary saccharides (fructose,
glucose, mannose, sucrose, and trehalose), together with             A Pearson’s correlation test was performed using the statis-
three anhydrosugars (levoglucosan, mannosan, and galac-              tical product and service solutions software for the dataset
tosan), were quantified by an improved high-performance              containing ambient concentrations of the measured saccha-
anion-exchange chromatograph coupled with a pulsed am-               rides, inorganic ions, and solar irradiation. Non-negative ma-

https://doi.org/10.5194/acp-21-12227-2021                                          Atmos. Chem. Phys., 21, 12227–12241, 2021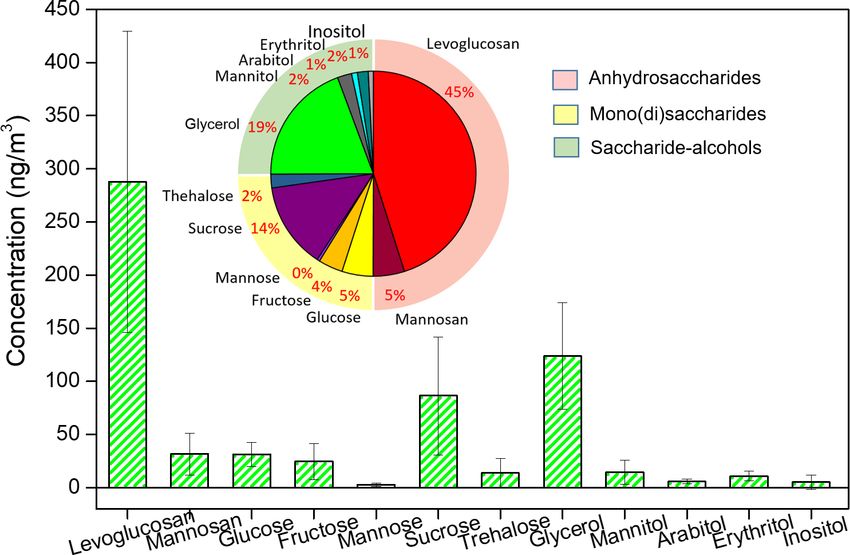
12230                                       Z. Wang et al.: Saccharide composition in atmospheric fine particulate matter

trix factorization (NMF) analysis was utilized to resolve         3.1.1   Anhydrosugars
potential emission source and estimate their contributions
to atmospheric saccharides. NMF introduced by Lee and             The average concentrations of levoglucosan and mannosan
Seung (1999) was similar to positive matrix factorization         were 287.7 and 31.6 ng m−3 , respectively, with respective
(PMF). Both methods find two matrices (termed the con-            ranges of 95.6–714.7 and 0–134.7 ng m−3 for all 91 sam-
tribution matrix of W and the source profile matrix of H)         ples. Galactosan was detected only in six samples, with a
to reproduce the input data matrix (V) using the factoriza-       range of 2.5–5.5 ng m−3 . The anhydrosugars accounted for
tion approach (V = WH) as a positive constraint (W ≥ 0 and        50.1 % of the total measured saccharides. Levoglucosan was
H ≥ 0). However, PMF forces the negative factors to be pos-       the most dominant species among all the saccharides. The
itive, but the NMF method only retains non-negative factors.      average levoglucosan concentration in this study was com-
NMF minimizes the conventional least-squares error and            parable to the value at urban Beijing collected in spring of
the generalized Kullback–Leibler divergence (Shang et al.,        2012 (above 200 ng m−3 ) (Liang et al., 2016) and at urban
2018). Therefore, the results obtained from NMF are more          Xi’an collected in winter of 2015 (268.5 ng m−3 ) (Wang et
responsive to the original characteristics of input dataset and   al., 2018). It was higher than the value at the rural Teng-
fewer factors will be extracted (Zhang et al., 2019). Half of     chong mountain site (193.8 ng m−3 ) (Sang et al., 2013), at
the DL was used for the value below the detection limit. In       urban Shanghai collected in spring of 2012 (66.0 ng m−3 ) (Li
this study, galactosan, mannose, and inositol were excluded,      et al., 2016a), and at urban Hong Kong collected in spring of
because their concentration in most samples was below the         2004 (36.0 ng m−3 ) (Sang et al., 2011), as well as at urban
DL. Concentrations of the other 10 saccharide species for a       Beijing collected in summer of 2013 (49.4 ng m−3 ) (Yan et
total of 91 samples were subjected to NMF analysis. The un-       al., 2019), but it was lower than that at a rural site in Xi’an
certainties in NMF analysis were estimated as 0.3 plus the        (0.93 mg m−3 ) (Zhu et al., 2017) and at a rural site in eastern
analytical detection limit according to the method by Xie et      central India (2258 ng m−3 ) (Nirmalkar et al., 2015). During
al. (1999). The constant 0.3 corresponding to the log (geo-       the observation period, several instances of elevated levoglu-
metric standard deviation) was calculated from the normal-        cosan occurred, peaking on 8, 16, 23 March and 1 April. It
ized concentrations for all measured species, and it was used     was thought that the ambient levoglucosan was primarily at-
to represent the variation of measurements.                       tributed to domestic biomass fuel burning; the high levoglu-
                                                                  cosan emission on these peak days might be from open BB
                                                                  events.
3     Results and discussion                                         Regression analyses of levoglucosan and the other two an-
                                                                  hydrosugars (mannosan, galactosan) are shown in Fig. 3a.
3.1    Saccharide concentration and composition
                                                                  Levoglucosan was highly correlated with mannosan and
The temporal variations of PM2.5 mass, OC, EC, and vari-          galactosan, with coefficients of determination (R) of 0.81
ous saccharides measured in all samples are shown in Fig. 1.      (P < 0.01) and 0.89 (P < 0.01), respectively, indicating
A statistical summary of all the data is listed in Table S1.      similar combustion sources of them. The ratios of levoglu-
During the sampling periods, the PM2.5 mass concentra-            cosan to mannosan (L/M) and mannosan to galactosan
tions ranged between 13.7 and 87.8 µg m−3 with an aver-           (M/G) had been employed to identify the specific types of
age value of 41.8 µg m−3 . The concentrations of OC and           BB, although these ratios were quite variable (Fabbri et al.,
EC, respectively, were in the ranges of 2.5–22.4 and 0.3–         2009). Previous studies suggested that L/M ratios for the
4.3 µg m−3 with average values of 8.4 and 1.7 µg m−3 . OC         burning of softwood were 3–10, hardwood ratios were 15–
accounted for 19.9 ± 3.7 % of total PM2.5 mass. The ambient       25, and those from crop residues were often above 40 (Cheng
concentrations of the total saccharides varied between 244.5      et al., 2013; Zhu et al., 2015; Kang et al., 2018). The average
and 1291.6 ng m−3 with an average value of 638.4 ng m−3 .         L/M and M/G ratios were statistically reported as 32.6 and
The total saccharides quantified in PM2.5 accounted for           1.2 for crop residue combustion, 4.0 and 3.9 for softwood
8.4 ± 2.7 % (range: 3.8 %–20.6 %) of the OC and accounted         combustion, and 21.5 and 1.5 for hardwood combustion, re-
for 1.6 ± 0.6 % (range: 0.6 %–3.0 %) of the PM2.5 . Figure 2      spectively (Sang et al., 2013; Shen et al., 2018). In this study,
presents the average concentration levels of 12 measured sac-     the ratios of L/M and M/G ranged from 4.7 to 16.1 (aver-
charide compounds, categorized into anhydrosugar, mono- or        age: 9.7, n = 91) and from 3.9 to 6.1 (average: 4.8, n = 6),
disaccharide, and sugar alcohol, as well as the relative con-     respectively, crudely indicating major contribution from soft-
tribution of these saccharides for all samples. The values for    wood burning. The samples collected from 31 March to
each site are shown in Fig. S3.                                   1 April and from 8 to 10 March, respectively, had consid-
                                                                  erably lower and higher concentrations of mannosan than
                                                                  predicted by the levoglucosan–mannosan regression model
                                                                  (Fig. 3a). The results suggested that BB aerosols collected
                                                                  from 31 March to 1 April (L/M = 11.52 ± 1.34) and from
                                                                  8 to 10 March (L/M = 6.57 ± 0.53) originated from differ-

Atmos. Chem. Phys., 21, 12227–12241, 2021                                         https://doi.org/10.5194/acp-21-12227-2021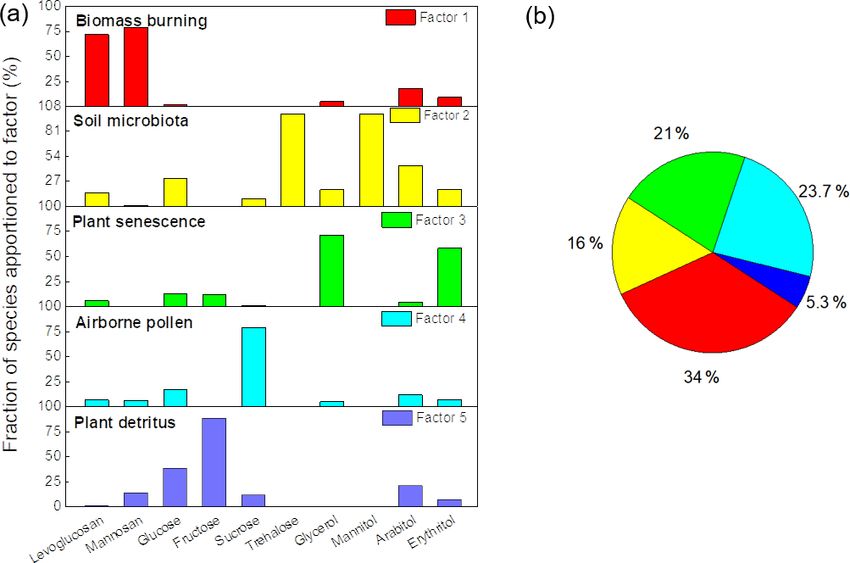
Z. Wang et al.: Saccharide composition in atmospheric fine particulate matter                                                   12231

Figure 1. Temporal variations of OC, EC, PM2.5 and total sugars at the three sites during the sampling periods.

                                                                        0.33, 0.28, and 0.74, respectively. This could be explained
                                                                        by the additional emissions of K+ from soil and seawater.
                                                                        Since Lincang is far from the coast, sea salt could be negligi-
                                                                        ble. Because of the inhomogeneity of crustal K+ associated
                                                                        with soil types, it was difficult to fully account for crustal
                                                                        K+ contributions from soil (Harrison et al., 2012; Cheng
                                                                        et al., 2013). The ratio of levoglucosan to K+ (L/K+ ) was
                                                                        also used to track possible sources of BB in the previous
                                                                        studies. The ratios of L/K+ strongly depended on BB pro-
                                                                        cesses, namely, smoldering and flaming. Studies suggested
                                                                        that relatively high L/K+ ratios were obtained from smolder-
                                                                        ing combustion at low temperatures compared with flaming
                                                                        combustion (Schkolnik et al., 2005; Lee et al., 2010). Pre-
                                                                        vious results showed the emissions from the combustion of
Figure 2. The absolute concentration (bar chart) and the relative       crop residuals such as rice straw, wheat straw, and corn straw
contribution (pie chart) of various saccharide compounds during the     exhibited comparable L/K+ ratios, typically below 1.0. The
sampling periods.                                                       average L/K+ ratio in this study was 0.48 ± 0.20, which is
                                                                        higher than the ratio for wheat straw (0.10 ± 0.00) and corn
                                                                        straw (0.21 ± 0.08) but is lower than the ratio for Asian rice
ent types of BB compared with the remaining sampling pe-                straw (0.62 ± 0.32) (Cheng et al., 2013). In this study, higher
riods (L/M = 9.34 ± 1.20). Therefore, the high levoglucosan             L/K+ ratios were observed during 8–10 March (1.20 ± 0.19)
emission from 31 March to 1 April and from 8 to 10 March                compared to those from 31 March to 1 April (0.40 ± 0.13),
might be from different open BB events, possibly an open                which suggested that the open fire event from 8 to 10 March
agricultural waste burning event or a forest fire, while the BB         was more possibly due to smoldering combustion of residues
of most sampling days originated from biomass fuel for do-              at low temperatures.
mestic cooking and heating. It is worth noting that the peak               Figure 3c and d show the scatterplots and regression anal-
days from 31 March to 1 April (L/M = 11.52 ± 1.34) neared               yses of K+ versus PM2.5 , OC, and EC, and levoglucosan
the Qingming Festival. One possibility for BB events is that            versus PM2.5 , OC, and EC, respectively. Linear regression
people burned joss paper as a sacrifice to their ancestors ac-          of K+ on PM2.5 , OC, and EC resulted in R values of 0.64,
cording to Chinese tradition.                                           0.63, and 0.62, respectively, which were generally higher
   Both anhydrosugars and water-soluble potassium (K+ )                 than those of levoglucosan on PM2.5 , OC, and EC, with R
have been widely utilized as source tracers of BB emissions             values of 0.40, 0.54, and 0.48, respectively. This shows that
(e.g., Puxbaum et al., 2007; Wang et al., 2007; Zhang et al.,           K+ is more highly correlated with PM2.5 , OC, and EC, which
2008; Engling et al., 2011). The daily variations of concen-            could be explained by either the photo-oxidative decay of
trations of levoglucosan and K+ are shown in Fig. S4; the               levoglucosan (Hennigan et al., 2010) or different types of
regression analysis of K+ and three anhydrosugars is shown              BB processes (Schkolnik et al., 2005; Lee et al., 2010). Even
in Fig. 3b. The K+ concentration was weakly correlated with             so, the results suggest that BB imposed a great impact on
levoglucosan, mannosan, and galactosan, with R values of

https://doi.org/10.5194/acp-21-12227-2021                                              Atmos. Chem. Phys., 21, 12227–12241, 2021
12232 Z. Wang et al.: Saccharide composition in atmospheric fine particulate matter Figure 3. (a) Regression analyses of levoglucosan versus the other two anhydrosugars; (b) K+ versus the other three anhydrosugars; (c) lev- oglucosan versus PM2.5 , OC, and EC; and (d) K+ versus PM2.5 , OC, and EC. fine aerosols. The ratio of levoglucosan to PM2.5 (L/PM2.5 ) Mochida et al., 2010; Lai et al., 2014). Moreover, Wu et was also helpful in distinguishing the contributions of dif- al. (2021) have reported that the total levoglucosan emission ferent levoglucosan sources (Wu et al., 2021). The ratio of exhibited a clear decreasing trend in China. However, it was L/PM2.5 in this study was 0.0041–0.0162 (average: 0.0072), noteworthy that the average concentration of levoglucosan indicating that the levoglucosan emission in the areas might (287.7 ng m−3 ) and the BB contributions to OC (41.3 %) mainly come from wood (0.01–0.09) and crop straw (0.001– at Lincang mountain site were both higher than the values 0.008), not excluding incense burning (0.001–0.007), ritual of 191.8 ng m−3 and 28.4 % at Tengchong mountain site in item burning (0.004–0.086), and meat cooking (0.005–0.06). 2004 in spring (Sang et al., 2013). This result suggests that However, certainly, it was not from coal burning (0.0001– there is no significant reduction in BB emissions in southwest 0.001) or waste incineration (0.0022). Yunnan Province. An empirical ratio of levoglucosan to OC (8.2 %), calcu- lated from main types of Chinese cereal straw (rice, wheat, 3.1.2 Mono- or disaccharides and corn) based on combustion chamber experiments (Zhang et al., 2007), was used to estimate the BB-derived OC. The total concentrations of five mono- or disaccharides, The average mass concentration of BB-derived OC was including glucose, fructose, mannose, sucrose, and tre- 3534.4 ng m−3 , whilst the contributions of BB to OC was halose, were in the range of 25.2–373.7 ng m−3 (average: 41.3 %, with a large range of 19.1 %–73.9 %. The contri- 158.9 ng m−3 ), which contributed 24.9 ± 8.3 % of the total butions were higher than those previously reported, such as measured saccharides. The average values of glucose, fruc- 6.5 %–11 % in Hong Kong (Sang et al., 2011), 18 %–38 % in tose, mannose, sucrose, and trehalose were 31.2, 24.6, 2.7, Beijing (Zhang et al., 2008), 18.9 %–45.4 % over southeast- 86.4, and 13.8 ng m−3 , respectively. Sucrose was the domi- ern Tibetan Plateau (Sang et al., 2013), and 26.4 %–30.2 % nant species in the mono- or disaccharides group. The results in Xi’an (Zhang et al., 2014). The large range of 19.1 %– agreed with those of previous studies (Yttri et al., 2007; Jia et 73.9 % revealed that the daily contribution of BB varied al., 2010; Fu et al., 2012), which found that sucrose was one greatly, suggesting that an open BB event or forest fire hap- of the dominant species in fine aerosols in spring. Ruptured pened occasionally. The contribution apportionment of pri- pollen may be an important source of sucrose, especially in mary BB might be underestimated due to the degradation the spring blossom season (Yttri et al., 2007; Fu et al., 2012; of levoglucosan during atmospheric aging of BB-influenced Miyazaki et al., 2012). In spring and early summer, farmland air mass after long-range transport (Hennigan et al., 2010; tilling after wheat harvest causes an enhanced exposure of Atmos. Chem. Phys., 21, 12227–12241, 2021 https://doi.org/10.5194/acp-21-12227-2021
Z. Wang et al.: Saccharide composition in atmospheric fine particulate matter                                                  12233

soil containing wheat roots to the air, which is beneficial for      tions (Jia et al., 2010; Graham et al., 2002; Wang et al., 2011).
the release of sucrose stored in roots (Medeiros et al., 2006),      Herein, glycerol was the second most abundant saccharide,
thus resulting in a sharply increased sucrose concentration.         with an average concentration of 123.7 ng m−3 , accounting
   It was reported that sugars, such as glucose, sucrose, and        for 5.1 %–44.6 % (average: 22.6 %) of the total measured
fructose, could be emitted from developing leaves (Graham            saccharides.
et al., 2003). Glucose could be released from both soils and            Mannitol and arabitol have been proposed as tracers
plant material (e.g., pollen, fruits, and their fragments) (Gra-     for airborne fungal spores (Elbert et al., 2007; Bauer et
ham et al., 2003; Simoneit et al., 2004; Fu et al., 2012). Glu-      al., 2008; Zhang et al., 2010; Burshtein et al., 2011).
cose and sucrose were rich in biologically active surface soils      Mannitol and arabitol were detected with a concentra-
(Rogge et al., 2007). In this study, positive correlations were      tion range of 0.0–38.6 ng m−3 (14.7 ng m−3 ) and 0.0–
found between sucrose and glucose (R = 0.52) (Table S2),             21.1 ng m−3 (5.8 ng m−3 ), respectively. The average concen-
suggesting a similar origin of glucose and sucrose in this           trations of mannitol and arabitol were comparable to those
study. Glucose and fructose have also been identified as a mi-       (average: 11.3 and 9.1 ng m−3 ) reported in the Beijing spring
nor product of cellulose pyrolysis, because they were found          aerosols (Liang et al., 2013b) but were lower than those (av-
to be enriched in BB emissions (Nolte et al., 2001), and             erage: 21.9 and 8.43 ng m−3 ) in the Mediterranean summer
they correlated well with K+ (Graham et al., 2002) and lev-          aerosols (Burshtein et al., 2011) and (30 and 24 ng m−3 ) at
oglucosan (Kang et al., 2018). Herein, no significant correla-       Hyytiälä, Finland, in summer (Yttri et al., 2011). Poor corre-
tion was found between K+ , levoglucosan, and these mono-            lations (r = 0.38) were found among mannitol and arabitol
or disaccharides. Therefore, the detected glucose, fructose,         in this study. Nevertheless, a positive correlation was found
and sucrose might mostly be emitted by direct volatilization         between trehalose and mannitol (r = 0.79, P < 0.05) (Ta-
from plant material or surface soils rather than as products         ble S2).
of polysaccharide breakdown during BB processes. The high               In the previous studies, the total measured mannitol has
abundance of sucrose, as well as glucose and fructose, was           been measured and used for estimating the contribution of
responsible for biogenic aerosols associated with developing         fungal spores to organic carbon (Elbert et al., 2007; Bauer
leaves and flowers, as well as surface soil suspension.              et al., 2008; Zhang et al., 2010). A factor of mannitol per
   Trehalose as a stress protectant of various microorganisms        spore (0.49 ± 0.20 pg) was used to calculate the number con-
and plants (Medeiros et al., 2006; Jia and Fraser, 2011) was         centrations of fungal spores (Liang et al., 2013a) and then
found to be abundant in the fine-mode soil, and has it been          the carbon content of fungal spores could be calculated us-
proposed as a marker compound for fugitive dust from bio-            ing a conversion factor of 13 pg C per spore obtained earlier
logically active surface soils (Simoneit et al., 2004; Medeiros      as the average carbon content of spores from nine airborne
et al., 2006; Rogge et al., 2007; Fu et al., 2012). A previous       fungal species, with an uncertainty of 20 % (Bauer et al.,
study found a positive correlation between trehalose and cal-        2008). The diagnostic tracer ratio of mannitol to OC was cal-
cium (Nishikawa et al., 2000). In this study, there was no           culated to be 0.0377 according to this research (Bauer et al.,
significant correlation between trehalose and calcium. Be-           2008; Liang et al., 2013a) and then used to estimate the con-
sides, mannose has been reported to be one of the major              tribution of fungal spores to OC. The contribution of fungal
monosaccharide components in phytoplankton, which origi-             spores might be underestimated, because previous results had
nated from marine biological fragments (Tanoue and Handa,            indicated that mannitol and arabitol were mainly associated
1987). Mannose was detected in only a few samples and pre-           with the coarse PM fraction (Samaké et al., 2019). The av-
sented with low concentrations in this study.                        erage mannitol concentration was 14.7 ± 11.2 ng m−3 during
                                                                     the observation period. The average spore-derived OC was
3.1.3   Sugar alcohols                                               calculated to be 390.3 ng C m−3 , which contributed to 4.9 %
                                                                     of the total OC.
Five sugar alcohol compounds, including glycerol, threitol,             Claeys et al. (2004) firstly identified two diastereoisomeric
mannitol, arabitol, and inositol, were detected in PM2.5 .           2-methyltetrols as oxidation products of isoprene in the Ama-
These reduced sugars are often reported to be related to             zonian rain forest aerosols. Henceforward, 2-methyltetrols
plant senescence and decay by microorganisms (Simoneit               have been used as tracers for isoprene-derived SOA (Liang
et al., 2004; Tsai et al., 2013); they are produced by fungi,        et al., 2012; Fu et al., 2016; Yan et al., 2019). In the previous
lichens, soil biota, and algae (Elbert et al., 2007; Bauer et al.,   studies, erythritol was often quantified as a surrogate of 2-
2008). The average concentration of total sugar alcohols was         methyltetrols (2-methylthreitol and 2-methylerythritol) due
159.9 ng m−3 with a range of 53.1–254.0 ng m−3 , which ac-           to a lack of standards (Claeys et al., 2004; Ding et al., 2013,
counted for 25.1 ± 9.9 % of the total measured saccharides.          2016). In this study, the concentration range of erythritol was
Glycerol has been widely found in soil biota (Simoneit et al.,       0.4–19.8 ng m−3 (average: 11.1 ng m−3 ). The values of in-
2004). Previous studies suggested that the source of glyc-           ositol ranged from 0.0 to 22.8 ng m−3 with average values
erol was not specific to biological emissions, but the biomass       of 5.8 ng m−3 . Moreover, the sugar alcohols not only origi-
combustion might increase atmospheric glycerol concentra-            nate from biological emissions but also from BB (Wan and

https://doi.org/10.5194/acp-21-12227-2021                                          Atmos. Chem. Phys., 21, 12227–12241, 2021
12234 Z. Wang et al.: Saccharide composition in atmospheric fine particulate matter
Yu, 2007; Jia et al., 2010). Different levels of glycerol, ara-
bitol, mannitol, erythritol, and inositol in fine particles have
been found during the burning of crop residues and fallen
leaves as well as indoor biofuel usage for heating and cook-
ing (Graham et al., 2002; Burshtein et al., 2011; Wang et al.,
2011; Yang et al., 2012; Kang et al., 2018). In this study, only
inositol correlated with levoglucosan (R = 0.42), suggesting
that inositol might be linked to biomass combustion sources.
Hence, the primary source of sugar alcohols associated with
fine particles was biogenic aerosols at the observation sites.
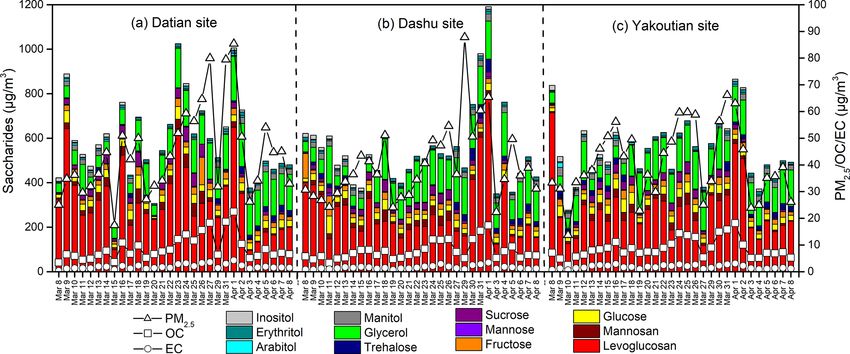
3.2 Sources and transport
Since the distinct concentration of the studied compounds
was due to different emission sources arising from differ-
ent wind directions, the 72 h backward trajectories for the
samples at the Dashu site (24.12◦ N, 100.11◦ E) and the spa-
tial distribution of the fire spots (8 March to 9 April 2019)
were calculated to understand the source of saccharides in
aerosol (Fig. 4). The analysis of air-mass backward trajec-
tories suggested that the air mass over Lincang was almost
from the westerlies during the sampling periods and could be
separated into two episodes of remote western source above
2000 m and local western source below 2000 m, as shown Figure 4. Spatial distribution of the fire spots observed by MODIS,
in wine red and green lines. Specifically, 51.6 % of air-mass as well as the corresponding 72 h backward air-mass trajectory clus-
backward trajectories were generally above 2000 m, whereas ters arriving at 1500 m above ground level (a.g.l.) during the sam-
pling periods for the collected samples. The backward trajectories
48.4 % of them were below 2000 m.
were separated into two episodes of remote western source above
The average concentrations of saccharide compounds, as
2000 m and local western source below 2000 m, as shown in wine
well as the contributions, for the episodes above and below red and green lines.
2000 m are shown in Fig. 5. The average concentrations of
levoglucosan and mannosan for the above 2000 m samples
(327.4 and 35.6 ng m−3 ) were higher than those for the below vious studies, which have observed long-range atmospheric
2000 m samples (250.3 and 27.3 ng m−3 ). The anhydrosugars transport of fine pollen from the Asian continent to the re-
accounted for 49.2 % and 36.9 % of total saccharides, respec- mote island Chichijima under the influence of the westerlies
tively, for the above and below 2000 m samples. This implied (Rousseau et al., 2008). Although the pollen grains are usu-
that the levoglucosan at the observation site was attributed ally coarse with various shapes and hard shells; this results in
to both the local BB activities and BB smoke transported a relatively short retention time in the atmosphere. Therefore,
from the neighboring regions of Southeast Asia (Myanmar) it could be concluded that, in addition to the local pollen, the
and the northern Indian subcontinent. The southwest wind concentration of sucrose in Lincang was also influenced by
from the Indian Ocean prevailed at Lincang all year round. the transport of airborne pollen derived from South Asia.
In spring, the southwest wind was often affected by the low-
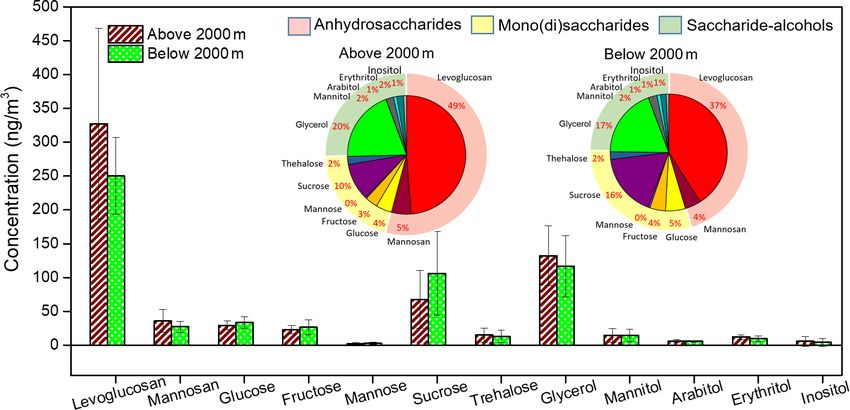
temperature downhill wind blowing from the snow-covered 3.3 Source apportionment of saccharides
Hengduan Mountains. The weather frequently alternated be-
tween hot and cold, with unstable air pressure and strong Based on the compositional data of saccharides and key rep-
wind. Therefore, the lower air could be diluted by the rel- resentative markers for difference sources, five factors asso-
atively clean, cold air over the plateau. The upper air mainly ciated with the emission sources of saccharides were finally
came from the westerlies. These results were in agreement resolved by NMF. As shown in Fig. 6a, factor 1 was char-
with the fact that residents across Southeast Asia use wood acterized by high levels of levoglucosan (71.8 %) and man-
as an energy source to cook and generate heat. nosan (78.7 %), suggesting the source of BB (Simoneit et al.,
For glucose, fructose, and sucrose, concentrations were a 1999; Nolte et al., 2001). Factor 2 was characterized by tre-
little higher in the below 2000 m samples (averages: 33.5, halose (99.9 %) and mannitol (100.0 %) and was enriched
26.4, and 106.2 ng m−3 ) than those in the above 2000 m sam- in the other saccharide components, i.e., arabitol (44.1 %),
ples (averages: 29.2, 22.9, and 67.8 ng m−3 ). This implied glucose (29.6 %), erythritol (18.2 %), glycerol (17.8 %), lev-
that biogenic aerosols (such as ruptured pollen) carrying sug- oglucosan (14.7 %), and sucrose (8.6 %). These saccharide
ars could cover long distance, which was supported by pre- compounds had all been detected in the suspended soil par-
Atmos. Chem. Phys., 21, 12227–12241, 2021 https://doi.org/10.5194/acp-21-12227-2021Z. Wang et al.: Saccharide composition in atmospheric fine particulate matter 12235 Figure 5. Average concentrations and contributions of saccharide compounds for the aerosol samples separated above and below 2000 m. ticles and associated microbiota (e.g., fungi, bacteria, and al- During the observation period of a month, along with the gae) (Simoneit et al., 2004; Rogge et al., 2007). A recent weather warming as sunshine enhanced, humans left two ob- study found that leaves were a major source of saccharide- vious traces of cultivated soil from 9 to 17 March and from associated microbial taxa in a rural area of France (Samaké 27 March to 8 April and a trace of vegetation or crop harvest et al., 2020). Hence, this factor was attributed to soil and leaf from 17 to 30 March. The stronger pollen discharge occurred microbiota. Factor 3 had high levels of glycerol (71.4 %) and in March, probably due to the flowering of certain plants. The erythritol (58.2 %) and showed loadings of glucose (12.8 %) BB emissions peaked on 9 and 16 March and 1 April were and fructose (11.8 %). Kang et al. (2018) reported that glyc- more prone to be open waste burnings. erol and erythritol presented large amounts in winter and au- Since there is still some uncertainty in the factor appor- tumn when vegetation is decomposed. This factor was at- tionment, the proportion of sources are only relative and tributed to plant senescence and decay by microorganisms. uncertain. It is still difficult to distinguish the contributions Factor 4 exhibited a predominance of sucrose (78.7 %) and of microorganisms and plants to biogenic aerosols. Further- showed loadings of glucose (17.2 %) and arabitol (11.8 %). more, all the above speculations about farming and harvest- This factor was regarded as the source of airborne pollen, be- ing periods are based on only 1 month of observation, and cause pollen was the reproductive unit of plants and contains long-term observations are needed to obtain more accurate these saccharides and saccharide alcohols as nutritional com- and effective information. ponents (Bieleski, 1995; Miguel et al., 2006; Fu et al., 2012). Factor 5 characterized by the dominance of fructose (88.2 %) was resolved, and it was enriched in glucose (38.2 %) and 4 Conclusion arabitol (21.2 %); thus, it could be regarded as the source of plant detritus. With the help of various atmospheric saccharides, this study The pie chart in Fig. 6b shows the contribution of each presents the characteristics of BB and various biogenic emis- source to total saccharides. BB of factor 1 (34.0 %) was sions to ambient aerosol in the rural sites of southwest China. found as the dominant contributor to total saccharides. Fac- Levoglucosan was the most dominant species among all the tors 2–5 could all be associated with a biogenic source ac- saccharides, with a concentration of 287.7 ng m−3 . The ratios counting for a total contribution of 66.0 %. The sources of of levoglucosan / OC were 1.9 %–8.9 % (average: 3.7 %). soil microbiota (factor 2), plant senescence (factor 3), air- BB contributed to 19.1 %–73.9 % of OC (average: 41.3 %). borne pollen (factor 4), and plant detritus (factor 5), respec- The results indicated that domestic biomass fuel burning, tively, contributed 16.0 %, 21.0 %, 23.7 %, and 5.3 % to total open BB events, possibly open agricultural waste burning, saccharides. During the sampling periods, daily variations in forest fire, or sacrificial activity are significant during the the proportion of the five factors are shown in Fig. S5. Fac- spring in this area. The total concentrations of five mono- tor 2 soil microbiota emissions could be associated with soil or disaccharides and five sugar alcohols respectively con- reclamation and cultivation of farming periods, whereas fac- tributed 24.9 ± 8.3 % and 26.6 ± 9.9 % to the total measured tor 3 (plant senescence) and factor 5 (plant detritus) could saccharides. Based on the regression analysis, these mono- be associated with the harvesting of vegetation or crops. or disaccharides and sugar alcohols were mostly emitted by https://doi.org/10.5194/acp-21-12227-2021 Atmos. Chem. Phys., 21, 12227–12241, 2021
12236                                           Z. Wang et al.: Saccharide composition in atmospheric fine particulate matter

Figure 6. (a) Factor profile obtained by NMF analysis. (b) Source contribution of the five factors to the total saccharides in PM2.5 samples.

direct biogenic volatilization from plant material or surface            Data availability. The meteorological parameters were obtained
soils rather than BB processes. The sampling sites suffered              from the Physical Sciences Laboratory of NOAA (https://psl.noaa.
from both local emissions and BB via long-range transport                gov/data/, last access: 8 September 2020, NOAA, 2020). 72 h back-
from Southeast Asia (Myanmar, Bangladesh) and the north-                 trajectories of the aerosol were calculated via the NOAA ARL
ern Indian subcontinent. Five sources of saccharides were                READY website (http://ready.arl.noaa.gov/HYSPLIT.php, last ac-
                                                                         cess: 6 September 2020, ARL, 2020). Fire pixel counts were
resolved by NMF analysis, including BB (34 %), soil mi-
                                                                         obtained from Moderate Resolution Imaging Spectroradiometer
crobiota (16.0 %), plant senescence (21.0 %), airborne pollen            (MODIS) observations on NASA satellites (https://earthdata.nasa.
(23.7 %), and plant detritus (5.3 %) at rural Lincang in spring.         gov/, last access: 3 September 2020, NASA, 2020). The three web-
   The data indicated that biofuel and open BB activities in             sites have open-access data. At present, the URLs of the database
rural southwest China and neighboring regions could have                 in our lab are still being established. All data described in this study
a significant impact on ambient aerosol levels. In addition              are available upon request from the corresponding authors.
to the residential biofuel usage, field burning of agricultural
residues, fallen leaves, and forest fire were non-negligible.
Some new technical measures of biomass resource utilization              Supplement. The locations of the sampling sites are shown in
are urgently needed to improve the open-burning emission                 Fig. S1. Temporal variations of RH, temperature, solar irradiation,
scenario in rural areas, along with strict prohibition policy of         and rainfall are shown in Fig. S2. Average concentrations of saccha-
BB. Meanwhile, the characteristic analysis of saccharides in             ride compounds and the contribution of them for the Datian, Dashu,
the region can serve as a valuable reference for future stud-            and Yakoutian samples are shown in Fig. S3. Daily variation on av-
                                                                         erage concentrations of levoglucosan and K+ (panel a), arabitol and
ies to evaluate temporal variations of biomass combustion
                                                                         mannitol (panel b), PM2.5 , Ca2+ and trehalose (panel c) at the three
and biogenic emission during modeling predictions and pol-               sites throughout the sampling period are shown in Fig. S4. Figure S5
icy making.                                                              shows daily variations on the proportion of the five factors to the to-
                                                                         tal saccharides in PM2.5 sampled at the three sites during the sam-
                                                                         pling periods. Table S1 lists the concentrations of the carbonaceous
Code availability. At present, the URLs of the database in our lab       components and soluble inorganic ions in PM2.5 during the sam-
are still being established. The code used in the non-negative ma-       pling periods of spring 2019. Correlation matrix for the dataset of
trix factorization (NMF) analysis is available upon request from the     the determined saccharide compounds in PM2.5 samples is shown
corresponding authors.                                                   in Table S2. The supplement related to this article is available online
                                                                         at: https://doi.org/10.5194/acp-21-12227-2021-supplement.

Atmos. Chem. Phys., 21, 12227–12241, 2021                                                  https://doi.org/10.5194/acp-21-12227-2021
Z. Wang et al.: Saccharide composition in atmospheric fine particulate matter 12237
Author contributions. ZZW, JMC and QL designed the research; 1993 and 2006-2009 periods, Atmos. Environ., 67, 448–458,
DW, ZZW and RJC conducted the sampling activities; ZZW and https://doi.org/10.1016/j.atmosenv.2012.11.014, 2013.
ZYL did the measurements; ZZW and XNS analyzed the results; Chen, J. M., Li, C. L., Ristovski, Z., Milic, A., Gu, Y. T., Islam,
JMC, HDK, XL and HLO made suggestions for this paper; and M. S., Wang, S. X., Hao, J. M., Zhang, H. F., He, C. R., Guo,
ZZW wrote the article with contributions from all co-authors. H., Fu, H. B., Miljevic, B., Morawska, L., Thai, P., Lam, Y. F.,
Pereira, G., Ding, A. J., Huang, X., and Dumka, U. C.: A re-
view of biomass burning: emissions and impacts on air quality,
Competing interests. The authors declare that they have no conflict health and climate in China, Sci. Total Environ., 579, 1000–1034,
of interest. https://doi.org/10.1016/j.scitotenv.2016.11.025, 2017.
Chen, Y. and Xie, S.: Characteristics and formation mechanism
of a heavy air pollution episode caused by biomass burning in
Disclaimer. Publisher’s note: Copernicus Publications remains Chengdu, Southwest China, Sci. Total Environ., 473–474, 507–
neutral with regard to jurisdictional claims in published maps and 517, https://doi.org/10.1016/j.scitotenv.2013.12.069, 2014.
institutional affiliations. Cheng, Y., Engling, G., He, K.-B., Duan, F.-K., Ma, Y.-L., Du, Z.-
Y., Liu, J.-M., Zheng, M., and Weber, R. J.: Biomass burning
contribution to Beijing aerosol, Atmos. Chem. Phys., 13, 7765–
7781, https://doi.org/10.5194/acp-13-7765-2013, 2013.
Special issue statement. This article is part of the special
Chow, J. C., Watson, J. G., Chen, L. W. A., Chang, M. C. O., Robin-
issue “The role of fire in the Earth system: understand-
son, N. F., Trimble, D., and Kohl, S.: The IMPROVE_A temper-
ing interactions with the land, atmosphere, and society
ature protocol for thermal/ optical carbon analysis: maintaining
(ESD/ACP/BG/GMD/NHESS inter-journal SI)”. It is a result
consistency with a long-term database, J. Air Waste Manag., 57,
of the EGU General Assembly 2020, 3–8 May 2020.
1014–1023, https://doi.org/10.3155/1047-3289.57.9.1014, 2007.
Christner, B. C., Morris, C. E., Foreman, C. M., Cai, R., and Sands,
D. C.: Ubiquity of biological ice nucleators in snowfall, Science,
Financial support. This research has been supported by the Na- 319, 1214, https://doi.org/10.1126/science.1149757, 2008.
tional Natural Science Foundation of China (grant nos. 91843301, Claeys, M., Graham, B., Vas, G., Wang, W., Vermeylen, R., Pashyn-
91743202, 91843302). ska, V., Cafmeyer, J., Guyon, P., Andreae, M. O., Artaxo, P.,
and Maenhaut, W.: Formation of secondary organic aerosols
through photooxidation of isoprene, Science, 303, 1173–1176,
Review statement. This paper was edited by Ivan Kourtchev and https://doi.org/10.1126/science.1092805, 2004.
reviewed by three anonymous referees. Després, V. R., Huffman, J. A., Burrows, S. M., Hoose, C., Safa-
tov, A. S., Buryak, G., FroehlichNowoisky, J., Elbert, W., An-
dreae, M. O., Pöschl, U., and Jaenicke, R.: Primary biological
aerosol particles in the atmosphere: a review, Tellus B, 64, 1–58,
https://doi.org/10.3402/tellusb.v64i0.15598, 2012.
References Ding, X., Wang, X. M., Xie, Z. Q., Zhang, X., and Sun, L.
G.: Impacts of Siberian biomass burning on organic aerosols
ARL: (Air Resources Laboratory) of NOAA: HYSPLIT Model over the North Pacific Ocean and the Arctic: Primary and sec-
[data set], available at: http://ready.arl.noaa.gov/HYSPLIT.php, ondary organic tracers, Environ. Sci. Technol., 47, 3149–3157,
last access: 6 September 2020. https://doi.org/10.1021/es3037093, 2013.
Bauer, H., Claeys, M., Vermeylen, R., Schueller, E., Weinke, G., Ding, X., He, Q. F., Shen, R. Q., Yu, Q. Q., Zhang, Y. Q., Xin, J.
Berger, A., and Puxbaum, H.: Arabitol and mannitol as tracers for Y., Wen, T. X., and Wang, X. M.: Spatial and seasonal variations
the quantification of airborne fungal spores, Atmos. Environ., 42, of isoprene secondary organic aerosol in China: significant im-
588–593, https://doi.org/10.1016/j.atmosenv.2007.10.013, 2008. pact of biomass burning during winter, Sci. Rep.-UK, 6, 20411,
Bieleski, R. L.: Onset of phloem export from senes- https://doi.org/10.1038/srep20411, 2016.
cent petals of daylily, Plant. Physiol., 109, 557–565, Draxler, R. R. and Hess, G. D.: An overview of the HYSPLIT-
https://doi.org/10.1104/pp.109.2.557, 1995. 4 modelling system for trajectories, dispersion and deposition,
Burshtein, N., Lang-Yona, N., and Rudich, Y.: Ergosterol, ara- Aust. Meteorol. Mag., 47, 295–308, 1998.
bitol and mannitol as tracers for biogenic aerosols in the Elbert, W., Taylor, P. E., Andreae, M. O., and Pöschl, U.: Contribu-
eastern Mediterranean, Atmos. Chem. Phys., 11, 829–839, tion of fungi to primary biogenic aerosols in the atmosphere: wet
https://doi.org/10.5194/acp-11-829-2011, 2011. and dry discharged spores, carbohydrates, and inorganic ions, At-
Caseiro, A., Marr, I. L., Claeys, M., Kasper-Giebl, A., Puxbaum, mos. Chem. Phys., 7, 4569–4588, https://doi.org/10.5194/acp-7-
H., and Pio, C. A.: Determination of saccharides in atmospheric 4569-2007, 2007.
aerosol using anion-exchange high-performance liquid chro- Engling, G., Carrico, C. M., Kreindenweis, S. M., Collet,
matography and pulsed-amperometric detection, J. Chromatogr. J. L., Day, D. E., Malm, W. C., Lincoln, E., Hao, W.
A, 1171, 37–45, https://doi.org/10.1016/j.chroma.2007.09.038, M., Iinuma, Y., and Herrmann, H.: Determination of
2007. levoglucosan in biomass combustion aerosol by high-
Chen, J., Kawamura, K., Liu, C. Q., and Fu, P. Q.: Long- performance anion-exchange chromatography with pulsed
term observations of saccharides in remote marine aerosols
from the western North Pacific: a comparison between 1990-
https://doi.org/10.5194/acp-21-12227-2021 Atmos. Chem. Phys., 21, 12227–12241, 202112238 Z. Wang et al.: Saccharide composition in atmospheric fine particulate matter amperometric detection, Atmos. Environ., 40, S299–S311, lett Jr., J. L.: Determining contributions of biomass burn- https://doi.org/10.1016/j.atmosenv.2005.12.069, 2006. ing and other sources to fine particle contemporary carbon in Engling, G., Zhang, Y. N., Chan, C. Y., Sang, X. F., Lin, M., Ho, the western United States, Atmos. Environ., 45, 1986–1993, K. F., Li, Y. S., Lin, C. Y., and Lee, J. J.: Characterization and https://doi.org/10.1016/j.atmosenv.2011.01.021, 2011. sources of aerosol particles over the southeastern Tibetan Plateau Jacobson, M. C., Hansson, H. C., Noone, K. J., and Charlson, R. J.: during the Southeast Asia biomass-burning season, Tellus B, Organic atmospheric aerosols: review and state of science, Rev. 63, 117–128, https://doi.org/10.1111/j.1600-0889.2010.00512.x, Geophys., 38, 267–294, https://doi.org/10.1029/1998RG000045, 2011. 2000. Fabbri, D., Torri, C., Simoneit, B. R. T., Marynowski, L., Jaenicke, R.: Abundance of cellular material and Rushdi, A. I., and Fabiańska, M. J.: Levoglucosan and proteins in the atmosphere, Science, 308, 73, other cellulose and lignin markers in emissions from burn- https://doi.org/10.1126/science.1106335, 2005. ing of Miocene lignites, Atmos. Environ., 43, 2286–2295, Jaenicke, R., Matthias-Maser, S., and Gruber, S.: Omnipresence of https://doi.org/10.1016/j.atmosenv.2009.01.030, 2009. biological material in the atmosphere, Environ. Chem., 4, 217– Fu, P. Q., Kawamura, K., and Barrie, L. A.: Photochemical and 220, https://doi.org/10.1071/EN07021, 2007. other sources of organic compounds in the Canadian high Arctic Jia, Y. L. and Fraser, M.: Characterization of saccharides in size- aerosol pollution during winter-spring, Environ. Sci. Technol., fractionated ambient particulate matter and aerosol sources: the 43, 286–292, https://doi.org/10.1021/es803046q, 2009. contribution of primary biological aerosol particles (PBAPs) Fu, P. Q., Kawamura, K., Kobayashi, M., and Simoneit, B. R. T.: and soil to ambient, Environ. Sci. Technol., 45, 930–936, Seasonal variations of sugars in atmospheric particulate matter https://doi.org/10.1021/es103104e, 2011. from Gosan, Jeju Island: significant contributions of airborne Jia, Y. L., Bhat, S. G., and Fraser, M. P.: Characterization pollen and Asian dust in spring, Atmos. Environ., 55, 234–239, of saccharides and other organic compounds in fine parti- https://doi.org/10.1016/j.atmosenv.2012.02.061, 2012. cles and the use of saccharides to track primary biologi- Fu, P. Q., Kawamura, K., Chen, J., Charrière, B., and Sempéré, cally derived carbon sources, Atmos. Environ., 44, 724–732, R.: Organic molecular composition of marine aerosols over the https://doi.org/10.1016/j.atmosenv.2009.10.034, 2010. Arctic Ocean in summer: contributions of primary emission Kalogridis, A. C., Popovicheva, O. B., Engling, G., Di- and secondary aerosol formation, Biogeosciences, 10, 653–667, apouli, E., Kawamura, K., Tachibana, E., Ono, K., Ko- https://doi.org/10.5194/bg-10-653-2013, 2013. zlov, V. S., and Eleftheriadis, K.: Smoke aerosol chem- Fu, P. Q., Zhuang, G. S., Sun, Y. L., Wang, Q. Z., istry and aging of Siberian biomass burning emissions in Chen, J., Ren, L.J., Yang, F., Wang, Z. F., Pan, X. a large aerosol chamber, Atmos. Environ., 185, 15–28, L., Li, X. D., and Kawamura, K.: Molecular markers of https://doi.org/10.1016/j.atmosenv.2018.04.033, 2018. biomass burning, fungal spores and biogenic SOA in the Kang, M. J., Ren, L. J., Ren, H., Zhao, Y., Kawamura, K., Zhang, H. Taklimakan desert aerosols, Atmos. Environ., 130, 64–73, L., Wei L. F., Sun. Y. L., Wang, Z. F., and Fu, P. Q.: Primary bio- https://doi.org/10.1016/j.atmosenv.2015.10.087, 2016. genic and anthropogenic sources of organic aerosols in Beijing, Fraser, M. P. and Lakshmanan, K.: Using levoglucosan as a China: Insights from saccharides and n-alkanes, Environ. Pollut., molecular marker for the long-range transport of biomass 243, 1579–1587, https://doi.org/10.1016/j.envpol.2018.09.118, combustion aerosols, Environ. Sci. Technol., 34, 4560–4564, 2018. https://doi.org/10.1021/es991229l, 2000. Kleindienst, T. E., Jaoui, M., Lewandowski, M., Offenberg, Graham, B., Mayol-Bracero, O. L., Guyon, P., Robert, G. C., J. H., Lewis, C. W., Bhave, P. V., and Edney, E. O.: Decesari, S., Facchini, M. C., Artaxo, P., Maenhaut, W., P, Estimates of the contributions of biogenic and anthro- K., and Andreae, M. O.: Water-soluble organic compounds pogenic hydrocarbons to secondary organic aerosol at a in biomass burning aerosols over Amazonia: 1. Characteri- southeastern US location, Atmos. Environ., 41, 8288–8300, zation by NMR and GC-MS, J. Geophys. Res., 107, 8047, https://doi.org/10.1016/j.atmosenv.2007.06.045, 2007. https://doi.org/10.1029/2001JD000336, 2002. Lai, C. Y., Liu, Y. C., Ma, J. Z., Ma, Q. X., and He, H.: Degrada- Graham, B., Guyon, P., Taylor, P. E., Artaxo, P., Maenhaut, W., tion kinetics of levoglucosan initiated by hydroxyl radical under Glovsky, M. M., Flagan, R. C., and Andreae, M. O.: Organic different environmental conditions, Atmos. Environ., 91, 32–39, compounds present in the natural Amazonian aerosol: character- https://doi.org/10.1016/j.atmosenv.2014.03.054, 2014. ization by gas chromatography-mass spectrometry, J. Geophys. Lee, D. D. and Seung, H. S.: Learning the parts of objects by non- Res.-Atmos., 108, 4766, https://doi.org/10.1029/2003JD003990, negative matrix factorization, Nature, 401, 788–791, 1999. 2003. Lee, T., Sullivan, A. P., Mack, L., Jimenez, J. L., Kreiden- Harrison, R. M., Beddows, D. C. S., Hu, L., and Yin, J.: Compar- weis, S. M., Onasch, T. B., Worsnop, D. R., Malm, W., ison of methods for evaluation of wood smoke and estimation Wold, C. E., and Hao, W. M.: Chemical smoke marker emis- of UK ambient concentrations, Atmos. Chem. Phys., 12, 8271– sions during flaming and smoldering phases of laboratory 8283, https://doi.org/10.5194/acp-12-8271-2012, 2012. open burning of wildland fuels, Aerosol Sci. Tech., 44, 1–5, Hennigan, C. J., Sullivan, A. P., Collett Jr., J. L., and Robinson, https://doi.org/10.1080/02786826.2010.499884, 2010. A. L.: Levoglucosan stability in biomass burning particles ex- Li, Q. L., Wang, N. L., Barbante, C., Kang, S. C., Calle- posed to hydroxyl radicals, Geophys. Res. Lett., 37, L09806, garo, A., Battistel, D., Argiriadis, E., Wan, X., Yao, P., Pu, https://doi.org/10.1029/2010GL043088, 2010. T., Wu, X. B., Han, Y., and Huai, Y. P.: Biomass burn- Holden, A. S., Sullivan, A. P., Munchak, L. A., Kreiden- ing source identification through molecular markers in cry- weis, S. M., Schichtel, B. A., Malm, W. C., and Col- Atmos. Chem. Phys., 21, 12227–12241, 2021 https://doi.org/10.5194/acp-21-12227-2021
You can also read