Significant and Conflicting Correlation of IL-9 With Prevotella and Bacteroides in Human Colorectal Cancer
←
→
Page content transcription
If your browser does not render page correctly, please read the page content below
ORIGINAL RESEARCH
                                                                                                                                             published: 08 January 2021
                                                                                                                                       doi: 10.3389/fimmu.2020.573158

                                          Significant and Conflicting
                                          Correlation of IL-9 With Prevotella
                                          and Bacteroides in Human
                                          Colorectal Cancer
                                          Elena Niccolai 1, Edda Russo 1, Simone Baldi 1, Federica Ricci 2, Giulia Nannini 1,
                            Edited by:    Matteo Pedone 3, Francesco Claudio Stingo 3, Antonio Taddei 1, Maria Novella Ringressi 1,
                     Marcello Chieppa,    Paolo Bechi 1, Alessio Mengoni 4, Renato Fani 4, Giovanni Bacci 4, Camilla Fagorzi 4,
National Institute of Gastroenterology    Carolina Chiellini 4†, Domenico Prisco 1,5, Matteo Ramazzotti 2 and Amedeo Amedei 1,5*
      S. de Bellis Research Hospital
                         (IRCCS), Italy   1 Department of Clinical and Experimental Medicine, University of Florence, Florence, Italy, 2 Department of Biomedical,

                        Reviewed by:      Experimental and Clinical Sciences “Mario Serio” University of Florence, Florence, Italy, 3 Department of Statistics, Computer
                          Giulio Verna,   Science, Applications “G. Parenti”, Florence, Italy, 4 Department of Biology, University of Florence, Florence, Italy, 5 SOD of
National Institute of Gastroenterology    Interdisciplinary Internal Medicine, Azienda Ospedaliera Universitaria Careggi (AOUC), Florence, Italy
       S. de Bellis Research Hospital
                         (IRCCS), Italy
                    Sama Rezasoltani,
                                          Background and aim: Gut microbiota (GM) can support colorectal cancer (CRC)
Shahid Beheshti University of Medical     progression by modulating immune responses through the production of both
                        Sciences, Iran
                                          immunostimulatory and/or immunosuppressive cytokines. The role of IL-9 is
                  *Correspondence:
                                          paradigmatic because it can either promote tumor progression in hematological
                     Amedeo Amedei
                     aamedei@unifi.it      malignancies or inhibit tumorigenesis in solid cancers. Therefore, we investigate the
                  †
                 Present address:         microbiota–immunity axis in healthy and tumor mucosa, focusing on the correlation
                   Carolina Chiellini,    between cytokine profile and GM signature.
 Department of Agriculture Food and
    Environment, University of Pisa,      Methods: In this observational study, we collected tumor (CRC) and healthy (CRC-S)
                           Pisa, Italy
                                          mucosa samples from 45 CRC patients, who were undergoing surgery in 2018 at the
                                          Careggi University Hospital (Florence, Italy). First, we characterized the tissue infiltrating
                   Specialty section:
         This article was submitted to    lymphocyte subset profile and the GM composition. Subsequently, we evaluated the CRC
                    Mucosal Immunity,     and CRC-S molecular inflammatory response and correlated this profile with GM
               a section of the journal
              Frontiers in Immunology     composition, using Dirichlet multinomial regression.
      Received: 29 September 2020         Results: CRC samples displayed higher percentages of Th17, Th2, and Tregs. Moreover,
      Accepted: 19 November 2020
                                          CRC tissues showed significantly higher levels of MIP-1a, IL-1a, IL-1b, IL-2, IP-10, IL-6, IL-8,
        Published: 08 January 2021
                                          IL-17A, IFN-g, TNF-a, MCP-1, P-selectin, and IL-9. Compared to CRC-S, CRC samples also
                              Citation:
 Niccolai E, Russo E, Baldi S, Ricci F,   showed significantly higher levels of the following genera: Fusobacteria, Proteobacteria,
    Nannini G, Pedone M, Stingo FC,       Fusobacterium, Ruminococcus2, and Ruminococcus. Finally, the abundance of Prevotella
    Taddei A, Ringressi MN, Bechi P,
Mengoni A, Fani R, Bacci G, Fagorzi C,
                                          spp. in CRC samples negatively correlated with IL-17A and positively with IL-9. On the
Chiellini C, Prisco D, Ramazzotti M and   contrary, Bacteroides spp. presence negatively correlated with IL-9.
       Amedei A (2021) Significant and
   Conflicting Correlation of IL-9 With    Conclusions: Our data consolidate antitumor immunity impairment and the presence of a
 Prevotella and Bacteroides in Human      distinct microbiota profile in the tumor microenvironment compared with the healthy
                     Colorectal Cancer.
            Front. Immunol. 11:573158.
                                          mucosa counterpart. Relating the CRC cytokine profile with GM composition, we confirm
    doi: 10.3389/fimmu.2020.573158        the presence of bidirectional crosstalk between the immune response and the host’s

Frontiers in Immunology | www.frontiersin.org                                      1                                        January 2021 | Volume 11 | Article 573158
Niccolai et al.                                                                                       IL-9 Correlation With Prevotella and Bacteroides in CRC

                                          commensal microorganisms. Indeed, we document, for the first time, that Prevotella spp.
                                          and Bacteroides spp. are, respectively, positively and negatively correlated with IL-9,
                                          whose role in CRC development is still under debate.
                                          Keywords: cytokines, colorectal cancer, T cells, immune response, gut microbiota

INTRODUCTION                                                                     that play different roles in colon cancer (11, 24). For example, the
                                                                                 commensal bacteria can stimulate the lamina propria dendritic
Colorectal cancer (CRC) is a complex and widespread disease and is               cells to produce the IL-6, TGF-b, and IL-23 needed to elicit Th17
the second cause of cancer-related deaths in the world (1). Usually,             and Th9 lymphocyte development (25), and these play a dual
it begins as benign polyps that can become (especially the                       role in CRC promotion (5, 26). Current studies show that Th9
adenomatous type) cancerous if not removed: in humans, a                         cells play a vital antitumor role in most solid tumors (27), but
variable percentage of polyps, ranging from 1% to 10%, evolve                    IL-9, as a lymphocyte growth factor, can also promote cancer
into malignancies (2) because multistep colorectal tumorigenesis                 progression in hematological tumors (23).
does not involve exclusively genetic factors, but also host factors,                 Finally, fermentative bacterial products, such as short chain
such as inflammatory and immune responses (3, 4). Indeed, chronic                 fatty acids, may affect colorectal carcinogenesis by favoring the
inflammation increases cancer risk through a deregulated activation               expression of the Foxp3 gene and boosting Treg functions
of the immune system, which causes a loss of tissue architecture and             (28, 29).
genotoxic cellular DNA damage (5). In this context, CRC is                           Given these premises, our study aims to investigate immune
considered the best example of a chronic inflammation–associated                  system–microbiota crosstalk in CRC through the cellular and
tumor, occurring often in patients with inflammatory bowel disease                molecular characterization of immunity and the comparative
(IBD): IBD-associated CRC is estimated to be 2% of all CRCs, and                 evaluation of microbiota composition in healthy and tumor
the rate of death resulting from CRC in IBD patients ranges from                 mucosa, focusing on the correlation between the cytokine
10% to 15% (6, 7). Moreover, according to the immunoediting                      profile and GM composition.
theory, the adaptive immune system, in addition to protecting the
host from developing tumors (8), can support tumor progression.
Specifically, T cells can develop different functional features during            MATERIAL AND METHODS
cancer growth, affecting the disease progression and/or regression.
The protective immunity is mediated by effector cells (Th1 and                   Patient Recruitment
Th17/Th1), and “not effector” T lymphocyte subsets (Th2, Tregs,                  In this observational study, 45 patients affected by nonmetastatic
Tnull) can promote colon cancer progression (9–11). In this                      colorectal adenocarcinoma at the preoperative stage for
scenario, the microbiota plays an important role as well because it              undergoing surgical resection were enrolled in 2018 at the
is essential to modulate immune responses favoring the equilibrium               Careggi University Hospital (Florence, Italy) (see Table 1 for a
between protective immunity and tolerance to commensal bacteria                  summary of patient characteristics). Exclusion criteria were
(12). A perturbation of the gut microbiota (GM) composition can                  extraperitoneal rectum localization of the tumor; previous
disrupt this balanced ecosystem, determining a chronic/abnormal                  surgery for cancer; previous chemo-radiotherapy treatment;
immune activation and supporting tumor growth. In fact, over the                 immunodeficiency; travel to exotic areas in the last 5 years;
past 10 years, both specific bacteria and dysbiotic conditions have               treatment with immunosuppressive drugs, antibiotics, or regular
been associated with or implicated in colorectal carcinogenesis (13,             probiotics during the previous 2 months; acute gastrointestinal
14) and, in some cases, through the interaction with the immune                  infections in the month prior to enrollment; and associated
system (15). In particular, the role of Fusobacterium nucleatum is               presence of established malignancies or chronic intestinal
paradigmatic because it promotes CRC by either the induction of                  inflammatory diseases (Crohn’s disease and ulcerative recto
epithelial cell proliferation (16), thus generating a proinflammatory             colitis). Tissue samples of tumor (CRC) and surrounding
microenvironment propitious to cancer progression (17), or via the               healthy mucosa (CRC-S) were obtained from the surgical
production of proteins able to block the cytotoxic antitumoral                   specimen after surgery. The study has received the local ethics
activity of T and NK cells (18, 19).                                             committee approval (CE: 11166_spe), and informed written
    Moreover, microbes can affect cancer cell antigenicity and                   consent has been obtained from each participant.
adjuvanticity (20), determining whether an antigen triggers an
immune response and if its nature drives the acquisition of a                    Immunological Analysis
specific T cell phenotype (effector or regulator). In addition,                   Analysis of Tissue Infiltrating Lymphocytes (TILs)
microbiota can elicit the production of cytokines (and other                     Tissue samples were dissociated with the Tumor Dissociation Kit,
immune mediators) by influencing the immunostimulatory or                         human (Miltenyi Biotech, UK) in combination with the
immunosuppressive reactions, such as the tendency to mount                       gentleMACS™ Octo Dissociator (Miltenyi Biotech, GmbH) to
Th1/Tc1 (characterized by IFN-g production), Th2/Tc2 (IL-4                       obtain a gentle and rapid generation of single-cell suspensions.
and IL-13), Th17/Tc17 (IL-17), or Th9 (IL-9) responses (21–23)                   Then, TILs were magnetically isolated with antihuman CD3

Frontiers in Immunology | www.frontiersin.org                                2                                   January 2021 | Volume 11 | Article 573158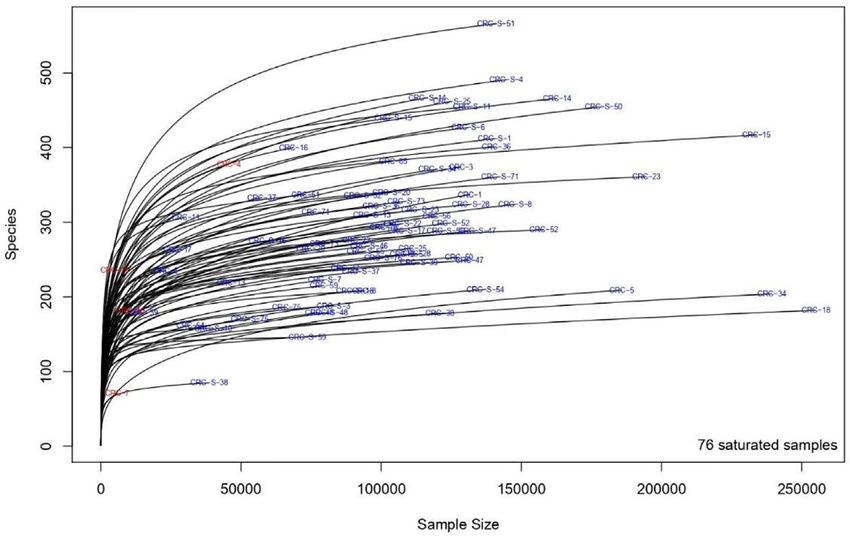
Niccolai et al.                                                                                 IL-9 Correlation With Prevotella and Bacteroides in CRC

TABLE 1 | CRC patients’ clinical features.

Patient ID                 Age                    Diagnosis                TNM               Stadium                                Site

CRC.1                     60-70                 Adenocarcinoma         pT2 N0                      I                 Splenic flexure
CRC.3                     70-80                 Adenocarcinoma         pT1 N0                      I                 Sigmoid colon
CRC.4                     40-50                 Adenocarcinoma         pT3a N1a                 IIIB                 Sigmoid colon
CRC.5                     30-40                 Adenocarcinoma         pT3 N0                     II                 Splenic flexure
CRC.6                     80-90                 Adenocarcinoma         T1 N0                       I                 Descending colon
CRC.7                     60-70                 Adenocarcinoma         pT3 N2b                  IIIC                 Ascending colon + splenic flexure
CRC.8                     70-80                 Adenocarcinoma         pT2 N0                      I                 Hepatic flexure
CRC.9                     80-90                 Adenocarcinoma         pT2 N0                      I                 Sigmoid colon
CRC.10                    80-90                 Adenocarcinoma         pT3 N0                     II                 Sigmoid colon
CRC.11                    70-80                 Adenocarcinoma         pT3 N0                     II                 Sigmoid colon
CRC.13                    70-80                 Adenocarcinoma         pT3 N0                     II                 Rectum
CRC.14                    60-70                 Adenocarcinoma         pT3 N0                     II                 Sigmoid colon
CRC.15                    80-90                 Adenocarcinoma         pT3 N1c                  IIIB                 Rectum
CRC.16                    70-80                 Adenocarcinoma         pT3 N0                     II                 Descending colon
CRC.17                    80-90                 Adenocarcinoma         pT1 N0                      I                 Sigmoid colon
CRC.18                    70-80                 Adenocarcinoma         pT2 N1b                  IIIA                 Cecum
CRC.20                    80-90                 Adenocarcinoma         pT3 N0                     II                 Rectum
CRC.22                    80-90                 Adenocarcinoma         pT3 N1a                  IIIB                 Rectum
CRC.23                    60-70                 Adenocarcinoma         T3 N1a G2                IIIB                 Splenic flexure
CRC.25                    50-60                 Adenocarcinoma         pT1 N0                      I                 Rectum
CRC.28                    70-80                 Adenocarcinoma         T2 N0                       I                 Ascending colon
CRC.30                    70-80                 Adenocarcinoma         pT3 N0                     II                 Ascending colon
CRC.32                    70-80                 Adenocarcinoma         T3 N0                      II                 Rectum
CRC.34                    70-80                 Adenocarcinoma         pT3 N0                     II                 Cecum
CRC.36                    70-80                 Adenocarcinoma         pT3 N0                     II                 Sigmoid colon
CRC.37                    40-50                 Adenocarcinoma         pT3 N1b                  IIIB                 Sigmoid colon
CRC.38                    50-60                 Adenocarcinoma         T0 N0                    NA                   Rectum
CRC.39                    70-80                 Adenocarcinoma         pT3 N0                     II                 Rectum
CRC.41                    60-70                 Adenocarcinoma         pT1 N0                      I                 Rectum
CRC.44                    80-90                 Adenocarcinoma         pT3 N0                     II                 Ascending colon
CRC.46                    70-80                 Adenocarcinoma         pT3 N1c                  IIIB                 Rectum
CRC.47                    60-70                 Adenocarcinoma         pT2 N0                      I                 Cecum
CRC.48                    40-50                 Adenocarcinoma         pT3 N0                     II                 Cecum
CRC.50                    60-70                 Adenocarcinoma         pT3 N0                     II                 Recto-sigmoid junction
CRC.51                    80-90                 Adenocarcinoma         pT3 N0                     II                 Descending colon
CRC.52                    60-70                 Adenocarcinoma         pT3 N0                     II                 Hepatic flexure
CRC.54                    70-80                 Adenocarcinoma         pT2 N0                      I                 Hepatic flexure
CRC.55                    70-80                 Adenocarcinoma         pT3 N0                     II                 Rectum
CRC.56                    60-70                 Adenocarcinoma         pT3 N0                     II                 Ascending colon
CRC.59                    70-80                 Adenocarcinoma         pT3 N1b                  IIIB                 Recto-sigmoid junction
CRC.65                    70-80                 Adenocarcinoma         pT2 N1c                  IIIA                 Rectum
CRC.71                    80-90                 Adenocarcinoma         pT2 N                       I                 Ascending colon
CRC.73                    50-60                 Adenocarcinoma         T3 N0                      II                 Sigmoid colon
CRC.75                    70-80                 Adenocarcinoma         T4b N0                     II                 Transverse colon
CRC.76                    70-80                 Adenocarcinoma         pT1 N0                      I                 Recto-sigmoid junction

microbeads (Miltenyi Biotech, UK) using the AutoMACS Pro                    For the detection of peripheral Tregs, TILs were fixed and
Separator (Miltenyi Biotech, GmbH) and analyzed by                          permeabilized using the BD Pharmingen Human FoxP3 Buffer
polychromatic flow cytometry. In detail, TILs from dissociated               Set (BD Biosciences). A minimum of 10,000 events were acquired.
tissues were characterized for the expression of CD4, CD8, CD25,
CD127, IFN-g, IL-4, IL-17, IL-9, IL-22, and FoxP3 using
intracellular cytokine staining. Briefly, TILs were cultured in              Molecular Inflammatory Response Evaluation
RPMI 1640 culture medium (SERO-Med GmbH, Wien)                              In a restricted court of patients (n=14) for whom the tissue was
supplemented with 10% FCS HyClone (Gibco Laboratories,                      available, we evaluated the tumor and healthy mucosa–
Grand Island, NY, USA) and stimulated for 5 h using the                     associated inflammatory response through the evaluation of 26
Leukocyte Activation Cocktail with BD GolgiPlug™ (BD                        cytokines by specifically assembled MixMatch Human kits for
Pharmingen). Cells were stained for surface antigens and then               Luminex MAGPIX detection system (Affymetrix, eBioscience)
fixed with 4% (v/v) paraformaldehyde and permeabilized with 0.5%             and following the manufacturers’ instructions. More specifically,
saponin, followed by intracellular staining with anti-IL-4, anti-IL-        we analyzed macrophage inflammatory protein-1a (MIP-1a),
17, anti-IL-22, anti-IL-9, and anti-IFN-g mAbs (BD Biosciences).            interleukin (IL)-27, IL-1b, IL-2, IL-4, IL-5, interferon gamma-

Frontiers in Immunology | www.frontiersin.org                          3                                   January 2021 | Volume 11 | Article 573158
Niccolai et al.                                                                                                 IL-9 Correlation With Prevotella and Bacteroides in CRC

induced protein 10 (IP-10), IL-6, IL-8, IL-10, IL-12p70, IL-13,                           Microbiota Characterization
IL-17A, granulocyte-macrophage colony stimulating factor                                  DNA Extraction
(GM-CSF), tumor necrosis factor-a (TNF-a), interferon                                     Genomic DNA was extracted using the DNeasy PowerLyzer PowerSoil
(IFN)-a, IFN-g, monocyte chemotactic protein 1(MCP-1), IL-                                Kit (Qiagen, Hilden, Germany) from frozen (-80°C) CRC and CRC-S
9, P-selectin, IL-1a, IL-23, IL-18, IL-21, soluble intercellular                          according to the manufacturer’s instructions. Briefly, tissues were added
adhesion molecule-1 (sICAM-1), and IL-22. The levels of                                   to a bead beating tube and thoroughly homogenized with TissueLyser
cytokines were estimated using a 5-parameter polynomial                                   II for 5 min at 30 Hz. Total genomic DNA was captured on a silica
curve (ProcartaPlex Analyst 1.0).                                                         membrane in a spin column format and subsequently washed and
   The low and upper limit of quantification (LLOQ and ULOQ)                               eluted. The quality and quantity of extracted DNA was assessed using
used for the cytokines and chemokines are reported in Table 2. A                          the NanoDrop ND-1000 (Thermo Fisher Scientific, Waltham, US) and
value under the LLOQ was considered to be 0 pg/ml.                                        the Qubit Fluorometer (Thermo Fisher Scientific), respectively. Then,
                                                                                          genomic DNA was frozen at -20°C.
Statistical Analysis of Immunologic Data
Statistical analysis was performed with SPSS statistical software                         Bioinformatic Analysis of 16S rRNA
(version 24). Differences between T cells subset data obtained                            Extracted DNA samples were sent to IGA Technology Services
from CRC and CRC-S samples and tissue cytokine levels                                     (Udine, Italy), where amplicons of the variable V3–V4 region of the
evaluated in the same groups were assessed with paired                                    bacterial 16s rRNA gene were sequenced in paired-end (2 × 300)
Wilcoxon signed-rank tests. P values less than 0.05 were                                  cycles on the Illumina MiSeq platform, according to the Illumina
considered statistically significant.                                                      16S Metagenomic Sequencing Library Preparation protocol (30).
                                                                                             Raw sequences were processed following the software pipeline
                                                                                          MICCA (31). Paired-end reads were assembled using the
                                                                                          “mergepairs” command, maintaining a minimum overlap of
TABLE 2 | Low and Upper Limit of Quantification (LLOQ and ULOQ) for each
                                                                                          100 bp and an edit distance in the maximum overlap of 32 bp.
evaluated cytokine/chemokine.
                                                                                          Subsequently, the sequences were cut with the “trim” command
Cytokine/chemokine               ULOQ (pg/ml)                  LLOQ (pg/ml)               to remove the primers and eventually eliminate the reads with
                                                                                          imperfect primer sequences. All the reads with a length lower
MIP-1a                                1880                   1,84
                                                                                          than 350 bp and with an error rate higher than or equal to 0.5
IL-27                                 82000                   20
                                                                                          were removed with the “filter” command.
IL-1b                                 8250                   2,01
                                                                                             Clean reads were eventually merged into a single file with the
IL-2                                  26900                  6,57
                                                                                          “merge” command and transformed into a FASTA format file.
IL-5                                  30400                  7,42
                                                                                          The operational taxonomic units (OTUs) were generated using
IP-10                                 7750                   1,89
                                                                                          the “otu” command in “denovo_greedy” mode, setting a 97%
IL-6                                  37800                  9,23                         identity and performing an automatic removal of chimeras with
IL-8                                  9850                    2,4                         the “-c” option. The longest sequence of each OTU was used for
IL-17A                                9550                   2,33                         taxonomic assignment using the “classify” command in “rdp”
IFN- g                                12675                   12                          mode, i.e., using the RDP Bayesian classifier that is able to obtain
GM-CSF                                41000                   10                          classification and confidence for taxonomic ranks up to genus.
TNF-a                                 29500                   7,2
MCP-1                                 14800                  3,61
                                                                                          Statistical Analysis of Bacterial Communities
IL-9                                  31000                  7,57
                                                                                          Statistical analyses on the bacterial communities were performed
IL-1a                                 3000                   0,73
                                                                                          in R (R Core Team, 2014) with the help of the packages phyloseq
IL-18                                 49500                   12                          1.26.1 (32), DESeq2 1.22.2 (33), breakaway 4.6.16 (34, 35), and
IL-21                                 39700                  9,69                         other packages satisfying their dependencies—in particular,
IL-22                                 82500                   20                          vegan 2.5-5 (36). Rarefaction analysis on OTUs was performed
P-selectin                          5051600                  1233                         using the function rarecurve (step 50 reads) and further
sICAM1                               870200                  212                          processed to highlight saturated samples (arbitrarily defined as
IL-4                                  36200                  8,84                         saturated samples with a final slope in the rarefaction curve with
IL-10                                 9250                   2,26                         an increment in OTU number per reads < 1e-5).
IL-12p70                              28100                  6,86                            For the cluster analysis (complete clustering on Euclidean
IL-13                                 13400                  3,27                         distance) of the entire community, the OTU table was first
IL-23                                 68500                   17                          normalized using the total OTU counts of each sample and
IFN-a                                 2250                   0,55                         then adjusted using square root transformation.
                                                                                             The coverage was calculated by Good’s estimator (37) using
MIP, Macrophage Inflammatory Proteins; IL, Interleukin; IP, Interferon gamma-induced
                                                                                          the formula: (1 - n/N) × 100, where n is the number of sequences
protein; IFN, Interferon; GM-CSF, Granulocyte-Macrophage Colony-Stimulating Factor;
TNF, Tumor necrosis factor; MCP, Monocyte Chemoattractant Protein; sICAM1, soluble        found once in a sample (singletons) and N is the total number of
Intercellular Adhesion Molecule.                                                          sequences in that sample.

Frontiers in Immunology | www.frontiersin.org                                         4                                    January 2021 | Volume 11 | Article 573158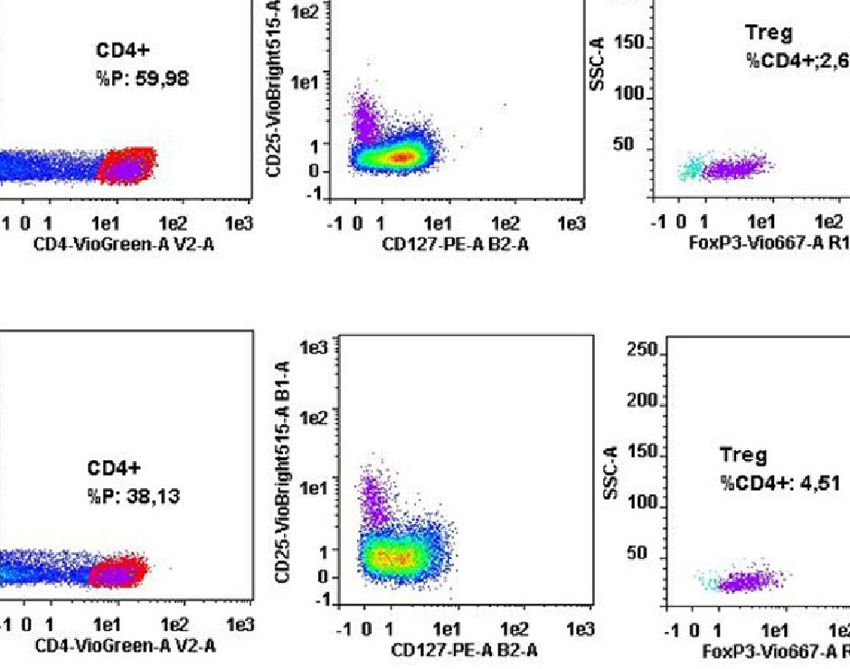
Niccolai et al.                                                                                   IL-9 Correlation With Prevotella and Bacteroides in CRC

    Richness, Shannon, Chao 1, and Evenness indices were used                significantly. In detail, the mean percentages (SD) of CD4+ cells
to estimate bacterial diversity in each sample using the function            were 58.03 (6.88) in CRC vs. 58.15 (6.32) in CRC-S and the mean
estimate_richness from phyloseq (31). The evenness index (38)                percentages of CD8+ T cells were 17.42 (5.65) in CRC vs. 14.39
was calculated using the formula E = S/log(R), where S is the                (4.14) in CRC-S.
Shannon diversity index and R is the number of OTUs in the                       The analysis of the T cell subsets revealed that the tumor mucosa
sample. Differences in all indices between CRC and CRC-S were                sample group displayed higher percentages of Th17 (CRC vs. CRC-
tested using a paired Wilcoxon signed-rank test. Sample richness             S: 10.02 (4.32) vs. 5.13 (1.39); p=0.0008), Th2 (CRC vs. CRC-S: 3.45
was further measured using the estimator and its associated error            (1.31) vs. 1.41 (0.93); p=0.0011), and Treg (CRC vs. CRC-S: 4.08
introduced in the breakaway package (32). The function                       (1.44) vs. 2.10 (0.57); p=0.0040) as shown in Figures 1A, C.
betta_random of the breakaway package was further used to                    Regarding the T cytotoxic cells, the CRC group showed higher
evaluate the statistical differences in richness between paired-by-          percentages of Tc17 (CRC vs. CRC-S: 6.33 (3.98) vs. 1.77 (1.00),
patient CRC and CRC-S samples.                                               p=0.0036), Tc1/Tc17 (CRC vs. CRC-S: 6.25 (4.74) vs. 1.88
    The differential analysis of abundance was performed with                (1.48), p=0.0022), and Tcreg (CRC vs. CRC-S: 1.08 (0.81) vs. 0.06
DESeq2 (31) at the OTUs and at the different taxonomic ranks                 (0.08), p=0.0055) (Figure 1B). Notably, the number of Th9s is
(created using the tax_glom function in phyloseq) by using a                 major (but not significant) in CRC tissue, and the Tc9s are similar in
two-group blocked-by-patient design to perform a paired test.                the two different sites.

Statistical Analysis of the Association                                      Molecular Inflammatory Profile in CRC-
Between Tissue Microbiota and Cytokines                                      Associated Tissues
The association between tissue microbiota and cytokines was                  We compared the molecular inflammatory profile of the
investigated with a 2-step analysis separately for the mucosa                homogenized CRC and CRC-S of 14 cancer patients through
and tumor tissues. In the first step, we implemented a modified                the evaluation of 26 pro- and anti-inflammatory cytokines. Six of
version of the sure independence screening (SIS) procedure (39).             the evaluated cytokines (IL-4, IL-10, IL12p70, IL-13, IL-23, and
SIS uses the notion of marginal correlation—in our case, the                 IFN-a) were under the LLOQ (Table 2) in all samples either
correlation of a single cytokine with the dependent variable—to              because levels were very low (not detectable) or these molecules
rank the cytokines. The cytokines with the smallest p-value from a           are not produced. The other 20 cytokines showed a common trend
Dirichlet regression (40) with that given cytokine as the only               in all patients, characterized by higher levels in CRC compared to
predictor are included in step 2. For each cytokine, the p-value is          CRC-S. In particular, IL-1b, IL-2, IFN-g, P-selectin, MIP-1a, IL-6,
obtained testing the model with the considered cytokine and the              IL-17A, TNF-a, MCP-1, IL-9, IL-1a, IP-10, and IL-8 were
intercept against a model with only the intercept with a likelihood-         increased significantly in CRC compared to CRC-S (Figure 2),
ratio test. Step 1 is necessary only when the list of cytokines is too       whereas IL-27, IL-21, IL-22, IL-18, IL-5, GM-CSF, and sICAM1
long compared with the sample size; in our analysis, we selected             showed a similar but not significant trend (p > 0,05).
the three most relevant cytokines from step 1.
    In the second step, we used Dirichlet multinomial regression to          Comparison of Mucosal Microbiota
determine the joint effect of cytokines on the tissue microbiota. We         Composition in CRC and CRC-S
implemented a Bayesian variable selection (BVS) method based on              Our sequencing efforts in assessing microbiota composition
a thresholding function (41). This approach is based on a Monte              encompassed a total of 12,475,251 reads for 40 sample pairs.
Carlo Markov chain algorithm that explores the space of possible             After all the preprocessing steps, which included pair merging,
models. The method’s output is a list of posterior probability of            trimming, quality filtering, and chimera detection, a total of
inclusion (PPI) and the posterior mean of the nonzero regression             8,458,126 (67.8%) were available for further analysis.
coefficients. PPI is the probability, between 0 and 1, that a given              Saturation curves (Figure 3) revealed that most specimens
association cytokine-genera is nonzero, accounting for the effect of         were sufficiently sampled. Samples showed a Good’s coverage
all other cytokines. The posterior mean is an estimate of a nonzero          ranging from 99% to 100%, indicating that less than 1% of the
association. Each estimated regression coefficient evaluates the              reads in a given sample came from OTUs that appeared only
taxon–cytokine association, whose sign and magnitude measure                 once in that sample.
the effect of the cytokine on the taxon.                                        As shown in Figure 4, the alpha diversity of samples did not
                                                                             display significant differences for Shannon index and Evenness.
                                                                             On the contrary, a significant (p = 0.011) Chao1 index evidenced
RESULTS                                                                      that rare OTUs are enriched in CRC-S vs. CRC, denoting a
                                                                             higher diversity.
Assessment of Tissue Infiltrating T Cell                                         Taxonomic analysis detailed in Table 3 reveals for the 2454
Subset Distribution in Healthy and Cancer                                    OTUs formed the confident (99% reads), 50 classes (>98% reads), 87 orders (>98% of reads),
We performed polychromatic flow cytometry analysis of TILs                    176 families (>96% reads), and 372 genera (>86% reads).
isolated from the dissociated CRC and CRC-S. The percentage of                  To investigate and confirm the paired nature of sampling (i.e.,
CD4+ and CD8+ TILs in the mucosa sample group did not differ                 tumor tissue vs. surrounding healthy tissue), we performed a cluster

Frontiers in Immunology | www.frontiersin.org                            5                                   January 2021 | Volume 11 | Article 573158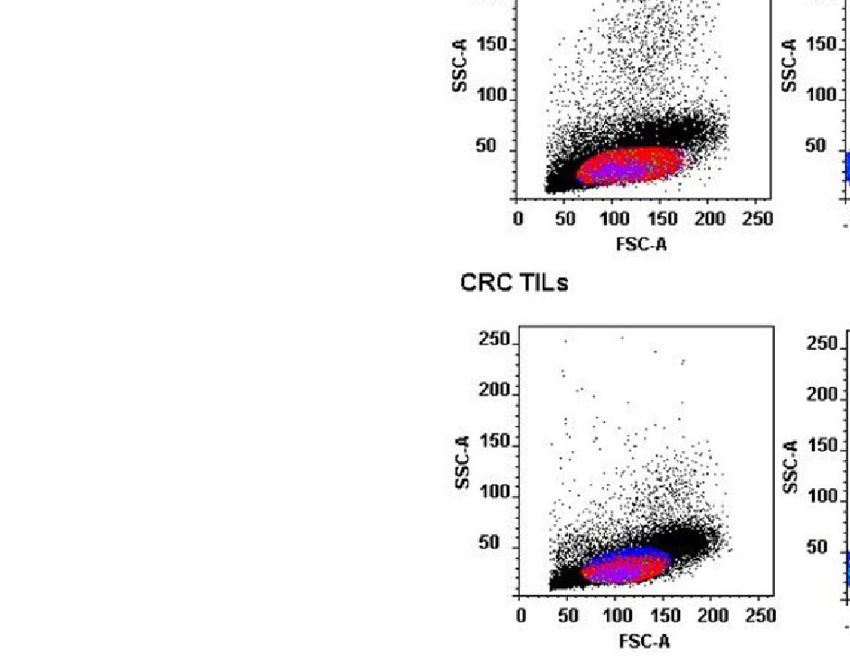
Frontiers in Immunology | www.frontiersin.org
Niccolai et al.
A B
C
6
IL-9 Correlation With Prevotella and Bacteroides in CRC
January 2021 | Volume 11 | Article 573158
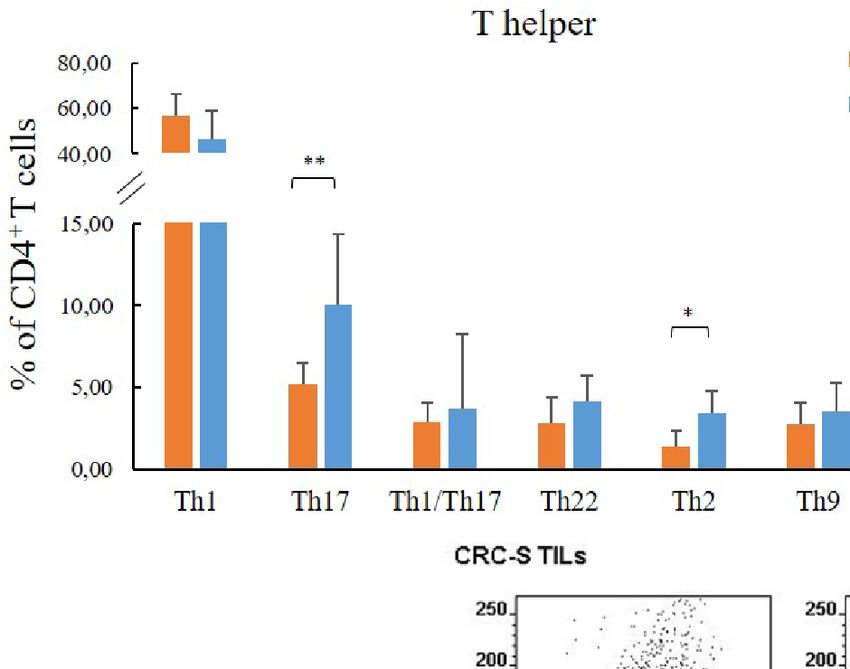
FIGURE 1 | T cell subset distribution in the tumor mucosa and surrounding healthy mucosa samples groups. Panel (A) reports the mean percentages (+SD) of T helper subsets with respect to the percentage of
CD4+ T cells, and panel (B) reports the mean percentages (+SD) of T cytotoxic subsets with respect to the percentage of CD8+ T cells. Panel (C) reports the cytofluorimetric analysis of T regulatory cells in the
tumor mucosa and surrounding healthy mucosa samples of one representative patient. Statistical analyses were calculated using Wilcoxon signed-rank test. The asterisks (*) represent p-values, *p < 0.01,
**p < 0.001. CRC = tumor mucosa; CRC-S = healthy mucosa.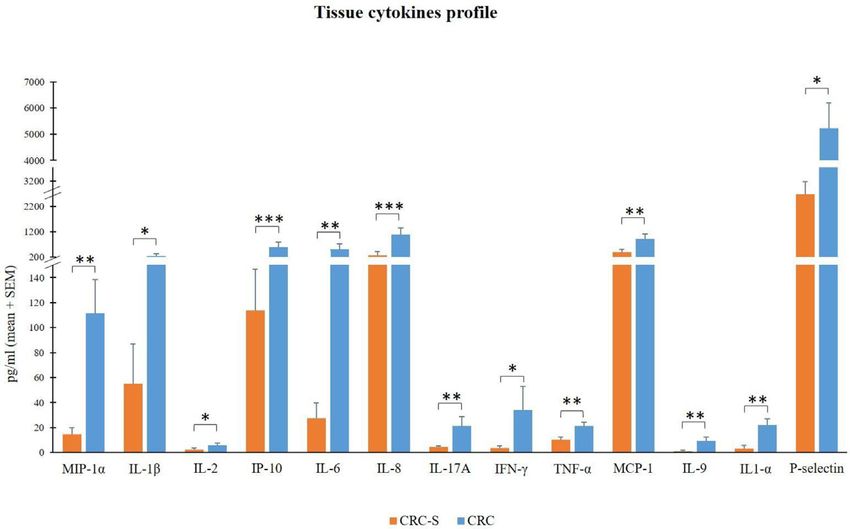
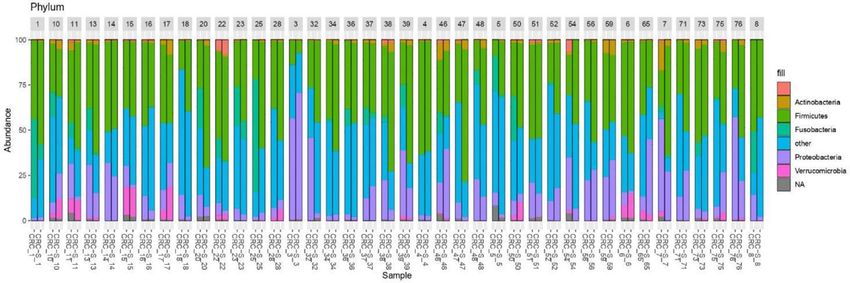
Niccolai et al.                                                                                             IL-9 Correlation With Prevotella and Bacteroides in CRC

 FIGURE 2 | Tissue cytokine levels in 14 CRC patients. The histogram reports the mean (+SEM) cytokine levels (pg/ml) of the evaluated cytokines in CRC-S and
 CRC of 14 CRC patients. Wilcoxon signed-rank test was performed to test the differences between CRC-S and CRC paired samples. A p-value < 0.05 is
 considered statistically significant. The asterisks (*) represent p-values, *p < 0.05, **p < 0.01, ***p < 0.001. CRC-S= healthy mucosa; CRC= tumor mucosa.

 FIGURE 3 | Rarefaction curves showing the level of saturation of OTUs.

analysis on normalized OTU counts. As shown in Figure 5, we                            The paired comparison of the abundance of single OTUs
verified that 36/40 paired samples were, in effect, also paired in                   revealed significant (adj. p=1) differences
terms of microbial composition, a result robust to changes in                       between CRC and CRC-S sample groups with 6.6% OTUs
distance metrics (e.g., Bray-Curtis) and the clustering method                      involved. At the phylum level, Fusobacteria and Proteobacteria
(data not shown). The analysis of the taxonomic composition                         were significantly higher in CRC compared to CRC-S (logFC =
reported that 6 phyla dominated the data set (98% sequences),                       -2.92, adj. p = 6.17e-15 and logFC = -0.95, adj. p = 1.92e-05,
namely Firmicutes (41.24%), Bacteroidetes (35.89%), Proteobacteria                  respectively). At the genus level, 14.7% genera were observed as
(13.37%), Fusobacteria (4.68%), Verrucomicrobia (2.10%), and                        significantly (adj. p=1) different, the most
Actinobacteria (1.56%) as shown in Figure 6. Stacked boxplots of                    abundant being Fusobacterium (average OTUs 6199, log2FC =
taxa abundance at different taxonomic ranks are available as                        -2.93, adj. p = 1.06e-08), Ruminococcus2 (Lachnospiraceae
(Supplementary Figures S1–S4).                                                      family, average OTUs 2911, log2FC = 1.31, adj. p = 1.38e-3),

Frontiers in Immunology | www.frontiersin.org                                   7                                      January 2021 | Volume 11 | Article 573158
Niccolai et al.                                                                                              IL-9 Correlation With Prevotella and Bacteroides in CRC

 FIGURE 4 | Boxplots showcasing alpha diversity indices (Chao1 index, Shannon index, Evenness, and Breakaway) in CRC and CRC-S samples. Statistical
 differences were evaluated using paired Wilcoxon signed-rank test for Chao, Shannon, and Evenness indices and using the paired betta analysis implemented in the
 Breakaway R package. P-values less than 0.05 were considered statistically significant.

TABLE 3 | Summary of the taxonomic analysis of the obtained OTUs.

Rank                           Count                          Reads                            Reads.                          OTU                          OTU%

Phylum                          29                           8205619                            99.58                          2325                          94.74
Class                           50                           8146401                            98.86                          2234                          91.04
Order                           87                           8114962                            98.48                          2177                          88.71
Family                          176                          7919409                            96.11                          1934                          78.81
Genus                           372                          7107700                            86.26                          1290                          52.57

 FIGURE 5 | Cluster analysis on normalized OTU counts.

and Ruminococcus (Ruminococcaceae family, average OTUs                              top-ranked cytokines were IL-18, IFN-g, IL-5, and IL-2. Using
1640, log2FC = 1.82, adj. p = 4.12e-05).                                            these four cytokines (plus the intercept), we ran the BVS method
                                                                                    (step 2). In the tumor tissues, we detected the association
Correlation of the Cytokine Profile With                                             between IL-5 and Prevotella spp. with a PPI=0.81; the same
the Microbiota Composition in CRC-                                                  association was found to be supported by the data collected
Associated Tissues                                                                  from the mucosa tissues as well (PPI=0.77). The effect of IL-5
To evaluate this critical and crucial point, we first applied the SIS                on Prevotella is estimated to be positive and equal to 0.64
screening procedure (step 1). We considered the OTU counts of                       (posterior mean) and 0.86 for tumor and mucosa tissues,
the three most abundant genera and aggregated all other genera                      respectively. However, this analysis hardly describes the entire
in a residual category. Our dependent variable was then defined                      picture because many cytokines with very small p-values in
by four categories: Bacteroides spp., Prevotella spp., and                          the first step were not included in the second step due to
Escherichia/Shigella spp. (plus the residual category). The four                    computational constraints.

Frontiers in Immunology | www.frontiersin.org                                   8                                       January 2021 | Volume 11 | Article 573158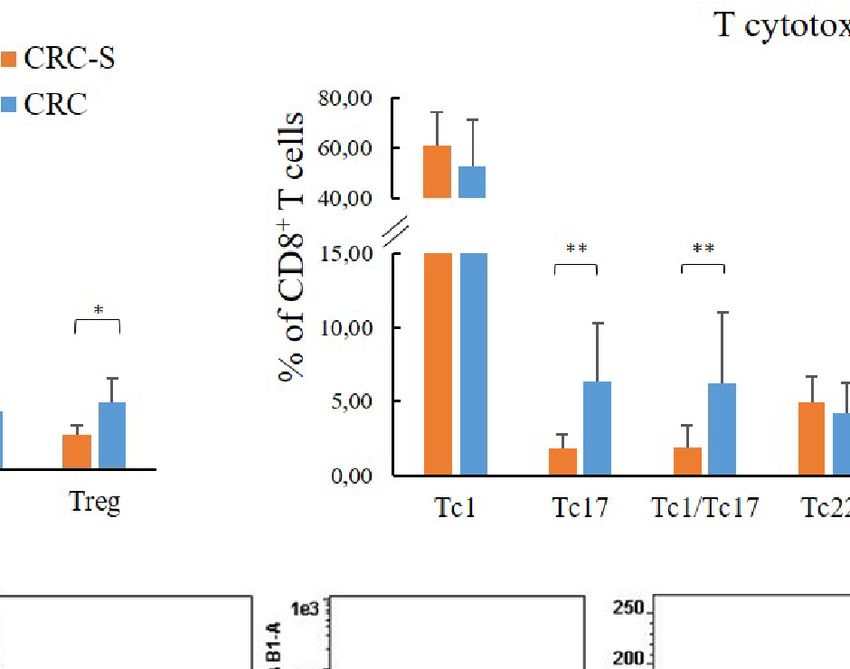
Niccolai et al.                                                                                            IL-9 Correlation With Prevotella and Bacteroides in CRC

 FIGURE 6 | Stacked boxplots of microbial composition at phylum level of CRC and CRC-S samples.

    Moreover, we decided to perform a second analysis that includes               TABLE 5 | Posterior mean of the regression coefficients.
directly into step 2 the cytokines that showed differential
                                                                                              Prevotella     Bacteroides           Escherichia/         Residual
abundances in comparative analysis between CRC and CRC-S                                         spp.           spp.               Shigellaspp.         category
samples. However, due to the computational constraints that
impose a limit on the sample size, we selected some of the                        intercept     -1.10             0.41                 -0.93              1.90
cytokines that were significantly increased in CRC compared to                     IFN-g         -0.05             0.00                  0.31              0.00
                                                                                  IL-17A        -1.08             0.00                  0.00              0.00
CRC-S samples, according to their relevance in the current                        IL-8          0.00              0.00                  0.00              0.00
literature. In particular, we chose IFN-g, IL-17A, IL-8, IL-1b, IL-               IL-1b         0.00              0.00                  0.00              0.00
1a, IP-10, MIP-1a, and IL-9. The results of the BVS Dirichlet                     IL-1a         0.00              0.00                  0.00              0.00
multinomial regression (step 2) are reported in Tables 4 and 5.                   MIP-1a        0.00              0.00                  0.00              0.00
                                                                                  IP-10         0.00              0.00                 -0.89              0.00
From the results, we notice that Prevotella spp. is associated with
                                                                                  IL-9          1.37             -0.91                  0.00              0.00
both IL-17A and IL-9. The first association is negative, and the effect
is 1.08 (posterior mean), whereas the second is positive, with a
posterior mean of 1.37. Bacteroides spp. and Escherichia/Shigella                 cancer relapse, metastasis, and worse prognosis (42, 43)
spp. show a negative association with IL-9 and IP-10, respectively,               although, according to existing contradictory evidence, excess
with posterior means equal to -0.91 and -0.89, respectively.                      inflammation caused by CD4+ and CD8+ IL-17-producing T
                                                                                  cells or the immunosuppression induced by Tregs may lead to
                                                                                  carcinogenesis (44, 45). Indeed, tumor-infiltrating Th17 and
                                                                                  Tc17 cells have been found in various human cancers,
DISCUSSION                                                                        confirming their protumorigenic properties (46, 47). According
                                                                                  to our results, different studies found higher percentages of Th17
In this study, we first explored the immunity–microbiota axis in                   and Tc1/Tc17 cells in tumor tissues compared to adjacent
human CRC, comparing the distribution of TILs, the cytokine                       nontumor tissues (48–50). Through their immunosuppressive
profile, and the GM composition in cancerous and surrounding                       properties, Tregs can favor immune escape mechanisms of
mucosa. In agreement with our previous findings (11), the TIL                      tumor cells, and that is why high amounts of peripheral or
assessment revealed higher percentages of tumor-supporting T                      tumor-infiltrating Tregs are often associated with poor clinical
cell subsets (Th17, Th2, Th9, and Tregs) in CRC samples                           outcome in gastrointestinal cancer (51, 52). According to our
compared to CRC-S. Contextually, a Th2 shift in the tumor                         findings, a high number of tumor-infiltrating Tregs is widely
microenvironment, especially for CRC, strongly contributes to                     documented (53–55).
                                                                                      Finally, Th9 cells, a relatively new subset, seem to have a dual
                                                                                  role in tumor progression. Generally, the Th9 cells (activating both
TABLE 4 | Posterior probabilities of inclusion (PPIs).
                                                                                  the innate and adaptive immune responses) and the Tc9s play an
                  Prevotella   Bacteroides          Escherichia/   Residual       important role in antitumor immunity (56, 57), but IL-9 can exert
                     spp.         spp.              Shigellaspp.   category       a tumorigenic role in both hematological and solid tumors (58).
                                                                                      In addition to the TIL analysis, although many studies
intercept           1.00          1.00                   1.00        1.00
IFN-g               0.10          0.00                   0.45        0.00         investigate the levels of several plasma cytokines in CRC
IL-17A              0.82          0.00                   0.00        0.00         patients (59–62), we assessed for the first time the molecular
IL-8                0.00          0.00                   0.00        0.00         inflammatory profile of CRC mucosa through the evaluation of
IL-1b               0.00          0.00                   0.00        0.00         an exhaustive panel of 26 cytokines of which 20 were increased in
IL-1a               0.00          0.00                   0.00        0.00
MIP-1a              0.00          0.00                   0.00        0.00
                                                                                  CRC compared to CRC-S. In particular, CRC samples revealed
IP-10               0.00          0.00                   0.77        0.00         significantly higher levels of MIP-1a, IL-1b, IL-2, IP-10, IL-6, IL-
IL-9                0.95          0.83                   0.00        0.00         8, IL-17A, IFN-g, TNF-a, MCP-1, IL-1a, P-selectin, and IL-9.

Frontiers in Immunology | www.frontiersin.org                                 9                                       January 2021 | Volume 11 | Article 573158
Niccolai et al. IL-9 Correlation With Prevotella and Bacteroides in CRC
The relevant higher percentages of chemokines MCP-1, MIP- identify the four top-ranked cytokines (IL-18, IFN-g, IL-5, and
1a, IL-8, and IP-10 reflect the high colonic inflammation, and IL-2) that we used to run the BVS method. Although these
many studies demonstrate their role in the development of a analyses cannot adequately describe the complex scenario of the
tumor-favoring microenvironment due to their abilities to favor relationship between secreted cytokines and intestinal
angiogenesis and to stimulate macrophages and CD8+ T cell composition, we observed a positive association between IL-5
recruitment in situ (63–65). In accordance with our results, and Prevotella spp. in both tumor and mucosa tissues.
different studies found high levels of these chemokines in CRC As is well known, IL-5 is essential for eosinophil
tissues (66–68). differentiation, and eosinophilia has been observed in various
In addition, the cytokines IL-1a, IL-1b, IL-6, IL-17A, and cancers, including CRC, with a controversial prognosis link.
TNF-a promote tumor initiation, progression, angiogenesis, and Eosinophil infiltration is considered unfavorable in Hodgkin’s
metastasis in many human malignancies, including CRC (69– lymphoma but positive in breast and prostate cancers (99). As
71), and our findings are consistent with previous studies recently reviewed (100), higher numbers of infiltrating
(72–75). eosinophils detected in CRC tissue were repeatedly shown to
Finally, although the overexpression of IFN-g in CRC tissues be prognostically favorable (101–103), but the mechanisms of
can be considered positive (for its established robust antitumor CRC growth inhibition remain poorly understood. A recently
activity) (76, 77), IL-2 and IL-9 display both pro- and developed CRC mouse model shows that tumor-homing
antitumor potentials (78, 79). About IL-9, in contrast with eosinophils secrete chemoattractants for CD8+ effector T cells,
our results, Wang et al. show that IL-9 is less expressed in eventually causing tumor rejection (104).
human colon carcinoma (80). Nevertheless, Huang et al. report Furthermore, abundant IL-5 levels are documented in the
low IL-9 amounts in CRC patients, but these low levels are synovium of rheumatoid arthritis patients (105), and notably,
associated with tumor progression (81). Interestingly, Tian and Scher et al. show that the presence of Prevotella copri is strongly
colleagues show that IL-9 expression in colitis-associated correlated to rheumatoid arthritis (106). Therefore, taking into
cancer tissue is significantly higher than that in adjacent account all these reported data, our results—showing a positive
tissues, and Lentiviral vector–mediated IL-9 overexpression in correlation between IL-5 and Prevotella spp.—and the IL-5 anti-
the colon cancer cells lines RKO and Caco2 could promote their inflammatory role, we can assume an attempt to restore a eubiotic
proliferation (82). ecosystem in the colon mucosa contrasting the CRC development.
The relationship between CRC development and GM In the BVS method, we include all cytokines that show
imbalance has been well established in past years (83–85), differential abundances in the comparative analysis of CRC
and numerous studies document distinct fecal and mucosal and CRC-S: IFN-g, IL-17A, IL-8, IL-1b, IL-1a, IP-10, MIP-1a,
microbiota profiles in CRC patients compared with healthy and IL-9. For the first time, we find that, again, Prevotella spp. is
subjects (86–88). Indeed, CRC-associated microbiota profiles negatively associated with IL-17A but positively related to IL-9.
differ from those in healthy subjects (87), and a brilliant meta- In addition, Bacteroides spp. and Escherichia/Shigella spp. show a
analysis of eight geographically and technically diverse fecal negative association with IL-9 and IP-10, respectively.
shotgun metagenomic studies of CRC identifies a peculiar colon Despite the negative correlation between Prevotella spp. and
cancer signature (88). Hence, we characterized the microbiota IL-17A, it has recently been discovered that Prevotellaceae are
composition of tumor and adjacent healthy mucosa in the able to promote Th17 cell differentiation, and Prevotella spp. are
enrolled CRC patients, and according to previous findings, a associated with Th17-mediated diseases, including periodontitis
significant Chao1 index evidences that rare OTUs are enriched and rheumatoid arthritis (107). These conflicting data could be
in CRC-S vs. CRC (89, 90). We also confirm our recent data explained by speculating that the same bacterial taxa, in different
(86), demonstrating that Fusobacteria and Fusobacterium spp. environmental conditions, may exert contrasting effects.
are associated with CRC and are amplified during colorectal However, we cannot exclude that contrasting results may
carcinogenesis (91–93), and we find a significantly higher derive from the relatively low level of taxonomic resolution of
percentage of Proteobacteria in CRC, according to evidence 16S rRNA gene metagenomics, which cannot fully discriminate
that an imbalanced GM is often associated with a sustained between different species of the same genus (as Prevotella spp.).
increase in Proteobacteria phylum members (94, 95). Indeed, different Prevotella species colonize the human body
Consistent with Weir et al (96), we find that Ruminococcus districts. The periodontal Prevotella spp. related to Th17 cell
spp. are more represented in CRC even if some authors report stimulation could not be subdued to a dysbiotic environment,
that, in CRC patients, Ruminococcus spp. have low prevalence such as the inflamed CRC mucosa. In addition, in a study in
(97, 98). which Prevotella histicola was used to modulate immune
Moreover, to explore the mucosal microbiota–local immune response and treat arthritis in a humanized mouse model,
response axis, we correlate—for the first time—the cytokine Marietta et al. report that treated mice showed significantly
profile and GM composition using BVS Dirichlet multinomial lower levels of IL-17 in agreement with our data. The authors
regression. The application of the SIS screening procedure and also report decreased level of IL-9 as compared to placebo-
the OTU counts of the three most abundant genera (Bacteroides treated mice in contrast with our results (108). Finally,
spp., Prevotella spp., Escherichia/Shigella spp., and all other Campisciano (109) detected an increase of the relative vaginal
genera aggregated in a residual category), allowed us to abundance of Prevotella timonensis in women infected with
Frontiers in Immunology | www.frontiersin.org 10 January 2021 | Volume 11 | Article 573158Niccolai et al. IL-9 Correlation With Prevotella and Bacteroides in CRC
HPV, which showed a decreased concentration of the IL-15, IL- and accession number(s) can be found in the article/
7, and IL-9 that they associated with the virus infection. Supplementary Material.
Regarding the negative correlation between Bacteroides spp.
and IL-9, we have not found studies documenting this
association, but because it is well known that IL-9 is produced
by Th17, we have indirect evidence of this correlation. Round ETHICS STATEMENT
et al. find that Bacteroides fragilis inhibits Th17 development, The studies involving human participants were reviewed and
inducing Treg accumulation, and Vaahtovuo et al. demonstrate approved by Comitato Etico Area Vasta Toscana Centro. The
the lower abundance of Bacteroides spp. in rheumatoid arthritis patients/participants provided their written informed consent to
patients (110, 111). participate in this study.
Our results also show that Escherichia/Shigella spp. are
negatively correlated with the IP-10 that is induced in many
viral, bacterial, and parasite infections, i.e., shigellosis and E. coli
infection (112, 113). Because IP-10 is increased in CRC samples, AUTHOR CONTRIBUTIONS
the negative correlation between Escherichia/Shigella spp. also
can be supported. EN, ER, SB, and AA conceived and designed the study, and
In conclusion, our data describe a clear dissimilarity of the drafted the paper. EN, FR, and GN acquired experimental data of
cellular and molecular inflammatory profile and intestinal immune response. ER, AM, RF, GB, CF, and CC acquired
microbiota composition between the tumor and the adjacent experimental data of microbiota. AT and MNR were involved
healthy tissue, displaying the generation of a peculiar CRC in enrolment and obtaining clinical data of patients. MP and FS
microenvironment. The infiltrating T cell features and the are responsible for the statistical analysis. MR is responsible for
higher percentages of several cytokines produced in the tumor bioinformatics’ analysis of microbiota. EN, SB, FS, MR, and AA
tissue document that, among all different types of immune cells analyzed and interpreted the data. AA, PB, and DP critically
involved in the complex anticancer responses, some may even revised the paper. All authors contributed to the article and
encourage neoplastic progression. In addition, the distinct approved the submitted version.
microbiota CRC profile may suggest that microbial
communities can drive and modulate the antitumor immune
response. In fact, we show—for the first time in human CRC— ACKNOWLEDGMENTS
that Prevotella and Bacteroides species are correlated positively
and negatively, respectively, with the IL-9 that has an intriguing The authors thank all CRC patients enrolled at the Unit of
and still debated role in tumor immunity. We are aware that Surgery, University Hospital of Careggi (AOUC), University of
other studies in humans and in animal models are needed, but Florence, and the healthy controls. We also thank Regione
the observed correlation of the cytokine signature with the GM Toscana that supported the study (The Programma Attuativo
composition confirm the presence of bidirectional crosstalk Regionale Toscana funded by FAS) N. MICpROBIMM. We
between the immune response and the host’s commensal thank Dr. Mascha Stroobant for the language manuscript editing.
microorganisms, which may influence cancer development.
SUPPLEMENTARY MATERIAL
DATA AVAILABILITY STATEMENT
The Supplementary Material for this article can be found online
The datasets presented in this study can be found in online at: https://www.frontiersin.org/articles/10.3389/fimmu.2020.
repositories. The names of the repository/repositories 573158/full#supplementary-material
5. de Visser KE, Eichten A, Coussens LM. Paradoxical roles of the immune
REFERENCES system during cancer development. Nat Rev Cancer (2006) 6:24–37. doi:
1. Siegel RL, Miller KD, Jemal A. Cancer Statistics, 2017. CA Cancer J Clin 10.1038/nrc1782
(2017) 67:7–30. doi: 10.3322/caac.21387 6. Hnatyszyn A, Hryhorowicz S, Kaczmarek-Ryś M, Słomski R, Scott RJ, Pławski A.
2. Song M, Emilsson L, Bozorg SR, Nguyen LH, Joshi AD, Staller K, et al. Risk Colorectal carcinoma in the course of inflammatory bowel diseases. Hered
of colorectal cancer incidence and mortality after polypectomy: a Swedish Cancer Clin Pract (2019) 17:18. doi: 10.1186/s13053-019-0118-4
record-linkage study. Lancet Gastroenterol Hepatol (2020) 5(6):537–47. 7. Jess T, Frisch M, Simonsen J. Trends in overall and cause-specific mortality
doi: 10.1016/S2468-1253(20)30009-1 among patients with inflammatory bowel disease from 1982 to 2010. Clin
3. Fridman WH, Pagès F, Sautès-Fridman C, Galon J. The immune contexture Gastroenterol Hepatol (2013) 11:43–8. doi: 10.1016/j.cgh.2012.09.026
in human tumours: impact on clinical outcome. Nat Rev Cancer (2012) 8. Schreiber RD, Old LJ, Smyth MJ. Cancer immunoediting: integrating
12:298–306. doi: 10.1038/nrc3245 immunity’s roles in cancer suppression and promotion. Science (2011)
4. Galon J, Pagès F, Marincola FM, Angell HK, Thurin M, Lugli A, et al. Cancer 331:1565–70. doi: 10.1126/science.1203486
classification using the Immunoscore: a worldwide task force. J Transl Med 9. Tosolini M, Kirilovsky A, Mlecnik B, Fredriksen T, Mauger S, Bindea G,
(2012) 10:205. doi: 10.1186/1479-5876-10-205 et al. Clinical impact of different classes of infiltrating T cytotoxic and helper
Frontiers in Immunology | www.frontiersin.org 11 January 2021 | Volume 11 | Article 573158Niccolai et al. IL-9 Correlation With Prevotella and Bacteroides in CRC
cells (Th1, Th2, Treg, Th17) in patients with colorectal cancer. Cancer Res 31. Albanese D, Fontana P, De Filippo C, Cavalieri D, Donati C. MICCA: a
(2011) 71:1263–71. doi: 10.1158/0008-5472.CAN-10-2907 complete and accurate software for taxonomic profiling of metagenomic
10. Clarke SL, Betts GJ, Plant A, Wright KL, El-Shanawany TM, Harrop R, et al. data. Sci Rep (2015) 5:9743. doi: 10.1038/srep09743
CD4+CD25+FOXP3+ regulatory T cells suppress anti-tumor immune 32. McMurdie PJ, Holmes S. phyloseq: An R package for reproducible
responses in patients with colorectal cancer. PLoS One (2006) 1:e129. doi: interactive analysis and graphics of microbiome census data. PLoS One
10.1371/journal.pone.0000129 (2013) 8:e61217. doi: 10.1371/journal.pone.0061217
11. Niccolai E, Ricci F, Russo E, Nannini G, Emmi G, Taddei A, et al. The 33. Love MI, Huber W, Anders S. Moderated estimation of fold change and
Different Functional Distribution of “Not Effector” T Cells (Treg/Tnull) in dispersion for RNA-seq data with DESeq2. Genome Biol (2014) 15:550. doi:
Colorectal Cancer. Front Immunol (2017) 8:1900. doi: 10.3389/ 10.1186/s13059-014-0550-8
fimmu.2017.01900 34. Willis A, Bunge J. Estimating diversity via frequency ratios. Biometrics
12. Duchmann R, Kaiser I, Hermann E, Mayet W, Ewe K, Meyer zum (2015) 71:1042–9. doi: 10.1111/biom.12332
büschenfelde K-H, et al. Tolerance exists towards resident intestinal flora, 35. Willis A. Species richness estimation with high diversity but spurious
but is broken in active inflammatory bowel disease (IBD). Clin Exp Immunol singletons. (2016+). arXiv Available at: https://adw96.github.io/breakaway/.
(1995) 102:448–55. doi: 10.1111/j.1365-2249.1995.tb03836.x 36. Oksanen J, Blanchet G, Friendly M, Kindt R, Legendre P, McGlinn P, et al.
13. Garrett WS. The gut microbiota and colon cancer. Science (2019) 364:1133– vegan: Community Ecology Package. R package version 2.2-1 (2015).
5. doi: 10.1126/science.aaw2367 Available at: http://CRAN.R-project.org/package=vegan.
14. Sears CL, Garrett WS. Microbes, microbiota, and colon cancer. Cell Host 37. Good IJ. The population frequencies of species and the estimation of
Microbe (2014) 15:317–28. doi: 10.1016/j.chom.2014.02.007 population parameters. Biometrika (1953) 40:237–64. doi: 10.1093/biomet/
15. Arthur JC, Perez-Chanona E, Mühlbauer M, Tomkovich S, Uronis JM, Fan 40.3-4.237
TJ, et al. Intestinal inflammation targets cancer-inducing activity of the 38. Pielou EC. The measurement of diversity in different types of biological
microbiota. Science (2012) 338:120–23. doi: 10.1126/science.1224820 collections. J Theor Biol (1966) 13:131–44. doi: 10.1016/0022-5193(66)
16. Rubinstein MR, Wang X, Liu W, Hao Y, Cai G, Han YW. Fusobacterium 90013-0
nucleatum promotes colorectal carcinogenesis by modulating E-cadherin/b- 39. Fan J, Lv J. Sure independence screening for ultrahigh dimensional feature
catenin signaling via its FadA adhesin. Cell Host Microbe (2013) 14:195–206. space. J R Stat Soc B (2008) 70:849–911. doi: 10.1111/j.1467-9868.2008.
doi: 10.1016/j.chom.2013.07.012 00674.x
17. Kostic AD, Chun E, Robertson L, Glickman JN, Gallini CA, Michaud M, 40. Maier MJ. DirichletReg: Dirichlet regression for compositional data in R.
et al. Fusobacterium nucleatum potentiates intestinal tumorigenesis and Research Report Series / Department of Statistics and Mathematics, 125.
modulates the tumor- immune microenvironment. Cell Host Microbe (2013) (Vienna: WU Vienna University of Economics and Business) (2014).
14:207–15. doi: 10.1016/j.chom.2013.07.007 Available at: http://dirichletreg.r-forge.r-project.org/.
18. Wu T, Cui L, Liang Z, Liu C, Liu Y, Li J, et al. Elevated serum IL-22 levels 41. Pedone M, Stingo FC. Soft thresholding Bayesian variable selection for
correlate with chemoresistant condition of colorectal cancer. Clin Immunol compositional data analysis. SIS2019: Smart Statistics for Smart
(2013) 147:38–9. doi: 10.1016/j.clim.2013.02.007 Applications. in: G Arbia, S Peluso, A Pini, G Rivellini Book of Short
19. Gur C, Ibrahim Y, Isaacson B, Yamin R, Abed J, Gamliel M, et al. Binding of Papers SIS2019. Pearson Italia: Milano. (2019) 1200.
the Fap2 protein of Fusobacterium nucleatum to human inhibitory receptor 42. Contasta I, Berghella AM, Pellegrini P, Adorno D. Passage from normal
TIGIT protects tumors from immune cell attack. Immunity (2015) 42:344– mucosa to adenoma and colon cancer: alteration of normal sCD30
55. doi: 10.1016/j.immuni.2015.01.010 mechanisms regulating TH1/TH2 cell functions. Cancer Biother
20. Zitvogel L, Ayyoub M, Routy B, Kroemer G. Microbiome and Anticancer Radiopharm (2003) 18:549–57. doi: 10.1089/108497803322287628
Immunosurveillance. Cell (2016) 165:276–87. doi: 10.1016/j.cell.2016.03.001 43. Cui G, Florholmen J. Polarization of cytokine profile from Th1 into Th2
21. Gagliani N, Hu B, Huber S, Elinav E, Flavell RA. The fire within: microbes along colorectal adenoma-carcinoma sequence: implications for the
inflame tumors. Cell (2014) 157:776–83. doi: 10.1016/j.cell.2014.03.006 biotherapeutic target? Inflamm Allergy Drug Targets (2008) 7:94–7. doi:
22. Perez-Chanona E, Trinchieri G. The role of microbiota in cancer therapy. 10.2174/187152808785107589
Curr Opin Immunol (2016) 39:75–81. doi: 10.1016/j.coi.2016.01.003 44. Knochelmann HM, Dwyer CJ, Bailey SR, Amaya SM, Elston DM, Mazza-
23. He Y, Dong L, Cao Y, Bi Y, Liu G. IL-9 and Th9 Cells in Tumor Immunity. McCrann JM, et al. When worlds collide: Th17 and Treg cells in cancer and
Adv Exp Med Biol (2020) 1240:35–46. doi: 10.1007/978-3-030-38315-2_3 autoimmunity. Cell Mol Immunol (2018) 15:458–69. doi: 10.1038/s41423-
24. Coussens LM, Zitvogel L, Palucka AK. Neutralizing tumor-promoting 018-0004-4
chronic inflammation: a magic bullet? Science (2013) 339:286–91. doi: 45. Kuen DS, Kim BS, Chung Y. IL-17-Producing Cells in Tumor Immunity:
10.1126/science.1232227 Friends or Foes? Immune Netw (2020) 20:e6. doi: 10.4110/in.2020.20.e6
25. Atarashi K, Nishimura J, Shima T, Umesaki Y, Yamamoto M, Onoue M, 46. Kryczek I, Banerjee M, Cheng P, Vatan L, Szeliga W, Wei S, et al. Phenotype,
et al. ATP drives lamina propria TH17 cell differentiation. Nature (2008) distribution, generation, and functional and clinical relevance of Th17 cells
455:808–12. doi: 10.1038/nature07240 in the human tumor environments. Blood (2009) 114:1141–9. doi: 10.1182/
26. Grivennikov SI, Wang K, Mucida D, Stewart CA, Schnabl B, Jauch D, et al. blood-2009-03-208249
Adenoma-linked barrier defects and microbial products drive IL-23/IL-17- 47. Lee MH, Tung-Chieh Chang J, Liao CT, Chen YS, Kuo ML, Shen C-R, et al.
mediated tumour growth. Nature (2012) 491:254–8. doi: 10.1038/ Interleukin 17 and peripheral IL-17-expressing T cells are negatively
nature11465 correlated with the overall survival of head and neck cancer patients.
27. Humblin E, Thibaudin M, Chalmin F, Derangère V, Limagne E, Richard C, Oncotarget (2018) 9:9825–37. doi: 10.18632/oncotarget.23934
et al. IRF8-dependent molecular complexes control the Th9 transcriptional 48. Doulabi H, Rastin M, Shabahangh H, Maddah G, Abdollahi A, Nosratabadi R,
program. Nat Commun (2017) 8:2085. doi: 10.1038/s41467-017-01070-w et al. Analysis of Th22, Th17 and CD4+ cells co-producing IL-17/IL-22 at
28. Singh N, Gurav A, Sivaprakasam S, Brady E, Padia R, Shi H, et al. Activation different stages of human colon cancer. BioMed Pharmacother (2018)
of Gpr109a, receptor for niacin and the commensal metabolite butyrate, 103:1101–6. doi: 10.1016/j.biopha.2018.04.147
suppresses colonic inflammation and carcinogenesis. Immunity (2014) 49. Dunne MR, Ryan C, Nolan B, Tosetto M, Geraghty R, Winter DC, et al.
40:128–39. doi: 10.1016/j.immuni.2013.12.007 Enrichment of Inflammatory IL-17 and TNF-a Secreting CD4+ T Cells
29. Furusawa Y, Obata Y, Fukuda S, Endo TA, Nakato G, Takahashi D, et al. within Colorectal Tumors despite the Presence of Elevated CD39+ T
Commensal microbe-derived butyrate induces the differentiation of colonic Regulatory Cells and Increased Expression of the Immune Checkpoint
regulatory T cells. Nature (2013) 504:446–50. doi: 10.1038/nature12721 Molecule, PD-1. Front Oncol (2016) 6:50. doi: 10.3389/fonc.2016.00050
30. Pagliai G, Russo E, Niccolai E, Dinu M, Di Pilato V, Magrini A, et al. 50. Kuang DM, Peng C, Zhao Q, Wu Y, Zhu LY, Wang J, et al. Tumor-activated
Influence of a 3-month low-calorie Mediterranean diet compared to the monocytes promote expansion of IL-17-producing CD8+ T cells in
vegetarian diet on human gut microbiota and SCFA: the CARDIVEG Study. hepatocellular carcinoma patients. J Immunol (2010) 185:1544–9. doi:
Eur J Nutr (2019) 59(5):2011–24. doi: 10.1007/s00394-019-02050-0 10.4049/jimmunol.0904094
Frontiers in Immunology | www.frontiersin.org 12 January 2021 | Volume 11 | Article 573158Niccolai et al. IL-9 Correlation With Prevotella and Bacteroides in CRC
51. Pastille E, Wasmer M, Adamczyk A, Vu VP, Mager LF, Phuong NNT, et al. 71. Zhao P, Zhang Z. TNF-a promotes colon cancer cell migration and invasion by
The IL-33/ST2 pathway shapes the regulatory T cell phenotype to promote upregulating TROP-2. Oncol Lett (2018) 15:3820–7. doi: 10.3892/ol.2018.7735
intestinal cancer. Mucosal Immunol (2019) 12:990–1003. doi: 10.1038/ 72. Kakourou A, Koutsioumpa C, Lopez DS, Hoffman-Bolton J, Bradwin G,
s41385-019-0176-y Rifai N, et al. Interleukin-6 and risk of colorectal cancer: results from the
52. Zahran AM, Nafady-Hego H, Mansor SG, Abbas WA, Abdel-Malek MO, CLUE II cohort and a meta-analysis of prospective studies. Cancer Causes
Mekky MA, et al. Increased frequency and FOXP3 expression of human Control (2015) 26:1449–60. doi: 10.1007/s10552-015-0641-1
CD8+CD25High+ T lymphocytes and its relation to CD4 regulatory T cells 73. Nagasaki T, Hara M, Nakanishi H, Takahashi H, Sato M, Takeyama H, et al.
in patients with hepatocellular carcinoma. Hum Immunol (2019) 80:510–6. Interleukin-6 released by colon cancer-associated fibroblasts is critical for
doi: 10.1016/j.humimm.2019.03.014 tumour angiogenesis: anti-interleukin-6 receptor antibody suppressed
53. Gai XD, Li C, Song Y, Lei Y-M, Yang B-X. In situ analysis of FOXP3+ regulatory angiogenesis and inhibited tumour-stroma interaction. Br J Cancer (2014)
T cells and myeloid dendritic cells in human colorectal cancer tissue and tumor- 110:469–78. doi: 10.1038/bjc.2013.748
draining lymph node. BioMed Rep (2013) 1:207–12. doi: 10.3892/br.2012.35 74. Galizia G, Orditura M, Romano C, Lieto E, Castellano P, Pelosio L, et al.
54. Girardin A, McCall J, Black MA, Edwards F, Phillips V, Taylor ES, et al. Prognostic significance of circulating IL-10 and IL-6 serum levels in colon
Inflammatory and regulatory T cells contribute to a unique immune cancer patients undergoing surgery. Clin Immunol (2002) 102:169–78. doi:
microenvironment in tumor tissue of colorectal cancer patients. Int J Cancer 10.1006/clim.2001.5163
(2013) 132:1842–50. doi: 10.1002/ijc.27855 75. Al Obeed OA, Alkhayal KA, Al Sheikh A, Zubaidi AM, Vaali-Mohammed
55. Chaput N, Louafi S, Bardier A, Charlotte F, Vaillant JC, Mé né gaux F, et al. MA, Boushey R, et al. Increased expression of tumor necrosis factor-a is
Identification of CD8+CD25+Foxp3+ suppressive T cells in colorectal associated with advanced colorectal cancer stages. World J Gastroenterol
cancer tissue. Gut (2009) 58:520–9. doi: 10.1136/gut.2008.158824 (2014) 20:18390–6. doi: 10.3748/wjg.v20.i48.18390
56. Purwar R, Schlapbach C, Xiao S, Kang HS, Elyaman W, Jiang X, et al. Robust 76. Razaghi A, Owens L, Heimann K. Review of the recombinant human interferon
tumor immunity to melanoma mediated by interleukin-9-producing T cells. gamma as an immunotherapeutic: Impacts of production platforms and
Nat Med (2012) 18:1248–53. doi: 10.1038/nm.2856 glycosylation. J Biotechnol (2016) 240:48–60. doi: 10.1016/j.jbiotec.2016.10.022
57. Lu Y, Hong S, Li H, Park J, Hong B, Wang L, et al. Th9 cells promote 77. Mager LF, Wasmer MH, Rau TT, Krebs P. Cytokine-Induced Modulation of
antitumor immune responses in vivo. J Clin Invest (2012) 122:4160–71. doi: Colorectal Cancer. Front Oncol (2016) 6:96. doi: 10.3389/fonc.2016.00096
10.1172/JCI65459 78. Kusnierczyk H, Pajtasz-Piasecka E, Koten J-W, Bijleveld C, Krawczyk K,
58. Chen N, Wang X. Role of IL-9 and STATs in hematological malignancies Den Otter W. Further development of local il-2 therapy of cancer: multiple
(review). Oncol Lett (2014) 7:602–10. doi: 10.3892/ol.2013.1761 versus single il-2 treatment of transplanted murine colon carcinoma. Cancer
59. Yamaguchi M, Okamura S, Yamaji T, Iwasaki M, Tsugane S, Shetty V, et al. Immunol Immunother (2004) 53:445–52. doi: 10.1007/s00262-003-0490-8
Plasma cytokine levels and the presence of colorectal cancer. PLoS One 79. Wang Y, Wang M, Li Y. Anti-colorectal cancer effect of interleukin-2 and
(2019) 14:e0213602. doi: 10.1371/journal.pone.0213602 interferon-b fusion gene driven by carcinoembryonic antigen promoter.
60. Song M, Sasazuki S, Camargo MC, Shimazu T, Charvat H, Yamaji T, et al. Onco Targets Ther (2016) 9:3259–67. doi: 10.2147/OTT.S97444
Circulating inflammatory markers and colorectal cancer risk: A prospective 80. Wang J, Sun M, Zhao H, Huang Y, Li D, Mao D, et al. IL-9 Exerts Antitumor
case-cohort study in Japan. Int J Cancer (2018) 143:2767–76. doi: 10.1002/ Effects in Colon Cancer and Transforms the Tumor Microenvironment In
ijc.31821 Vivo. Technol Cancer Res Treat (2019) 18:1533033819857737. doi: 10.1177/
61. Krzystek-Korpacka M, Zawadzki M, Kapturkiewicz B, Lewandowska P, 1533033819857737
Bednarz-Misa I, Gorska S, et al. Subsite heterogeneity in the profiles of 81. Huang Y, Cao Y, Zhang S, Gao F. Association between low expression levels
circulating cytokines in colorectal cancer. Cytokine (2018) 110:435–41. doi: of interleukin-9 and colon cancer progression. Exp Ther Med (2015) 10:942–
10.1016/j.cyto.2018.05.015 6. doi: 10.3892/etm.2015.2588
62. Kantola T, Klintrup K, Väyrynen J, Vornanen J, Bloigu R, Karhu T, et al. 82. Tian L, Li Y, Chang R, Zhang P, Zhang J, Huo L. Lentiviral vector-mediated
Stage-dependent alterations of the serum cytokine pattern in colorectal IL-9 overexpression stimulates cell proliferation by targeting c-myc and
carcinoma. Br J Cancer (2012) 107:1729–36. doi: 10.1038/bjc.2012.456 cyclin D1 in colitis-associated cancer. Oncol Lett (2019) 17:175–82. doi:
63. Wang D, Dubois RN, Richmond A. The role of chemokines in intestinal 10.3892/ol.2018.9567
inflammation and cancer. Curr Opin Pharmacol (2009) 9:688–96. doi: 83. Gagnière J, Raisch J, Veziant J, Barnich N, Bonnet R, Buc E, et al. Gut
10.1016/j.coph.2009.08.003 microbiota imbalance and colorectal cancer. World J Gastroenterol (2016)
64. Bie Y, Ge W, Yang Z, Cheng X, Zhao Z, Li S, et al. The Crucial Role of 22:501–18. doi: 10.3748/wjg.v22.i2.501
CXCL8 and Its Receptors in Colorectal Liver Metastasis. Dis Markers (2019) 84. Tilg H, Adolph TE, Gerner RR, Moschen AR. The Intestinal Microbiota in
2019:8023460. doi: 10.1155/2019/8023460 Colorectal Cancer. Cancer Cell (2018) 33:954–64. doi: 10.1016/
65. Allen F, Bobanga ID, Rauhe P, Barkauskas D, Teich N, Tong C, et al. CCL3 j.ccell.2018.03.004
augments tumor rejection and enhances CD8+ T cell infiltration through 85. Wong SH, Yu J. Gut microbiota in colorectal cancer: mechanisms of action
NK and CD103+ dendritic cell recruitment via IFNg. Oncoimmunology and clinical applications. Nat Rev Gastroenterol Hepatol (2019) 16:690–704.
(2017) 7:e1393598. doi: 10.1080/2162402X.2017.1393598 doi: 10.1038/s41575-019-0209-8
66. De la Fuente Ló pez M, Landskron G, Parada D, Dubois-Camacho K, Simian 86. Russo E, Bacci G, Chiellini C, Fagorzi C, Niccolai E, Taddei A, et al.
D, Martinez M, et al. The relationship between chemokines CCL2, CCL3, Preliminary Comparison of Oral and Intestinal Human Microbiota in
and CCL4 with the tumor microenvironment and tumor-associated Patients with Colorectal Cancer: A Pilot Study. Front Microbiol (2018)
macrophage markers in colorectal cancer. Tumour Biol (2018) 40 8:2699. doi: 10.3389/fmicb.2017.02699
(11):1010428318810059. doi: 10.1177/1010428318810059 87. Flemer B, Lynch DB, Brown JM, Jeffery IB, Ryan FJ, Claesson MJ, et al.
67. Dimberg J, Skarstedt M, Löfgren S, Zar N, Matussek A. Protein expression Tumour-associated and non-tumour-associated microbiota in colorectal
and gene polymorphism of CXCL10 in patients with colorectal cancer. cancer. Gut (2017) 66:633–43. doi: 10.1136/gutjnl-2015-309595
BioMed Rep (2014) 2:340–3. doi: 10.3892/br.2014.255 88. Wirbel J, Pyl PT, Kartal E, Zych K, Kashani A, Milanese A, et al. Meta-
68. Jin WJ, Xu JM, Xu WL, Gu DH, Li PW. Diagnostic value of interleukin-8 in analysis of fecal metagenomes reveals global microbial signatures that are
colorectal cancer: a case-control study and meta-analysis. World J specific for colorectal cancer. Nat Med (2019) 25(4):679–89. doi: 10.1038/
Gastroenterol (2014) 20:16334–42. doi: 10.3748/wjg.v20.i43.16334 s41591-019-0406-6
69. Zeng J, Tang ZH, Liu S, Guo SS. Clinicopathological significance of 89. Yang J, McDowell A, Kim EK, Seo H, Lee WH, Moon CM, et al.
overexpression of interleukin-6 in colorectal cancer. World J Gastroenterol Development of a colorectal cancer diagnostic model and dietary risk
(2017) 23:1780–6. doi: 10.3748/wjg.v23.i10.1780 assessment through gut microbiome analysis. Exp Mol Med (2019) 51:1–
70. Wu D, Wu P, Huang Q, Liu Y, Ye J, Huang J. Interleukin-17: a promoter in 15. doi: 10.1038/s12276-019-0313-4
colorectal cancer progression. Clin Dev Immunol (2013) 2013:436307. doi: 90. Liu W, Zhang R, Shu R, Yu J, Li H, Long H, et al. Study of the Relationship
10.1155/2013/436307 between Microbiome and Colorectal Cancer Susceptibility Using 16SrRNA
Frontiers in Immunology | www.frontiersin.org 13 January 2021 | Volume 11 | Article 573158You can also read