Quantification of risk factors for bovine viral diarrhea virus in cattle herds: A systematic search and meta-analysis of observational studies ...
←
→
Page content transcription
If your browser does not render page correctly, please read the page content below
J. Dairy Sci. 103
https://doi.org/10.3168/jds.2020-18193
© 2020, The Authors. Published by Elsevier Inc. and Fass Inc. on behalf of the American Dairy Science Association®.
This is an open access article under the CC BY-NC-ND license (http://creativecommons.org/licenses/by-nc-nd/4.0/).
Quantification of risk factors for bovine viral diarrhea virus in cattle herds:
A systematic search and meta-analysis of observational studies
A. M. van Roon,1* M. Mercat,2 G. van Schaik,1,3† M. Nielen,1 D. A. Graham,4 S. J. More,5
M. Guelbenzu-Gonzalo,4 C. Fourichon,2 A. Madouasse,2 and I. M. G. A. Santman-Berends1,3
1
Department of Farm Animal Health, Faculty of Veterinary Medicine, Utrecht University, 3508, TD Utrecht, the Netherlands
2
INRAE, Oniris, BIOEPAR, 44300, Nantes, France
3
Royal GD, 7400 AA, Deventer, the Netherlands
4
Animal Health Ireland, Carrick on Shannon, Co. Leitrim N41 WN27, Ireland
5
Centre for Veterinary Epidemiology and Risk Analysis, UCD School of Veterinary Medicine, University College Dublin, Belfield, Dublin D04 W6F6,
Ireland
ABSTRACT 1.41, 95% CI: 1.18–1.69), and for herds that share pas-
ture or have direct contact with cattle of other herds at
Bovine viral diarrhea virus (BVDV) is endemic in pasture (OR = 1.32, 95% CI: 1.07–1.63). These pooled
many parts of the world, and multiple countries have values must be interpreted with care, as there was a
implemented surveillance activities for disease control high level of heterogeneity between studies. However,
or eradication. In such control programs, the disease- they do give an indication of the importance of the
free status can be compromised by factors that pose most frequently studied risk factors and can therefore
risks for introduction or persistence of the virus. The assist in the development, evaluation, and optimization
aim of the present study was to gain a comprehensive of BVDV control programs.
overview of possible risk factors for BVDV infection Key words: risk factor, bovine viral diarrhea virus,
in cattle herds in Europe and to assess their impor- review, meta-analysis, Europe
tance. Papers that considered risk factors for BVDV
infection in cattle were identified through a systematic
INTRODUCTION
search. Further selection of papers eligible for quan-
titative analysis was performed using a predefined Bovine viral diarrhea (BVD) virus (BVDV) is a
checklist, including (1) appropriate region (i.e., studies pestivirus belonging to the Flaviviridae family (Olafson
performed in Europe), (2) representativeness of the and Rickard, 1947). It is one of the most common viral
study population, (3) quality of statistical analysis, diseases in cattle and endemic in many parts of the
and (4) availability of sufficient quantitative data. In world (Scharnböck et al., 2018). Bovine viral diarrhea
total, 18 observational studies were selected. Data were virus is mainly spread by persistently infected (PI)
analyzed by a random-effects meta-analysis to obtain cattle, which were infected in utero between 40 and
pooled estimates of the odds of BVDV infection. Meta- 120 d of gestation and shed large amounts of virus into
analyses were performed on 6 risk factors: herd type, the environment after birth (McClurkin et al., 1984).
herd size, participation in shows or markets, introduc- Bovine viral diarrhea virus can be transmitted directly
tion of cattle, grazing, and contact with other cattle through nose-to-nose contact between cattle or indi-
herds on pasture. Significant higher odds were found rectly through contaminated materials (Tråvén et al.,
for dairy herds (odds ratio, OR = 1.63, 95% confidence 1991; Niskanen and Lindberg, 2003). Infections with
interval, CI: 1.06–2.50) compared with beef herds, for BVDV can lead to respiratory and reproductive issues,
larger herds (OR = 1.04 for every 10 extra animals in causing major economic losses (Houe, 2003). Many Eu-
the herd, 95% CI: 1.02–1.06), for herds that participate ropean countries have implemented BVDV control or
in shows or markets (OR = 1.45, 95% CI: 1.10–1.91), eradication programs, and some have already success-
for herds that introduced cattle into the herd (OR = fully eradicated the virus or reached a herd-level preva-
lence below 1.5% (Sweden, Norway, Finland, Denmark,
Received January 13, 2020. Germany, Austria, Switzerland, and Ireland; Nuotio et
Accepted May 20, 2020. al., 1999; Bitsch et al., 2000; Hult and Lindberg, 2005;
*Corresponding author: a.m.vanroon@uu.nl Rikula et al., 2005; Rossmanith et al., 2010; Presi et al.,
†On behalf of the STOC free consortium: Jörn Gethmann, Carola
Sauter-Louis, Jenny Frössling, Estelle Ågren, George Gunn, Madeleine 2011; Norström et al., 2014; Foddai et al., 2016; AHI,
Henry, and Jude Eze. 2019). Within those control programs, animals, herds,van Roon et al.: RISK FACTORS FOR BOVINE VIRAL DIARRHEA VIRUS
regions, or the country are ascribed a BVDV-free status below. The final complete data search in all 3 databases
that is subsequently monitored. was performed on September 21, 2018. An additional
The probability that a herd categorized as free within search was performed after the full-text screening and
a control program is truly free of infection will be influ- before data analysis on July 15, 2019. This additional
enced by risk factors for introduction of the virus (i.e., search was performed only in PubMed because Scopus
the probability that the virus is introduced or reintro- and CAB Abstracts do not allow selection for specific
duced into the herd between test moments) and factors publication dates, only per year.
that cause delayed detection of the virus after intro- The research questions include 4 key aspects:
duction or reintroduction (i.e., the probability that the BVDV, risk factors, introduction, and delayed detec-
virus had been introduced but not yet detected). The tion. The BVDV search terms included the following:
effectiveness of surveillance relies on an understanding BVD, BVDV, bovine viral diarrh(o)ea, bovine viral
of these risk factors. Delayed detection of the virus can diarrh(o)ea, and bovine viral diarrh(o)ea virus. Risk
be associated with herd management, control program factor search terms included the following: risk factor,
design (e.g., test population, test frequency, sample purchase, import, trade, market, grazing, nose-to-nose
size, test validity), and test performance. Risk factors contact, direct contact, over the fence contact, density,
for introduction depend on the contact structure be- contact structure, herd, herd size, seasonal calving,
tween herds, such as purchase or contact with cattle calving pattern, housing system, management, biosecu-
from neighboring herds. The introduction of purchased rity, vaccination, artificial insemination, embryo trans-
animals is a well-known risk factor. However, an over- fer, PI, persistent infection, and persistently infected.
view of the magnitude of the risk, and of country-level Introduction search terms included the following: in-
differences, is lacking. troduction, pathway, epidemio*, incidence, prevalence,
Risk factors for introduction and delayed detection and contamin*. Finally, delayed detection search terms
of BVDV are not easily studied in isolation due to the included the following: diagnostic test, persist*, delayed
difficulty of determining exactly when the virus is in- detection, test strategy, test scheme, test performance,
troduced into a herd. Risk factors for the presence of test characteristics, sensitivity, control program*,
infection are more often reported (e.g., Graham et al., eradication program*, surveillance, false negative, free,
2013; Byrne et al., 2017; Amelung et al., 2018) and could freedom, transmission, and spread. The full electronic
serve as a proxy for introduction and delayed detection. search strategy is included in Supplemental File S2
In this study, we have conducted a systematic literature (https://doi.org/10.3168/jds.2020-18193).
search, seeking to gain a comprehensive overview of
possible risk factors for the presence of BVDV infec- Study Selection
tion in cattle herds in Europe. We aimed to assess the
importance of the most frequently studied risk factors Studies published in peer-reviewed journals with full
and, depending on study quality and the availability text available were considered. They reported either
of quantitative data, to perform meta-analyses to ob- risk factors for introduction of BVDV in cattle herds
tain pooled values. This information is critical for the or risk factors for the presence of BVDV from which
development, evaluation, and optimization of BVDV risk factors for introduction could be inferred. During
control programs. Control program managers can list the initial screening, studies were also included from
and prioritize risk factors in their country based on the which risk factors for delayed detection could be in-
pooled values or choose the results from countries most ferred (e.g., studies reporting test characteristics). In a
comparable with their situation. later stage, it was decided to focus on risk factors for
introduction and presence of BVDV to narrow down
MATERIALS AND METHODS the search. Only studies with a cross-sectional, cohort,
case-control, or randomized controlled trial study de-
This systematic review was reported according to the sign were considered. Languages that were accepted
Preferred Reporting Items for Systematic Reviews and were English, Dutch, French, Spanish, and German.
Meta-Analyses (PRISMA) guidelines (Moher et al., Studies published since 1980 were included to focus on
2009) with the PRISMA 2009 Checklist (Supplemental modern farm management systems.
File S1, https://doi.org/10.3168/jds.2020-18193). The search in PubMed, CAB Abstracts, and Scopus
was carried out by one researcher (AvR). The research-
Search Strategy er imported all references into the online systematic
review management tool Covidence (Veritas Health
Three databases (PubMed, CAB Abstracts, and Sco- Innovation, Melbourne, VIC, Australia). In Covidence,
pus) were interrogated using the search terms defined duplicates were deleted automatically or following a
Journal of Dairy Science Vol. 103 No. 10, 2020van Roon et al.: RISK FACTORS FOR BOVINE VIRAL DIARRHEA VIRUS
manual review. Two researchers (AvR and MM) both Data Collection
went independently through the following consecutive
phases of the review: (1) screening titles and abstracts Data were extracted from all selected studies using
based on the inclusion criteria described above, and (2) an Excel (Microsoft Corp., Redmond, WA) form that
reviewing full-text articles based on the inclusion crite- was prepared in advance. Data were extracted by one
ria described above. After these review steps, conflict- researcher (AvR) and checked by the other researcher
ing opinions on papers were discussed with the other (MM). A pilot test of the Excel form was conducted
co-authors to reach consensus on inclusion or exclusion. by these 2 researchers working together on 3 selected
All full-text studies that were selected based on the papers to increase uniformity in extracting the data.
inclusion criteria were further assessed for their appro- For each selected study, detailed data were extracted
priateness for meta-analyses by one researcher (AvR). regarding study type, location, size of the study popu-
This was done using the approach presented in Table lation, diagnostic tests used, risk factors studied in
1. This checklist consists of 4 questions regarding in- univariable and multivariable analysis, the effect size
ternal validity (how well is the study conducted?) and (odds ratio, OR; relative risk), confidence intervals,
external validity (generalizability). As no generic tool and the statistical analysis that was performed.
is available for appraisal of observational studies for
meta-analysis (Sanderson et al., 2007), we created our Meta-Analysis
own checklist with relevant checkpoints based on our
own observations and in alignment with the methods All risk factors from the studies that were selected
used in previous studies (National Institutes of Health, for quantitative analysis were listed and combined into
2014; Downes et al., 2016). groups of similar risk factors. Per group, OR reported
On several occasions, multiple studies were described in at least 2 independent studies were analyzed by a
in a single paper (so-called split studies)—for example, random-effects meta-analysis to obtain pooled esti-
if a risk factor study was performed on different out- mates of the odds of BVDV infection. In some cases,
come variables (e.g., antibody or virus) or different variables first had to be restructured to be able to in-
types of cattle (e.g., beef or dairy) or if more than one clude them in the meta-analysis. For example, this was
final risk factor model was developed. We decided to the case with introduction of cattle where we wanted
include both split studies where beef and dairy herds to combine variables with “yes introduction” versus “no
were analyzed separately because these risk factor introduction” with categorical variables where different
analyses were performed on different populations (e.g., numbers of introduced cattle were compared with zero
Gates et al., 2013, 2014). When studies concluded with introduction. In this case, we first performed a within-
more than one final model, the model indicated by the study fixed-effects meta-analysis on the different cat-
authors as best describing the data was included. If no egories of this variable to obtain a summary estimate
choice was made between the different final models, we across all categories. This summary estimate could
selected the model that took into account the full data subsequently be included in the overall meta-analysis
set. Risk factor analyses performed on subsets of the for introduction of cattle.
data were excluded.
Table 1. Checklist study appraisal for quantitative analysis
Item Not appropriate for meta-analysis Appropriate for meta-analysis
External validity
1. Is the cattle production system Studies were performed outside of Europe. Studies were performed in Europe.
comparable with the European
situation?
2. Are the selected animals or herds No, with high possibility of selection bias. Yes, with low or medium possibility of selection
representative of the target population Animals or herds are selected purposively. bias. Animals or herds are selected randomly or
(commercial cattle herds in Europe)? in a way that represents the target population.
Internal validity
3. Was the unit of interest appropriate for Animal-level data were used without Herd-level data or animal-level data that were
a herd-level risk factor study? correction for within-herd correlation. corrected for clustering were used.
4. Are quantitative data available? No, there are only descriptive studies, or Yes, there are quantitative data (odds ratios
some quantitative data but no odds ratios or data to derive odds ratios) of univariable or
or data from which odds ratios could be multivariable analysis.
derived.
Journal of Dairy Science Vol. 103 No. 10, 2020van Roon et al.: RISK FACTORS FOR BOVINE VIRAL DIARRHEA VIRUS
A random-effects approach is considered the de- rowed down to 51 papers (Figure 1). Based on Table 1,
fault method in meta-analysis of observational studies all 51 papers were screened for their appropriateness for
(Mueller et al., 2018). This approach accounts for the quantitative analyses (Supplemental File S3, https://
fact that the study effect estimates are not drawn from doi.org/10.3168/jds.2020-18193). Eventually, 18 papers
a single population, which would be the case when us- (20 studies) were selected for inclusion in the meta-
ing a fixed-effects approach (Harrer et al., 2019). The analysis (Table 2).
random-effects models were fitted in a 2-step approach.
First, between-study variance, represented by the dis- Overview of Risk Factors
tribution of the true study effects, was estimated with
the DerSimonian-Laird approach. Then, weights were All risk factors that were studied in the final 18 pa-
assigned to all included studies based on the inverse of pers were grouped into 6 risk factor categories: (1) herd
the variance as in general the population size between and animal characteristics, (2) cattle movement, (3)
observational studies is not equal and pooled OR were reproduction, (4) neighborhood risk, (5) farm manage-
estimated (Viechtbauer, 2010). In this process, the OR ment and biosecurity, and (6) diagnostic testing and
and their 95% confidence intervals (CI) as reported in control programs.
the individual studies were log-transformed; therefore,
due to rounding errors, the 95% CI in our results might Description of Risk Factors
differ slightly from the data reported in the individual
studies. Preferably, adjusted OR that resulted from Herd and Animal Characteristics. Herd and
multivariable analysis were used. When no multivari- animal characteristics that were studied included milk
able results were available, crude OR that resulted from yield, sex, age, infection with other pathogens, mortal-
univariable analysis were included. If no OR were avail- ity, region, herd type, and herd size. Of all herd charac-
able but frequencies were reported, OR were calculated. teristics, variables describing herd size, herd type, and
In each forest plot, the univariable results were marked. region were included most frequently (Table 3).
Also, subanalyses were performed in which univariable No further analysis could be performed on milk yield
and multivariable results were analyzed separately. and sex as for both there was only 1 study with quanti-
Heterogeneity between studies was studied by the I2 tative data. Age was included as a categorical variable
statistic. The I2 statistic shows what proportion of the in 2 studies (Mainar-Jaime et al., 2001; Hanon et al.,
variance is due to heterogeneity in true effects rather 2018), both with higher OR for the presence of BVD
than sampling error (Borenstein et al., 2017). To iden- antibodies in higher age classes. However, the age cat-
tify studies with the greatest influence on the results, egories within those 2 studies were not comparable and
an influential case analysis was performed with cut-off therefore were unsuitable for meta-analysis. Infection
values proposed by Viechtbauer and Cheung (2010). with other pathogens associated with BVD infection
The studies indicated as outliers were marked in each was considered in 3 studies but could not be compared
forest plot. The change in the summary estimates and because different pathogens were studied (i.e., Neospora
I2 statistic when retaining or removing outliers was of caninum, bovine herpes virus-1, and bovine tubercu-
minor importance. Publication bias could not be prop- losis). Mortality was considered in 5 studies, but as
erly assessed due to the low number of studies included this was regarded more an outcome than a risk factor
in our meta-analyses (n < 10; Higgins et al., 2019). for BVDV, it was not included in the meta-analysis.
Funnel plots were checked for asymmetry, with some Finally, region was not included in the meta-analysis
indication of publication bias, but these plots are not even though this was one of the most studied risk fac-
reported as it was not possible to determine whether tors within the herd and animal characteristics group.
this was by chance or real asymmetry due to the low Because different regions were included in different
number of studies. Meta-analyses were performed using studies, comparison of the risk estimates between re-
R statistical software (R Core Team, 2019) and the gions was impossible. Nevertheless, most studies found
metafor package (Viechtbauer, 2010). significant differences between regions, which makes
this an important risk factor to consider. Meta-analysis
RESULTS was performed on herd type and herd size.
Cattle Movement. Movement characteristics that
Literature Search were studied included introduction of cattle, cattle
shows or markets, and other movements (e.g., sale and
The original searches revealed 12,028 papers, of which exchange of calves). Of all cattle movement risk factors,
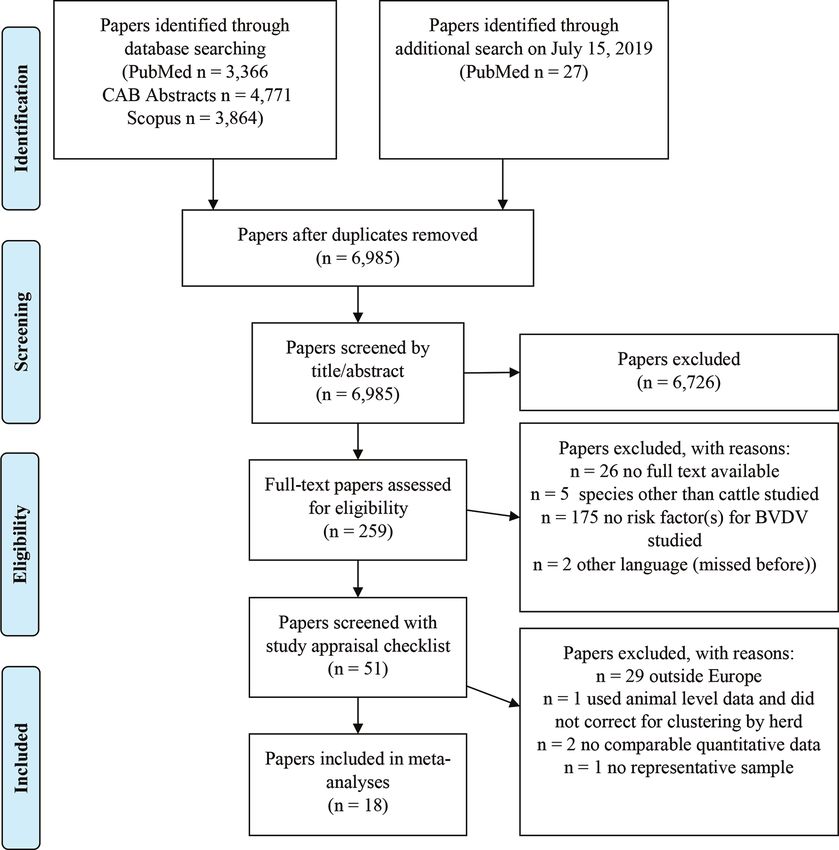
ultimately 259 papers were full-text screened and nar- variables describing introduction of cattle into a herd
Journal of Dairy Science Vol. 103 No. 10, 2020van Roon et al.: RISK FACTORS FOR BOVINE VIRAL DIARRHEA VIRUS Figure 1. Flow diagram showing the total number of papers identified and excluded per stage of the selection process. At the eligibility stage, we decided to exclude papers that were initially selected for delayed detection. The 175 “no risk factor(s) for BVDV studied” papers were about BVDV test characteristics. BVDV = bovine viral diarrhea virus. were included most frequently (Table 4). We considered (1999). Meta-analysis was performed on cattle shows or studies on introduction of cattle into a herd and on markets and introduction of cattle. purchase, where the latter assumes monetary transfer, Reproduction. Reproduction variables that were which is not necessarily the case with introduction. In studied included AI versus use of bulls and calving pat- this paper, we use “introduction,” which also covers tern (Table 5). The number of studies was too small or purchase. the definition of the variables varied too much between Other types of cattle movements were studied by studies to enable a meta-analysis to be conducted. Valle et al. (1999) and Amelung et al. (2018). Valle et Variables regarding AI or the use of bulls were in- al. (1999) looked at “other animal traffic,” combining cluded only in univariable analyses. In Amelung et al. mainly exchange of calves and sharing of cattle housing (2018), higher but nonsignificant OR were found for with other farmers during summer. They found a very BVD infection in herds with AI (OR = 1.28, 95% CI: high OR of 28.60 (95% CI: 3.23–252.22). Amelung et 0.96–1.71) compared with herds without AI but also al. (2018) studied sale of cattle, which was not compa- in herds with a bull for insemination (OR = 1.17, 95% rable with the cattle movement studied in Valle et al. CI: 0.93–1.48) compared with herds without a bull. Journal of Dairy Science Vol. 103 No. 10, 2020
Table 2. Studies selected for the meta-analyses
Unit of interest
Study Study in risk factor Type of cattle Outcome
ID1 Study Country design analysis studied measure Diagnostic test2
2 Amelung et al. (2018) Germany Cross- 2,542 herds Combination Virus ELISA on ear notch followed by PCR
sectional on ear notch
5B3 Barrett et al. (2018) Ireland Cross- 139 herds Beef Virus On ear notch
sectional
7 Bishop et al. (2010) Wales Cross- 36 herds Dairy Antibodies ELISA on BTM
sectional
9B3 Byrne et al. (2017) Northern Cross- 2,827 herds Combination Virus PCR on ear notch
Ireland sectional
11 Charoenlarp et al. (2018) Northern Cross- 17,186 herds Combination Virus ELISA, PCR, or both on ear notch
Journal of Dairy Science Vol. 103 No. 10, 2020
Ireland sectional
15 Ersbøll et al. (2010) Denmark Cohort 7,921 herds Dairy Virus ELISA on BTM and blood
18A4 Gates et al. (2014) Scotland Cross- 255 herds Beef Antibodies ELISA on blood
sectional
18B4 Gates et al. (2014) Scotland Cross- 189 herds Dairy Antibodies ELISA on blood
sectional
4
19A Gates et al. (2013) Scotland Case-control 249 herds (65 cases Beef Antibodies ELISA on blood
and 184 controls)
19B4 Gates et al. (2013) Scotland Case-control 185 herds (119 cases Dairy Antibodies ELISA on blood
and 66 controls)
3
20A Graham et al. (2013) Ireland Cross- 3,894 herds Combination Virus ELISA or PCR on ear notch
sectional
21A3 Graham et al. (2016) Ireland Cross- 58,479 herds Combination Virus Unknown
sectional
22 Hanon et al. (2018) Belgium Cross- 51 herds and 3,017 Combination Antibodies Different ELISA and VNT on blood
sectional cattle and milk
24A3 Houe et al. (1995a,b) Denmark Cross- 19 herds Dairy Virus Virus isolation and virus
sectional neutralization on blood
30 Mainar-Jaime et al. (2001) Spain Cross- 529 cattle Dairy Antibodies ELISA on blood
sectional
31 Martinez-Ibeas et al. (2015) Republic of Cross- 305 herds Dairy Antibodies ELISA on BTM and blood
Ireland sectional
35 Presi et al. (2011) Switzerland Cross- 33,188 herds Combination Virus ELISA or PCR on ear notch
sectional
40A3 Sarrazin et al. (2013) Belgium Cross- 664 herds Combination Antibodies and ELISA on blood
van Roon et al.: RISK FACTORS FOR BOVINE VIRAL DIARRHEA VIRUS
sectional virus
3
49A Valle et al. (1999) Norway Case-control 314 herds (162 cases Dairy Antibodies BTM screening and pooled milk
and 152 controls) sample followed by ELISA on blood
50 Williams and Winden (2014) United Kingdom Cross- 1,088 herds Dairy Antibodies ELISA on BTM
sectional
1
Study ID were assigned to the 51 papers that were selected in the second-last selection step (Supplemental File S3, https://doi.org/10.3168/jds.2020-18193).
2
BTM = bulk tank milk; VNT = virus neutralization test.
3
These rows represent one of 2 or 3 studies presented in a single paper. Each of these studies was chosen for inclusion in further analyses because they either present the best final
model or were performed on the full data set. Excluded split studies can be found in Supplemental File S3.
4
These rows represent one of 2 split studies presented in a single paper. Each of these studies had been conducted on different herds (beef or dairy) and has been analyzed separately.van Roon et al.: RISK FACTORS FOR BOVINE VIRAL DIARRHEA VIRUS
Table 3. Overview of the number of risk factor studies (out of the selected 18 papers on 20 studies) that included herd and animal characteristics
and the availability of quantitative data
No. of No. of No. of variables
Factor studies variables Study ID1 with quantitative data
Milk yield 2 2 2, 30 1
Sex 1 1 22 1
Age 2 2 22, 30 2
Infection with other pathogens 3 6 5B, 9B, 30 3
Mortality 5 7 5B, 9B, 20A, 30, 35 5
Region 8 8 2, 9B, 11, 15, 20A, 21A, 30, 31 7
Herd type2 9 11 2, 9B, 11, 20A, 21A, 22, 30, 35, 40A 9
Herd size2 14 20 2, 5B, 9B, 11, 15, 20A, 21A, 22, 24A, 30, 31, 13
35, 40A, 50
1
Study ID were assigned to the 51 papers that were selected in the second-last selection step (see Supplemental File S3, https://doi.org/10.3168/
jds.2020-18193).
2
Included in the meta-analysis.
Table 4. Overview of the number of risk factor studies (out of the selected 18 papers on 20 studies) that included cattle movement variables
and the availability of quantitative data
No. of No. of No. of variables
Factor studies variables Study ID1 with quantitative data
Other movement 2 2 2, 35 2
Cattle shows or markets2 5 5 2, 19A, 19B, 22, 35 5
Introduction of cattle2 17 62 2, 5B, 7, 9B, 18A, 18B, 19A, 19B, 20A, 21A, 22, 48
24A, 30, 31, 35, 49A, 50
1
Study ID were assigned to the 51 papers that were selected in the second-last selection step (see Supplemental File S3, https://doi.org/10.3168/
jds.2020-18193).
2
Included in the meta-analysis.
Table 5. Overview of the number of risk factor studies (out of the selected 18 papers on 20 studies) that
included reproduction variables and the availability of quantitative data
No. of No. of No. of variables
Factor studies variables Study ID1 with quantitative data
Calving pattern 1 1 50 1
AI/use of bulls 3 4 2, 7, 50 3
1
Study ID were assigned to the 51 papers that were selected in the second-last selection step (see Supplemental
File S3, https://doi.org/10.3168/jds.2020-18193).
Table 6. Overview of the number of risk factor studies (out of the selected 18 papers on 20 studies) that included neighborhood variables and
the availability of quantitative data
No. of No. of No. of variables
Factor studies variables Study ID1 with quantitative data
Farm fragmentation 1 1 20A 1
Environment 1 4 11 4
Cattle density 6 9 11, 15, 19A, 19B, 21A, 30 7
BVD2-positive neighbor herds 3 11 11, 15, 21A 8
Contact with other animal species 5 10 2, 19A, 19B, 20A, 49A 8
Pasture3 8 20 2, 11, 19A, 19B, 22, 24A, 35, 49A 14
1
Study ID were assigned to the 51 papers that were selected in the second-last selection step (Supplemental File S3, https://doi.org/10.3168/
jds.2020-18193).
2
Bovine viral diarrhea.
3
Included in the meta-analysis.
Journal of Dairy Science Vol. 103 No. 10, 2020van Roon et al.: RISK FACTORS FOR BOVINE VIRAL DIARRHEA VIRUS
Table 7. Overview of the number of risk factor studies (out of the selected 18 papers on 20 studies) that
included farm management and biosecurity variables and the availability of quantitative data
No. of No. of No. of variables
Factor studies variables Study ID1 with quantitative data
Other biosecurity 2 2 19A, 19B 2
Hygiene 2 2 19A, 19B 2
Quarantine 3 3 7, 19A, 19B 2
Mixed beef and dairy farm 3 3 19A, 19B, 49A 2
Vaccination 3 4 22, 31, 40A 2
Housing 2 4 2, 22 4
Shared equipment 3 5 19A, 19B, 49A 4
People on farm 2 8 19A, 19B 8
1
Study ID were assigned to the 51 papers that were selected in the second-last selection step (Supplemental
File S3, https://doi.org/10.3168/jds.2020-18193).
Williams and Winden (2014) compared herds with a Farm Management and Biosecurity. Variables
bull present on the farm with herds with AI only and included were quarantine, vaccination, mixed beef and
found that herds with a bull present on the farm had dairy farm, type of housing, shared equipment, people
higher but nonsignificant odds of infection with BVD on farm, and other biosecurity. None of these variables
(OR = 1.16, 95% CI: 0.90–1.49). Calving pattern was were suitable for meta-analysis because of noncompa-
found only once in a univariable risk factor analysis and rable definitions or the low number of studies in which
showed higher odds of infection (OR = 1.80, 95% CI: these factors were studied (Table 7).
1.22–2.67) in herds with year-round calving compared Most farm management and biosecurity variables
with seasonal calving (Williams and Winden, 2014). were studied by Gates et al. (2013). They studied the
Neighborhood Risk. Variables related to neighbor- relative influence of cattle movements, local spread,
hood risk included farm fragmentation, environment, and biosecurity on BVDV seropositivity. The variables
cattle density, BVD-positive neighbor herds, contact we included in the farm management and biosecurity
with other animal species, and pasture. Of all neighbor- group were not exactly identical to the classification of
hood risk factors, variables describing cattle density, biosecurity variables in the study of Gates et al. (2013),
contact with other animal species, and pasture were but especially for beef herds, cattle movement had the
included most frequently (Table 6). greatest influence on BVDV seropositivity. Also, in the
Farm fragmentation (number of individual noncon- other studies included in Table 7, most biosecurity vari-
tiguous parcels of land associated with the herd) and ables were nonsignificant.
environment (i.e., natural grassland, forest) were both Diagnostics Testing and Control Programs.
studied only once; therefore, no meta-analysis could be Multiple papers studied variables related to diagnos-
performed. Cattle density and BVD-positive neighbor tic testing and control programs that we grouped into
herds were studied more frequently but in such differ- BVDV testing, farmer behavior, control program, and
ent ways that meta-analysis was not possible. Both other (Table 8). However, either the number of studies
variables describe in different ways the distance to was too small or the definition of these variables varied
(positive) neighboring herds or the number of (positive) too much between studies to enable a meta-analysis to
neighboring herds contiguous to the farm or in a 5- or be conducted.
10-km radius. They are continuous or categorical. Most Within the diagnostic testing and control programs
studies showed higher odds of BVD infection when the group, BVDV testing was studied most. Examples of
distance to (positive) neighbors is shorter, when there variables studied are the total number of BVDV tests
are more (positive or unknown status) neighbors close undertaken and detection of PI animals in the past.
by, or when BVD-positive animals are retained for a One study (Amelung et al., 2018) found that herds that
longer period. One study found that seropositivity in- participated in a control program has slightly higher
creased with a larger distance (in km) to the closest odds (OR = 1.28, 95% CI: 1.01–1.64) for BVDV infec-
dairy farm (Mainar-Jaime et al., 2001). Variables re- tion in univariable analysis than herds that do not par-
garding contact with other animal species included the ticipate. One of the studies looking at farmer behavior
presence of, contact with, close proximity of, or grazing showed that the age of farmers was associated with the
with sheep, pigs, deer, or wildlife. No meta-analysis BVD status. Herds of farmers younger than 40 yr were
could be performed on contact with other animal spe- more often infected than herds of farmers between 50
cies. and 60 yr.
Journal of Dairy Science Vol. 103 No. 10, 2020van Roon et al.: RISK FACTORS FOR BOVINE VIRAL DIARRHEA VIRUS
Table 8. Overview of the number of risk factor studies (out of the selected 18 papers on 20 studies) that
included diagnostic testing and control program variables and the availability of quantitative data
No. of No. of No. of variables
Factor studies variables Study ID1 with quantitative data
Other 3 3 11, 40A, 21A 2
Farmer (behavior) 2 4 2, 49A 3
Control program 3 3 2, 11, 22 3
BVDV2 testing 7 8 9B, 19A, 19B, 20A, 30, 31, 40A 6
1
Study ID were assigned to the 51 papers that were selected in the second-last selection step (Supplemental
File S3, https://doi.org/10.3168/jds.2020-18193).
2
Bovine viral diarrhea virus.
Meta-Analyses breeding; Supplemental File S4, section 4.1.1, https:/
/doi.org/10.3168/jds.2020-18193). A meta-analysis was
Herd and Animal Characteristics. Herd type conducted on the 6 studies that compared dairy versus
was studied frequently and was always included as beef herds (reference category; Supplemental File S4,
a categorical variable (i.e., dairy, beef, mixed, beef section 4.1.2, https://doi.org/10.3168/jds.2020-18193).
Figure 2. Forest plot of the effect of herd type with beef herds as reference category (upper plot) and herd size per additional animal in
the herd (lower plot) on bovine viral diarrhea virus infection. *Univariable result; #study indicated as outlier in the influential case analysis.
Journal of Dairy Science Vol. 103 No. 10, 2020van Roon et al.: RISK FACTORS FOR BOVINE VIRAL DIARRHEA VIRUS We found a combined effect estimate of 1.63 higher For every extra animal in the herd, we found a com- odds (95% CI: 1.06–2.50) of BVDV infection in dairy bined effect estimate of 1.004 higher odds (95% CI: herds compared with beef herds (Figure 2). The het- 1.002–1.006) of BVDV infection (Figure 2). For every erogeneity between studies (I2) was 97.30% (95% CI: 10 extra animals in the herd, this would be 1.04 higher 91.87–99.47). odds of BVDV infection (95% CI: 1.02–1.06). The re- Herd size was studied frequently and was always in- sults of Presi et al. (2011) could not be included in cluded as an either categorical or continuous variable the pooled estimate because weights are assigned to (Supplemental File S4, section 4.1.1, https://doi.org/ all factors based on the inverse of the variance and 10.3168/jds.2020-18193). However, very few variables these results had a variance of zero. The heterogeneity were comparable; therefore, meta-analysis was con- between studies (I2) was 55.96% (95% CI: 0.00–99.98). ducted on the 4 studies with OR per additional cow Cattle Movement. In all studies, participation (Supplemental File S4, section 4.1.2, https://doi.org/10 in cattle shows or markets was included as a yes–no .3168/jds.2020-18193). Other variables showing the log variable (Supplemental File S4, section 4.2.1, https:/ number of cows or different herd size categories were /doi.org/10.3168/jds.2020-18193) and therefore they not included because they were not comparable. could all be included in meta-analysis (Supplemental Figure 3. Forest plot of the effect of participation in shows or markets (upper plot) and introduction of cattle (lower plot) on bovine viral diarrhea virus infection. Gates et al., 2013 (A) and (B), refers to substudies, as indicated in Table 2. *Univariable result; #study indicated as outlier in the influential case analysis. Journal of Dairy Science Vol. 103 No. 10, 2020
van Roon et al.: RISK FACTORS FOR BOVINE VIRAL DIARRHEA VIRUS File S4, section 4.2.2, https://doi.org/10.3168/jds.2020 doi.org/10.3168/jds.2020-18193). In 2 studies (Graham -18193). We found a combined effect estimate of 1.45 et al., 2013, 2016), a sub-meta-analysis was first per- higher odds (95% CI: 1.10–1.91) of BVDV infection in formed to obtain pooled estimates comparable with the herds that participated in shows or markets compared estimates of the yes−no variables (Supplemental File with herds that did not (Figure 3). The heterogeneity S5, https://doi.org/10.3168/jds.2020-18193). We found between studies (I2) was 61.70% (95% CI: 0.00–96.60). a combined effect estimate of 1.41 higher odds (95% CI: Introduction of cattle was the most often studied 1.18–1.69) of BVDV infection in herds that introduce movement variable but was not easily compared be- cattle into the herd compared with herds that do not tween studies because of the many different ways in (Figure 3). The heterogeneity between studies (I2) was which introduction of cattle was coded (i.e., introduc- 82.98% (95% CI: 71.48–99.47). tion yes−no, source of introduced animals, continuous Neighborhood Risk. Pasturing of cattle was the variables, and introduction of different types of cattle). most often studied neighborhood risk variable. Vari- We decided to focus further meta-analysis on introduc- ables described whether cattle had access to pasture, tion yes−no because these variables were most com- the possibility of contact with cattle from other herds parable (Supplemental File S4, section 4.2.2, https:// at pasture, and shared pasture (Supplemental File S4, Figure 4. Forest plot of the effect of herds grazing (upper plot) and contact between cattle on pasture by either shared pasture or over-the- fence contact (lower plot) on bovine viral diarrhea virus infection. Gates et al., 2013 (A) and (B), refers to substudies, as indicated in Table 2. *Univariable result; #study indicated as outlier in the influential case analysis. Journal of Dairy Science Vol. 103 No. 10, 2020
van Roon et al.: RISK FACTORS FOR BOVINE VIRAL DIARRHEA VIRUS
section 4.3.1, https://doi.org/10.3168/jds.2020-18193). est seroprevalence in the smallest herds (3). The pooled estimate in
section 4.3.2, https://doi.org/10.3168/jds.2020-18193) our meta-analysis showed a significantly higher risk of
followed by contact between cattle on pasture (Supple- infection per extra 10 animals in the herd (OR = 1.04,
mental File S4, section 4.3.2, https://doi.org/10.3168/ 95% CI: 1.02–1.06). This could be explained by the ten-
jds.2020-18193). dency for larger herds to have a decreased probability
We found a nonsignificant combined effect estimate of self-clearance of infection and to be more likely to
of 1.10 higher odds (95% CI: 0.62–1.97) of BVDV in- contain a higher number of pregnant cattle and pur-
fection in herds that graze their cattle compared with chased cattle, increasing the risk of introduction of PI
herds that do not (Figure 4). The heterogeneity between into the herd (Lindberg and Houe, 2005; Sarrazin et al.,
studies (I2) was 73.30% (95% CI: 0.83–99.80). Stud- 2013; Barrett et al., 2018). In our meta-analysis, dairy
ies on contact between cattle at pasture were divided herds were also found to be at higher risk of infection
into shared pasture and the possibility of contact with than beef herds (OR = 1.63, 95% CI: 1.06–2.50). It has
cattle from other herds at pasture (e.g., contact over been suggested that this is related to the higher number
the fence) but were also analyzed together (Figure 4). of contacts between cattle and people and traffic on
For both shared pasture and contact at pasture, we dairy farms compared with beef farms (Amelung et al.,
found nonsignificant odds of BVDV infection: 1.34 2018).
(95% CI: 0.85–2.10) and 1.33 (95% CI: 0.99–1.78), Movement of cattle is considered one of the most
respectively (Figure 4). However, we found an overall important risk factors for BVD infection, especially
significant combined effect estimate of 1.32 higher odds purchase (Courcoul and Ezanno, 2010; Gates et al.,
(95% CI: 1.07–1.63) of BVDV infection in herds where 2013; Qi et al., 2019). Our meta-analysis showed higher
contact between cattle at pasture is possible either odds (OR = 1.41, 95% CI: 1.18–1.69) for herds that
because different herds share pasture or because of introduced cattle into the herd in the previous year
contact between herds in contiguous pastures (Figure compared with herds that did not. However, Gates et
4). The heterogeneity between studies (I2) was 53.90% al. (2014) illustrated that not all purchased cattle pose
(95% CI: 0.00–97.70). the same risk. They found that purchase of pregnant
heifers and open cows with a calf at foot are associated
DISCUSSION with a higher risk of BVDV infection in beef herds,
with OR of 2.18 (95% CI: 1.17–4.08) and 2.09 (95%
By conducting this systematic literature search we CI: 1.13–3.88), respectively. The number of cattle intro-
have gained a comprehensive overview of potential risk duced was also studied several times, generally showing
factors for the presence of BVD in cattle herds. We increasing odds with increasing numbers of introduced
decided to focus on studies performed in Europe in an cattle (Gates et al., 2013; Graham et al., 2013, 2016;
attempt to reduce heterogeneity between results caused Byrne at al., 2017). It was, however, suggested that
by different cattle production systems on different the number of cattle introduced is related to herd size
continents. However, the results could be generalized (Graham et al., 2016; Byrne et al., 2017), indicating the
to areas outside Europe where there are similar cattle importance of correcting for herd size when studying
production systems (e.g., areas in the United States). purchase. A different way to study the risk of introduc-
The 18 European publications that were included in tion is to look at the number of source herds. Gates
this study showed a wide range of potential risk fac- et al. (2013) found a significant association between
tors that were grouped into 6 categories with similar BVDV infection and a larger number of source herds in
characteristics: (1) herd and animal characteristics, (2) dairy herds (OR = 4.42 in units of 10 farms, 95% CI:
cattle movement, (3) reproduction, (4) neighborhood 1.86–10.00) and beef herds (OR = 10.60 in units of 10
risk, (5) farm management and biosecurity, and (6) di- farms, 95% CI: 3.91–31.00). However, there was strong
agnostic testing and control programs. Although there correlation between the number of cattle introduced
was a lot of variation in risk factors between studies, we and the number of source herds (Gates et al., 2013).
performed several meta-analyses and obtained pooled Another risk factor related to cattle movement that
estimates for several frequently found risk factors. was studied frequently is participation in shows or mar-
Two herd characteristics that were frequently studied kets. Our pooled estimate shows significant higher odds
were herd size and herd type. Most studies found that of infection for herds that visit cattle shows or markets
larger herds were associated with higher odds of BVD (OR = 1.45, 95% CI: 1.10–1.91) compared with herds
infection. Only Hanon et al. (2018) found the high- that do not. This could be explained by the possibility
Journal of Dairy Science Vol. 103 No. 10, 2020van Roon et al.: RISK FACTORS FOR BOVINE VIRAL DIARRHEA VIRUS that cattle come in contact with BVDV-infected cattle association between biosecurity measures and BVDV at the show or market and infect the herd upon return- infection because biosecurity is considered an impor- ing or because of infection during transport. tant aspect of BVDV control (Moennig et al., 2005; No meta-analysis could be performed on any of the Lindberg et al., 2006). Gates et al. (2013) suggested reproduction variables because of the low number of that this could be related to the design of question- comparable studies. However, concerns have been naires (e.g., questionnaires that primarily use closed raised about transmission of BVDV by AI (Gard et al., yes–no questions, which forces farmers to choose one of 2007; Rikula et al., 2008). This may be prevented by the options even if neither is completely true). Farmers regular testing of bulls at AI centers and testing of im- could also give socially desirable answers because they ported semen (Eaglesome and Garcia, 1997; Wentink et fear possible consequences. Farmer behavior is another al., 2000; Lindberg et al., 2006). Also, the within-herd factor for which there were not enough quantitative calving pattern could not be compared between studies, data for meta-analysis. This lack of quantitative data but Williams and Winden (2014) found an increased does not necessarily mean that farmer behavior and bi- likelihood of BVDV presence with year-round calving osecurity are not important factors for BVD, but they compared with seasonal calving. They indicated that are more often studied qualitatively, which made it this could be related to the fact that with year-round impossible to include them in the meta-analysis. Quali- calving there are almost always pregnant cows present tative research into farmer behavior and biosecurity within the susceptible window for BVDV infection of related to BVD stresses the importance of addressing the fetus. When developing or optimizing BVD control farmer attitudes toward BVD control (Heffernan et al., programs, calving pattern could be an important factor 2016; Azbel-Jackson et al., 2018). A meta-analysis on to consider. In block calving systems, tissue tag testing epidemiological and mitigation measures that influence of newborn calves provides the opportunity to identify production losses in cattle due to BVDV has been re- and remove the majority of PI calves before the breed- ported (Pinior et al., 2019). These authors found that ing season commences, reducing the risk of establishing vaccination and biosecurity had a positive influence on more PI calves to be born the following season. In year- the annual BVDV production losses per animal. We round calving systems, spot testing could be a cost- agree that farmers’ attitudes toward BVD control and effective option to monitor new infections (Tratalos et biosecurity-related measures are important and influ- al., 2017). ence the effect of the risk factors we found in this paper. Bovine viral diarrhea can easily spread between herds For example, when a new cow is kept in quarantine and direct contact is possible between cattle (Tråvén et al., tested for BVD before its introduction in the herd, the 1991). Therefore, grazing is considered a risk factor for risk of introduction will be lower compared with new BVD as nose-to-nose contact between cattle of different cows that are directly introduced in the herd. There- herds may occur. However, our pooled estimate did not fore, we recommend further study of the quantitative show significant odds (OR = 1.10, 95% CI: 0.62–1.97) association between BVD control and biosecurity and for BVD infection for herds that graze compared with farmer behavior. herds that do not. When results that indicated shared No meta-analysis could be performed on any of the pasture were separated from results that indicated diagnostic testing and control program variables be- whether contact between cattle at pasture could occur cause of both the small number of studies and the large (e.g., over-the-fence contact), our pooled estimates were variation between variables. One study found slightly nonsignificant, but when taken altogether and thus in- higher odds for presence of BVDV when participating creasing statistical power, we found a significant effect in control programs in univariable analysis (Amelung indicating that contact between cattle at pasture had et al., 2018), which could probably be explained by the a higher odds of BVD infection (OR = 1.32, 95% CI: assumption that farms with BVDV problems are more 1.07–1.63). The risk of grazing is likely influenced by likely to participate in a control program. Another many factors, such as cattle density and the prevalence interesting result was that herds of farmers younger of BVDV in the area (Houe et al., 1995a), regulations than 40 yr were more often infected than herds of older around communal grazing (Rossmanith et al., 2005), farmers (Valle et al., 1999). According to Valle et al. the number of cattle and herds sharing pasture (Presi (1999), this is probably due to different attitudes and et al., 2011), and the number of neighbors. management practices of younger farmers, such as not In the current study, no meta-analysis was performed asking for health certificates when purchasing animals. on any of the farm management and biosecurity vari- This would be an interesting factor to consider in fu- ables due to the low number of studies and the differ- ture quantitative studies about BVDV infection and ing ways in which biosecurity was measured. It was farmer behavior. unexpected that most studies did not find a significant Journal of Dairy Science Vol. 103 No. 10, 2020
van Roon et al.: RISK FACTORS FOR BOVINE VIRAL DIARRHEA VIRUS In our meta-analyses, several pooled estimates were only from observational studies. A key principle under- significant. However, the results could be biased be- pinning this study is the potential for countries without cause most studies looked at the presence of BVDV and local knowledge of risk factors for BVDV to learn from not introduction of the virus. With presence of infec- those countries where data are available. In our view, tion, it is unknown when the actual infection happened, weighted average estimates have the potential to be which complicates finding direct associations between more helpful to readers while being cognizant of het- infection and risk factors. However, this would prob- erogeneity between studies rather than being solely a ably be less influential when considering risk factors listing of all available quantitative results. that do not change much over time, such as whether In our study, we tried to control for heterogeneity herds graze at pasture, herd type, and herd size. When and bias as much as possible through the checklist of studying the introduction of BVDV, it is possible that study appraisal for quantitative analysis (Table 1) and there is a delay between introduction and detection. by very carefully choosing the factors that could be For example, a PI calf introduced on a farm that moni- compared. The I2 statistics still showed a very high tors by bulk milk testing is unlikely to be promptly level of heterogeneity for all factors, but it is known detected unless individual animal testing is also con- to be not very accurate when only a small number of ducted on newly imported animals on the farm. Such studies (n < 20) are available (Huedo-Medina et al., situations complicate efforts to identify direct associa- 2006). Also, the very wide 95% CI of the I2 statistic tions between infection and risk factors. Therefore, we we observed show the degree of uncertainty about the think that the presence of BVDV is a reasonable proxy heterogeneity estimations. The influential case analy- for introduction of the virus. In addition, the presence ses showed that the I2 estimate was often lower when of risk factors does not often change as they are part of removing outliers from the meta-analyses; however, regular farm management. CI remained wide. Given this result, and because I2 is Another complicating factor in comparing different unreliable when few studies are available, we elected to studies was the way in which herds were categorized retain the outliers but to show the summary estimates as infected or not infected (e.g., based on antibodies or and I2 of each meta-analysis when excluding the outli- virus) using different sample types, tests, and strategies ers (Supplemental File S6, https://doi.org/10.3168/jds to confirm the infection status. These differences could .2020-18193). be considered by performing a formal assessment of risk To maximize the amount of quantitative data, we of bias. However, because we already had a low number decided to include both univariable and multivariable of studies per meta-analysis, we did not want to exclude OR in our analyses. Therefore, in 3 of the 6 meta- any more studies and decided to include only the most analyses we combined univariable and multivariable important internal and external validity checkpoints results. The rationale behind this is that in different (Table 1). Also, not all information was available in studies the multivariable OR were adjusted for differ- each publication for a proper bias risk assessment. ent factors and referred to different reference situations For several risk factors, it was not appropriate to and are therefore not necessarily more comparable than perform a meta-analysis given that there were not unadjusted univariable results. On the other hand, uni- enough comparable studies with sufficient quantitative variable OR can under- or overestimate the strength data. For the risk factors with sufficient data, the meta- of association. As there is not yet a uniform approach analyses indicated high levels of heterogeneity. This was regarding the use of univariable and multivariable expected as all papers included in our meta-analyses results in meta-analysis, adjusted and unadjusted OR were observational studies with different objectives, often are combined (Liu et al., 2017). As we decided study designs, and context. For that reason, performing to combine adjusted and unadjusted OR, we have per- meta-analysis on observational studies and obtaining formed subanalyses in which we compared the results pooled estimates have been extensively debated (Eg- when including only the univariable results or the mul- ger et al., 1998; Blettner et al., 1999; Ioannidis et al., tivariable results. In most cases we observed only mi- 2008). However, the number of published meta-analyses nor differences. In the meta-analyses on herd type and on observational data has substantially increased, and introduction of cattle, we did see a substantial decrease the need for guidelines for performing meta-analysis on in heterogeneity (I2). However, keeping in mind that observational data is emphasized (Mueller et al., 2018; the I2 statistic becomes increasingly unreliable when Dekkers et al., 2019). In the current study, we decided even fewer studies are included and because the sum- to perform meta-analyses on observational studies to mary estimates did not change that much, we decided provide an overview of available quantitative data, to combine univariable and multivariable results. The including a weighted average estimate. In this subject results of the subnalyses are reported in Supplemental area, quantitative risk factor information is available File S7 (https://doi.org/10.3168/jds.2020-18193). We Journal of Dairy Science Vol. 103 No. 10, 2020
van Roon et al.: RISK FACTORS FOR BOVINE VIRAL DIARRHEA VIRUS
also selected different observational study designs to Quality (the Hague, the Netherlands) and is part of
maximize the number of studies in our meta-analyses. the STOC free project that was awarded a grant by
Therefore, in 2 of the 6 meta-analyses (participation in the European Food Safety Authority (EFSA, Parma,
cattle shows and markets and contact between cattle Italy) and was co-financed by public organizations in
at pasture) we combined cross-sectional studies with the countries participating in the study. The authors
case-control studies. In the scientific literature, there have not stated any conflicts of interest.
is disagreement about whether different study designs
can be combined (Mueller et al., 2018). The influential REFERENCES
case analysis was conducted to determine whether the
case-control studies (only 3 out of 20 studies) were in- AHI (Animal Health Ireland). 2019. Programme results. Accessed Sep.
17, 2019. http://animalhealthireland.ie/?page_id=229.
dicated as outliers, which they were not. Consequently, Almeida, L. L., I. C. S. Miranda, H. E. Hein, W. S. Neto, E. F.
leaving them out would not make much difference, and Costa, F. S. Marks, C. R. Rodenbusch, C. W. Canal, and L. G.
therefore we decided to retain both study designs. We Corbellini. 2013. Herd-level risk factors for bovine viral diarrhea
virus infection in dairy herds from Southern Brazil. Res. Vet. Sci.
note that these 2 study designs are differing types of 95:901–907. https://doi.org/10.1016/j.rvsc.2013.08.009.
observational studies and use OR as outcome. Amelung, S., M. Hartmann, L. Haas, and L. Kreienbrock. 2018. Fac-
All studies included in our meta-analyses used OR to tors associated with the bovine viral diarrhoea (BVD) status in
cattle herds in Northwest Germany. Vet. Microbiol. 216:212–217.
show the strength of association between risk factors https://doi.org/10.1016/j.vetmic.2018.01.018.
and BVD infection. It should be kept in mind that these Aragaw, K., B. Sibhat, G. Ayelet, E. Skjerve, E. Z. Gebremedhin, and
OR are based on a certain reference population and K. Asmare. 2018. Seroprevalence and factors associated with bo-
vine viral diarrhea virus (BVDV) infection in dairy cattle in three
are therefore sensitive to how the reference category is milksheds in Ethiopia. Trop. Anim. Health Prod. 50:1821–1827.
defined. For this reason, it can be questioned whether https://doi.org/10.1007/s11250-018-1624-5.
OR are the right means to compare studies. It would Aye, Y. M., M. Aung, W. O. Kyaw, T. Naing, and S. P. Po. 2017.
Prevalence and associated factors with bovine viral diarrhoea virus
have been better to obtain probabilities of infection and antibodies in the bulk tank milk of small scale dairy herds in cen-
risk factor occurrence. However, given that these were tral Myanmar. Adv. Anim. Vet. Sci. 5:316–323. https://doi.org/10
often not reported and the fact that OR do provide .17582/journal.aavs/2017/5.8.316.323.
Azbel-Jackson, L., C. Heffernan, G. Gunn, and J. Brownlie. 2018.
a rough risk estimate, it was decided to conduct the Exploring the role of voluntary disease schemes on UK farmer
meta-analysis on OR. This should be considered when bio-security behaviours: Findings from the Norfolk-Suffolk Bovine
interpreting the results of this study. Viral Diarrhoea control scheme. PLoS One 13:e0179877. https://
doi.org/10.1371/journal.pone.0179877.
Barrett, D., M. Parr, J. Fagan, A. Johnson, J. Tratalos, F. Lively, M.
CONCLUSIONS Diskin, and D. Kenny. 2018. Prevalence of bovine viral diarrhoea
virus (BVDV), bovine herpes virus 1 (BHV 1), leptospirosis and
neosporosis, and associated risk factors in 161 Irish beef herds.
In this study, we found a wide range of potential risk BMC Vet. Res. 14:8. https://doi.org/10.1186/s12917-017-1324-9.
factors and performed meta-analyses on 6 risk factors Bedeković, T., N. Lemo, L. Barbić, Ž. Cvetnić, I. Lojkić, M. Benić,
for BVDV: herd size, herd type, participation in shows Ž. Čač, M. Lojkić, and J. Madić. 2013. Influence of category, herd
size, grazing and management on epidemiology of bovine viral di-
or markets, introduction of cattle, pasture, and contact arrhoea in dairy herds. Acta Vet. Brno 82:125–130. https://doi
at pasture. We did not find any unexpected risk fac- .org/10.2754/avb201382020125.
tors, and the pooled estimates can help guide advice to Bishop, H., J. Erkelens, and S. Van Winden. 2010. Indications of a
relationship between buying-in policy and infectious diseases on
farmers and assist in the development, evaluation, and dairy farms in Wales. Vet. Rec. 167:644–647. https://doi.org/10
optimization of BVD control programs. The results of .1136/vr.c5256.
the meta-analyses must be interpreted with care due Bitsch, V., K. E. Hansen, and L. Rønsholt. 2000. Experiences from
the Danish programme for eradication of bovine virus diarrhoea
to a high level of study heterogeneity but can assist in (BVD) 1994–1998 with special reference to legislation and causes
the development, evaluation, and optimization of BVD of infection. Vet. Microbiol. 77:137–143. https://doi.org/10.1016/
control programs. They can also be used as input for s0378-1135(00)00270-4.
Blettner, M., W. Sauerbrei, B. Schlehofer, T. Scheuchenpflug, and C.
BVDV modeling studies in herds that are comparable Friedenreich. 1999. Traditional reviews, meta-analyses and pooled
with the European cattle production systems. It was analyses in epidemiology. Int. J. Epidemiol. 28:1–9. https://doi
challenging to combine estimates of different studies .org/10.1093/ije/28.1.1.
Borenstein, M., J. P. Higgins, L. V. Hedges, and H. R. Rothstein.
due to heterogeneity between studies (e.g., study design, 2017. Basics of meta-analysis: I2 is not an absolute measure of het-
data analysis, data reporting), showing the need for erogeneity. Res. Synth. Methods 8:5–18. https://doi.org/10.1002/
more standardized methodologies in risk factor studies. jrsm.1230.
Buitrago Horta, E. R., C. Jiménez Escobar, and J. L. Zambrano
Varón. 2018. Identification of factors associated with exposure to
ACKNOWLEDGMENTS bovine viral diarrhea virus (BVDV) in dairy-herd calves in the Bo-
gotá savanna. Rev. Med. Vet. 36:63–73. https://doi.org/10.19052/
mv.5172.
This work was carried out with the financial support Byrne, A. W., M. Guelbenzu-Gonzalo, S. A. J. Strain, S. McBride, J.
of the Dutch Ministry of Agriculture, Nature and Food Graham, A. Lahuerta-Marin, R. Harwood, D. A. Graham, and S.
Journal of Dairy Science Vol. 103 No. 10, 2020You can also read