E. coliO157:H7 in beefburgers produced in the Republic of Ireland: A quantitative microbial risk assessment
←
→
Page content transcription
If your browser does not render page correctly, please read the page content below
Cover ecoli   31/8/06   9:52 am   Page 2

                                           AGRICULTURE AND FOOD DEVELOPMENT AUTHORITY

                                       E. coli O157:H7
                                       in beefburgers produced
                                       in the Republic of
                                       Ireland: A quantitative
                                       microbial risk
                                       assessment
R9020 ecoil booklet   31/8/06   9:47 am   Page 1

                 E. coli O157:H7
                 in beefburgers produced
                 in the Republic of
                 Ireland: A quantitative
                 microbial risk
                 assessment

                 ISBN: 1 84170 461 X

                 _________________________________________________
                 Published by Ashtown Food Research Centre, Teagasc,
                 Ashtown, Dublin 15, Ireland.

                                                                       i
R9020 ecoil booklet    31/8/06   9:47 am      Page 2

                      Risk Assessment Team

                      Dr Geraldine Duffy         Ashtown Food Research Centre, Teagasc, Ashtown, Dublin
                      Dr Francis Butler          Biosystems Engineering, University College Dublin
                      Dr Enda Cummins            Biosystems Engineering, University College Dublin
                      Dr Stephen O’Brien         Ashtown Food Research Centre, Teagasc, Ashtown, Dublin
                      Mr Padraig Nally           Biosystems Engineering, University College Dublin
                      Ms. Eimear Carney          Ashtown Food Research Centre, Teagasc, Ashtown, Dublin
                      Dr Maeve Henchion          Ashtown Food Research Centre, Teagasc, Ashtown, Dublin
                      Ms Denise Mahon            Ashtown Food Research Centre, Teagasc, Ashtown, Dublin
                      Mr Cathal Cowan            Ashtown Food Research Centre, Teagasc, Ashtown, Dublin

                      Risk Management Team

                      Dr Wayne Anderson          Food Safety Authority of Ireland (Chair)
                      Mr John Matthews           Anglo Irish Beef Processors Ltd.
                      Dr Patricia Garvey         Health Protection Surveillance Centre
                      Prof. James Sheridan       Ashtown Food Research Centre, Teagasc, Ashtown, Dublin
                      Mr Pat Brady               Associated Craft Butchers of Ireland
                      Ms. Catherine Higgins      Superquinn
                      Mr Joe Erraught            College of Catering, Cathal Brugha St., Dublin
                      Dr Paula Barry Walsh       Department of Agriculture and Food
                      Dr Thomas Quigley          safeFood, The Food Safety Promotion Board

                      Acknowledgement
                      We acknowledge with gratitude funding for this work from the Food Institutional Research Measure (FIRM)
                      administered by the Department of Agriculture and Food

             ii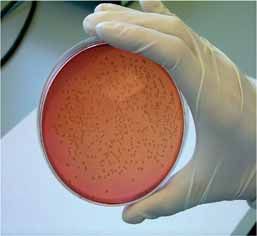
R9020 ecoil booklet      31/8/06     9:47 am    Page 3

        Table of Contents

        1.        Summary                                                                1
        2.        Introduction to quantitative microbial risk assessment                 3
        2.1             Risk analysis                                                    3
        2.2             Hazard identification                                            3
        2.3             Exposure assessment                                              3
        2.4             Hazard characterisation                                          4
        2.5             Risk characterisation                                            5
        3.        Objectives and scope of the quantitative risk assessment               5
        3.1             Risk management questions                                        5
        4.        Quantitative risk assessment model for E. coli O157:H7 in
                  beefburgers produced in Ireland                                        6
        4.1             Hazard identification                                            6
        4.2             Exposure assessment                                              10
        4.2.1                   Data inputs                                              10
        4.2.1.1                    Microbiological data                                  10
        4.2.1.2                    Consumer handling and cooking practices               14
        4.2.1.3                    Beef consumption patterns                             15
        4.2.2                   Exposure assessment model                                15
        4.2.2.1                    Module 1: slaughter module                            15
        4.2.2.2                    Module 2: beef mince / burger preparation to retail   23
        4.2.2.3                    Module 3: domestic storage and cooking                26
        4.3.            Hazard characterisation                                          28
        4.3.1                   Dose response model                                      28
        4.4             Risk characterisation                                            29
        5.        Answers to risk management questions                                   30
        6.        Conclusions                                                            31
        7.        References                                                             32

                                                                                              iii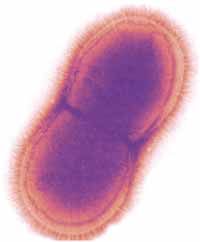
R9020 ecoil booklet    31/8/06     9:47 am    Page 1

        1. SUMMARY
        A quantitative microbial risk assessment (QMRA) model was developed for E. coli O157:H7 in beefburgers produced
        in the Republic of Ireland.
        The risk assessment model was broken into three modules:
            Module 1) slaughter process culminating in the production of boxed beef trimmings
            Module 2) mincing of beef, beefburger formation and retail distribution
            Module 3) domestic storage, cooking and consumption

        Data inputs and assumptions
        Initial data inputs to the model on the prevalence and concentration of E. coli O157:H7 were based on
        microbiological surveys on the pathogen in faeces (McEvoy et al., 2003) and hide (O’Brien et al., 2005a) of animals
        presented for slaughter at Irish beef abattoirs. The model outputs for prevalence and numbers of E. coli O157:H7
        at the end of module 1 and 2 were validated using microbiological surveillance data for E. coli O157:H7 on beef
        trimmings (Carney et al., 2006) and in beef mince / burgers at retail (Cagney et al., 2004) in the Republic of Ireland.

        The model assumed that contaminated hide and rumen contents were the vectors for cross contamination to
        carcasses and a cross contamination factor was created based on Irish surveillance data for the pathogen on bovine
        hide (O’Brien et al., 2005a) in rumen contents (McEvoy et al., 2003) and on beef carcasses (Mc Evoy et al., 2003;
        Carney et al., 2006). The changes in E. coli O157:H7 numbers on contaminated carcasses during carcass dressing
        operations including trimming of visibly dirty parts of carcass; carcass washing, evisceration and chilling were
        estimated based on research studies in the literature on the impact of these operations on pathogen numbers (Gill
        et al., 1996; McEvoy et al., 2003, McEvoy et al., 2004). The potential increase in numbers of E. coli O157:H7 in the
        boning hall was assumed to be minimal (McEvoy et al., 2004). A factor for estimating the transfer of contamination
        from carcass to trim was set in the model taking account of the surface area of carcass which was contaminated,
        the surface area of the trim, the weight of the trim and the number of trim in a box (27 kg). It was assumed that
        the beef trimmings were minced into 100g beefburger patties.
        Input data for the retail/domestic part of the model was based on two main sources. Information on typical
        consumer storage and cooking practices in the domestic environment was derived from a questionnaire survey of
        consumers conducted by the Market Research Bureau of Ireland (MRBI) (Mahon et al., 2003). Data on storage
        temperatures at retail and in domestic refrigerators were also gathered from temperature studies in both
        environments (Kennedy et al., 2005; Carney et al., personal communication) that found that temperatures ranged
        between 7 and 16ºC. Based on the survey of consumer cooking practices, the model was based on the premise that
        87% of consumers prepare hamburgers well done, 12% medium and 1% cooked them rare. A temperature
        distribution was set for the cooking temperature based on the assumption that beefburgers are cooked to mean
        temperatures of 68.3ºC (well done), 62.7ºC (medium) or 54.4ºC (rare) (Jackson et al., 1996). Consumption figures
        for beefburgers were derived from an Irish Food Consumption Survey carried out by the Irish Universities Nutrition
        Alliance (www.iuna.net) (Mahon et al., 2003) and the serving size for a beefburger was set at a mean of 100g.

        Model Outputs
        The risk model was created in Excel with the add-on package @RiskTM (Pallisade Corporation, New York, USA). The
        output of module 1 indicated a mean simulated prevalence of E. coli O157:H7 on beef trimmings of 2.40 % and a
        mean count of log10 -2.69 CFU g-1. This output was validated against a microbiological survey of E. coli O157:H7
        on beef trimmings in Irish abattoir which indicated a prevalence of 2.36 % and counts of log10 0.7 CFU g-1 to log10
        1.61 g-1 which indicates that the model simulated values and the survey results were similar.
        The output of module 2 indicated a mean simulated prevalence in fresh beefburgers of 2.9% and 2.2% in frozen
        burgers while the mean simulated counts in fresh and frozen burgers were log10 1.96 CFU g-1 and log10 -0.22 CFU

                                                                                                                                  1
R9020 ecoil booklet    31/8/06    9:47 am     Page 2

                      g-1 respectively. These predicted values were compared with microbiological survey data on prevalence and numbers
                      of E. coli O157:H7 on these products on retail sale in the Republic of Ireland and shown to be similar (prevalence
                      2.8%; counts log10 0.51 – log10 4.03 CFU g-1).

                      The dose response used was based on the model of Powell et al. (2000). The probability of illness caused by
                      exposure to E. coli O157:H7 in fresh beefburgers was reported for an “average” individual. Overall, the model
                      predicted that the risk of human illness from the consumption of a serving of minced beef and beefburgers was
                      –5.94 log (1.1 x 10⁻⁶). This is approximately 1 illness per one million burgers consumed.

                      Analysis of the risk model (by rank order correlation sensitivity analysis) indicated the following:
                      ●   The initial prevalence and numbers of E. coli O157:H7 on the bovine hide (correlation coefficient 0.62) had the
                          greatest impact on overall probability of illness from E. coli O157:H7. Cross contamination at hide removal
                          impacted on predicted risk (correlation coefficient 0.25).
                      ●   The impact of consumer practices on risk (calculated) from E. coli O157:H7 was examined. A sensitivity analysis
                          revealed that one of the most important factors was the cooking preference (correlation coefficient –0.57). The
                          higher the internal cooking temperature, the less the risk. “Well done” cooked burgers (mean internal
                          temperature 68.3°C ± 2ºC) virtually eliminated any probability of infection; “medium” cooked burgers (mean
                          internal temp 62.7°C ± 2ºC) also greatly reduced the probability of infection. Burgers cooked “rare” (mean
                          internal temp 54.4°C± 2ºC) constituted a significant risk to the consumer.
                      ●   Temperature abuse during retail storage temperature, during transport home and during home storage was
                          deemed a significant parameter influencing model predictions (correlation coefficient 0.48). It is concluded that
                          consumers can play a large role in reducing risk from E. coli O157:H7 in minced beef by keeping products
                          properly refrigerated and cooking burgers to a “well done” state.
                      ●   The prevalence / contamination levels of E. coli O157:H7 (and calculated risk) in fresh chilled beefburgers and
                          in frozen burgers were compared. Fresh burgers had a greater predicted prevalence (mean of 2.9% versus 2.2%
                          for frozen burgers) and higher mean counts (log101.96 CFU g-1 versus log10–0.22 CFU g-1 for frozen burgers).
                          This was mainly due to the higher probability for temperature abuse of fresh burgers during retail display,
                          transport and home storage.
                      ●   The difference in prevalence / contamination levels of E. coli O157:H7 (and calculated risk) in a beefburger made
                          from 100% beef (meat) was compared with a burger made with added ingredients. As added ingredients were
                          not identified as a significant risk factor in the contamination of beefburgers, they did not contribute directly to
                          the contamination level. However, because of the reduced beef incorporated into burgers with added
                          ingredients, a dilution effect was observed. The model indicated a reduction in prevalence of approximately 0.4%
                          and a reduction in counts of approximately log10 0.3CFU g-1 on contaminated beefburgers with added
                          ingredients, resulting in a reduction in exposure and hence risk.
                      ●   The prevalence / contamination levels of E. coli O157:H7 (and calculated risk) from E. coli O157:H7 in beef
                          mince purchased from a butcher shop was compared with product purchased from supermarket and the
                          prevalence and count level was found to be virtually the same in both types of establishment with no difference
                          in predicted risk.

             2
R9020 ecoil booklet     31/8/06     9:47 am     Page 3

        2. INTRODUCTION TO QUANTITATIVE MICROBIAL RISK ASSESSMENT
        2.1 Risk Analysis
        Risk analysis is a valuable tool in the management of microbial food safety issues and a systematic approach for
        the regulatory authorities and the food industry to control the risk posed by a pathogen in a particular food
        commodity. Risk analysis, as defined by Codex Alimentarius Commission (Codex, 1999) consists of three elements:
        risk assessment, risk management and risk communication. Risk assessment is the part of the process in which the
        hazards are identified and the risk posed by that particular hazard (i.e. pathogen) is calculated. Apart from an end
        point calculation of risk, the risk assessment model can be used to develop risk based management options like
        identifying the critical control points and setting quantitative critical limits as part of HACCP (Hazard Analysis
        Critical Control Point) systems.

        The principles of risk assessment and the fours stages involved (hazard identification, exposure assessment, hazard
        characterisation and risk characterisation) are outlined by the Codex Alimentarius Commission. Each of the stages
        is summarised below.

        2.2 Hazard identification
        A hazard can be defined as an agent with the potential to have an adverse effect on public health and may pose a
        short term, chronic, or fatal risk to a person. The identification of a microbial hazard associated with a particular
        food is generally based on information generated from routine microbial analysis of the commodity or from an
        epidemiological linkage of a particular pathogen with a case of food borne infection. Microbial pathogens may be
        present on raw food or may be introduced during processing, distribution, storage or final preparation by cross
        contamination. In particular, this may occur as a result of mincing, chopping or blending to homogenise foods or
        from cross contamination in the retail, food service or domestic environment.

        2.3 Exposure assessment
        Exposure assessment is a quantitative estimation of the amount of a contaminant in a typical serving of food. A
        microbial quantitative risk assessment can be based on the number of microorganisms at the time of consumption,
        or as close to this stage as is scientifically possible and practical. However, the final estimation of the numbers and
        prevalence of a pathogen in the food to be consumed is generally based on an accumulation of data on the
        prevalence and numbers of pathogen at key points in the food chain from the raw material though processing, retail
        distribution and domestic preparation. This provides information on the changes in pathogen numbers along the
        product chain and is a valuable tool in managing risk. The accuracy of an exposure assessment is highly dependent
        on the quality of the microbial data that is used in generating the assessment. In an ideal situation, data on
        prevalence, numbers, and virulence characterisation of the pathogen present are derived for the actual process, thus
        giving an exposure assessment with limited associated error. However, time restraints and lack of resources often
        rule this out as a viable option and so the data on the prevalence, numbers and types of microorganisms in a food
        are inferred from existing information sources. Sources used include the scientific literature, technical publications
        and conference abstracts, surveillance databases from national or regional public health bodies, industry
        surveillance testing and expert opinion where no data is available. Numerous problems arise in accessing data from
        these sources. Outside the scientific literature, available data is generally difficult to source. In particular, data for a
        specific raw product, ingredient or specific region / country can be difficult to obtain. Different microbiological
        methods may be used to obtain the results, the associated error may not be recorded or the method employed may
        not be mentioned. A further challenge is the lack of quantitative microbial data available for food borne pathogens.

        In conducting an exposure assessment along a particular food chain, data is needed on how particular processes or
        stages along the food chain impact on microbial numbers i.e. increase or decrease microbial counts. It is often not
        practical to conduct challenge tests and so the alternative is to use predictive microbial models. Predictive

                                                                                                                                       3
R9020 ecoil booklet 31/8/06 9:47 am Page 4
microbiology has developed as a science and is used as a means of predicting product self-life and to assist in
factoring food safety into a product design. The models developed vary in sophistication from primary level models,
which essentially collate pathogen numbers with time, to secondary models that recognise that the growth /
survival of microorganisms is not merely a function of time but is significantly effected by their surrounding
environmental parameters including temperature, pH, aw, sodium chloride etc. The next level of model is based on
tertiary equations which are computer software based and combine or build on elements of first and second order
models into an easy-to-use system to predict the growth of particular pathogens under a particular set of
conditions.
The overall exposure assessment relates the amount of contaminant in a designated amount of food with the
amount of food typically consumed in a single serving. Information on food consumed is typically procured from
food consumption databases developed for nutritional purposes.
The exposure assessment model can be ‘deterministic’, derived using single data points along the food chain.
However, this approach may result in outlier values being ignored and thus potentially underestimates or
overestimates the predicted risk, but is generally overly conservative. A more common approach is to use a
probabilistic or stochastic analysis, which uses all available data in a data distribution at each step as opposed to a
single value. Thus, at each sample point, account is taken not only of the values which fall in the mean range but
also of the outlier values, thus giving a more accurate data picture. The distribution chosen should provide a good
fit for the given data set and the analyses of all the distributions is generally conducted using a developed user-
friendly software system (@ RiskTM, Palisade, NY, USA) which facilitates a Monte Carlo analysis. In this process, a
single data point is chosen at random from each data distribution and used to calculate an outcome. The process
is repeated several thousand times (multiple iterations) with a new random data point from each distribution
chosen each time and with the final output being based on all the iterations. Error in the prediction may be related
to variability (a natural error related to randomness that cannot be altered by additional data or physical
measurements) or uncertainty (due to a lack of data in an area where more research or more data can reduce the
associated error). All risk models will have an error associated with their risk prediction and second order models
can be used to separate out the part of the error which is associated with uncertainty, as opposed to variability. It
is clear that the accuracy of the input data for the exposure assessment will influence the final output distribution
and associated uncertainty. This highlights the need for accurate prevalence and count data on the microorganism
in question and the importance of data on the impact that various process stages have on the microorganism.
2.4 Hazard Characterisation
Hazard characterisation relates exposure to a hazard with a probable public health outcome (e.g. illness/death). A
dose-response relationship can be used to estimate the exposure level (number) of microorganisms that will make
a person ill or which may be fatal. The data used in generating dose response models are derived from a variety of
sources including human clinical trials, epidemiological studies based on food poisoning outbreaks, animal clinical
trials, in vitro studies using cell lines, biomarkers or expert opinion. The logarithm number of microorganisms
ingested is plotted against the percentage of people that become ill to generate the dose response. Epidemiological
data on clinical illness can also be taken into account, including the number of people affected in outbreaks, the
profile of the population sickened (age, health status etc) and the severity of illness experienced (home recovery,
hospitalisation, fatalities).
4R9020 ecoil booklet 31/8/06 9:47 am Page 5
2.5 Risk Characterisation
The final stage in the process links the exposure assessment model with the hazard characterisation to give an
estimate of the probability of an adverse health effect or risk to a population as a consequence of exposure to the
hazard. In general, the risk characterisation sets out to estimate a number of factors which may include the
expected risk of infection in an individual or the risk of illness in a population. These may be based on a prediction
of illness per typical serving or calculated as an annual risk of illness. The risk estimates may be broken down into
age categories, immune status etc. to identify groups which may be at higher risk from exposure to the
contaminant.
As described for the exposure assessment model, the risk characterisation model is developed using commercial
software such as @RiskTM. The error associated with overall risk prediction can be separated to represent the
contribution from uncertainty and variability. Other add-on software programmes for Excel including Crystal Ball
(Decisioneering Inc., Denver USA) allow problem solving and more complicated risk estimation.
Apart from an overall estimate of risk and associated error, the risk model can be a valuable tool that can be used
to determine the most important risk factors. This can be achieved by means of a sensitivity analysis. This process
involves the determination of the effect of change in the input data (at different points along the food chain) on
the overall risk estimate. Risk ranking is an approach used in exposure assessment to rank different categories /
stages in the chain in order of potential risk from a particular microorganism, thus creating a sequential ordering
system of risk posed to each product. Equally, risk ranking could be used to assess which of the factors along the
chain contribute most to risk. Scenario analysis can be used to predict the expected reduction in risk which could
be achieved by introducing a particular risk reduction option. It can also be used to direct the deployment of
resources in a strategic manner and is a most useful tool from a risk management perspective.
3. OBJECTIVES AND SCOPE OF THE QUANTITATIVE RISK ASSESSMENT
Recognising the public health problem related to E. coli O157:H7 and the potential role of beef in its transmission,
The Department of Agriculture and Food through the Food Institutional Research Measure (FIRM) funded a research
programme to be conducted by Ashtown Food Research Centre, Teagasc and Biosystems Engineering Unit,
University College Dublin, to develop a quantitative risk assessment model for E. coli O157:H7 in beefburgers
produced in the Republic of Ireland. The risk assessment covered E. coli O157:H7 in the slaughter process
culminating in the production of boxed beef trimmings; mincing of beef and burger formation, retail distribution;
domestic preparation and cooking; consumption and predicted illness.
3.1 Risk Management Questions
Alongside the scientific team, a risk management forum was convened representing the key stakeholders including
beef slaughter and processing sector, retail sector, public health, regulatory authorities and the food safety agencies
(Food Safety Authority of Ireland, safefood, the Food Safety Promotion Board). At the outset of the programme, the
risk managers set out the questions which they wished the scientific risk assessment to answer. These were as
follows:
● Is there a difference in prevalence / contamination levels of E. coli O157:H7 (and calculated risk) in frozen
burgers versus fresh chilled beefburgers ?
● Is there a difference in prevalence / contamination levels of E. coli O157:H7 (and calculated risk) from a
beefburger made from 100% beef (meat) versus a burger made with added ingredients?
● Is there a difference in prevalence / contamination levels of E. coli O157:H7 (and calculated risk) from E. coli
O157:H7 from beef mince purchased from a butcher shop versus a supermarket?
5R9020 ecoil booklet 31/8/06 9:47 am Page 6
● What is the probability of a case of E. coli O157:H7 from a single serving of minced beef and what is the annual
probability of infection?
● What is the probability of a case of E. coli O157:H7 infection in different risk groups (young children, healthy
adults) from a serving of minced beef?
● What is the probability of E.coli O157:H7 illness from a minced beef meal prepared and consumed in the home
versus outside the home?
● What impact do consumer practices have on the risk (calculated) from E. coli O157:H7?
4. QUANTITATIVE MICROBIAL RISK ASSESSMENT FOR E. coli O157:H7 IN
BEEFBURGERS PRODUCED IN IRELAND
4. 1 Hazard identification
Escherichia coli
Escherichia coli O157:H7 is a member of the Enterhaemorrhagic group of E. coli (EHEC). Within this group of
pathogens, Escherichia coli O157:H7 is the most notorious and was first implicated in infectious disease in the early
1980s (Riley et al., 1982). The symptoms of infection from this group of organisms includes bloody diarrhoea and
severe abdominal pain. Haemolytic uraemic syndrome (HUS), a cause of acute renal failure, may be a complication
of the illness and neurological problems in the form of thrombotic thrombocytopaenic purpura (TTP) may also
occur. Immuno-compromised patients including young children and the elderly are at a particular risk of developing
HUS (Coia, 1998). Pathogenicity is related to the ability of the organism to adhere to and colonise the human large
intestinal epithelial tissue, forming attachment and effacing lesions (encoded by eae gene) and the production of
verocytotoxins (vt1, vt2). Between 2000-2004, clinical cases of E. coli O157:H7 in Ireland ranged from 1.0 to 2.2
cases per 100,000 (Table 1).
Table 1. Number of cases of confirmed E. coli O157 and crude incidence rate in the Republic of
Ireland, 2000-2004 (source: HPSC annual reports www.hpsc.ie)
Year Numbers of confirmed cases Crude incidence rate per
(number confirmed cases 100,000 population
including non-residents)
2000 37(42) 1.0
2001 50 (52) 1.4
2002 68 (70) 1.7
2003 88 2.2
2004 52 1.3
6R9020 ecoil booklet 31/8/06 9:47 am Page 7
E. coli O157:H7 in beef
While multiple sources and routes of transmission for E. coli O157:H7 are now recognised, beef and beef products
remain an important vector for the pathogen and continue to be linked to outbreaks across the developed world
(Table 2). Analyses of sporadic cases of E.coli O157:H7 infection have identified under-cooked beef as an important
risk factor (Kassenbourg et al., 2004).
The reported prevalence of E. coli O157:H7 in cattle faeces varies widely depending on location and study (Table
3). The typical pattern of shedding in a herd is sporadic with epidemic periods of shedding interspersed with periods
of non-shedding. In addition, it is usual that only a small number of animals in the herd are shedders. These
epidemics occur mainly during warm weather, suggesting that environmental proliferation may play an important
role in the epidemiology of E. coli O157:H7 (Hancock et al., 1998). Cattle are generally asymptomatic carriers of
E. coli O157 with illness only reported in young calves (Dean Nystrom et al., 1997). Studies have shown that within
a herd there can be a small number of persistent high shedders or super shedders and the reported concentrations
of the pathogen in naturally infected cattle is between 6.7 x 10⁵ and 1.6 x 10⁶ CFU g-1 (Matthews et al., 2006).
E. coli O157:H7 can potentially be deposited on the surface of beef carcasses during the slaughtering process as a
result of cross contamination from the bovine hide or gut contents. The hide is now generally accepted as an
important vector of faecal contamination and therefore VTEC into the abattoir. Bell (1997) reported high
contamination on sites associated with opening cuts and/or subject to hide contact during hide removal. Elder et
al. (2000) reported that faecal and hide prevalence were significantly correlated with carcass contamination.
Carcass dressing operations which may reduce the number of E. coli O157:H7 include trimming of visibly dirty areas
of carcasses; carcass washing (hot water); steam pasteurisation or treatment with decontaminants (organic acids).
Carcass chilling is not likely to have any significant effect on E. coli prevalence or counts (McEvoy et al., 2004).When
the carcass is boned and trimmed into smaller cuts, the concentration of E. coli O157:H7 should not increase if the
chill conditions are well-controlled but cross contamination may occur to other cuts and surfaces with distribution
of the pathogen throughout the ground meat. The survival characteristics of E. coli O157:H7 are generally similar
to most other E. coli strains. Storage temperature, pH, water activity and salt content are the most important
factors in relation to the survival and or growth of the pathogen in the food environment. The pathogen survives at
food freezing temperatures (-18ºC). E. coli O157:H7 strains also show acid tolerance at the extreme range for E. coli,
are capable of surviving at a pH of 2.5 (Waterman & Small, 1996) and as such may pose problems in ready-to-eat
low pH fermented meats.
During distribution and storage, retail display etc., failure to maintain chill temperatures may allow growth of the
pathogen. Improper handling of unpackaged meat or leakage from wrapped packages may also lead to cross
contamination. Studies on beef and beef products in a range of countries at the retail stage have shown E. coli
O157:H7 to be present in 0.43 to 5.22 % beef/beef products (Table 4). Epidemiologic evidence in outbreaks of E.
coli O157:H7 attributed to beef, continue to be associated with consumers/service sectors who do not understand
the risks of handling raw meat and have inadequate hygiene handling practices and undercook meat. A 1996 US
survey indicated that 19.7% of the population consumed pink (undercooked) hamburgers at some time during the
previous 12 months (CDC, 1998).
To strategically manage the risk posed by E. coli O157:H7 in ground/minced beef, a number of QMRA have been
developed for E. coli O157:H7 in USA, Canada, Australia and The Netherlands (Cassin et al., 1998; Lammerding et
al., 1999; Ebel et al., 2004; Nauta et al., 2001).
78
R9020 ecoil booklet
31/8/06
Table 2. Summary of selected outbreaks of E. coli O157:H7 attributed to contaminated beef
9:47 am
Location Year Beef product and Number of Number of Reference
Page 8
mode of transmission Cases HUS (deaths)
France 2005 Frozen branded beefburgers 26 13 (0) Anon., 2005
at retail outlets
Japan 2005 Beef offal served in a restaurant 7 0 (0) Maruzumi et al., 2005
USA 2004 Beef tacos at fast-food restaurant 13 3 (0) Jay et al., 2004
USA 2003 Frozen steak : blade tenderised and 12 1 (0) Laine et al., 2005
injected with marinade
Japan 2002 Grilled beef 28 0 (0) Tsuji et al., 2002
USA 2002 Ground beef at retail outlets (multi-state) 28 5 (0) Anon., 2000
USA 1995 Roast beef at catered banquet 61 0 (0) Rodrigue et al., 1995
USA 1992-93 Undercooked beefburgers in fast-food 501 45 (3) Bell et al., 1994
outletsR9020 ecoil booklet
Table 3. Summary of studies on prevalence of E. coli O157:H7 in cattle faeces
31/8/06
Country Sample Year Type of Cattle Number positive Reference
9:47 am
(%)
Page 9
Spain 1993 - 1994 Beef / dairy cattle on farms 1/686 (0.1%) Blanco et al., 1997
Spain 1998 - 1999 Feedlot cattle 55/471 (12%) Blanco et al., 2000
Ireland 1998 - 1999 Faeces of slaughtered cattle 6/250 (2.4%) McEvoy et al., 2003
England/Wales 1999 Dairy, suckler and fattening herds 219/4,663 (4.7%) Paiba et al., 2003
Netherlands 1996 Dairy cattle on farms 75/1,152 (7%) Heuvelink et al., 1998
Norway 1995 Heifers and milking cows 6/1,970 (0.3%) Vold et al., 1998
Slovenia 1996 - 1997 Slaughtered cattle 2/250 (0.8%) Andlovic and Marinsek, 1997
USA 2002 Cull dairy cattle 21/1,026 (2.1%) Dodson and LeJeune, 2005
USA 2001 Feedlot cattle 1087/10,662 (10.2%) Sargeant et al., 2003
Canada 1992 - 1993 Dairy cattle 12/1,478 (0.8%) Wilson et al., 1996
Switzerland 2005 Dairy cattle 23/500 (4.6%) Kuhnert et al., 2005
Japan 1992 - 1994 Slaughtered cattle 7/387(2%) Miyao et al., 1998
9R9020 ecoil booklet 31/8/06 9:47 am Page 10
Table 4. Prevalence of E. coli O157:H7 in beef mince /beef products
Country Sample year(s) Beef type Number positive Reference
(%)
Ireland 2001-02 Beef mince and 43/1,500 (2.8%) Cagney et al., 2004
burgers
Italy 2000-01 Minced beef 4/931 (0.43%) Conedera et al., 2004
U.K. 1996-97 Beef products 36/3,126 (1.1%) Chapman et al., 2000
Switzerland 2000 Beef mince 5/211 (2.3%) Fantelli & Stephan, 2001
Argentina 2000 Beef mince 6/160 (3.8%) Chinen et al., 2001
USA 2000-03 Ground beef 189/26521 (0.71%) Naugle et al., (2005)
Botswana 2002-03 Beef cubes, 7/134 (5.22%) Magwira et al., 2005
minced beef, 5/133 (3.76%)
beef sausages 3/133 (2.26%)
4.2 Exposure assessment
The exposure assessment model was broken into three modules covering
module 1) slaughter process culminating in the production of boxed beef trimmings
module 2) mincing of beef, beefburger formation and retail distribution
module 3) domestic storage, cooking and consumption.
In order to validate the exposure assessment model, key outputs at end of module 1 (prevalence and concentration
of E.coli O157: H7 in beef trimmings) and end of module 2 (prevalence and concentration of E.coli O157: H7 beef
products at retail) were microbiologically examined to determine the prevalence and concentration of the pathogen
and compared against the model outputs.
4.2.1 Data inputs
4.2.1.1 Microbiological Data
It was recognised that there were large gaps in the data on E. coli O157 in the Irish beef chain which would be
essential to develop the model (data on numbers/ prevalence of E. coli O157:H7 on hides of animals presented for
slaughter in Irish abattoirs) and to validate the outputs of the model (data on numbers/ prevalence of E. coli
O157:H7 on beef trimmings, and on beef products at retail in the Republic of Ireland) for Irish-produced minced
beef. Substantial research was conducted to fill in data gaps as outlined below.
4.2.1.1.1 Microbiological methods (O’Brien et al., 2005b)
It is well recognised that some of the error in a microbiological risk assessment is related to the microbiological data
on which it is based. Equally, the microbiological data is only as good as the method used to generate the data. It
is important in risk assessment to be able to attribute the error related to the methods used in generating the data.
In this study, experiments were carried out to assess the detection limits for cultural methods used to enumerate
10R9020 ecoil booklet 31/8/06 9:47 am Page 11
and recover E. coli O157:H7 from beef mince and bovine hide (O’Brien et al., 2005b). Minced beef and bovine hide
were inoculated with varying concentrations (log101.58-2.58 CFU g-1 and log10 2.20-4.49 CFU 100 cm2
respectively) of E. coli O157:H7 and recovered using an enumeration (direct plate method) or presence /absence
method (enrichment / immunomagnetic separation) and then plated onto Sorbitol McConkey Agar (SMAC) or
SMAC-Cefixime Tellurite (CT) in both cases. The direct plate method detected the pathogen consistently from
minced beef samples with an average recovery of 69.2 - 91.2 %. From faecal material on the bovine hide, the
recovery of the pathogen ranged from 1.80 – 64.5 % with fresh faeces, depending on the inoculum, while from dried
faeces on hide, the results ranged from no recovery to 25 %. Enrichment/ immunomagnetic separation (IMS)
recovered E. coli O157:H7 at all inoculum levels tested in beef mince, while the pathogen was only detected
consistently at an average inoculum level of log10 2.20 CFU 100 cm2 from fresh faeces and log10 4.49 cfu 100 cm2
from dried faeces on bovine hide. These errors (underestimation of counts) associated with the method were
included in the developed model.
MicrobioIogical input data (O’Brien et al., 2005a; Carney et al., 2006; Cagney et al., 2004)
Bovine hides samples (n = 1500) were collected over a 17 month period (30 samples per week) by sponge swabbing
areas of approximately 122 cm2 of the bovine rump of slaughtered cattle at an early stage of carcass processing
(first legging). Sponge samples (n= 1500) were stomached in Buffered Peptone Water supplemented with
novobiocin and either directly plated on SMAC-CT agar or enriched for 24 h, extracted by immunomagnetic
separation (IMS), and plated onto SMAC-CT. Overall, E. coli O157 was recovered from 109 samples (7.3 %) at
concentrations ranging fromR9020 ecoil booklet 31/8/06 9:47 am Page 12
Table 5. Virulence profile for E. coli O157 isolates from bovine hide (n=109)
Virulence Genes
No. (%) total
isolates isolates hlyA eaeA vt1 vt2 rfbO157 fliCh7
62 56.9 + + - + + +
29 26.6 + + - + + -
9 8.3 - - - - + +
5 4.6 + + + + + +
2 1.8 + + - - + +
1 0.9 + + + + + -
1 0.9 - - + - + -
+ = Positive - = Negative
Microbiological surveillance data used to validate the model (Carney et al., 2006, Cagney et al., 2004)
The prevalence and number of E. coli O157 was assessed on samples of beef trimmings (fragments of beef derived
during carcass deboning) (n=1351), beef carcasses (n= 132) and bovine head meat (n=132) in a beef slaughter
plant in Ireland over an 18 month period (2002 to 2003) (Carney et al., 2006). Samples were examined for the
presence of E. coli O157:H7/H- by direct plating on SMAC-CT and by enrichment / immunomagnetic separation
(IMS) with plating of recovered immunobeads onto SMAC-CT agar. Presumptive E. coli O157:H7/H- isolates were
confirmed by PCR targeting a range genes i.e. vt1, vt2, eaeA, hlyA and the O-antigen encoding region of the pO157
gene. E. coli O157:H7/H- was recovered from 2.36 % (32/1351) of beef trimming samples at concentrations
ranging fromR9020 ecoil booklet 31/8/06 9:47 am Page 13
Table 6. Virulence profile of E. coli O157 isolates recovered from beef trimming 90 vl* (n=14) or 70 vl (n=18),
carcasses (n= 4) and head meat (n=3)
Virulence Genes
Source No. of Isolates hlyA eaeA vt1 vt2 H7
Trimming 7 + + + - +
Trimming 5 + + - + +
Trimming 1 + + - + -
Trimming 1 - - - - +
Trimming 9 + + - + +
Trimming 6 + + + - +
Trimming 2 + + + + +
Trimming 1 + + + - -
Carcass 1 + + + + +
Carcass 2 + + + - + _
Carcass 1 + + - + +
Head meat 3 + + - + +
*vl = visual leanness, + = Positive, - = Negative
beef products (2.8 %) contained E.coli O157:H7. The number of E.coli O157: H7 in 21 of these samples ranged from
log100.51 to log10 4.03 CFU g-1 ( i.e. 3 to 10,700 bacteria per gram) while in the remaining 22, the pathogen was
detectable by enrichment only. There was a seasonal effect observed with 33 of 43 positive samples detected in
January (n = 8), April /May (n = 20) and August (n = 5) and the remaining 10 positive samples detected over the
other 8 months. Of the beef products testing positive, 32 were purchased from supermarkets and 11 from butcher
shops. E.coli O157: H7 was recovered from 2.8% (13 / 457) fresh packaged mince and from 1.88 % (3 / 160) of
fresh unpackaged burgers purchased from butcher shops. Of the 43 isolates recovered, 41 contained the virulence
genes, vt1, vt2, eaeA and hlyA genes while the remaining 2 isolates contained only one of the vt producing genes
(vt 1or vt2).
13R9020 ecoil booklet 31/8/06 9:47 am Page 14
The overall microbiological results used as input and to validate the model are summarised in Table 7 below.
Table 7. Summary of prevalence and numbers of E. coli O157:H7 at various sample points along the beef chain
in Ireland used to develop (hide, carcass, faeces, rumen contents) or validate (trimmings, retail mince/burgers)
the QMRA model
Sample type Sample Number positive Numbers present Reference
number (%) (log10 CFU)
Bovine faeces 250 6 (2.4%) - McEvoy et al., 2003
Rumen contents 250 2 (0.8) - McEvoy et al., 2003
Bovine hide 1500 109 (7.3) 0.13 - 4.24 /100 cm2 O’Brien et al., 2005
Beef carcasses 250 8 (3.2) - McEvoy et al., 2003
Beef carcasses 132 4 (3.0) 0.70 - 1.41 g-1 Carney et al., 2006
Head meat 100 3 (3.0) 0.70 -1.00 g-1 O’Brien et al., 2005
Beef trimmings 1351 32 (2.36) 0.70 - 1.61 g-1 O’Brien et al., 2005
Retail beef mince/burgers 1533 43 (2.8) 0.52 – 4.03 g-1 Cagney et al., 2004
4.2.1.2 Consumer handling and cooking practices
One of the most difficult parts of the exposure assessment is the final phase of the chain, from consumer purchase
of beef at retail, through domestic storage and preparation. This part of the chain is not regulated and it is difficult
to conduct microbiological sampling or to predict the fate of the pathogen as exact storage and preparation
methods are unknown and may be highly variable. In order to get an estimate and make assumptions about the
fate of E.coli O157:H7 in this part of the beef chain in Ireland, the Market Research Bureau Ireland (MRBI) was
commissioned to conduct a specially-designed questionnaire (multiple-choice questions) which was administered
by telephone survey to 500 people (covered gender, age and socio – economic diversity) to beef consumers who
were the main purchaser of beef in the household.
The study generated on consumer habits regarding the purchase and preparation of beef mince is complied in a
report (Mahon et al., 2003). To summarise, a high percentage of consumers (59 %) purchased their beef early
during their shopping trip and the majority of respondents (83%) did not use cooler bags for their chilled or frozen
products. The majority of respondents (97%) returned home within two hours of shopping and refrigerated or froze
the meat immediately. Approximately 44% of consumers stored their mince beef or burgers on a middle or high
shelf in the fridge, or uncovered, thus contributing to the risk of cross contamination from meat drip to ready-to-
eat foods on a lower shelf or from contact with adjacent food. The majority (96%) consumed fresh mince beef
within two days of purchase.
Regarding the handling and preparation of food, the majority of respondents (58%) thawed their meat at room
temperature as opposed to the refrigerator or microwave. A significantly higher proportion of females (94%) cooked
their burgers more thoroughly than males (67%). 87% of consumers prepare hamburgers well done, 12% medium
and 1% cooked them rare. Although differences were noted between food handling practices across gender and the
different age groups, differences were not statistically significant.
14R9020 ecoil booklet 31/8/06 9:47 am Page 15
4.2.1.4. Beef consumption patterns
Data on consumption of beef in Ireland was collated from the Survey of Lifestyle, Attitudes and Nutrition (S.L.A.N)
database (National University of Ireland, Galway) and the Irish Universities Nutritional Alliance database (University
College Cork) (www.iuna.net). The latter database was set up based on a nutritional survey conducted between
1997 and 1999 to provide up-to-date information on habitual food and drink consumption in Irish adults. The
executive summary and the complete survey report are available on the website www.iuna.net.
The purpose of the analysis in this study was to estimate minced meat and beefburger intakes in the adult
population as a whole, for men and women of different ages, taking into account seasonality and location where
beef consumed. Emphasis was placed on describing the quantity of minced meat/burgers consumed on average per
eating occasion. The data is included in a consumption report (Mahon et al., 2003).
4.2.2 Exposure Assessment Model
The exposure assessment model was developed in a spreadsheet (Microsoft Excel 97) with the @Risk add-on
package (Palisade Software, Newfield, N.Y.) and the simulation was performed using Latin Hypercube sampling. The
exposure model developed was a second order model for both the production of beef trimmings and the production
of retail beefburgers. Distributions were used to represent data rather than point estimates. Bayesian analysis was
used to reduce the uncertainty around the predicted risk estimate. Variability (natural randomness in system e.g.
number of animals slaughtered) and uncertainty (lack of knowledge e.g prevalence) were incorporated into the
model.
4.2.2.1 Module 1: Slaughter module
The slaughter module simulated the potential contamination of carcasses in the abattoir with E. coli O157:H7,
taking account of the impact various slaughtering processes may have on the distribution of the bacteria. A flow
diagram of the slaughter process is shown in Figure 2 and the initiating parameters for the model are shown in Table
8. The data inputs for the model included the prevalence and number of E.coli O157:H7 on the hide and in the
rumen contents of animals presented for slaughter as described above (O’Brien et al., 2005a and McEvoy et al.,
2003, Table 7). The initial number of bacteria on animal hides was modelled by fitting a second-order continuous
non-parametric distribution to a data set using methodology as detailed by Vose (2001). The distributions are
shown in Figures 3, 4 and 5.
Figure 2: Flow diagram of slaughter module Note: (vl = visual lean meat)
Stunning Brisket sawing Carcass washing
Shackling / hoisting Evisceration Chilling
Neck / hide opening Carcass splitting Boning out
and bleeding
Removal of hooves Spinal cord removal Trimmings
De-hiding Trimming Boxed beef Boxed beef
trimmings trimmings
(90vl) (70vl)
Head removal Carcass grading,
weighing and
stamping
15R9020 ecoil booklet 31/8/06 9:47 am Page 16
The model assumed that contaminated hide and gut contents were the main vector for cross contamination to
carcasses at the hide removal stage and at evisceration cross contamination factors from hide to carcass and from
rumen contents to carcass were created (Figure 6, 7) based on Irish surveillance data for the pathogen on bovine
hide (O’Brien et al., 2005a) and on beef carcasses (McEvoy et al., 2003; Carney et al., 2006).
Operations during the slaughter process (Figure 2) may impact on the number of E. coli O157:H7 (CFU /cm2) on
contaminated carcasses. Trimming visibly dirty parts of carcass can significantly reduce bacterial counts on
carcasses (Gill et al., 1996). Carcass washing with potable water at a temperature of 35 - 40oC reportedly has no
significant change on generic E. coli counts (McEvoy et al., 2004) but there is also evidence that some washing
procedures may redistribute bacteria to other parts of the carcass (McEvoy et al., 2003; Bell, 1997). The overall
reduction in counts as a result of these operations was modelled using a triangular distribution with a minimum
reduction of zero and uncertainty about the mean was modelled using a uniform distribution (uniform distribution
(0.3, 0.7) and uncertain maximum value (uniform distribution (0.8, 1.2).
Table 8. Initiating parameters distributions and inputs
Parameter Symbol Distribution/model Category Units
Animals slaughtered in a day As 350 Fixed value animals
Prevalence in the gut Pg beta(3,247) Uncertainty prevalence
Prevalence on the hide Ph beta(110,1390) Uncertainty prevalence
Test sensitivity Tse Derived by bayesian Inference (see text) Uncertainty factor
True Prevalence Pht Ph/Tse prevalence
Number of animals with E. coli in gut Ag binomial(As,Pg) Variability animals
Number of animals with E. coli on hide Ah binomial(As,Pht) Uncertainty animals
Transfer ratio between hide TR beta(4,32)/beta(110,1390) Uncertainty prevalence
and carcass
Prob of infected carcass Pc 1-(1-Pht × (TR/As))^As Calculation ratio
Number of contaminated Cc binomial(As,Pc) Variability animals
carcasses
Total surface area of animal TSA 32000 Fixed value cm2
Mass of a combi bin M 2700 Fixed g
X < = 26.26 X < = 93.22
0.03 5% 95%
Mean = 55. 56067
0.025
P ro babil ity De n si t y
0.02
0.015
0.01
0.005
0
0 50 100 150
3
Nu m b e r in fected (10 )
Figure 3. Distribution curve for number of animals with E.coli O157:H7 on hide (Distribution Nh~ Poisson(S,Ph)
16R9020 ecoil booklet 31/8/06 9:47 am Page 17
1
0.8
Cumulative Probability
0.6
Mean = 1.1
0.4
0.2
0
0 1 2 3 4 5
2
Log 10 CFU/100 cm
Figure 4: Cumulative distribution curve for counts of E.coli O157:H7 on hide (Distribution Nh~ Poisson(S,Ph)
XR9020 ecoil booklet 31/8/06 9:47 am Page 18
XR9020 ecoil booklet 31/8/06 9:47 am Page 19
Chilling can have an impact on bacterial numbers and McEvoy et al. (2003) reported a reduction in prevalence on
carcasses after chilling for 24 hours. Similarly Gill et al. (1996) reported a reduction in coliforms and E. coli on
carcasses following cooling processes of between 0.5 log10 units and 2 log10 units. Sheridan (2000) noted that
carcass contamination may increase, decrease or remain unchanged following chilling and depended on parameters
such as temperature, air speed and relative humidity. In the model, growth or decline is assumed to occur only on
carcasses that are contaminated on entering the chiller. The change in counts on contaminated carcasses during
chilling was modelled in this study using a normal distribution with an uncertain mean ranging from -0.5 to 0.5
log10 and a standard deviation of 1 (Figure 8).
0.5 XR9020 ecoil booklet 31/8/06 9:47 am Page 20
Table 9. Model inputs and distributions for carcass simulation
Parameter Symbol Distribution/model Category Units
Flag for Carcass infected Fc binomial(1,Pc) Variability FLAG
Flag for Infected gut Fg binomial(1,Pg) Variability FLAG
Initial number on hide Ih Second order continuous non parametric Variability and log10 cfu/100 cm 2
distribuion fitted to data Uncertainty (see text)
Factor increase for test se Fi Uniform(0.5,1.5) Uncertainty
True number on hide Iht LOG(10^(Ih+Fi)/100) Calculation log10 cfu/cm 2
log factor for decrease R Cumulative distribution fitted to data Variability factor
from hide to carcass.
Initial number introduced Ic Iht-R Variability log cfu/cm 2
10
during dehiding (on carcass)
Total contaminated A 10^(Triang(LOG(30), LOG(300), LOG(3000))) Variability 2
cm
surface area
Total organisms on contam Bc,h LOG((10^Ic) × A) Variability log10 CFU/carcass
carcass at dehiding
Most likely reduction due D1mm Uniform(0.3, 0.7) Uncertainty logs
to decontam
Maximium reduction due D1max Uniform(0.8, 1.2) Uncertainty logs
to decontam
Reduction due to D1 Triang(0,D1mm,D1max) Variability logs
decontamination
Probability of contam at evis E 10^-(Uniform(2,3)) Uncertainty probability
Cut at evis flag Ef Binomial(1,E) Variability FLAG
Total organisms on contam Bc,e LOG((10^Ic) × A) Calculation log10CFU/carcass
carcass due to evis
Most likely decontamination D2mm Uniform(0.3, 0.7) Uncertainty logs
Most likely max decontamination D2max Uniform(0.8, 1.2) Uncertainty logs
Decontamination (pasteurise) D2 Triang(0,D2mm,D2max) Variability logs
Change in numbers during CRm Uniform(-0.5, 0.5) Uncertainty logs
Chilling mean
Stdev of numbers during chill CRstdev 1 fixed value logs
Change in numbers during Chilling CR Normal(CRm, CRstdev) Variability logs
Change in numbers in boning hall G Triang(0, 0.33, 2) Variability logs
(growth)
Number of organisms per carcass Nd LOG(10^Bc,h × 10^-D1 × 10^-D2 × 10^CR × 10^G) Calculation Log number of E.coli
after boning out organisms
Number of organisms per carcass Ne LOG(10^Bc,e × 10^-D1 × 10^-D2 × 10^GR × 10^G) Calculation Log number of E.coli
after boning out organisms
Number of organisms per carcass Nf LOG(((10^Bc,h × 10^-D1)+10^Bc,e) × 10^-D2 × 10^CR × 10^G) Calculation Log number of E.coli
after boning out (contam at evis organisms
Density on carcass (hide only) nd LOG((10^Nd)/A) Calculation 2
log organisms/cm
Density on carcass (evis only) ne LOG((10^Ne)/A) Calculation 2
log organisms/cm
Density on carcass (both) nb LOG((10^Nf)/A) Calculation 2
log organisms/cm
Beef trimmings
A factor for estimating the transfer of contamination from carcass to trim was set in the model, taking account of
the surface area of carcass which was contaminated, the surface area of the trim, the weight of the trim and the
number of trim in a box (27 kg). The data inputs for modelling the prevalence and number of E. coli O157:H7 are
shown in Table 10.
20R9020 ecoil booklet 31/8/06 9:47 am Page 21
Table 10. Summary of inputs for beef trimmings simulation
Parameter Symbol Distribution/model Category Units
Mean Mass of trimming (70VL) Mm Bootstrap on data set (see text) Uncertainty g
Standard deviation for mass trimming Mstdev Bootstrap on data set (see text) Uncertainty g
Mass of trimming (70VL) Mtrim,i Normal(Mm, Mstdev, Truncate(2000, ) Variability g
Total scrap wt, Mass of trim a carcass Mc,a Ntc g
contributes to a box ∑M
i =1
trim, i
Cumulative mass in box Cm x g
∑M
a =1
ca
Number of trimming per carcass(70VL) Nc Triang(5, 6,7) Variability trimmings
Number of trimmings a Ntc Uniform(4,Nc) Variability trimmings
carcass contributes to a box
Surface area of trim Satrim,i Uniform(0.1, 0.5) Uncertainty 2
cm /g
2 Atrim,i Mtrim,i × Satrim,i 2
Total cm placed in a box by animal cm
Expected number of contaminated cm
2 Acontam,i ⎛ ⎡ i ⎤⎞ Variability cm
2
per trimming ⎜ ⎢ A−∑ Acontam,x ⎥⎟
Poisson ⎜Atrim,i ×⎢ x=0
⎥⎟
⎜ i
⎥⎟
⎜ ⎢
⎣⎢
−
TSA ∑ Atrim,x ⎟
⎦⎥⎠
⎝ x=0
2 Acc,a x Calculation 2
Expected number of contaminated cm cm
a carcass contributes to a box ∑A i =o
contam,i
E. coli numbers, hide only Ctrim,i nd Variability CFU
Poisson(10 × Acontam,i)
E. coli numbers, gut only Ctrim,i ne Variability CFU
Poisson(10 × Acontam,i)
E.coli numbers, both Ctrim,i Poisson(10nf × Acontam,i) Variability CFU
Infected trimmings It count if (Ctrim >0) Calculation trimmings
x Nt
Total E.coli in combi Calculation CFU
∑∑ C
a =1 i =1
trim , a ,i
Mean trimmings per carcass TCm From Nc distribution trimmings
Standard deviation of trimmings per carcass TCstdev From Nc distribution trimmings
Total trimmings produced Tp Normal(As × TCm,SQRT(As) × TCstdev) trimmings
Probability that a contaminated carcass will
produce a contaminated trim Pc Precedure in model, see text. probability
Total infected trimmings Tip binomial(Normal(Cc × TCm,SQRT(Cc) × trimmings
TCstdev), Pc)
Model outputs for slaughter module
The model indicated a mean simulated prevalence of E. coli O157:H7 on beef trimmings of 2.40 % and mean
counts of -2.69 log10CFU g-1 (distribution, Figure 9). This output was compared against a microbiological survey of
the E. coli O157:H7 on beef trim in Irish abattoir which indicated prevalence (2.36 %) and numbers (0.7 - 1.61 log10
CFU g-1 (Figure 10). The mean values for the simulation and the survey are similar, although the simulated
distribution is considerably wider, highlighting the uncertainty in the input parameters.
21R9020 ecoil booklet 31/8/06 9:47 am Page 22
70 XR9020 ecoil booklet 31/8/06 9:47 am Page 23
The simulated results indicate that many of the trimmings may have very low bacterial counts with 95th percentile
< Log10 -0.55 CFU g-1 (Figure 10). This is supported by the fact that very few of the E. coli O157:H7 positive trim
samples could be enumerated using direct plate techniques. Of the ones that were enumerated, counts were
between 0.05 - 0.65 log10 CFU/g which is within the range indicated by the model.
To determine the uncertainty parameters responsible for the wide spread of the probability distributions for both
prevalence and counts, a sensitivity analysis was performed. A sensitivity analysis is a systematic evaluation of
model inputs and assumptions. The parameters were ranked in accordance with the magnitude of their effect on
model predictions. The sensitivity of the prevalence and counts of E. coli O157:H7 on contaminated trimmings to
input values was measured by rank correlation
The input having greatest impact on E. coli prevalence (Figure 11) was the test sensitivity, followed closely by the
hide carcass transfer factor and the initial hide prevalence. The analysis reveals that additional efforts are also
needed to understand the processes involved in the initial transfer of E. coli to the carcass and to reduce or limit
such a transfer. Hide prevalence was significantly correlated with carcass contamination, indicating a role for control
of E. coli O157:H7 in live cattle
The initial count on the animal hide was the parameter having the greatest impact on count predictions in the
model, highlighting the need to investigate the uncertainty about this parameter. The contaminated surface area
and the transfer of the pathogen from hide to carcass also had an impact on model predictions, highlighting the
requirement to better understand the dynamics of microbial transfer from hide to carcass. Other input parameters
in the model had a lesser effect on model predictions.
Initial count on hide 0.156
Contam surface area 0.073
Decrease from hid e to carcass -0.072
Ml reduction by decontam 0.052
Trimmings per carcass 0.045
Recovery ad justment 0.044
std mass trim 0.043
Evis prob 0.036
-0.3 -0.2 -0.1 0 0.1 0.2 0.3
Correlation Coefficient
Figure 11: Sensitivity analysis on factors (uncertainty input parameters) affecting the counts of E. coli O157:H7
on contaminated beef trimmings
4.2.2.2 Module 2: Minced beef and burger preparation to retail
This module focused on the processing of beef trimmings coming from one or more 27.5 kg boxes of beef
trimmings into products i.e. beefburgers (100g) to be sold at butchers shops or supermarkets. Figure 12 shows a
flow diagram of the module.
23R9020 ecoil booklet 31/8/06 9:47 am Page 24
Data inputs
The input data on prevalence and counts for E. coli O157:H7 in beef trimmings was the simulated output from
module 1 as described above i.e 2.40 % (95th percentile range, 95% - 5.1%) and mean counts of -2.69 log10CFU
g-1). The probability of each trimming contributing to a batch of minced beef and the number of E. coli O157:H7
it contributes to the batch if contaminated was modelled.
The potential growth of E. coli O157:H7 during retail storage was modelled. Research has shown that E. coli
O157:H7 can grow at temperatures of 7.2°C or higher (Palumbo et al., 1995) so if temperature abuse of minced
beef occurs during storage, E. coli O157:H7 growth can potentially occur. Gompertz microbial growth equations
(Marks et al., 1998) were used to predict the amount of E. coli O157:H7 growth that would occur over a given time
at a given temperature in minced beef that suffered temperature abuse during retail sale. The model to describe the
potential growth for E. coli O157:H7 in beefburger was adapted from the model employed in the FSIS / USDA risk
assessment model (Ebel et al., 2004) but was adapted to represent the results of the survey conducted in Ireland
on typical storage times and temperatures at retail (range 7 to 16°C) (Carney, personal communication).
The effect of freezing on E. coli O157:H7 numbers was modelled using a distribution that represented a decline in
numbers of between 0 log10 CFU g-1 and 3 log10 CFU g-1 based on literature data (USDA-FSIS, 2004). Using relevant
distributions the model was used to estimate the prevalence and counts of E. coli O157:H7 in a 100 gram serving
of fresh minced beef which represented the upper end of consumption size and exposure.
Model outputs
The distribution for the prevalence of E. coli O157:H7 in raw fresh and frozen burgers is shown in Figure 13. The
mean simulated prevalence generated by the model in fresh burgers was 2.9%. In frozen beefburgers, the simulated
Boxes of trimmings
Mixing/mincing
Frozen vegetables
Dry ingredients Burger formation Burger formation
Water
Storage
Storage Freezing
Sale
Figure 12. Flow diagram from beefburger preparation through retail distribution
24You can also read