New Horizons for the Transitioning of our Food System: Connecting Ecosystems, Value Chains and Consumers - January 2017
←
→
Page content transcription
If your browser does not render page correctly, please read the page content below
New Horizons for the Transitioning of
                    our Food System:
           Connecting Ecosystems, Value Chains
                     and Consumers

                                     January 2017

©NewForesight and Commonland 2017 | All rights reserved   1
Introduction to this report
A transition towards sustainable food systems as part of healthy ecosystems will be an essential
prerequisite to meet the Sustainable Development Goals.
The authors and contributors to this report feel that despite the ground-breaking work that has been
done over the past decades, the transition of our food systems is not proceeding fast enough.
In this report we will argue that the food transition is not only a challenge, but offers significant
opportunities for businesses, farmers, society and the planet. These opportunities can be captured if
we change our core approach to sustainability from fragmented, reductionist efforts to combat
negative impacts to holistic programs to capture net positive business opportunities.
In this report we will sketch a first outline of these holistic approaches. The main aim of this report is
to trigger key decision makers in business, government and society to apply such holistic approaches
and drive systemic change in our food systems at scale. The authors, and their respective
organizations, are prepared to engage with decision makers and make the food transition a reality.
This report has been prepared by a joint team from NewForesight and Commonland with contributions
from The Boston Consulting Group. They have done this on their own initiative, without sponsorship
from any outside organization.
•   Wouter-Jan Schouten, Lucas Simons, Niko Wojtynia, Bart Vollaard, Matthijs Maas, Silvana
    Paniagua (NewForesight)
•   Michiel de Man, Jenneke Bijl-Segers, Willem Ferwerda (Commonland)
•   Anthony Pralle, Marty Smits (The Boston Consulting Group)
Many more have contributed. We are especially grateful to the following people for their valuable
insights, views and other input:
•   Willem Lageweg, Barry Parkin (Mars), Lucian Peppelenbos (IDH), Matthew Reddy (WBCSD),
    Roland Sieker (Unilever), Pier Vellinga (Waddenacademie), Jochem Verberne (WWF), Henk
    Westhoek (PBL), Bruce Wise (IFC).

                         ©NewForesight and Commonland 2017 | All rights reserved                             2
Disclaimer
While all due care is taken in the preparation of this report, neither the authors nor
 the organizations they work for shall be liable for any loss or incidental, indirect or
    consequential damages of any kind, arising out of, or in connection with the
 recipient’s use of the information contained within this paper. The contents of this
paper does not constitute financial or legal advice and the recipient should consider
 obtaining independent financial or legal advice before making any financial or legal
 decisions. Any information, statements or predictions provided in this report that
relate to, or are dependent on, the future state of local or global financial conditions,
 are based on current market expectations and are subject to inherent risks which
may lead to different actual results. Any harm or loss arising from the improper use
            of this information by any third party is expressly disclaimed.

                     ©NewForesight and Commonland 2017 | All rights reserved                3
Executive
                                                                                             summary
Contents

                                                                                             brutal facts
                                                                                              Why: the
Executive Summary

                                                                                             What: systemic
Why: facing the brutal facts about our food systems

                                                                                               changes
What: systemic changes for a sustainable food system

                                                                                             of opportunities
                                                                                             Why now: value
Why now: the potential value of opportunities

How: a call for holistic transformation approaches

                                                                                             How: holistic
                                                                                             approaches
Appendix: background analyses

                                                                                                A: Background
                               ©NewForesight and Commonland 2017 | All rights reserved   4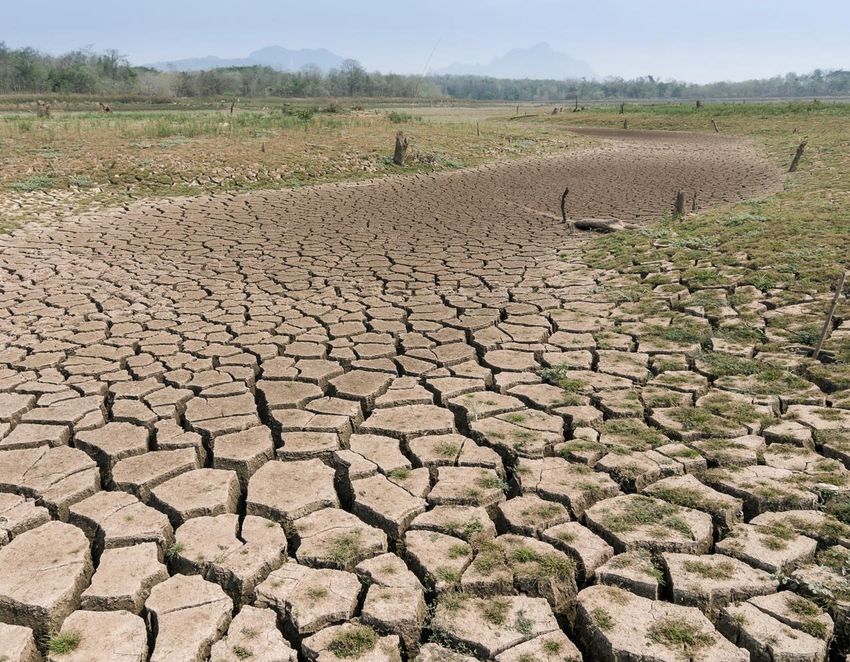
Executive
                                                                                                                                                                   summary
 Key messages of this report (I/III)

      Fixing our food system based on healthy ecosystems is a fundamental pre-requisite to

                                                                                                                                                                   brutal facts
                                                                                                                                                                    Why: the
      meeting the Sustainable Development Goals (SDGs);

      In doing so, four ‘brutal facts’ need to be addressed:
           I. Poverty: over 75% of all farmers globally are caught in a poverty trap;

                                                                                                                                                                   What: systemic
           II. Environmental degradation: today’s food system exceeds most planetary

                                                                                                                                                                     changes
                boundaries1, and contributes a quarter of greenhouse gases;
           III. Food waste: 30 to 40% of all produced food is wasted;
           IV. Malnourishment: half the world population is malnourished (hunger, nutrient
                deficiencies and/or overweight);

                                                                                                                                                                   of opportunities
                                                                                                                                                                   Why now: value
      We identify tremendous, as-yet untapped value from fixing our food systems, from the
      soils to plate, for all stakeholders as well as for our planet:
            – Professional farmers who are willing and able to change can capture a
                significant part of that value;
            – Companies across the food value chain should innovate, invest, and

                                                                                                                                                                   How: holistic
                                                                                                                                                                   approaches
                collaborate to capture part of that value and to enable farmers to capture
                their fair share;
            – Actors ranging from government, finance, knowledge institutes and NGOs all
                have crucial enabling roles to play;
            – Significant potential to mitigate climate change through carbon sequestration

                                                                                                                                                                      A: Background
                and GHG output reduction through improved agricultural methods
1. Most notably on land use change, freshwater, nutrients (nitrogen, phosphorus) , novel entities (pesticides, antibiotics, hormones), climate/GHG emissions and
biodiversity
                       ©NewForesight and Commonland 2017 | All rights reserved                                                                               5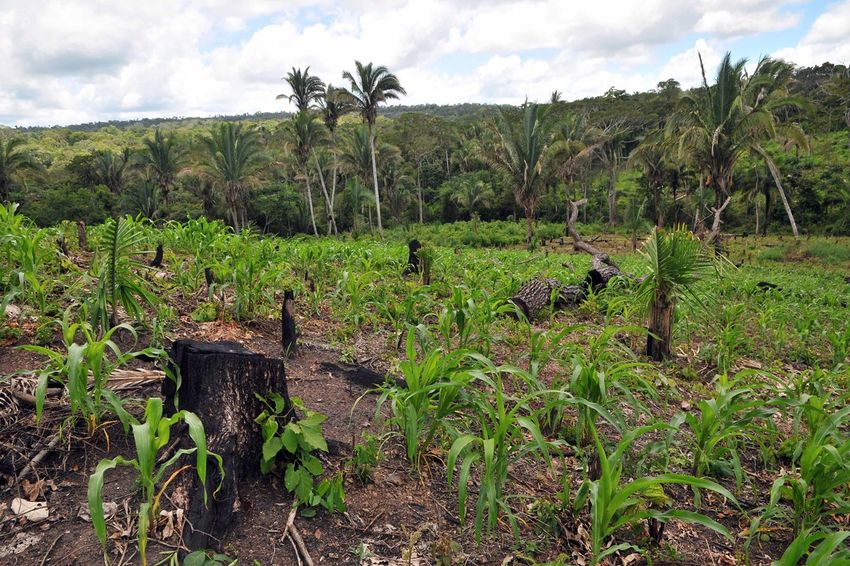
Executive
                                                                                                                                         summary
 Key messages of this report (II/III)

      To realize these benefits, a systemic change is required at three interrelated levels:

                                                                                                                                         brutal facts
                                                                                                                                          Why: the
            I.     Production Landscapes: Drive development of strong rural economies and
                   local communities on resilient landscapes, based on net positive1 and
                   restorative agroforestry and agriculture production models;
            II. Value chains: Create net positive business models that compete on
                   differentiated quality (e.g. taste, nutrition) in the agricultural steps of the

                                                                                                                                         What: systemic
                                                                                                                                           changes
                   value chain;
            III. Consumer end markets: Enable and incentivize consumers to make
                   healthy and sustainable choices.

      Achieving these systemic changes requires a shift in approach to drive sustainability:

                                                                                                                                         of opportunities
                                                                                                                                         Why now: value
            – From today’s reductionist efforts to fight negative impacts in a piecemeal
                 way…
            – ... Towards long-term holistic programs that connect actions at the three
                 levels

                                                                                                                                         How: holistic
                                                                                                                                         approaches
                                                                                                                                            A: Background
1.   Net Positive means that business puts back more into society and environment than it takes out (source: Forum for the Future)

                      ©NewForesight and Commonland 2017 | All rights reserved                                                        6
Executive
                                                                                            summary
Key messages of this report (III/III)

 In recent years, many positive initiatives—from both established and new

                                                                                            brutal facts
                                                                                             Why: the
 stakeholders—have got underway. To catalyze the transition and achieve impact at
 scale, there is a need to form coalitions of the committed to drive progress towards net
 positive food systems.

                                                                                            What: systemic
 These coalitions should focus on transforming related combinations of agri-landscapes,

                                                                                              changes
 value chains and consumer markets. Successful coalitions will:

       1.    Bring together a representative set of stakeholders for the agri-landscapes,
             value chains and consumer markets in scope;
       2.    Dare to invest in collaborative learning by ‘joining the dots’ across their

                                                                                            of opportunities
                                                                                            Why now: value
             chosen value chain;
       3.    Identify and pursue the opportunities for growth and value creation offered
             by this approach.

 Members of these coalitions will be rewarded with faster growth and value creation

                                                                                            How: holistic
                                                                                            approaches
 than stakeholders who do not (yet) feel the urgency nor recognize the far-reaching
 opportunities to be had from transforming the food system.

                                                                                               A: Background
            ©NewForesight and Commonland 2017 | All rights reserved                    7
Executive
                                                                                             summary
Contents

                                                                                             brutal facts
                                                                                              Why: the
Executive Summary

                                                                                             What: systemic
Why: facing the brutal facts about our food systems

                                                                                               changes
What: systemic changes for a sustainable food system

                                                                                             of opportunities
                                                                                             Why now: value
Why now: the potential value of opportunities

How: a call for holistic transformation approaches

                                                                                             How: holistic
                                                                                             approaches
Appendix: background analyses

                                                                                                A: Background
                               ©NewForesight and Commonland 2017 | All rights reserved   8
Executive
                                                                                                                          summary
  Nine (at least) of the SDGs can only be achieved if food systems
  become structurally sustainable
  Remaining eight SDGs are also indirectly related to food systems

                                                                                                                          brutal facts
                                                                                                                           Why: the
                                                                                                                          What: systemic
                                                                                                                            changes
                                                                                                                          of opportunities
                                                                                                                          Why now: value
                                                                                                                          How: holistic
                                                                                                                          approaches
                                                                                                                             A: Background
Source: Food Systems and Natural Resources (UNEP/IRP/PBL 2016)

                                                            ©NewForesight and Commonland 2017 | All rights reserved   9
Executive
                                                                                          summary
Four brutal facts need to be addressed

                                                                                          brutal facts
                                                                                           Why: the
                                          50% of the
                                        growing world
                                         population is
                                        malnourished

                                                                                          What: systemic
                                                                                            changes
                                                                  Production
                 >75% of
                                                                  volumes with
               agricultural

                                                                                          of opportunities
                                                                                          Why now: value
                                                                  today's produc-
               workers are
                                                                  tion methods far
                extremely
                                                                  exceed planetary
                  poor
                                                                  boundaries

                                                                                          How: holistic
                                                                                          approaches
                                          30-40% of
                                         all food that
                                         is produced
                                           is wasted

                                                                                             A: Background
                       ©NewForesight and Commonland 2017 | All rights reserved       10
Executive
summary
Malnutrition affects more than half of today’s population
brutal facts
Why: the
What: systemic
In total around 4 billion people — more than half the …and world population is expected to grow
changes
population — are malnourished: to 10 billion by 2050:
• Nearly 800 M people are hungry, over 2 billion people • This requires an estimated 70% increase in
suffer from micronutrient deficiencies available nutrition for consumption
of opportunities
Why now: value
3.1 M children under 5 die and 161 M left stunted • The growth in demand for animal protein is
every year projected to be higher than demographic
• 1.4 billion people worldwide struggle with overweight and growth
obesity
Changing lifestyles and cheap calories mean many
How: holistic
approaches
people find it hard to balance their diets and
lifestyles
• Unhealthy diets cause a host of fatal diseases, including
heart- and kidney failure, diabetes, and cancers, particularly
of the digestive tract
A: Background
Source: ‘Food Systems and Natural Resources’(UNEP/IRP, 2016), Global
Alliance for Improved Nutrition (GAIN), FAO, WHO, Unicef, ‘Towards a
Common Agricultural and Food Policy’ (Poppe and Fresco, 2016),
‘Disease-related Malnutrition: An Evidence-based Approach to
Treatment’ (Stratton, Green and Elia, 2003) ©NewForesight and Commonland 2017 | All rights reserved 11Executive
summary
>75% of agricultural workers are extremely poor
Global distribution of agricultural labor, by level of value added
brutal facts
Why: the
Very hard to escape
Poverty trap poverty and become
aid independent
Global
What: systemic
agriculture Global average agriculture
workforce
changes
worker in 2014:
2014 • 4,3 hectare per worker
(% of total) • US$ 453 value added per
ha per annum
• US$ 1965 value added per
worker per annum
of opportunities
Why now: value
How: holistic
approaches
Annual value added per agriculture worker 2014 (US$ x 1.000)
- World Bank poverty line ($2 p.d.) translates to app. $2,500 p.a. per family
- Note that minimum income often is less than living income, and value added does not cover
financing costs; arguably $5,000 value added p.a. is minimum to escape poverty
A: Background
Source: NewForesight analysis of World development indicators (World Bank)
©NewForesight and Commonland 2017 | All rights reserved 12Executive
summary
Overwhelming evidence that global food systems exceed
planetary boundaries, with risk of acceleration
Direct agriculture impacts Impacts on planet
brutal facts
Why: the
Soil depletion, pollution and degradation: 0,7% Deforestation and Land use change: 130 M ha of
of arable land lost p.a. (half of all fertile soils lost forest lost since 1990; current momentum:
in the last 35 years), 52% of agricultural land another 69 M by 2030, with clearing for
affected moderately or severely agriculture considered biggest driver
What: systemic
Water scarcity: 55% of the world’s river basins
Freshwater overexploitation and pollution:
changes
and 70% of the world population experience
70% of freshwater used for agriculture
water scarcity
Nutrient1 + Novel entities2 overload: 200-300% Ocean acidification: surface ocean acidity levels
increase in nitrogen and phosphorus loads at 130% compared to year 1750 as a result of
since 1980; only 15-20% of fertilizer inputs get GHG emissions, causing damage to coral reefs
of opportunities
Why now: value
embedded in food and their ecosystems
Timber, Fish & Wildlife over exploitation: 29%
Biodiversity loss: 52% average weighted decrease
of wild fisheries are over-exploited, 61% are
in individual species populations, 60% of
fully exploited; overfishing in past 200 years
terrestrial biodiversity loss related to agriculture
has driven 73 species to extinction
How: holistic
approaches
GHG emissions: Agriculture and food supply
Climate change: 10 warmest years in human
chain account for 17% of global GHG
history have occurred since 2000; 0.87C
emissions; a further 7-10% from deforestation
increase c.f. 1880
and land use change
1) Primarily Nitrogen and Phosphorous through synthetic fertilizers
2) Pesticides, Antibiotics, Hormones
A: Background
Sources: Stockholm Resilience Center; UNEP/IRP/PBL 2016: ‘Food Systems and Natural Resources’; WWF/Metabolic 2016: ‘Global Food System, an analysis’; WWF 2014: ‘Living Planet Report 2014’; D
e Vos, J. M.et al. (2015), Estimating the normal background rate of species extinction. Conservation Biology, 29: 452–462. Hoekstra and Mekonnen 2011: Global water scarcity: The monthly blue
water footprint compared to blue water availability for the world’s major river basins. NewForesight Analysis
©NewForesight and Commonland 2017 | All rights reserved 13Executive
summary
Despite deforestation the global amount of arable land is flat
brutal facts
Why: the
Arable land
conversion 130 -49
(M hectares) 9,3% -3,5%
-83
What: systemic
-5,9%
changes
1.409 1.407
of opportunities
Why now: value
How: holistic
approaches
A: Background
Source: NewForesight analysis of World development indicators (World Bank)
©NewForesight and Commonland 2017 | All rights reserved 14Executive
summary
30-40% (1.3B MT) of produced food is wasted every year
brutal facts
Why: the
In developed
countries, mostly
by consumers and Wasted food uses 28% of agricultural land
What: systemic
in foodservice
changes
of opportunities
Why now: value
In developing countries, due to
poor technologies (harvesting,
transport and storage), long
How: holistic
approaches
distances to processing
facilities and poor
management
A: Background
Source: “Global food losses and food waste: Extent, causes and prevention”. FAO, 2011; “Review of EU legislation and policies with
implications on food waste”. Vittuari etal. 2015, ‘Towards a Common Agricultural and Food Policy’ (Poppe and Fresco, 2016). FAO,
2013: “Food Wastage Footprint: Impacts on Natural Resources”
©NewForesight and Commonland 2017 | All rights reserved 15Executive
summary
Contents
brutal facts
Why: the
Executive Summary
What: systemic
Why: facing the brutal facts about our food systems
changes
What: systemic changes for a sustainable food system
of opportunities
Why now: value
Why now: the potential value of opportunities
How: a call for holistic transformation approaches
How: holistic
approaches
Appendix: background analyses
A: Background
©NewForesight and Commonland 2017 | All rights reserved 16Executive
summary
Six root causes need to be addressed to achieve systemic change
Consumer end markets 6 Distorting tax systems, subsidies and other regulations
brutal facts
Why: the
hamper systemic change
5 Consumers disconnected from food production lack the
knowledge and price- or quality incentives to make healthy and
sustainable choices
What: systemic
changes
Agri Value chains 4
Food supply chain actors compete primarily on standardization
and lowest price of agricultural commodities and hardly ever on
differentiated quality (taste, nutritional value, ecosystem
of opportunities
Why now: value
services1) in primary production
Agriculture Production 1 2 3
Landscapes 5% of farmers 1% of farmers
94% of farmers
How: holistic
approaches
incentivized to incentivized for
subscale and
treat 42% of land over -
caught in poverty
as abundant intensification via
trap
resource externalized costs
A: Background
1. Generally, ‘ecosystem services’ are “the benefits people obtain from ecosystems” (Millennium Ecosystem Assessment, 2006). Within this, one can identify ‘habitat services’ and ‘ecosystem functions’, as “a
subset of the interactions between ecosystem structure and processes that underpin the capacity of an ecosystem to provide goods and services” (TEEB 2010:19), such as sustained production capacity,
carbon sequestration, freshwater and biodiversity.
©NewForesight and Commonland 2017 | All rights reserved 17Executive
summary
Three agricultural landuse archetypes
Farmsize:
Land abundant areas:
brutal facts
Hectares per
Why: the
farmworker
(avg. 2010-15) • 5% of global agri workers,
• using 42% of agricultural land,
• living near 58% of forested area
• need to feed 20% of world population,
What: systemic
• generate 30% of agriculture value added
changes
Poverty Trap
Intensive Agriculture:
• 1% of global agri workers,
Poverty Traps: • 2% of agriculture land,
• 94% of global agri workers (> 1 B today • Intensive
need to feed 6% of world
of opportunities
Why now: value
growing to 1,5 B by 2050), population,
agriculture
• 56% of agriculture land and 78% of freshwater • generate 15% of agriculture
for agriculture, value added
• need to feed 74% of world population,
• generate 55% of agriculture value added
• highest prevalence of child labor
How: holistic
approaches
• significant gender inequality Poverty Trap
• significantly compounded by fragmentation of land
through inheritance, as well as insecure land tenure rights
Note: all numbers are country averages Land Productivity:
A: Background
Value added per Hectare per annum (US$ avg 2010-15)
that may mask huge in-country variability
Source: NewForesight analysis of World development indicators (World Bank)
©NewForesight and Commonland 2017 | All rights reserved 18Executive
summary
The three archetypes are distributed around the globe
reflecting economic development
brutal facts
Why: the
What: systemic
Most of the
changes
European and Asian
OECD region can be
characterized as
intensive, with the
exception of the
of opportunities
Why now: value
UK, Portugal, North
America and
Australia (all land
abundant)
Land abundance
characterizes
How: holistic
approaches
North and South Poverty traps landscapes are
Legend America as well as most prevalent in Africa,
Poverty traps most of the former South- and South-East Asia
Soviet Union, and the Pacific, as well as
Land abundant areas South Africa and less developed Latin
Intensive agriculture Australia. American and Eastern
A: Background
Land abundant with pockets of intensive agriculture European countries.
Not enough data
©NewForesight and Commonland 2017 | All rights reserved 19Executive
summary
Challenges differ substantially between archetypes
Poverty traps Land abundant Intensive agriculture
brutal facts
Why: the
Total FTE agriculture workers in 1980 (x M)
Total FTE agriculture workers in 2014 (x M)
What: systemic
Hectares agriculture land per FTE agriculture worker in 1980
changes
Hectares agriculture land per FTE agriculture worker in 2014
Agriculture value added per hectare agriculture land 1980
of opportunities
Why now: value
Agriculture value added per hectare agriculture land 2014
Land degradation 1990-2015 (% arable land)
Increase/decrease forest area 1990-2015 (% arable land)
How: holistic
approaches
Water use by agriculture (% of renewable freshwater
availability, 2013)
Nutrient overload: N2O emissions, as proxy indicator (kg CO2
eq. per hectare agriculture land 2013)
Legend land degradation Agriculture land lost Net conversion arable land to pasture Critical challenge
A: Background
Source: NewForesight analysis of World development indicators (World Bank)
©NewForesight and Commonland 2017 | All rights reserved 20Executive
summary
Change opportunities differ by land usage archetypes
brutal facts
Why: the
Poverty trap areas Land abundant areas Intensive agriculture
What: systemic
Growing population caught in Under-utilization of agriculture High externalized costs (e.g. too
Today’s
changes
poverty trap, and poor farming land, often combined with high much inputs, nutrient overload,
challenges
practices; often leading to de- deforestation and soil low biodiversity) from maximized
forestation, soil degradation and degradation yields
water depletion
of opportunities
Why now: value
Required • Ecologic intensification and • Ecologic intensification • Ecologic optimization and value
game degraded land restauration (intercropping, precision growth (differentiate on taste
needed to stop deforestation, agriculture) needed to stop and nutritional value) needs to
change
including protected areas deforestation and soil win against continued yield
How: holistic
approaches
• 600 M farmers need to grow and degradation maximization with high
professionalize • Rewilding of land that is not externalized costs
• 850 M alternative livelihoods to needed for agriculture
replace subsistence farming, and
accommodate population growth
A: Background
©NewForesight and Commonland 2017 | All rights reserved 21Executive
summary
…and for different players across the value chain
brutal facts
Why: the
Traders & Primary Consumer products
Input suppliers Retailers
processers producers
What: systemic
Today’s • Standardization • Standardization • Standardization of • Low price perception
changes
dominant • High volumes • Efficiency and lowest input • High volumes
business • Patented innovation1 prices • Low sourcing costs
logic
of opportunities
Why now: value
Sustainable • Support farmers in • Support farmer • Market differentiated • De-commoditize:
business optimizing soil and communities in taste and nutritional Promote differen-
opportunities ecosystem health and optimizing rural value of sustainably tiated taste and
long term value economies and produced food at true nutritional value of
• Low volumes, ecosystems price healthy and
How: holistic
precision inputs • Differentiate on sustainable diets at
approaches
• Diversity of inputs, access to local true price
tailored to local needs varieties • Maximize local
sourcing
Economic Responsible consumer products account for two thirds of grocery market growth at an average price
potential premium of 20-25%; retailers benefit from 30-40% price premiums vs. conventional own label products, and
A: Background
consumer goods companies benefit from a 10-20% price premium2
1. Such as seed stocks
2. Smits, Marty et al. 2014 “When Social Responsibility Leads To ©NewForesight and Commonland 2017 | All rights reserved 22
Growth” The Boston Consulting GroupExecutive
summary
Externalization of social and environmental costs distorts
consumer price and hampers sustainable choices
True Price on average ~25% above actual price
brutal facts
Why: the
Value added +134
(farm gate externalized costs1
=100)
externalities
equal ~25% of
What: systemic
+171 571
consumer price
changes
+200
of opportunities
Why now: value
75
+25
+70
30
How: holistic
approaches
Europeans spend 10-15% of income on
Value added Externalized costs
food today vs. 40-50% in the 1950s
A: Background
Source: Trucost, Annual reports of processors, traders, FMCG producers and retailers, NewForesight experience and analysis
1)Based on calculations of Trucost in 2012: Externalized costs add up to 224% of EBITDA of food companies. 75% of these externalities assumed to be in the agriculture landscape, remaining
25% assumed to be evenly split over the subsequent steps in the value chain, ‘Towards a Common Agricultural and Food Policy’ (Poppe and Fresco, 2016)
©NewForesight and Commonland 2017 | All rights reserved 23Executive
summary
Systemic change opportunities in consumer behavior
Today’s consumers not in a position to Required changes in consumer behavior
brutal facts
Why: the
demand sustainable food production
In developed markets:
• Consume less empty calories, less meat
• Lack awareness of the issues constraining
• Consume more locally produced food
our food systems
• Rise in urban farming & ‘citizen science’
• Unsustainable choices are cheaper • Demand sustainable production and pay
What: systemic
because externalities are not priced in;
changes
true prices (~25% higher than today)
• Limited experience of quality differences • Reduce food waste
of locally produced food • Facilitated by a changed food environment
(clearer information and regulation)
• Unsustainably produced empty calories
of opportunities
Why now: value
often more attractive than sustainably In developing markets:
produced, nutrient rich food • Less empty calories
• Question and mistrust credibility of • Moderate growth of animal proteins
multiple ‘sustainability’ certifications • Stick to locally produced food as much as
(often rightfully so) possible
• Urbanization (80% of world population by • Facilitated by investment in local supply
How: holistic
approaches
2050) drives intensified consumer chains to ensure sustainable, affordable
demands and value chain concentration locally produced diets
A: Background
Source: Poppe and Fresco, 2016: 18; De Wilde, 2015: 91; NewForesight analysis
©NewForesight and Commonland 2017 | All rights reserved 24Executive
summary
Systemic change opportunities in tax systems,
subsidies and other regulations
Distortive tax systems, subsidies and Required changes in government policies
brutal facts
regulations hamper systemic change and regulations
Why: the
National food policies that holistically address local and
• Externalities1 not taxed global system failures
• Many subsidies reward unsustainable
Outlaw practices that fail to meet minimum standards
What: systemic
practices and distort competition in global
changes
commodity markets Price in externalities (on average 25% of consumer
price) of conventional unsustainable business models,
• Too easy to obtain permits for by introducing/increasing taxes on:
unsustainable practices or even illegal • GHG emissions, chemical inputs, soil and
business practices freshwater depletion, irresponsible sourcing from
of opportunities
Why now: value
poverty areas
• Too difficult to introduce innovative • Consumption of unsustainably produced food
business models that improve sustainability
End distortive volume based subsidies for inputs and
• Competition laws sometimes prevent
for agri production
collaboration needed to end unsustainable
practices Use the generated funds to:
• Co-invest with private sector in landscape
How: holistic
approaches
restoration and sustainable community
development,
• Pay for ecosystem services that cannot be sold to
private sector,
• Co-invest with private sector in pre-competitive
R&D2 towards net-positive business models,
• and/or lower taxes on labor
A: Background
1) Externalities are harmful consequences of economic activity that are not reflected in price
2) Pre-competitive R&D refers to industry collaboration for innovation by companies that are otherwise competitors
Source: Poppe and Fresco, 2016: 31, 42-49; NewForesight analysis ©NewForesight and Commonland 2017 | All rights reserved 25Executive
summary
Contents
brutal facts
Why: the
Executive Summary
What: systemic
Why: facing the brutal facts about our food systems
changes
What: systemic changes for a sustainable food system
of opportunities
Why now: value
Why now: the potential value of opportunities
How: a call for holistic transformation approaches
How: holistic
approaches
Appendix: background analyses
A: Background
©NewForesight and Commonland 2017 | All rights reserved 26Executive
summary
Continuous improvement at sufficient speed can create
sustainable food systems and fulfill the SDGs
brutal facts
• Enough healthy and nutritious food accessible for everyone
Why: the
• Reduction of farmers in poverty (value added < US$ 2,500) from >1B today toExecutive
summary
This scale of change is possible
example: Löss Plateau, China
1995 2009
brutal facts
Why: the
What: systemic
changes
of opportunities
Why now: value
• China’s Löss Plateau – an area the size of France – was once • World Bank-funded erosion control and livelihood
one of the country’s most fertile regions diversification program has restored area the size of Belgium
• Overgrazing and –tilling of the soil had caused extremely high • Population is now better off:
erosion –Higher employment (from 70% to 87%)
• Land became unproductive, farmers became impoverished –Improved food security (grain output increased
(incomesExecutive
summary
This scale of change is possible
example: Dominican Republic
Dominican Republic – developing organic sector
brutal facts
Why: the
• Offered alternative livelihoods: from 60% of population working in agriculture in 1960 to 15%
in 2014.
• In the meantime, government and businesses began to encourage diversification,
professionalization, inputs and loans to enable a more efficient and profitable sector.
• An organic sector, specializing in bananas, mangos, coffee, coconut and cocoa emerged due
What: systemic
to institutions aimed at capacity building were established between 1980 and 1995 with
changes
14,000 farmers – one of the largest in Latin America.
• The sector was driven by demand from EU and US, strong farmer organizations and
governmental policies to promote foreign investment (FAO).
1995: Rapid expansion
of opportunities
Why now: value
1982: First through civil society
organic plot training and corporate Value added per agricultural
demonstration investment worker more than tripled
1989: First between 1980 and 2014;
commercial export
of organic produce from $2,915 to $9,504
How: holistic
approaches
1980s: Institutions 2000: Ministry of Agricultural Today: Dominican Republic is
established to promote Extension and Training begins largest exporter of organic
organic agriculture significant organic projects bananas (60% of global trade)
A: Background
Source: FAO (http://www.fao.org/docrep/004/Y1669E/y1669e0k.htm)
http://cfat.colostate.edu/wp-content/uploads/2010/06/Raynolds-2008.pdf
©NewForesight and Commonland 2017 | All rights reserved 29Executive
summary
Modest yield increases in underutilized areas combined with
waste reduction can deliver sufficient food for 10 B by 2050
example: Required growth in global Cereal production
brutal facts
Why: the
Cereal
production
kg per Ha Belgium
per Annum
Netherlands
What: systemic
New Zealand
changes
United States
China
0.6%
of opportunities
Why now: value
Brazil
1%
1.3% India
Ethiopia
How: holistic
approaches
Cumulative global area for cereal production (x M ha)
Required yield 2050 to feed 10 B people
A: Background
Yield 2015 ..% Required yield increase p.a.
if 25% reduction of global food waste
Source: NewForesight analysis of World development indicators (World Bank)
©NewForesight and Commonland 2017 | All rights reserved 30Executive
summary
Potential value of Food Transition is huge – some examples
Consumer end • Pricing externalities (c.f. p. 25) into food represents not only cost but also
markets value creation, with potential of $800B added to the world economy1
brutal facts
Why: the
• Better protection and preservation of ecosystem services resulting from
pricing in of externalities can increase the value provided by ecosystems,
estimated to be up to $145 trillion per year
• Welfare states benefit from reductions in healthcare costs of up to 6%
What: systemic
changes
Agri Value chains
• Responsible consumer products account for two thirds of market growth in
groceries at an average price premium of 20-25%
• Retailers benefit from 30-40% price increases over own-brand conventional
of opportunities
Why now: value
products, and consumer goods companies benefit from a 10-20% price
premium2
Agriculture Production • Restoration can increase the economic value of ecosystems by up to 80%3
Landscapes • Higher employment in secondary and tertiary sectors can boost GDP
How: holistic
approaches
• More professional farming can multiply farmer profit, particularly in poverty
trap landscapes4
• i.e. 140M rice producers would gain $750M from smart, water-
conserving agricultural practices3
A: Background
Source: (1) NewForesight analysis of World Bank Data; (2) Smits, Marty et al. 2014 “When Social Responsibility Leads To Growth” The Boston
Consulting Group; (3) Muller, Alexander 2015 “TEEB for Agriculture & Food Interim Report”, The Economics of Ecosystems & Biodiversity; (4) –
NewForesight analysis of smallholder commodity sectors
©NewForesight and Commonland 2017 | All rights reserved 31Executive
summary
Strong business case for being a sustainability front runner
brutal facts
Why: the
Recent studies1 demonstrate that companies who measure sustainability
performance and formulate concrete sustainability goals outperform on the
stock market and experience lower stock price volatility.
What: systemic
changes
In the energy sector companies slow in adopting sustainable practices
experience weaker shareholder returns than peers. A similar pattern may apply
in food in the future.
of opportunities
Why now: value
Companies that formulate sustainability goals and make a switch to a holistic,
sustainable business model soon can capitalize on the untapped value in fixing
our food system that we describe earlier.
How: holistic
approaches
It is therefore of paramount importance not just for our common
future but also for long-term business viability that companies in the
food sector adopt sustainability in their business strategies.
A: Background
1. E.g. Eccles et. Al 2012; red.
©NewForesight and Commonland 2017 | All rights reserved 32Executive
summary
Contents
brutal facts
Why: the
Executive Summary
What: systemic
Why: facing the brutal facts about our food systems
changes
What: systemic changes for a sustainable food system
of opportunities
Why now: value
Why now: the potential value of opportunities
How: a call for holistic transformation approaches
How: holistic
approaches
Appendix: background analyses
A: Background
©NewForesight and Commonland 2017 | All rights reserved 33Executive
summary
We need to accelerate beyond today’s mostly reductionist
approaches
brutal facts
Why: the
Despite significant investments, Many transformation All today’s efforts
most transition efforts today are approaches are not combined are not
What: systemic
changes
still in ‘fire fighting’ mode holistic enough enough to turn the tide
• Fragmentation: many small, competing • Optimizing only one or few in time
initiatives and isolated projects dimensions at the cost of • At current speed it will
• Progress is measured versus last year others take 50 to 100 years to
and relative to competitors • Focusing on Supply Chain, reach sustainable aid-
of opportunities
Why now: value
• Sustainability claims are based on Landscape or Consumers independent livelihoods
marginal improvements rather than all three for average farmer
• Risk of losing credibility and being • Steering on inputs and • By then planetary
accused of greenwashing processes rather than boundaries will long be
outcomes exceeded irreversibly
How: holistic
approaches
Meeting these challenges requires:
• A holistic science based vision of production with net positive impact on people and planet
A: Background
• A clear and economically viable approach to make net positive business models win
• A clear timeline to achieve net positive impact within 1-2 generations
©NewForesight and Commonland 2017 | All rights reserved 34Executive
summary
Executive
summary
Need to move from piecemeal ‘fighting of negative impacts’ to
holistic, business driven approaches, aspiring net positive impact
The brutal
facts
brutal facts
Today’s dominant logic Required for systemic change
Why: the
Ambition Less Negative impacts Net Positive impact
Changeschanges for change
Systemic
What: systemic
Supply chains,
Opportunities
Scope Full systems:
company by company,
Landscape, value chains, consumers
commodity by commodity
of opportunities
Why now: value
Breadth
of Dogmatic:
approach approaches
Diversity of pathways
Holistic How: holistic
‘one size fits all’
solutions
Implement (Certification) tools
Tools Drive to outcomes,
and process changes
Call to
action
use supporting tools as needed
as objective in itself
A:A:Background
Background
©NewForesight and Commonland 2017 | All rights reserved 35Executive
summary
Executive
summary
Need holistic transition agenda at three levels
To be refined and detailed for each major landscape, supply chain and ambition
consumer market
The brutal
Promote healthy and sustainable diets @ true price; moderate on animal protein; increase link
facts
Consumer end markets
brutal facts
Why: the
between local diets and local agriculture production
Halve downstream food waste at retail and consumer1
Changeschanges for change
Systemic
Market sustainable food production; generate willingness to pay true price
What: systemic
Agro Value chains
Clean and energy-efficient processing technologies; optimize biomass to food conversion rate
Opportunities
Ensure reliable supply chains for every farmer and eliminate upstream food waste
of opportunities
Why now: value
Poverty trap areas: Land abundant areas: Over intensified areas:
• Professionalize farming • Ecological intensification • Grow value, not volume
• Access to finance • better balanced inputs, more • End nutrient + novel
approach approaches
Holistic How: holistic
Agriculture Production • Less farmers; create diverse cropping patterns entities overload
Landscapes alternative livelihoods • Rewilding
Develop and scale-up net positive2 farmer business models that provide sustainable livelihoods
Call to
action
Adapt regulations, subsidies and taxations to end externalities and
enable growth of net positive business models
Land and water use planning towards climate resilient and biodiverse agro-productive
A:A:Background
landscapes, protected areas and ecological corridors
Background
1. As included in SDGs
2. Regenerative land use for agriculture, full circularity of Nutrients, Carbon and Energy, Farmers earn living wages + surplus to re-invest in their farm, thriving rural communities with many more
sectors than primary food production
©NewForesight and Commonland 2017 | All rights reserved 36Executive
summary
Executive
summary
Different actors need to take the lead on specific elements
of the suggested transition agenda – suggested roles ambition
Consumer end markets Promote healthy and sustainable diets @ true price; moderate on animal protein; increase link
The brutal
between local diets and local agriculture production
facts
brutal facts
Why: the
Half downstream food waste at retail and consumer
Market sustainable food production; generate willingness to pay true price
Changeschanges for change
Systemic
Agro Value chains
What: systemic
Clean and energy-efficient processing technologies; optimize biomass to food conversion rate
Opportunities
Ensure reliable supply chains for every farmer and eliminate upstream food waste
Poverty trap areas: Land abundant areas: Over intensified areas:
of opportunities
Why now: value
• Professionalize farming • Ecological intensification • Grow value, not volume
• Access to finance • Better balanced inputs, more • End nutrient + novel
Agriculture Landscapes • Less farmers; create diverse cropping patterns entities overload
approach approaches
Holistic How: holistic
alternative livelihoods • Rewilding
Develop and scale-up net positive farmer business models that provide sustainable livelihoods
Adapt regulations, subsidies and taxations to end externalities and
enable sustainable business models
Call to
action
Land and water use planning towards climate resilient and biodiverse agro-productive
landscapes, protected areas and ecological corridors
Producers and processors led
for branded products; retailer
A:A:Background
Retailers led; co-creation with
led for private label or Government led ; co-creation with business Government led
governments
Background
unbranded products; co-
creation with governments
©NewForesight and Commonland 2017 | All rights reserved 37Executive
summary
Executive
summary
Need to design credible pathways to resilient landscapes
with restorative agriculture methods Scope
example: 4 Returns®, 3 Zones, 20 Years model developed by Commonland
The brutal
facts
brutal facts
Why: the
Changeschanges for change
Systemic
What: systemic
Return of Return of Return of Return of
Inspiration Social Capital Natural Capital Financial Capital
Opportunities
Giving people hope and a sense Bringing back jobs, business Restoring biodiversity, soil and Realizing long-term sustainable
of purpose. activity, education and water quality. profit.
security.
of opportunities
Why now: value
NATURAL ZONE COMBINED ZONE ECONOMIC ZONE
Designed for restoring the ecological Designed for restoring the topsoil and Designed for delivering high and
approach approaches
foundation and biodiversity delivering sustainable economic
Holistic How: holistic
sustainable economic productivity
productivity
Call to
A:A:Background
Background action
Source: Commonland, 2016
©NewForesight and Commonland 2017 | All rights reserved 38Executive
summary
Executive
summary
Need to identify, develop and scale up the most
sustainable business models across the value chain Scope
The brutal
facts
brutal facts
For each step of the value chain, we need to...
Why: the
• Identify those business models that are sustainable financially and contribute to a net positive vision, but
which currently remain “islands of success”;
• Develop these successes to allow them to be replicated; relying on sound business thinking and striving for a
Changeschanges for change
Systemic
positive business case for everyone involved;
What: systemic
• Scale proven business models by convening key stakeholders and through a common language for
implementing and measuring sustainable practices (see next page)
Opportunities
of opportunities
Why now: value
approach approaches
Holistic How: holistic
Examples of initiatives that are heading in the right direction:
Call to
action
IDH SDM: testing effectiveness Organic Cotton Accelerator: Green Protein Alliance: retailer
and improving efficiency of piloting sourcing interventions and consumer goods companies
delivery of sustainability- and to improve business case for collaborating for a balanced mix
A:A:Background
productivity services textiles value chain of vegetable- and animal proteins
Background
©NewForesight and Commonland 2017 | All rights reserved 39Executive
summary
Executive
summary
Need diversity of solution pathways
Solutions
example: pathways for dairy farming in northern Europe
The brutal
facts
brutal facts
Why: the
Changeschanges for change
Systemic
What: systemic
Opportunities
of opportunities
Why now: value
EXTENSIVE GRAZING
approach approaches
Holistic How: holistic
Call to
action
OPTIMISED GRAZING INTENSIVE HIGH-TECH
A:A:Background
Background
Source: Discussion report by Circle Economy, commissioned by FrieslandCampina, World Dairy Summit October 2016
©NewForesight and Commonland 2017 | All rights reserved 40Executive
summary
Executive
summary
Many existing sustainability tools can be instrumental to
drive outcomes but should not be seen as dogmatic goals in itself Tools
The brutal
facts
brutal facts
Why: the
Changeschanges for change
Systemic
What: systemic
Opportunities
of opportunities
Why now: value
Measurement and
analysis tools:
- Life Cycle Analysis
(LCA)
- Environmental Profit
and Loss (EP&L)
How: holistic
approaches
Call to
action
These tools can be used to drive compliance with minimum acceptable
performance level and can create a common language for continuous
improvement beyond minimum levels
A:A:Background
Background
©NewForesight and Commonland 2017 | All rights reserved 41Executive
summary
In recent years, many strong initiatives have taken shape, that fit in a
holistic transition agenda
examples that may lead to change at scale
brutal facts
Why: the
Consumer end markets
What: systemic
changes
Agro Value chains
Green innovation centres for the
agriculture and food sector African Alliance for Improved
of opportunities
Why now: value
Food Processing (AAIFP)
CocoaAction
Agriculture Production
Landscapes
How: holistic
approaches
A: Background
©NewForesight and Commonland 2017 | All rights reserved 42Executive
summary
How to accelerate the transition: call to action to governments,
businesses, science and NGOs
• Find or build coalitions of the committed
brutal facts
Why: the
– Leading governments, representing each of the three archetype areas
– Leading businesses representing most of the global supply chains
– Few farmers, companies and other initiatives that represent current state of the art of
sustainable food production
What: systemic
– Funding organizations
changes
– Science, FAO, World Bank , Endorsing NGOs
• With these coalitions of the committed: Select a specific supply chains, and for each supply
chain a few production landscapes + a few end markets to tackle with an holistic approach.
of opportunities
Why now: value
• Together with local stakeholders and front running initiatives: Tailor the described holistic
agenda for the selected supply chains, landscapes and consumer end markets, and define
roles and accountabilities for each element of the agenda
How: holistic
approaches
• Execute the agenda for chosen supply chains, landscapes and end markets; expand coalition
of stakeholders
• Develop proofs of concept; learn and scale up
A: Background
©NewForesight and Commonland 2017 | All rights reserved 43Executive
summary
Executive
summary
First options to form coalitions with holistic transition agendas
Some suggestions; further development and screening of opportunities clearly needed
The brutal
Coalition scope Potential agendas – based on first exploratory analysis
facts
brutal facts
Why: the
• Establish restorative agriculture production in Dutch Delta landscape
• Establish Net positive local value chains (especially dairy, meat, horticulture)
The Netherlands
• Promote sustainable and healthy consumer diets
• Develop repeatable transition models for export to other areas globally
Changeschanges for change
Systemic
What: systemic
• Establish restorative, multi cropping, production models for Spanish olive tree landscapes
Olive landscapes
Spain • Establish competitive business models for value chains of olives and all other crops that fit
Opportunities
a restorative vision for these landscapes
• Expand Cocoa Action approach beyond Cocoa for the relevant landscapes (Ghana, Cote
of opportunities
Why now: value
d’Ivoir + tbd).
Cocoa • Develop credible transition paths to end poverty traps, build vibrant rural economies and
establish restorative agriculture production methods in these landscapes
approach approaches
Holistic How: holistic
• Establish competitive business models for all relevant value chains from these landscapes
• Define requirements for net positive in all archetype dairy production landscapes, including
US, Europe, India, East Africa, New Zealand, South East Asia
• Develop credible transition paths for different dairy farming models (e.g. extensive grazing,
Dairy
Call to
action
optimized grazing, mixed farming, intensive high tech, ….)
• Adapt cooperative supply chain models to enable transition towards net positive
• Adapt Dairy Sustainability Framework (DSF) as tool to support the required transition
A:A:Background
Background
©NewForesight and Commonland 2017 | All rights reserved 44Executive
summary
Contents
brutal facts
Why: the
Executive Summary
What: systemic
Why: facing the brutal facts about our food systems
changes
What: systemic changes for a sustainable food system
of opportunities
Why now: value
Why now: the potential value of opportunities
How: a call for holistic transformation approaches
How: holistic
approaches
Appendix: background analyses
A: Background
©NewForesight and Commonland 2017 | All rights reserved 45Executive
summary
Executive
summary
Progress towards sustainability is slow
example: Certification commitments of consumer goods forum members to
commodities prioritized by WWF
The brutal
CGF members’ sustainability1 commitments as % of total volumes purchased per commodity
facts
brutal facts
Why: the
60%
Changeschanges for change
Systemic
50%
What: systemic
40%
Opportunities
No mentioning of sustainability
30% Some sustainability interventions
of opportunities
Why now: value
Member of recognized standard
Committed 2020
20%
approach approaches
Holistic How: holistic
Committed now
10%
Call to
action
0%
Palm oil Soy Beef P&P Seafood Cotton Sugar
cane
A:A:Background
Source: Slow Road to Sustainability (WWF, June 2016)
1. Sustainability commitment measured as commitment to buy WWF recognized certified commodities: RSPO for Palm Oil, RTRS or ProTerra for Soy, GRSB for Beef, FSC and recycled for Pulp&Paper,
Background
MSC/ASC for Seafood, BCI, Cotton from Africa or Fair trade for Cotton and Bonsucro for Sugar cane. Note that even 100% certification commitment on these commodities would not equal full
sustainability for reasons explained later on in this report.
©NewForesight and Commonland 2017 | All rights reserved 46Executive
summary
Poor farmers are caught in a poverty trap and
cannot invest in improved and more sustainable production
brutal facts
Why: the
Low-wealth households earn low
rates of return on their limited
assets less investible surplus
after immediate consumption needs
are met
What: systemic
changes
Inability to reduce consumption in Low return rates and constrained
order to enable a modest savings liquidity “equilibrium asset
of opportunities
Why now: value
strategy no savings at all possible holding at a relatively low level”, i.e.
poverty trap steady state of low wealth
Exclusion from financial markets
How: holistic
approaches
jump to higher return asset level
through borrowing impossible
autarchic saving only capital
accumulation strategy (at very low
rate)
A: Background
Source: Tittonell, P. and K.E. Giller, 2012. When yield gaps are poverty traps: The paradigm of ecological intensification in African smallholder agriculture. Field Crops Research 143 (2013) 76–90; Carter,
M.R. and C.B. Barrett, 2006. The economics of poverty traps and persistent poverty: An asset-based approach. The Journal of Development Studies 42 (2006) 178-199
©NewForesight and Commonland 2017 | All rights reserved 47Executive
summary
Extrapolating speed of last 15 years it will take 50
to 100 years for average farmer to escape the poverty trap
brutal facts
Why: the
10%1 of farmers, need
more then 150 years
Tanzania
Years to escape
poverty trap,
extrapolating
What: systemic
development in
value added per Vietnam
changes
farmer 2000-
2014
Ethiopia
India
Philippines
of opportunities
Why now: value
Bangladesh
Indonesia
China
Colombia
How: holistic
approaches
Egypt
Cumulative % of global agriculture workers
A: Background
1. Including the farmer populations of Zimbabwe, Zambia, Madagascar, Uganda, Congo, Kenya, Malawi, Sudan, Pakistan, Nepal and Bolivia
Source: NewForesight analysis of World development indicators (World Bank)
©NewForesight and Commonland 2017 | All rights reserved 48Executive
summary
Environmental impact can best be measured through the
lens of planetary boundaries
Our analysis builds on findings of scientific community
brutal facts
Why: the
The Stockholm Resilience Center has pioneered The Netherlands Environmental Assessment Agency
the planetary boundaries methodology, showing (PBL) commissioned by UNEP and the International
which vital earth systems are impacted upon by Resource Panel (IRP) investigated the link between
human activity: these systems and the global food system, showing
What: systemic
how food production contributes to planetary
changes
boundaries being exceeded
of opportunities
Why now: value
How: holistic
approaches
A: Background
©NewForesight and Commonland 2017 | All rights reserved 49Executive
summary
We measured environmental impact per country along four
indicators that link to planetary boundaries
brutal facts
Why: the
What: systemic
changes
Deforestation/Land system change: Freshwater depletion:
% increase forest area 1990-2013 Agriculture water usage as % of local
renewable freshwater resources
of opportunities
Why now: value
How: holistic
approaches
Soil depletion/Land system change: Nutrient overload and GHG emissions:
arable land + forest land increase 1990-2013 N2O emissions from agriculture per hectare
A: Background
as % of arable land in 1990 agriculture area (KG CO2 eq.)
1. N2O emissions used as best available indicator for much broader problem of GHG emissions and nutrient usage as well as correlated problem of nutrient overload and eutrophication
©NewForesight and Commonland 2017 | All rights reserved 50Executive
summary
Net loss of 130 M hectares forest area since 1990
With large differences between countries
Increase
brutal facts
Why: the
forest area
(% 1990- China
2013)
What: systemic
changes
US
Russian Federation
Mozambique
Bolivia Congo
Brazil
of opportunities
Why now: value
Colombia
Tanzania
Indonesia
Myanmar
Around 60% of deforestation is
considered to be a result of clearing for
agricultural use. Notable sectors are…
10-30% of Forest lost in many - Cattle ranching
How: holistic
approaches
Uganda Latin American, Asian and - Soybean farming
African countries
- Oil palm plantations
Nigeria
Cumulative global forest area 1990 (M hectares)
A: Background
Source: NewForesight analysis of World development indicators (World Bank)
©NewForesight and Commonland 2017 | All rights reserved 51You can also read