Crop Insurance and Food Security: Evidence from Rice Farmers in Eastern India Thiagu Ranganathan - American Economic ...
←
→
Page content transcription
If your browser does not render page correctly, please read the page content below
Crop Insurance and Food Security: Evidence from Rice Farmers in Eastern India

 Thiagu Ranganathan

 Assistant Professor
 Economics and Social Sciences
 Indian Institute of Management (IIM) Nagpur
 Ambazari Road, Nagpur,
 Maharashtra, India 440010
 Email: Thiagu.Ranganathan@IIMnagpur.ac.in

 Ashok K. Mishra
 (Corresponding Author)
 Kemper and Ethel Marley Foundation Chair
 Morrison School of Agribusiness
 W. P. Carey School of Business
 Arizona State University
 7271 E Sonoran Arroyo Mall
 Mesa, AZ 85212 USA
 Tel: 480-727-1288 | Fax: 480-727-1961
 Email: Ashok.K.Mishra@Asu.edu

 Anjani Kumar

 Research Fellow
 International Food Policy Research Institute
 South Asian Office
 Dev Prakash Shastri Marg, Pusa
 New Delhi, India 110012
 Email: Anjani.Kumar@CGIAR.org

*Invited Paper prepared for presentation at the 2019 annual meeting of the Allied Social Sciences
Association, Atlanta, GA, January 4-6, 2019.

Copyright 2019 by Ranganathan, Mishra, and Kumar. All rights reserved. Readers may make
verbatim copies of this document for non-commercial purposes by any means, provided that this
copyright notice appears on all such copies.
Crop Insurance and Food Security: Evidence from Rice Farmers in Eastern India

Abstract

The paper explores the spread of crop insurance (CI) in India and analyzes the association of
factors affecting the demand for crop insurance. Additionally, using large farm-level survey data
from Eastern India, the study assesses CI’s impact on rice yields of smallholder rice producers.
The study tests for robustness of the findings after controlling for other covariates and endogeneity.
Results indicate CI has a positive and significant impact on rice yields. In particular, the ATET
and ATEUT effect of CI on rice yields is about 47%. However, CI’s impact on rice yields is
heterogeneous among farm sizes of smallholders. Participation in CI increased rice yields of large
farms by 49% but increased rice yields of small farms by only 16%.
Keywords: crop insurance, rice yield, farm size, India, food security, treatment effects,
heterogeneous treatment effects
JEL codes: O13; Q14; Q18

Introduction

Agriculture is a risky profession, and the outcomes from agriculture are subject to variations in

weather and market forces. Variations due to weather have increased over time due to climate

change. It is also likely that climate change will have heterogeneous impacts across geographical

regions (Lobell et al., 2008; Dell et al., 2008). Countries in South Asia and Southern Africa are

likely to suffer more from climate change than those in Europe or North America, and these

changes are likely to have an impact on both production and yield of major crops like rice and

maize. The risk and uncertainty in production and yield of crops is not likely to impact just the

food security of the nation (Wheeler and von Braun, 2013), but is also likely to directly impact

income and poverty among rural populations in general and farming households in particular

(Barnwal & Kotwani, 2013). The authors note that rural livelihoods face increased vulnerabilities

in food security.

 Given this background, it is vital to understand the instability in production of crops, yield,

adaptation strategies used, and the effectiveness of the adaptation strategies on food security. In a

 1
recent study, Ray et al. (2015) find that India was among the countries with the highest coefficient

of variation for maize and rice yields. Ray et al. (2012) estimate that maize yields have stagnated

in 31% of India’s maize-growing areas. Similarly, yields have stagnated in 36% of India’s rice-

growing areas, 70% of its wheat-growing areas, and more than 1 million hectares of its soybean-

growing area (Ray et al., 2012). This combination of slowing/stagnant growth and instability in

yields could significantly affect the vulnerability and viability of small and marginal farmers in

India. India is a vast country of 29 states with varied climatic and soil typology. The instability in

food grain production is heterogeneous across the states. For instance, states like Maharashtra,

Bihar, Tamil Nadu, Orissa, Madhya Pradesh, Rajasthan, and Gujarat indicate highly unstable food

grain production. Though instability in production had declined in some states of India, the

variations in farmers’ crop incomes are high and indicate an urgent need to work on measures to

stabilize crop yields, prices, and revenues for farmers (Chand and Raju, 2008).

 In such a context where variability in climate, modern technology, and smallholders’

adaptation measures are interacting with increased variability in crop incomes, formal insurance

markets could play an important role in fostering agricultural development, increasing

productivity, and increasing food security in India (Hazell and Hess, 2010). The Government of

India (GoI) under the 2016 Pradhan Mantri Fasal Bima Yojana (PMFBY) has recognized the need

for crop insurance (CI) in achieving food security. Although CI has existed in India for some time,

the spread of CI has gained momentum in recent years due to increasingly frequent extreme climate

events, growing agrarian distress, and market reforms. Despite this background, there has been

very little literature on the evaluation of insurance products in India (e.g., Tobacman et al., 2017).

In their study, Tobacman et al., (2017) evaluated the feasibility of rainfall insurance in three

 2
districts of Gujarat. To best of our knowledge, the literature fails to address the issue of CI and

food security of smallholders in India.

 Herein lay the objectives of this paper. This study investigates the relationship between CI

and food security of smallholder households in India. First, the study explores CI’s impact on rice

yield of smallholder producers in Eastern India. 1 Second, the study identifies whether the impact

is different for insured and uninsured farmers by calculating the average treatment effect on the

treated (ATET) and the average treatment effect on the untreated (ATEUT). Finally, the study

identifies the heterogeneous impacts of CI on rice yields by farm size (small, marginal, medium,

and large). To address the above objectives, the study uses large-scale survey data collected from

smallholder rice farmers in six Indian states. These states were selected because they are in similar

agro-ecological zones, have the same soil typology of Eastern India and more prone to risk than

other regions of India.

 This study contributes to the literature in several ways. First, the study addresses CI’s impact

on food security (rice yield). CI is attractive to policymakers who are seeking ways to address risk

and uncertainty in agriculture and overcome their effects on food security. Second, due to

budgetary pressures and government’s reduced role in the agricultural sector, policymakers are

seeking ways to privatize risk management strategies in India, and our analysis is very pertinent

in this context. Finally, the analysis is conducted with the unique large representative sample

comprising farms of different economic sizes and located in different states of Eastern India.

 The rest of this paper is organized into six sections. The next section provides information on

survey data. Third section provides a brief historical background of crop insurance in India. The

forth section provides measures of food security. The fifth section provides the conceptual and

1
 Includes states like Bihar, West Bengal, Odisha, Eastern Uttar Pradesh, Jharkhand, and Chhattisgarh.

 3
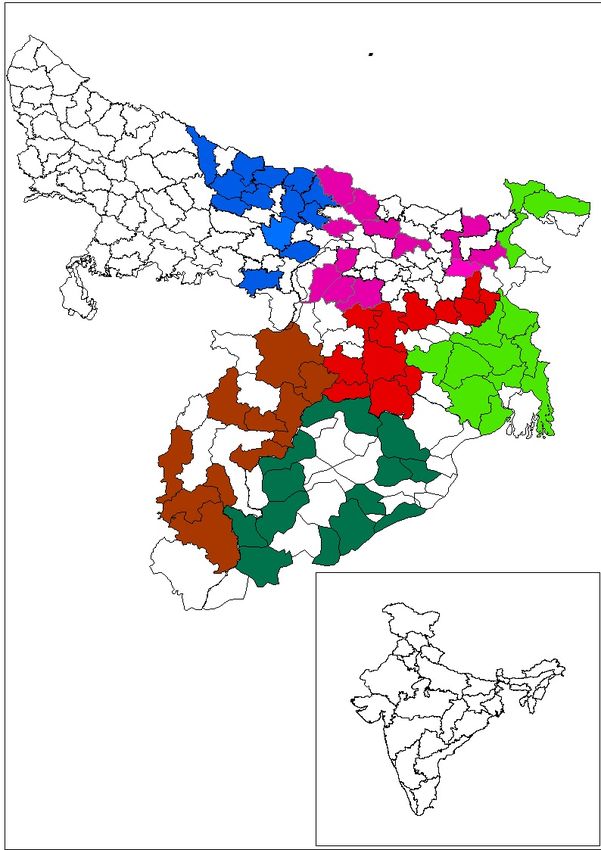
econometric framework used in the study. Sixth section provides the results, and the final section

provides some concluding comments and policy implications.

 Survey Data

This study uses data from a primary survey conducted in six states: Bihar, Chhattisgarh, Eastern

UP 2, Jharkhand, Odisha, and West Bengal in the eastern region of India, a region considered the

hub of poverty and undernourishment in India. The region accounts for more than 50 percent of

India’s poor and food-insecure population. The region is predominantly agrarian, and farms are

mostly small and marginal with limited resources. Smallholders in this region face several

challenges, including recurrent floods and droughts, cyclones, and numerous pests and diseases.

Farmers also face severe constraints such as rising input prices, declining farm profits, and

increasing strains on natural resources. Rice is the eastern region’s major crop, accounting for

about 60 percent of the gross cropped area. Among the states mentioned above, thirteen

predominantly rice-growing districts were selected from each state (Figure 1). In each district, we

randomly sampled three blocks. We then randomly sampled two villages from each block. A house

listing was conducted in each village to obtain a large sample of farm households, from which we

randomly selected 20 households to survey. Thus, we collected data from 78 districts spread over

468 villages. The final sample after data cleaning consisted of 8,440 farm households. The sample

households consisted of 60 percent marginal farmers, 29 percent small farmers, 7 percent medium

farmers and 4 percent large farmers. The survey queried farmers on a variety of operator and

household characteristics, variety adoption, source of information, credit and insurance.

 Table 1 presents the definition and summary statistics of the variables used in this study.

Table 1 shows significant differences between insured and uninsured rice farmers in Eastern India.

2
 We considered eastern UP only as other parts of the state do not come under eastern region.

 4
For instance, the rice yield for all farmers averages 2.66 tons/acre, but the yield among insured

farmers is almost double (3.76 tons/acre) the yield of uninsured farmers (1.83 tons/acre), a

difference that is statistically significant at the 1% confidence level.

 Table 1 also shows significant statistical differences across various demographic,

agricultural, and socio-economic characteristics of insured and uninsured rice farmers in Eastern

India. In the sample, 25.2% of all household heads (HH) are illiterate, and 23.9% had less than 5

years of schooling (primary education). More than one-third (36.4%) of HHs had 6 to 10 years of

schooling (secondary education), and 14.5% had more than 10 years of schooling (tertiary

education). There was a slightly larger proportion of illiterate farmers and a slightly smaller

proportion of farmers with primary education among the uninsured rice farmers, compared to the

insured rice farmers.

 Caste 3, a unique Indian social institution, plays an important role in Indians’ economic life,

schooling, income, food, and access to inputs and service. Table 1 reveals that almost half (47.1%)

of all farmers belonged to the other backward caste (OBC), 20.8% to the general caste, 13.1% to

scheduled castes (SCs), and 18.7% to scheduled tribes (STs). The SCs and STs are historically

dominant lower castes and lag other caste categories in many socio-economic indicators. In

particular, the SCs and STs have had less access to land and assets than OBCs and the general

caste. Table 1 shows that among insured farmers, 12.1% belong to the general caste, 50.1% to the

OBC, 27% to STs and the remaining 10% to SCs. These percentages could vary across states due

to different caste compositions in the states. For instance, Chhattisgarh and Jharkhand states have

a larger proportion of farmers belonging to STs, and therefore STs form a larger proportion of

3
 The Caste system is comprised of four hierarchical categories, the Brahmins, Kshatriyas, Vaishyas, and Shudras.
These castes are classified as Scheduled Castes (SCs), the socially and economically marginalized, indigenous
ethnic groups that are classified as Scheduled Tribes (STs), and, more recently, another group of castes, which are
referred to as Other Backward Castes (OBCs).

 5
insured farmers. The household size of all smallholder rice producers averaged 6.84, with the

number of family members lower for insured farmers than for uninsured farmers. The difference

was statistically significant at the 1% level. Of all farmers, 73.8% indicated farming is their

primary occupation; however, only 70% of insured farmers and 76.7% of uninsured farmers

indicated farming is their main occupation. Finally, insured farmers had slightly more farming

experience (25.2 years) than uninsured farmers (24.2 years).

 In terms of agricultural characteristics, land size for all farmers averaged 2.89 acres (table

1), with land size significantly higher (3.28 acres) for insured farmers than for uninsured farmers

(2.59 acres). In terms of irrigation facilities, 54.9% of farmers in the sample had no access to any

source of irrigation; 34.2% had access to groundwater irrigation, including pumps and tube well;

and 10.9% had access to surface water irrigation, including canals, rivers, and ponds (table 1).

Table 1 shows that a larger proportion of insured farmers had no source of irrigation, compared to

uninsured farmers, and a larger share of uninsured farmers had access to groundwater irrigation,

compared to insured farmers. Findings here might indicate that farmers perceive CI as a substitute

for access to irrigation facilities. Thus, rice farmers with access to groundwater irrigation may not

perceive the need for CI. In terms of land typologies based on land elevation 4, we find that about

61.6% of all rice farmers have plots that are classified as medium land, 28.7% have plots classified

as lowland, and 10.9% have plots classified as upland. Rice is typically cultivated in medium land,

4
 Technically, the classification of low land, medium land, and up land occurs based on the elevation of the land
above sea level. Land elevations of less than 200 meters above sea level are considered low land, those above 400
meters are considered upland, and between 200 meters to 400 meters are considered medium land
(https://www.bbc.com/bitesize/guides/zsg639q/revision/3). But our variable is considered based on the responses by
farmers on where their plots of land are present. Farmers would have referred to land at higher elevation than typical
plots in the village as upland, land at lower elevations would have been classified as lowland, and the average
elevation would have been categorized as medium land.

 6
and a study in Eastern India and Bangladesh (Hossasin et al., 2012) found a similar distribution of

rice cultivation across medium, low and upland.

 Table 1 also reveals significant differences in other socio-economic characteristics of

insured and uninsured rice farmers in Eastern India. A higher proportion of insured farmers had

soil health cards (15.2%) than did uninsured farmers (4.4%). A higher proportion of insured

farmers had debt (27.4%) and Kisan credit cards (50.7%) than did uninsured farmers (13.3% and

21.2%, respectively). This finding is not surprising as access to CI is closely linked to access to

credit, and CI is mainly sold through banks and private enterprises. Table 1 shows that insured

farmers have more assets than uninsured farmers, and that the proportion of progressive farmers 5

is higher among insured farmers than uninsured farmers. Table 1 shows that insured rice farmers

cultivate more crops (1.56) than do uninsured farmers (1.22). We also find that insured farmers

have diversified into livestock production, having more cattle, goats, and sheep than uninsured

farmers have. The above findings indicate that besides purchasing insurance, risk-averse rice

farmers are engaging in additional self-insurance (Ehrlich and Becker, 1972) by cultivating more

crops and diversifying income through additional farming enterprises such as livestock.

 Finally, table 1 shows characteristics that seem to influence access to CI. However, some

unobserved characteristics could be correlated to both access to CI and rice yields. It is in this

background that we choose an instrumental variable estimation technique of the treatment effect.

We consider two IVs in this regard. The survey queried rice farmers whether they considered

drought a significant constraint to farming. We find that 79.5% of insured rice farmers considered

drought a constraint, but only 48.5% of the uninsured farmers did (table 1). This finding could

have a significant influence on the decision to buy CI. We also find that 10.3% of insured rice

5
 Progressive farmers comprised 10% of the sample and are defined as those who typically initiated the adoption of
newer inputs and provided advice related to use of inputs like fertilizers and pesticides.

 7
farmers belonged to a farmers’ club or a group, but only 3.3% of uninsured rice farmers did. Again,

membership in a farmers’ club or group could indicate access to CI. Therefore, two variables,

drought as a constraint and membership in a farmers’ club or group, could serve as IVs in this

study.

Crop Insurance in India

The provision of the first government-subsidized CI product in India dates to 1972. Since then,

various insurance schemes have followed; for a detailed account of the evolution of CI schemes in

India, see Raju and Chand (2007 and 2008). For a long time, the publicly funded insurance

company, Agricultural Insurance Corporation of India (AIC, India) was the sole provider of CI in

India. Despite all the efforts, farmers’ CI coverage in India has historically been low (see

Dandekar, 1976, 1985; Mishra 1995; Sinha 2004; Clarke et al., 2012 and Mukherjee and Pal, 2017

for details) 6. The Indian government now offers insurance products that combine the features of

weather-based index (WBI) and area-based yield (ABY) crop insurance (Clarke et al., 2012). The

Modified National Agricultural Insurance Scheme (MNAIS) and the Pradhan Mantri Fasal Bima

Yojana (PMFBY), launched in 2010 and 2016 respectively, combine the features of WBI and ABY

insurance programs.

 Several unique features of the PMFBY have gained popularity among food-crop and

oilseed farmers. These features include: (1) The sum insured is determined by the district-level

technical committee (DLTC), which takes into account the cost of cultivation on the basis of land

quality, irrigation expenses, and costs of fertilizer, seeds, and labor; (2) the premium rates is fixed

at 2% of the sum insured or the actuarial rate, whichever is less, for Kharif season and at 1.5% for

Rabi season; (3) the estimation of crop yield is based on crop-cutting experiments at the village

6
 Various insurance products in India and challenges related to the spread of crop insurance in the country.

 8
level for four major crops and eight other crops; (4) a bigger role for private insurance companies;

(5) a requirement that payments be processed within 30 days of a loss; (6) the timely release of

premium subsidy to private companies; (7) the use of modern technology; 7 (8) publicity and

awareness, such as significant outreach to farmers through smartphones, electronic and print

media, and documentaries. As a result, under the newly launched PMFBY program, the insured

area increased slightly from about 54 million hectares (ha) in 2015-16 to about 57 million ha in

2016-17 (Gulati, Terway and Hussain, 2018).

 However, during the same period, the number of insured farmers increased 21.3% (from

about 47 million to 57 million). The agricultural census of India 2015-16 puts the number of

operational holdings at 146 million 8 and operating area at 157 million hectares. This would mean

an insurance coverage of roughly 39% based on operational holdings and 36% based on operating

area. Seasonally, the PMFBY program provided coverage for about 39 million farmers in the 2016

Kharif cropping season, up from about 25 million farmers during the same cropping season in

2015. The report by Gulati, Terway and Hussain (2018) points out that India’s CI program has

taken significant, structurally sound steps forward. By launching these programs, the GoI has

shown the willingness to provide CI to more farmers and to increase participation by private

insurance companies. In the last two seasons (Kharif 2016; Rabi 2016-17), approximately 24

million hectares have been insured under the PMFBY 9 program, and the gross cropped area during

the period was about 200 million hectares 10.

7
 Use of mobile based technology with GPS stamping to assess crop loss.
8
 http://agcensus.nic.in/document/agcen1516/T1_ac_2015_16.pdf
9
 http://www.aicofindia.com/AICEng/Pages/BusinessProfilePMFBY.aspx
10
 http://agricoop.nic.in/sites/default/files/Annual_rpt_201617_E.pdf. The report has data related to gross cropped
area in 2015-16. Given that the deviations in total cropped area are less over the last few years, we could expect that
the gross cropped area in 2016-17 is also likely to be similar to 2015-16, which was 200.9 million hectares.

 9
Figures 2 and 3 show the distribution of farmers and insurance coverage across farmland

categories in the sample. Figure 2 reveals that a large proportion of farmers, about 85%, are

marginal or small farmers, with land holdings of 5 acres or less. A small share, 0.5% of agricultural

households, operate large farms of greater than 25 acres. The distribution of farms in the sample

reflects a similar distribution of farms in India. When it comes to CI coverage level, figure 3 shows

that 43% of all smallholder farms in the sample were covered. The sample estimates show a higher

CI coverage than 36% or 39% suggested by 2015-16 agricultural census. Coverage also varies by

farm size. CI coverage for marginal and small farmers was 39% and 46%, respectively; semi-

medium and medium farmers had much higher coverage of 52% and 62%, respectively; and large

farmers (42 farmers) had a coverage level of 40%. Figure 4 presents the distribution by state of CI

coverage in the sample rice farmers in Eastern India. The figure reveals that CI coverage is highly

heterogeneous. For instance, rice farmers in two states, Chhattisgarh and Jharkhand, had relatively

higher CI coverage—88% in Chhattisgarh and 72% in Jharkhand─ but farmers in Odisha, a major

rice-producing state, had relatively less CI coverage (53%), and significantly fewer rice farmers in

Bihar (20%), Eastern UP (11%), and West Bengal (8%) had CI coverage.

Food security

It is widely accepted that a lack of adequate food, whether chronic or transitory, is a principal

indicator of food insecurity and poverty. Food insecurity is a major public policy concern in many

developing countries, and agricultural development is crucial in addressing this problem. The

definition of food security focuses on four distinct but interrelated elements, all of which are

essential to achieving food security. These elements are: (1) food availability; (2) food access; (3)

food utilization; and (4) food stability (Tweeten, 1997). Discussions in the 1970s emphasized the

 10
supply side of food security, pointing to shortfalls in food availability related to shortages in food

supply and high food prices (Sen, 1981).

 Food insecurity could be measured at the macro level (e.g., nation, state, district) or at the

micro level (e.g., household). Food insecurity and poverty are significant problems for rural

households, the majority of which are farming households in developing countries. In the early

2000s, Bickel et al. (2000) developed a guide on how to measure household food security. The

guide could not identify a single independent indicator that sufficiently captures the full range of

food security/insecurity measures. Several indicators therefore are needed to accurately reflect a

household’s food security status. According to Bickel et al. (2000), household surveys can be used

to provide information on indicators of food security. For example, a household running out of

food without money to obtain more food, a respondent’s perceptions that food eaten was

inadequate in quality or quantity, and a household adjusting the number of meals per day could be

used as indicators of food insecurity. Finally, Diao and Pratt (2007) noted the importance of both

agricultural and non-agricultural efforts in solving problems of food security, 11 hunger and poverty

in developing economies.

 One of the most common methods used to assess food access is the Food and Agricultural

Organization (FAO) of the United Nations (UN) method, which focuses on estimations of habitual

dietary energy supply per capita at the country level. The use of food balance sheets allows for

identification of the supply of commodities, utilization, and the supply available for consumption.

Advantages of this method include data availability (secondary data) for most of the countries,

updated yearly in collaboration with the World Bank. Consumption data and a wide variety of

11
 Defined as the amount of food physically available to a household (micro level) or in the area of concern (macro
level) through all forms of domestic production, commercial imports, reserves and food aid.

 11
indicators for the four pillars of food security, which allow for comparisons at the regional,

national, and global level, are also available. At the household level, household expenditure

surveys are the third most commonly used method to collect information on food security.

Outcomes include caloric intake per capita per household and dietary variety scores, with emphasis

on expenditures on food and necessities, quantity of food produced and purchased, as well as food

received as gifts or payments. Researchers report advantages of this method in terms of addressing

the accessibility dimension of food security and dietary quality data (Smith and Subandoro, 2007),

evaluation of household insecurity, and evaluation of food and nutrition programs (Rose and

Charlton, 2002). The survey does not address food consumption directly, which can leave room

for error in the measurement of food security. From a logistic approach, it is also hard to control

whether the food consumed comes from gifts, own production, or purchase. Other measures of

food access include the anthropometry index, food consumption score, food variety score,

household dietary diversity score, and household food insecurity access scale.

 Crop yield is a measure of food availability—an indicator of food security (Fischer,

Byerlee, and Edmeades, 2014). In this study, we consider rice yield as the main indicator of food

security. Rice is a staple food for more than 4.4 billion Asians. Asia produces and consumes more

than 90% of the total rice production. India is the world’s second-largest producer and consumer

of rice. Rice is the most important individual source of dietary energy in Asia, providing 31% of

dietary calories and 22% of total protein intake. Rice’s share of food expenditures ranges from 4%

to 31% across Asian countries. The poor spend more income on rice than the rich do. A 25%

increase in rice prices translates into a 7–10% drop in the real income of the poor (IRRI, 2008).

Thus, in India, rice farming plays a vital role in rural income, employment, livelihood, food

security, and national stability.

 12
To achieve food security in India, we need to understand yield improvement, and yield-

based analysis would be meaningful to understanding food security under an assumption of

managed risk. Recall that CI, by offering the chance to shift production risk, enables rice producers

to engage in risky business and expand their farming operation by relaxing input and financial

constraints (Ahsan et al. 1982). To understand CI’s impact on rice yield, we use an ex-post

evaluation approach through counterfactual evidence-based statistical analysis. We consider

adoption of CI as a treatment provided to farmers and use IVs to deal with the issue of treatment

endogeneity. We also test for robustness of our results by comparing the treatment effects using a

Heckman two-step selection model.

Conceptual and Empirical Framework

In the context of CI and farm production, conceptual studies such as Ramaswami (1993),

Chambers and Quiggin (2002), and Carter et al. (2016) provide a framework for CI’s impacts on

the reallocation of farm resources. Ramaswami (1993) examines the effect of crop insurance on

supply response in a model with single- and multiple-input production functions under an expected

utility framework. The effect of insurance is decomposed into risk reduction and moral hazard.

Ramaswami (1993) suggests that the direction of the effect of insurance on supply response is

ambiguous. Chambers and Quiggin (2002) use the Arrow-Debreu state-contingent approach and

investigate the linkage between a crop producer’s insurance choice and production decisions when

area-yield insurance is available. They provide a sufficient condition for the provision of area-

yield insurance to induce a change toward riskier production patterns. Ahsan et al. (1982) showed

that with single input and single uncertain output, CI promotes agricultural output. Other studies

in the literature show that CI changes the planting structure (Wu 1999; Young et al. 2001). In the

early 2000s, Hau (2006) examined the impact of output decision of a risk-averse producer facing

 13
profit risk (price and output uncertainty) in the presence of CI or hedging. Consistent with Ahsan

et al. (1982), Hau’s analysis reveals that under certain conditions CI can increase agricultural

output. We use Hau’s (2006) economic model and the following econometric tool to estimate our

empirical model.

 We consider CI as a binary treatment that a farmer adopts or does not adopt. We consider

 to be the binary treatment that takes a value of 1 for insured smallholder rice producer, 0 for

otherwise. Let 1 and 0 denote potential rice yields for smallholder households with and without

CI. The average treatment effect (ATE) of CI on rice yield can be specified as:

 = ( 1 − 0 ) (1)

The estimation of the above is not straightforward with observational data as we observe the rice

yield of the household only in the insured or uninsured state, and hence identifying the ATE

Ordinary Least Squares (OLS) may not be prudent. As we estimate the ATE, we also are interested

in estimating two other parameters: the ATE of CI on yield among insured smallholder rice

producers, and the ATE of CI on yield among uninsured smallholder rice producers. The two

quantities estimated are the average treatment effect on the treated (ATET) and average treatment

effect on the non-treated (ATENT) given by:

 = ( 1 − 0 | = 1) (2)

 = ( 1 − 0 | = 0) (3)

To estimate the parameters, we start with the following assumption related to the rice yield among

farmers:

 0 = 0 + 0 + 0 , ( 0 ) = 0, ( 0 | ) = 0, 0 = (4)

 1 = 1 + 1 + 1 , ( 1 ) = 0, ( 1 | ) = 0, 1 = (5)

 = 0 + ( 1 − 0 ) (6)

 14
where is the vector of covariates that affects smallholders’ rice yield. These factors include

demographics, household attributes, farm characteristics (farm size and plot characteristics), and

various other socio-economic characteristics (assets and livestock holdings) of the rice farmers.

Substituting (4) and (5) into (6), we obtain:

 = 0 + ( 1 − 0 ) ∗ + 0 + ( 1 − 0 ) ∗ + 0 + ( 1 − 0 ) ∗ (7)

In the above equation, the treatment effect can be estimated by an OLS if the unobserved factors

influencing the treatment (those who have CI) are independent of the error terms 1 or 0 . In such

a scenario, an OLS of the following form will be sufficient in estimating the treatment effects:

 = 0 + + 0 + ( − ) + (8)

where is the ATE of CI on rice yields, and provides the estimate of heterogenous treatment

effects of CI on rice yields. However, in equation (7), if unobserved factors determining the

purchase of CI are also correlated with the error terms, CI treatment is considered endogenous to

rice yields and thus OLS estimation would lead to biased estimates. A possible solution is to

assess the propensity to purchase CI (Ii) by individual. Specifically:

 = 0 + 1 + µ (9)

where µ is the error term. Endogeneity arises if the error term µ is correlated with 0 or 1 . In such

a case, an instrumental variable (IV) method will provide consistent estimates of treatment effect.

Applying IV estimation requires at least one variable, , the instrumental variable (IV), which is

correlated to the CI purchase decision but directly uncorrelated with rice yields. Once we have

identified the IV, the treatment effects can be estimated by various econometric techniques. We

estimate the empirical model, three different IV estimation methods, using ivtreatreg in STATA

(Cerulli, 2014). All three estimation techniques first use an OLS or probit regression to estimate

participation in CI or treatment group on the covariates and IV to predict the value of and use

 15
the predicted probabilities to estimate the treatment effect. The first method, Direct Two Stage

Least Squares (D-2SLS), does not consider the binary nature of the CI treatment and uses an OLS

regression to estimate the predicted probability of CI participation. The second method, Probit-

OLS technique, considers the binary nature of the CI treatment in the first stage. The third method,

Probit-2SLS, estimates a Probit of model of CI treatment on covariates and the IV variable to

obtain the predicted values of being in CI treatment. In the final stage, an OLS regression of rice

yields on covariates and fitted values of CI treatment is used to obtain the consistent estimates of

ATEs. The estimates obtained from the Probit-2SLS regression are considered more efficient than

those obtained from the other two methods. Additionally, the IV estimates are considered more

robust to distributional assumptions of error term than those obtained by Heckman’s two-step

selection method. 12 Finally, we compare the treatment effects based on IV estimation with

estimates obtained from Heckman’s two-step selection method (Cerulli, 2014).

Results and Discussion

 Table 2 indicates that even after accounting for endogeneity, CI has a positive impact on

rice yields. In particular, results in table 2 suggest that CI increases rice yields by 47%. Findings

indicate that CI promotes agricultural output by helping farmers managing risk. Lenders in India

require borrowers to participate in CI programs. Anecdotal evidence in the study area suggests that

farmers tend to use newer and improved seeds, technology, or credit, knowing that CI covers crop

failure. Further, as pointed out in Ahsan et al. (1982), CI enables farmers to engage in risky

activities that they would not undertake otherwise. Access to and availability of CI changes the

farmer’s attitude and induces him to undertake risk. For instance, Ray (1974) found that rice

farmers in Anuradhapur, a risky district of Sri Lanka that relies on rain-fed irrigation, started

12
 Heckman’s method is considered to be more efficient that IV estimates, if the errors are normally distributed.

 16
cultivating rain-fed rice when CI became available. 13 Additionally, Mishra (1994) found that

insured smallholder households invest more in agricultural inputs, leading to higher output and

income per unit of land 14 , leading to higher output and income per unit of land. Another plausible

explanation for our finding is that farmers may increase acreage by adopting improved but

uncertain technology when they are assured of compensation in case of crop failure (Hazel, 1992;

Bhende, 2005). Finally, in conjunction with a minimum support price (MSP), CI may allow rice

farmers to service higher levels of debt with no increase in risk. Our results are consistent with

findings in the literature that show insurance changes farmers’ behavior toward investing more in

crops with more risk and higher returns (Cai, 2016; Karlan et al., 2014)). Cai (2016) found that CI

program for tobacco producers in China increased tobacco production by 16%. In another study,

Cai et al., (2015) found that adoption of sow insurance significantly increased farmers’ sow

production, an increase not induced by substituting other livestock.

 Table 2 reveals other factors affecting rice yields. For instance, educational attainment of

the head of household (HH) is significantly and positively correlated with rice yields. Primary,

secondary and tertiary education of the HH increases rice yields by 8.3%, 10.8%, and 15.4%,

respectively, compared to HHs who are illiterate. A possible explanation is that education enhances

technical and allocative efficiency of resources (Khaldi, 1975). According to Huffman (1977),

education also increases farmers’ managerial capacity. Better-educated farmers also can use

efficiently information from private dealers, companies, and extension agents to their advantage

in rice farming. Finally, Goodwin and Mishra (2004) found that education increases farming

13
 In the developed country case, Wu (1999) and Goodwin et al. (2004), suggest a positive effect of crop insurance
on crop acreage.
14
 Horowitz and Lichtenberg (1993) found that U.S. farmers with crop insurance applied more nitrogen per acre and
spend more on pesticides and treated more acres with herbicides and insecticides. They argue that fertilizer and
pesticides may be risk-increasing inputs.

 17
efficiency. Our finding is consistent with other studies in the literature (Paltasingh and Goyari,

2018), which found that education has a significant impact on the adoption of modern varieties

and rice yields. The coefficient of SC and ST is negative and statistically significant at the 5% and

1% level of significance, respectively. Findings in table 2 suggest that SC and ST smallholder

households obtain 9.8% and 16.5%, respectively, lower rice yields than general category

smallholder households. This finding is not surprising because SC and ST households have lower

education and lack resources and transportation facilities compared to other households.

 The coefficient of farm size is negative and statistically significant at the 1% level of

significance. Results suggest that a 1% increase in farm size decreases rice yield by 0.24% (table

2). Our finding is consistent with the inverse relationship between farm size and productivity.

Various studies provide evidence of higher yields among farmers with smaller land sizes (Sen,

1962; Khusro, 1964, 1973; Berry and Cline, 1979; Krishna, 1995; Gaurav and Mishra, 2015).

Using large nationally representative survey data from the National Sample Survey Organisation

(NSSO), Gaurav and Mishra (2015) found a negative and significant relationship between farm

size and net returns per unit of land. Results in table 2 show that sources of irrigation have a

significant impact on rice yields. For instance, smallholders with groundwater irrigation facility

have 30% higher rice yields than smallholders with no access to irrigation (other than rain-fed).

Similarly, smallholders with access to surface water irrigation facilities have 60% higher rice

yields than smallholders with no access to irrigation.

 Results in table 2 show that compared to smallholders with lowland farms, farmers with

medium lands have higher rice yields. Our finding is consistent with Behura et al. (2012), who

found that smallholders cultivating in medium lowland and medium lands in Odisha, India, had

higher rice yields than smallholders in lowland and upland. Soil type and soil color also are

 18
associated with rice yield. 15 In our results, we find that the yield in black soil is highest, as per

expectations, but we find clay soil has lower productivity than sandy loam soils. The variance can

be due to the farmers’ perceptions and not necessarily to any outcomes of soil tests. Households

with soil health cards seem to have lower rice yields than households without soil health cards,

possibly because having a soil health card may be associated with poor soil conditions.

Smallholders may have wanted to know the reasons for low rice yields, and the first thing they

were told was to get their soil tested.

 Smallholders also use crop diversification—horizontal agricultural diversification strategy,

a risk management strategy─ as a self-insurance mechanism (Ehrlich and Becker, 1972). Results

in table 2 indicate that an increased number of crops cultivated decreases rice yields among rice

farmers in Eastern India. Enterprise diversification represents a potential means of overcoming

some of the negative side effects of monoculture rice farming systems (Taylor, 1994). On the other

hand, diversification into animal production (dairy) increases the sources of income and the total

income earned by smallholder rice farmers in Eastern India. As a result, rice farmers can allocate

more land to crop production (table 2). The number of cattle in the household also is positively

associated with crop yield. Table 2 reveals that debt (credit) and assets have a positive and

significant impact on rice yields. Recall that credit increases management efficiency, technology

adoption, and resource allocation, and it relaxes smallholders’ credit constraints. Results in table

2 show a positive and significant impact of debt on rice yields. A possible explanation is that with

additional credit (debt) smallholders can relax credit constraints and use the additional credit to

15
 The relation between soil color, texture, and other characteristics on crop yields have been explored in detail in the
Indian context (Arakeri et al., 1959). Typically, black soil has higher moisture retention and medium erosivity
compared to brown soil. Yellow and red soil have low moisture retention and medium erosivity (Desbiez et al.
2004). In general, the darker the soil, the higher the productivity. Soil with more clay is expected to provide better
yield than sandy soil (Dou et al., 2016).

 19
procure new technology (seeds, fertilizer) and increase usage of fertilizer and irrigation water. Our

results are consistent with the findings of Carter (1989).

 Parameter estimates on progressive farmers are positive and significant at the 5% level of

significance (table 2). Estimates show that progressive farmers, defined as those who initiate early

adoption of new technology and receive advice on the use of fertilizer and pesticides, have 10%

higher rice yields than other farmers. Our findings are consistent with Feder, Just and Zilberman

(1985); Owens, Haddinott, and Kinsey (2003); Jamison and Lau (1982); Jamison and Moock

(1984); and Evenson, Pray and Rosegrant (1998). Table 3 presents the heterogeneous treatment

effects of CI on rice yields by farm size. Estimates in table 3 indicate that CI has the largest effect

on large farms, increasing their rice yields by 49%, but the effect drops significantly (by 30%) for

medium-size rice farms in Eastern India. Interestingly, CI’s effect on rice yields of marginal farms

was higher (16% i.e., 49%-33%) than for small farms (13% i.e., 49%-36%). Thus, we conclude

that CI has heterogeneous impact on rice yields—higher for larger farms than small farms. The

study also tested if the average treatment effects on treated (ATET) and average treatment effects

on untreated (ATEUT) are different. To our surprise, we find that ATET and ATEUT are not

different and the yield gains from participation in CI are about 46% for both insured and uninsured

smallholder rice farmers in India.

 Table 4 provides the results to check the robustness of our estimates and the methods used

to estimate the empirical model. Table 4 shows that regardless of the method used, CI has a positive

and significant effect on rice yields of smallholder rice farmers in Eastern India. However, the

magnitude of CI’s impact on rice yield varies with the method used to estimate the empirical

model. For instance, the Direct-2SLS estimation technique shows a higher impact, and this could

be due to ignoring the binary nature of CI treatment. In contrast, the study finds that the OLS

 20
technique produces a very small impact of CI on rice yields. However, the estimation technique

that accounts for endogeneity provides an unbiased and significant impact of CI on rice yields.

Findings from this study show CI has a positive and significant impact on rice yields and that the

impact varies with farm size.

 Finally, there are some limitations to our study. The study has identified CI’s impact on

rice yield, but data limitations mean that the channels through which this yield improvement is

happening have not been explored. For instance, we do not know if the increase in yield is due to

increased use of seeds or chemical inputs.

Conclusions and Policy Implications

Since the early 1970s, policymakers in India have tried to protect smallholders by implementing

various CI schemes. However, until recently, most of the efforts to make CI a food security vehicle

have not been very successful. With a growing population, decreasing farmland sizes, increased

budgetary pressure and impetus for productivity growth and food security issues, policymakers are

designing market-oriented policies and inviting the private sector to take greater initiatives. One

such effort includes designing and selling crop insurance to smallholders. This paper analyzes the

impact of crop insurance (CI) on the food security of rice farmers in Eastern India. We used large-

scale farm-level data from smallholder rice producers in eight states of Eastern India. Using IV

estimation technique, this study found that CI has a positively significant impact on rice yields of

smallholders in Eastern India. The study also found that CI’s impact on rice yields is similar for

insured (ATE) and uninsured (ATENT) smallholders. Finally, the study found that large farms

derive more benefits from CI than small, marginal, and medium-sized farms. The results are robust

for variety of estimation strategies.

 21
Clearly, CI is an important risk management tool for smallholders in India and can

contribute to food security. The findings have various policy implications. The fact that CI has a

positive impact on rice yields means there is not strong evidence of moral hazard. In the absence

of moral hazard, providing a larger subsidy to CI schemes might be a good idea. Since the treated

and untreated group have similar effects, bringing more smallholders under CI schemes is likely

to have a positive impact on rice yields. Additionally, CI schemes sold by private insurance

companies could help policymakers design polices that are efficient and productive for

smallholders. The entry of many players will ultimately create competition in the market, and the

cost of providing CI may go down in the long run. Since a large proportion of farmers are small,

marginal, and medium size, key barriers to wider access and availability still need to be addressed.

Efforts to sensitize these farmers to the advantages of CI will go a long way to enhancing CI

coverage.

Reference

Ahsan, S., Ali, A.A. G., and Kurian, N. J. (1982). Towards a theory of agricultural crop
insurance. American Journal of Agricultural Economics, Vol 64(3): 520-529.
Arakeri, H. R. (1967). Soil management in India. Asia Publishing House; Bombay; Calcutta;
New Delhi; Madras; Lucknow; Bengalore; London; New York.
Barnwal, P., and Kotani, K. (2013). Climatic impacts across agricultural crop yield distributions:
An application of quantile regression on rice crops in Andhra Pradesh, India. Ecological
Economics, 87: 95–109. https://doi.org/10.1016/j.ecolecon.2012.11.024
Behura, D., Jaim, W. M. H., & Hossain, M. (2012). Diversity, Spatial Distribution, and the
Process of Adoption of Improved Rice Varieties in Orissa State of India. In Hossain, M., Jaim,
W.M.H., Paris, T.R., and Hardy, B. Eds .Adoption and Diffusion of Modern Rice Varieties in
Bangladesh and Eastern India, pp.45-58.
Berry, R. & Cline, W. (1979) Agrarian Structure and Production in Developing Countries
(Baltimore, MD: Johns Hopkins University Press).
Bickel, G., Nord, M., Price, C., Hamilton, W., and Cook, J. (2000). Guide to measuring
household food security. U.S. Department of Agriculture, Food and Nutrition Service,
Alexandria VA. Available at http://hungerfreecommunities.org/wp-
content/uploads/2011/04/USDA-guide-to-measuring-food-security.pdf

 22
Bhende, M.J. (2005). Agricultural Insurance in India: Problems and Prospects. Department of
Economic Analysis and Research, National Bank for Agriculture and Rural Development
Occasional paper – 44.
Cai, H., Chen, Y., Fang, H., Zhou, L.-A., 2015. The effect of microinsurance on economic
activities: evidence from a randomized field experiment. Review of Economics and Statistics
97(2), 287–300.
Cai, J. (2016). The impact of insurance provision on household production and financial
decisions. American Economic Journal: Economic Policy 8(2), 44–88.
Carter, M. R., Cheng, L., Sarris, A., 2016. Where and how index insurance can boost the
adoption of improved agricultural technologies. Journal of Development Economics 118, 59–71.
Carter, M.R. (1989). The impact of credit on peasant productivity and differentiation in
Nicaragua. Journal of Development Economics, Vol. 31, pp. 13-36.
Cerulli, G. (2014). ivtreatreg: A command for fitting binary treatment models with
heterogeneous response to treatment and unobservable selection. Stata Journal, 14(3), 453-480.
Chand, R., and Raju, S.S. (2008). Instability in Indian Agriculture. NPP Discussion Paper
1/2008. National Centre for Agricultural Economics and Policy Research. Available at
http://www.ncap.res.in/upload_files/others/Oth_22.pdf
Clarke, D.J., Mahul, O., Rao, K.N., and Verma, N. (2012). Weather based crop insurance in
India (No. 5985), Policy Research Working Paper Series. The World Bank
Chambers, R. G., and Quiggin, J., 2002. Optimal producer behavior in the presence of area-yield
crop insurance. American Journal of Agricultural Economics 84(2), 320–334.
Dandekar, V.M. (1976). Crop insurance in India. Economic and Political Weekly, 11(26): A61-
A80.
Dandekar, V.M. (1985). Crop insurance in India: A review, 1976-77 to 1984-85. Economic and
Political Weekly, 20 (25/26): A46–A59.
Dell, M., Jones, B.F., and Olken, B.A. (2008). Climate change and economic growth: Evidence
from the last half century (Working Paper No. 14132). National Bureau of Economic Research.
https://doi.org/10.3386/w14132
Desbiez, A., Matthews, R., Tripathi, B., & Ellis-Jones, J. (2004). Perceptions and assessment of
soil fertility by farmers in the mid-hills of Nepal. Agriculture, ecosystems &
environment, 103(1), 191-206.
Diao, X., & Pratt, A. N. (2007). Growth options and poverty reduction in Ethiopia—An
economy-wide model analysis. Food Policy, 32(2), 205-228.
Dou, F., Soriano, J., Tabien, R. E., & Chen, K. (2016). Soil texture and cultivar effects on rice
(Oryza sativa, L.) grain yield, yield components and water productivity in three water
regimes. PloS one, 11(3), e0150549.
Evenson, R. E., Pray, C., & Rosegrant, M. W. (1998). Agricultural research and productivity
growth in India (Vol. 109). Intl Food Policy Res Inst.

 23
Ehrlich, I., Becker, G. S., 1972. Market insurance, self-insurance, and self-protection. Journal of
political Economy 80(4), 623–648.
Feder, G., Just, R.E., and Zilberman, D. 1985. Adoption of Agricultural Innovations in
Developing Countries: A Survey. Economic Development and Cultural Change 33:255-299.
Fischer, T., Byerlee, D., and Edmeades, G. (2014). Crop yields and global food security: will
increase continue to feed the world? ACIAR Monograph No. 158. Australian Centre for
International Agricultural Research: Canberra. xxii + 634 pp.
Gaurav, S. and Mishra, S. (2015). Farm size and returns to cultivation in India: revisiting an old
debate. Oxford Development Studies, Vol. 43(2): 165–193.
Goodwin, B. K., Vandeveer, M. L., Deal, J. L., 2004. An empirical analysis of acreage effects of
participation in the federal crop insurance program. American Journal of Agricultural Economics
86(4), 1058–1077.
Goodwin, B. K., and Mishra, A K. (2004). Farming efficiency and the determinants of multiple
job holdings by farm operators. American Journal of Agricultural Economics Vol. 86(3): 722-29.
Gulati, A., Terway, P., Hussain, S. (2018). Crop insurance in India: Key issues and way forward,
Working Paper, No. 352, Indian Council for Research on International Economic Relations
(ICRIER), New Delhi.
Hau A. 2006. Production under uncertainty with insurance or hedging. Insurance: Mathematics
and Economics, 38, 347-359.
Hazell. P. (1992). The Appropriate Role of Agricultural Insurance in Developing Countries.
Journal of International Development, 4(6): 567-81.
Horowitz, J. K., and Lichtenberg, E. (1993). Insurance, moral hazard, and chemical use in
agriculture. American Journal of Agricultural Economics, 75(4), 926.
Hossain, M., Jaim, W.M.H., Paris, T.R., and Hardy, B. Eds (2012). Adoption and diffusion of
modern rice varieties in Bangladesh and eastern India. Los Baños (Philippines): International
Rice Research Institute. 251 p.
Huffman, W. E. (1977). Allocative Efficiency: The Role of Human Capital. The Quarterly
Journal of Economics, Vol. 91, No. 1, pp. 59-79.
International Rice Research Institute (2008) The Rice Crisis: What Needs to be Done? Los
Baños, Philippines: IRRI.
Jamison, D. T., & Lau, L. J. (1982). Farmer education and farm efficiency. Published for the
World Bank [by] Johns Hopkins University Press.
Jamison, D. T., & Moock, P. R. (1984). Farmer education and farm efficiency in Nepal: The role
of schooling, extension services, and cognitive skills. World Development, 12(1), 67-86.
Karlan, D., Osei, R., Osei-Akoto, I., Udry, C., 2014. Agricultural decisions after relaxing credit
and risk constraints. The Quarterly Journal of Economics 129(2): 597-652.
Khaldi, N. (1975). Education and Allocative Efficiency in U.S. Agriculture. American Journal of
Agricultural Economics Vol. 57, No. 4, 650-657.

 24
Khusro, A. M. (1964). Returns to scale in Indian agriculture, Indian Journal of Agricultural
Economics, 19(3/4), pp. 51–80.
Khusro, A. M. (1973). The Economics of Farm Size and Land Reforms in India (Madras:
Macmillan).
Krishna, R. (1995). Toward a theory of optimum land reform for a dualistic agriculture, in: V.
Krishna (Ed.) Raj Krishna’s Selected Writings (New Delhi: Oxford University Press), pp. 251–
272.
Lobell, D.B., Burke, M.B., Tebaldi, C., Mastrandrea, M.D., Falcon, W.P., and Naylor, R.L.
(2008). Prioritizing Climate Change Adaptation Needs for Food Security in 2030. Science, 319:
607–610. https://doi.org/10.1126/science.1152339
Mishra, P.K. (1994). Crop Insurance and Crop Credit : Impact of the Comprehensive Crop
Insurance Scheme on Cooperative Credit in Gujarat. Journal of International Development 6(5):
529-68.
Mishra, P.K. (1995). Is rainfall insurance a new idea? Pioneering work revisited. Economic and
Political Weekly, 30 (25): A84-A88
Mukherjee, S., and Pal, P. (2017). Impediments to the spread of crop insurance in India.
Economic and Political Weekly, 52(35): 16-19
Owens, T., Hoddinott, J., & Kinsey, B. (2003). The impact of agricultural extension on farm
production in resettlement areas of Zimbabwe. Economic Development and Cultural Change,
51(2), 337-357. 14.
Paltasingh, K. R., & Goyari, P. (2018). Impact of farmer education on farm productivity under
varying technologies: case of paddy growers in India. Agricultural and Food Economics, 6-7:1-
19.
Raju, S. S., & Chand, R. (2007). Progress and problems in agricultural insurance. Economic and
Political Weekly, 1905-1908.
Raju, S. S., & Chand, R. (2008). Agricultural insurance in India problems and prospects. NCAP
Working Paper No.8.
Ray P.K. (1974). A manual of Crop insurance for Developing Countries, FAO, Rome.
Ray, D.K., Ramankutty, N., Mueller, N.D., West, P.C., and Foley, J.A. (2012). Recent patterns
of crop yield growth and stagnation. Nature Communications, 3:1-7.
https://doi.org/10.1038/ncomms2296
Ray, D.K., Gerber, J.S., MacDonald, G.K., and West, P.C. (2015). Climate variation explains a
third of global crop yield variability. Nature Communications, 6:1-9.
https://doi.org/10.1038/ncomms6989
Ramaswami, B., 1993. Supply response to agricultural insurance: Risk reduction and moral
hazard effects. American Journal of Agricultural Economics 75(4), 914–925.
Rose, D., and Charlton, K. E. (2001). Prevalence of household food security in South Africa:
Results from a large, nationally representative survey. Public Health Nutrition, 5(3), 383-389.

 25
Sinha, S. (2004). Agricultural insurance in India: Scope for participation of private players.
Economic and Political Weekly, 39(25): 2605-12
Sen, A. K. (1962). An aspect of Indian agriculture, The Economic Weekly, 14(4/6), pp. 243–246.
Sen, A. (1981). Poverty and famines: An essay on entitlement and deprivation. Oxford: Clarendon
Press.
Smith, L. C., and Subandoro, A. (2007). Measuring food security in practice. Washington, DC:
IFPRI.
Taylor, D. (1994). Agricultural Diversification: An Overview and Challenges in ASEAN in the
1990s. ASEAN Economic Bulletin, Vol. 10(3): 264-279
Tobacman, J., Stein, D., Shah, V., Litvine, L., Cole, S., and Chattopadhyay, R. (2017). Formal
insurance against weather shocks evidence from a randomized control trial in India.
Unpublished mimeo.
Tweeten, L. G. (1997). Food security. In L. Tweeten & D. McClelland (Eds.), Promoting third
world development and food security (pp.225-256). Westport, CT: Praeger.
Wu, J., 1999. Crop insurance, acreage decisions, and nonpoint-source pollution. American
Journal of Agricultural Economics 81(2), 305–320.
Young, C. E., Vandeveer, M. L., Schnepf, R. D. 2001. Production and price impacts of U.S. crop
insurance programs. American Journal of Agricultural Economics, 83, 1196-1203.

 26
You can also read