THE ECONOMICS OF CLOVE FARMING IN INDONESIA - Health, Population, and Nutrition Global Practice - World Bank ...
←
→
Page content transcription
If your browser does not render page correctly, please read the page content below
Public Disclosure Authorized                           Public Disclosure Authorized   Public Disclosure Authorized   Public Disclosure Authorized

                                                       THE

                   Global Practice
                   Health, Population, and Nutrition
                                                       OF CLOVE

                                                       INDONESIA
                                                       FARMING IN
                                                       ECONOMICS
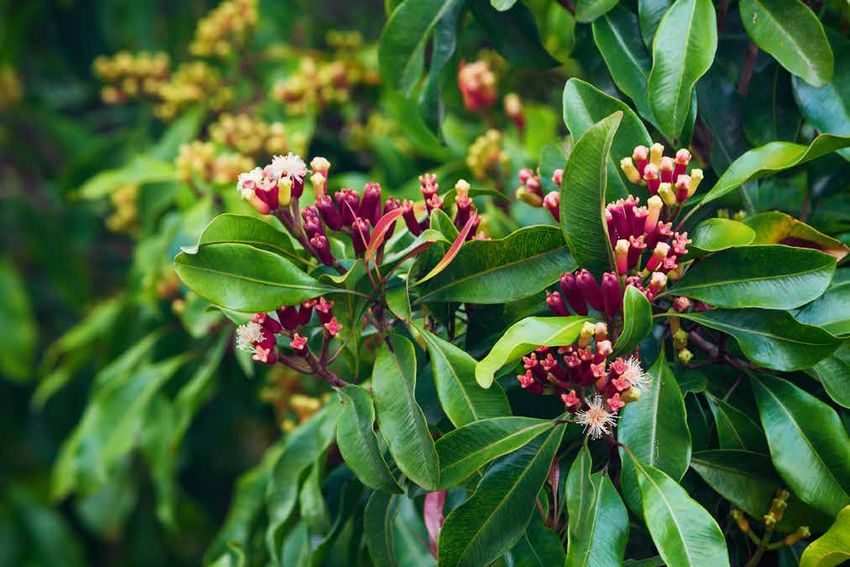
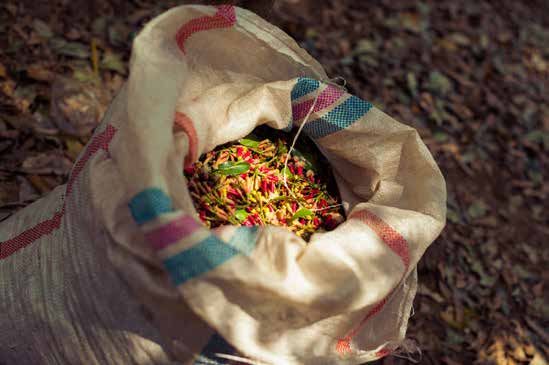
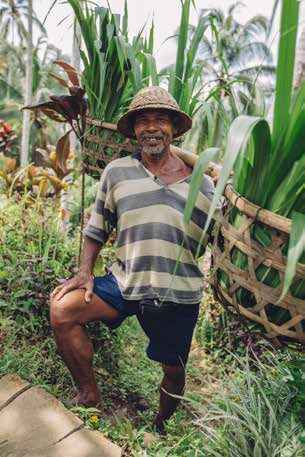
Cover photos (clockwise from left): Senior farmer standing in his farm. Photo by Jacob Ammentorp Lund /
iStock. Beautiful Panoramic View of Gunung Batur Vlcano in Bali. Photo by AleksandarGeorgiev / iStock. Bag
of Cloves. Photo by Bveth / iStock. Clove tree with spicy raw flowers and sticks. Photo by Bicho_raro / iStock.
THE
ECONOMICS
OF CLOVE
FARMING IN
INDONESIA
Health, Population, and Nutrition
Global Practice
SMOKING HAS
BEEN A MAJOR
CONTRIBUTOR O
DISEASE BURDEN
INDONESIA. SMO
PREVALENCE
AMONG WORKIN
AGE INDIVIDUAL
HAS EXCEEDED 3
PERCENT SINCE 2
 2 // The Economics of Tobacco Taxation
LIST OF ACRONYMS
APCI 		         Indonesia Clove Farmer Association
BPJS		National Health Insurance System
FAO		Food and Agriculture Organization’s
HRW		Human Rights Watch
ILO		International Labour Organization
IAKMI 		        Indonesian Public Health Association
KIS		Indonesia Health Card
KKS		Family Welfare Card
KPS             Social Security Card
PPP		Purchasing Power Parity
USD		United States (US) Dollars

                                                       3
EXECUTIVE SUMMARY
Indonesia is the world’s largest clove producer, cultivating more than 70% of the
world’s crop. The vast preponderance of Indonesia’s annual clove harvest, around 90%, is pur-
chased each year by the Indonesian tobacco industry to produce kreteks.
Many thousands of Indonesian households grow cloves, but it typically comprises
only a small proportion of their total economic activity. Recent government data suggest
that more than one million farmers grow cloves in Indonesia (IAKMI, p. 67). Given that clove
production is a fraction of broader household production/resources of most clove-farming
households and the labour involved in clove farming is intermittent and concentrated only at
specific relatively brief times of the years (e.g., harvest), actual full-time equivalent employment
is much smaller.
This report on the economics of clove farming is motivated by the recent evolution
of the taxation of kreteks and other tobacco products in Indonesia. Over more than a
decade, the Indonesian government has slowly been raising excise taxes on tobacco products.
More recently, the government has considered reforming the excise tax structure even further
by collapsing the number of tiers of taxation rates while also generally raising these rates. The
government has articulated concern that these tax reforms, while mitigating consumption of a
harmful product, could also affect the economic lives of those in the kretek value chain. Clove
farmers are part of this value chain.
This report aims to inform the current debate over the taxation of kreteks in Indone-
sia by examining clove-farming livelihoods. It presents results from a comprehensive,
household-level, economically-focused survey of 600 clove farmers across the two largest
clove-growing regions, Sulawesi and Central Java. The survey examines the role that clove
farming plays in these households’ economic lives, among other
related topics.
This report is part of the Indonesia Tobacco Employment Studies implemented by the
World Bank and the American Cancer Society. The findings from this report complement
the findings from three closely-related reports focusing on specific segments of tobacco sector
employment in Indonesia: tobacco farmers (World Bank 2017b), kretek workers or “hand-roll-
ers” (World Bank 2017c) and tobacco manufacturing more broadly (World Bank, 2017d).
The main findings of this report include:
• Though hundreds of thousands of farmers grow cloves in Indonesia, tobacco tax
reform is unlikely to cause a large economic disruption for most clove-growing
households because more than half of households derived less than 20 percent
of their income from cloves. Clove farming is not the primary source of economic
livelihood for most households that grow cloves;
4 // Executive Summary• Clove farming is not highly lucrative for many farmers, particularly in certain
regions such as Minahasa. After incorporating the costs of household labor, the aver-
age clove-farming household was losing more than two dollars per kilogram;
• Individuals in clove-farming households in the survey were on average poorer
than the average Indonesian household—11.1 percent of Indonesians fall below the
national poverty line compared to 37 percent of these clove-farming households;
• A loss to a household from lower clove production should not be presumed
because many clove-growing households with their varied economic activities
are likely to be able to effectively reallocate factors of production (including capital,
land and/or labour) to other productive activities such as alternative crops or a small
business;
{{ Land might be better allocated to more proven economically-lucrative pur-
suits, particularly in places where there are clear viable options such as growing more
of locally-grown cash crops (e.g., rice, corn, and green vegetables, among others).
Recommendations
In terms of considering what might happen if there were a change in tax policy that affected
demand for Indonesian cloves, it is important to emphasize that clove farming is not particu-
larly profitable for most clove-producing households in at least a couple of major clove-pro-
ducing districts. The government needs to research which alternatives could be viable and tar-
get the least-profitable areas for switching and help these farmers make successful transitions
to growing other crops and/or economic activities.
• In case of negative effects from higher tobacco taxes, the government could
help clove farmers to identify other economically fruitful pursuits.
{{ Research which alternative locally-grown crops are most viable on former
clove-producing land;
{{ Enhance supply and value chains for these alternative local crops;
• Support research to identify the areas where clove production is least viable
(e.g., Minahasa) and target those areas for alternatives first;
• Improve agricultural extension services for non-clove crops;
• Provide educational grants for improving clove farmers’ agricultural management skills;
• Improve access to credit for farmers to grow other crops or pursue other small economic
enterprises such as a small shop, fish farming, or a local transportation business.
{{ Provide grants or low-interest loans to farmers willing to switch to alternative
crops; and
{{ Introduce financial programs or economic development programs as forms of transi-
tion assistance away from clove cultivation.
5ACKNOWLEDGMENTS
The preparation of this report was carried out under the World
Bank Global Tobacco Control Program coordinated by Patricio
V. Marquez, with the support of the Bill & Melinda Gates
Foundation and the Bloomberg Foundation.
The report is part of the Indonesia Tobacco Employment Studies
and was prepared by a team comprised of:
Jeffrey Drope (Scientific Vice-President, American Cancer Society);
Qing Li (Senior Data Analyst, American Cancer Society);
Pandu Harimurti (Senior Health Specialist and Task-Team Leader,
World Bank);
Edson C. Araujo (Senior Economist and Task-Team Leader, World Bank);
Gumilang Aryo Sahadewo (Research Faculty Universitas Gadjah Mada
and Consultant World Bank);
Nigar Nargis, PH.D. | Scientific Director, Economic and Health
Policy Research
Josefine Durazo (Survey Specialist, World Bank);
Firman Witoelar (Director of Research, SurveyMeter); and
Bondan Sikoki (Chairperson, SurveyMeter).
The report greatly benefited from comments, inputs, and advice
provided by Teh-wei Hu (Professor Emeritus, School of Public Health,
U.C. Berkeley).
6 // Executive SummaryTABLE OF CONTENTS
List of Acronyms 3
Executive Summary 4
Acknowldgements 6
List of Tables 8
List of Figures 9
1. Introduction 11
2. Methods 15
3. Results 17
3.1 – Socio-Demographic Characteristics of Clove Farmers 17
3.2 – Household Assets 18
3.3 – Economic Livelihoods of Clove-Farming Households 22
3.4 – Costs of Clove Cultivation 27
3.5 – Clove Prices and Income 32
3.6 – Credit and Debt 34
3.7 – Household Economic Situation 36
3.8 – Alternative Livelihood Options 38
4. Household Well-being 41
4.1 – Access to Social Safety nets 41
4.2 – Food Security 44
5. Child Labour 49
6. Limitations 51
7. Conclusion 53
References 55
7The Economics of Tobacco Taxation in Indonesia
List of Tables
Table 1: Socio-Demographic Characteristics of Clove Farmers 17
Table 2: Household Size by Age Group 18
Table 3: Household Assets 19
Table 4: Non-Livestock Agricultural Assets 20
Table 5: Main Source of Livelihood 23
Table 6: Frequencies of Households by Crop Cultivation by Region—All Seasons 26
Table 7: Mean Nonlabour Costs by Region in USD 27
Table 8: Per Kilogram Nonlabour by Region in USD 27
Table 9: Clove Farming Principal Inputs and Corresponding Costs (annual) 28
Table 10: Average Hours of Hired Labour per Household by Region 31
Table 11: Average Hours of Hired Labour by Gender 31
Table 12: Average Price per Kilogram by Grade and Type (USD) 32
Table 13: Average Clove Production, Price and Income 33
Table 14: Logistic Regression of Willingness to Switch 39
Table 15: KPS and KKS Participation 42
Table 16: Participation in Indonesia Health Card (KIS) and National Health Insurance
System (BPJS) 43
Table 17: Staple Food by Number of Months Produced 17
Table 18: Logistic Regression of Determinants of Food Security 46
Table 19: Child Labour 49
8 // Table of ContentsList of Figures
Figure 1: Indonesia’s Annual Smallholder Clove Production by Ton 11
Figure 2: Indonesian Clove Exports and Imports, 1990–2013 12
Figure 3: Livestock Assets 20
Figure 4: Total Land – Owned (hectares) & Under Cultivation 21
Figure 5: Land Ownership 22
Figure 6: Clove Farming Participation by Age and Gender 24
Figure 7: Proportion of Total Household Resources from Clove Farming Income 24
Figure 8: Land Size Dedicated to Clove Cultivation by Hectare 25
Figure 9: Distribution of Nonlabour Costs in USD 29
Figure 10: Clove-Farming Household Labour Hours by Gender and Age 30
Figure 11: Clove Farming Labour Cost by Gender and Age (in USD) 30
Figure 12: Percentage of Households Hiring Men and/or Women to Cultivate Cloves 31
Figure 13: Profits per Kilogram—Real and Perceived—by Region 33
Figure 14: Demand for Credit by Region 34
Figure 15: Why Farmers Borrow 35
Figure 16: Who Clove Farmers Owe 35
Figure 17: Per Capita Resources and Incomes of Clove-Farming Households 36
Figure 18: Poverty Status of Clove-Farming Households 37
Figure 19: Reasons for Engaging in Clove Farming 37
Figure 20: Percentage of Clove Farmers Considering Alternatives 38
Figure 21: Access to Sufficient Food 44
Figure 22: Total Household Income against Actual Rice Grown (bivariate probability
density function, p.d.f. ) 47
9SMOKING HAS The Economics of Tobacco Taxation in Indonesia BEEN A MAJOR CONTRIBUTOR O DISEASE BURDEN INDONESIA. SMO PREVA V LENCE AGE INDIVIDUAL HAS EXCEEDED 3 PERCENT SINCE 2 10 // Table of Contents
1
                             INTRODUCTION

O                            Indonesia is the largest producer of cloves in the world. The Food and Agriculture
                             Organization’s (FAO) most recent statistics on clove production (from 2013) report that
                             Indonesia produced more than 70% of the world’s cloves, largely by smallholder farmers

N
                             (i.e., not plantations). In contrast, the next largest producer, Madagascar, produced ~16%
                             of the world’s cloves. Important to the broader inquiry of this research, the vast prepon-
                             derance of Indonesia’s annual clove harvest (usually ~100,000 metric tons)—typically
                             around 90 percent—is purchased each year by the Indonesian tobacco industry to pro-
                             duce kreteks. Figure 1 shows smallholder (less than four hectares) production from 1990
                             to 2015 by ton.

O                            Figure 1: Indonesia’s Annual Smallholder Clove Production by Ton
                             SMALLHOLDER PRODUCTION (Ton)

                             120,000
                             100,000
         Production by ton

                             80,000
                             60,000
                             40,000
                             20,000
                                       1990
                                              1991
                                                     1992
                                                            1993
                                                                   1994
                                                                          1995
                                                                                 1996
                                                                                        1997
                                                                                               1998
                                                                                                      1999
                                                                                                             2000
                                                                                                                    2001
                                                                                                                           2002
                                                                                                                                  2003
                                                                                                                                         2004
                                                                                                                                                2005
                                                                                                                                                       2006
                                                                                                                                                              2007
                                                                                                                                                                     2008
                                                                                                                                                                            2009
                                                                                                                                                                                   2010
                                                                                                                                                                                          2011
                                                                                                                                                                                                 2012
                                                                                                                                                                                                        2013
                                                                                                                                                                                                               2014
                                                                                                                                                                                                                      2015

                             Because of the large domestic demand for cloves, in most years, only a small pro-
                             portion, ~5 percent, is exported. Occasionally, after a strong yield over one or more

L
                             years, Indonesian clove exports increase. For example, in 2016, the UN trade statistics
                             database reports that approximately 40% of the value of total world clove exports were
                             from Indonesia, which was atypical. Inversely, in the occasional low yield year, clove
                             imports have increased to meet domestic demand. See Figure 2 below to track trends in
                             clove imports and exports from 1990 to 2013.

3
 2
                                                                                                                                                                                                                             11
The Economics of Clove Farming in Indonesia
Figure 2: Indonesian Clove Exports and Imports, 1990–2013
25,000
20,000
Volume (Ton)
15,000
10,000
5,000
1990 1992 1994 1996 1998 2000 2002 2004 2006 2008 2010 2012
Import Export
The Indonesian clove crop is typically grown on around 500,000 hectares of land,
though the monetary value of the crop fluctuates with price. In early 2016, the Indo-
nesia Clove Farmer Association (APCI) estimated that the average price was around $7.19/
kg. The same association suggested that this was a profit margin of more than 25% for
farmers. The results from the survey reported below do not match in terms of price—
farmers consistently reported average lower prices.
Many thousands of Indonesian households grow cloves, but it typically comprises
only a small proportion of their total economic activity. Though employment statis-
tics are scarce, perhaps because growing cloves is only a small part of these households’
economic activities, according to a recent report from the Indonesian Public Health Asso-
ciation (IAKMI, p. 67), the government reported that more than one million Indonesian
individuals were contributing labour to growing cloves in 2012. It is critical to note—a
dynamic supported strongly by the survey results presented in this report—that clove
production is a fraction of broader household production/resources of most clove-farm-
ing households. Furthermore, clove farming is by nature very rarely the source of full-
time employment for most of these individuals, since the labour involved in clove farm-
ing is intermittent and concentrated at specific times of the years, such as at harvest.
This report aims to inform the current debate over the taxation of kreteks in
Indonesia. As the Indonesian government considers reforming its excise tax structure
and rates, there have been concerns that these tax reforms could also affect the eco-
nomic lives of those in the kretek value chain. Clove farmers are part of this value chain.
Accordingly, in this report, we examine empirically the economic livelihoods of clove
farmers in Indonesia, largely by analyzing the results of a comprehensive, household-level
economically-focused survey of 600 clove farmers across the two largest clove-growing
12 // Introductionregions, Sulawesi and Central Java. The survey examines the role that clove farming plays
in these households’ economic lives, among other related topics. This report is part of the
Indonesia Tobacco Employment Studies implemented by the World Bank and the Amer-
ican Cancer Society. The findings from this report complements the findings from the
other reports which focused on other specific segments of the tobacco sector employ-
ment in Indonesia, more specifically tobacco farmers (World Bank 2017b), kretek workers
(World Bank 2017c) and tobacco manufacturing more broadly (World Bank, 2017d).
The report is structured as follows: the next section, section 2, presents a summary of
survey methods and the analysis undertaken. Then the following section, section 3,
presents the results of the analyses of the survey data. It begins with an examination of
the socio-demographic characteristics of the households. Next, it tracks the economic
situation of the households including their broad economic endeavors, costs of growing
cloves, prices of and incomes from cloves, credit and debt to grow cloves, and alterna-
tives to cloves. It also tracks household assets. The subsequent sections focus on specific
issues, such as farmers’ wellbeing, child labour, health and food security. The final sec-
tions, discusses limitations of the study and present conclusions, respectively.
13SMOKING HAS BEEN A MAJOR CONTRIBUTOR O DISEASE BURDEN INDONESIA. SMO PREVALENCE AMONG WORKIN AGE INDIVIDUAL HAS EXCEEDED 3 PERCENT SINCE 2 14 // Introduction
2
    METHODS
    The report utilizes a household-level survey of a nationally representative sample
    of clove-producing households. To examine the economic livelihoods of clove-farming
    households in Indonesia, we developed a survey instrument derived in large part from
    previous surveys used to evaluate the economic livelihoods of tobacco farmers in Africa
    and Southeast Asia, and the World Bank’s Living Standards Measurement Survey (see
    Chavez et al., 2016; Goma et al., 2015; Magati et al., 2016; Makoka et al., 2016; World Bank,
    2017). The survey was particularly focused on collecting data on household economic
    activity, including all sources of clove-farming revenue and production. At the same time,
    it queried respondents comprehensively on the costs of running both their agricultural
    and non-agricultural businesses, including both hired and household labor, to provide a
    complete snapshot of each household’s economic life.

    To implement the survey, we purposively selected the two top clove-producing
    provinces, North Sulawesi and Central Java, which typically account for more than
    70 percent of clove production. In each province, we selected the two highest-produc-
    ing kabupaten (districts). In each kabupaten, we randomly selected one top-producing
    kecamatan (subdistrict) and one second-tier producing kecamatan. Within each selected
    kecamatan, we chose the three highest-producing villages. In each selected village, we
    selected the sub-village with the largest number of farmers according to the village infor-
    mant. We went door to door to verify that the farmers listed were indeed current farmers.
    If we verified 50 farmers in the first sub-village, we stopped and used that list to draw our
    sample. If we could not find and verify 50 farmers, we went to the next sub-village to get
    the additional ones. From the sub-villages in which we could list 50 farmers, we randomly
    selected 25 to interview. A complete list of these districts and municipalities is available
    in the supplementary appendices available upon request. The report utilizes mainly thick,
    descriptive statistics of the survey results, but also utilizes causal analysis where appropri-
    ate, particularly for food security.

                                                                                                   15
SMOKING HAS BEEN A MAJOR CONTRIBUTOR O DISEASE BURDEN INDONESIA. SMO PREVA V LENCE AGE INDIVIDUAL HAS EXCEEDED 3 PERCENT SINCE 2 16 // Results
3
         RESULTS

O        3.1 - Socio-Demographic Characteristics of Clove Farmers
         Clover farmers’ households are typically headed by married males, usually older

N
         than average and with an elementary school education or less. In Table 1, we pres-
         ent the basic socio-demographic characteristics of the heads of the clove-farming house-
         holds—household heads were overwhelmingly male (95.5%) and married (88.2%). They
         tended to be older than the average population with 69% between 36 and 60 years of
         age (the average age in 2016 in Indonesia was 27), and another ~25% who were older

O
         than 60 years. The majority (~60%) had an elementary school education or less. More
         than two-thirds (69%) reported agriculture as their principal activity.

         Table 1: Socio-Demographic Characteristics of Clove Farmers

                                                    N = 600                        PERCENT

          GENDER
          Male                                                   573                   95.5

          Female                                                  27                   4.5

          AGE (YEARS)
          20-35                                                   33                   5.54

          36-60                                                  412                  69.13

          >60                                                     151                 25.34

          MARITAL STATUS
          Never married                                           12                   2.00

L
          Married                                                529                  88.17

          Divorced/separated                                      11                   1.83

          Widowed                                                 47                   7.83

          Living with partner                                      1                   0.17

3
          HOUSEHOLD SIZE BY AGE
          60                                                    233                   1.30

 2
                                                                                               17
The Economics of Clove Farming in Indonesia
Table 1: Socio-Demographic Characteristics of Clove Farmers (CONT.)
N = 600 PERCENT
EDUCATION
Not yet/no schooling 29 4.83
Elementary school 332 55.33
Public junior high 107 17.83
Senior high school 78 13.00
Vocational school 22 3.67
College or above 32 5.33
MAIN ACTIVITY
Agricultural work 414 69.00
Non-agricultural work 160 26.67
Home duties 4 0.67
Retired/aged 8 1.33
No work 14 2.33
Clove-farming households average four people. In Table 2, we present the size of
clove-farming households. The median household size was four, typically with two peo-
ple older than 36 years, one between 21 and 35, and then one who was younger than 21.
Households were as few as one and as large as 10.
Table 2: Household Size by Age Group
TOTAL GENDER AGE RANGE
F M 60
Median 4 2 2 1 1 2 0
Minimum 1 0 0 0 0 0 0
Maximum 10 7 6 5 4 4 3
3.2 - Household Assets
Most clove-farming households demonstrated some asset accumulation. For exam-
ple, as presented in Table 3, approximately 90% of households reported having a TV and/
or a mobile (cell) phone. More than three quarters of households owned at least one
motorcycle. Nearly half of households had a VCR/DVD player or similar device.
18 // ResultsTable 3: Household Assets
ITEM OWNERSHIP
TV 91.50%
DVD/VCD player/home theater/radio tape 44.17%
Satellite disk 31.67%
Electric oven/microwave 2.67%
Refrigerator 46.00%
Liquefied petroleum gas tube (≥3 kg) 86.67%
Washing machine 25.50%
AC (air conditioner) 0.67%
Telephone (landline) 0.33%
Mobile (cellular) phone 88.67%
Computer/laptop 16.83%
Tablet 8.17%
Video camera (handycam)/camera 3.83%
Water heater 11.33%
Electric pump/jet pump 11.17%
Generator 16.50%
Vehicle 14.00%
Boat/motorboat 3.67%
Motorcycle 76.83%
Many clove farmers reported other agricultural assets, particularly poultry and/or
small livestock. In Figure 3, we report on households’ livestock assets. Slightly more than
half of the clove-farming households reported owning chickens while nearly 40% indi-
cated owning small livestock such as goats and sheep. Only approximately 20% reported
owning large livestock such as buffalo, cows or horses, which is lower than for the general
agricultural population which is appoximately 40 percent according to the most recent
Indonesia Family Life Survey (IFLS, 2016).
19The Economics of Clove Farming in Indonesia
Figure 3: Livestock Assets
60% 56.50%
38.17%
40%
19.83%
20%
0%
Large livestock Small livestock Poultry
(cow, buffalo, horse, etc.) (goat, sheep, pigs, etc.) (chicken,ducks, geese, quail, etc.)
Most clove farmers reported a variety of non-livestock agricultural assets. In Table
4, we report clove farmers’ non-livestock agricultural assets. More than half (57%) of
farmers reported owning a cangkul (a “hoe” in English) used to loosen earth, among other
activities. More than one quarter of households reported owning a chopping machine
that can chop raw agricultural products. Roughly one quarter of households reported
owning a sabit (a “sickle” in English), which is a hand-held agricultural chopping imple-
ment. Very few households reported owning more expensive agricultural assets such as a
pump, a plough or a tractor.
Table 4: Non-Livestock Agricultural Assets
ITEM OWNERSHIP
Item Ownership
Wagon 6.33%
Plough 0.50%
Tractor 1.83%
Water pump for farming 1.33%
Chopper machine 28.17%
Cangkul 56.67%
Sabit 25.33%
20 // ResultsThe total size of land of clove-farming households owned and cultivated for cloves
varied within and across regions. As Figure 4 reports, the median size of the land plots
owned and cultivated was generally much greater in Sulawesi. In Bolaang Mongondo
and Minahasa, the median household owned 2 hectares. In Minahasa, they cultivated
most of it (on average about 1.75 ha). In Bolaang Mongondow, farmers on average cul-
tivated about three-quarters of their land. In Java, the median plot sizes were smaller, 1
hectare in Wonogiri and just over half of a hectare in Pemalang. In Pemalang, perhaps
due to the small plot size, all farmers reported cultivating all of their
cultivable land.
Figure 4: Total Land – Owned (hectares) & Under Cultivation
2.50
2.00 2.00
2.00
1.75
1.50
1.50
1.00
1.00
0.75
0.54 0.54
0.50
0.00
Bolaang Mongondow Minahasa Pemalang Wonogiri
Cultivated Owned
Most clove-farming households owned the land on which they are growing cloves.
As Figure 5 illustrates, households owned the vast majority, ~92%, of land parcels that
they used to cultivate their cloves. Only 1% of the parcels were rented to grow cloves,
while approximately 5% of the parcels were someone else’s land but the farmers reported
that they did not pay rent to grow cloves on the land.
21The Economics of Clove Farming in Indonesia
Figure 5: Land Ownership
1.06%
4.86% 1.00%
0.93%
92.15%
Granted by local leaders
Owned
Rented from others
Tenant (no rent)
Other
3.3 - Economic Livelihoods of Clove-Farming Households
Clove-farming households demonstrated a wide variety of principal economic
activity, but rarely actual clove farming. In terms of the reported main livelihoods of
household members (all, head and otherwise), there was considerable heterogeneity,
with no one category capturing more than 15% of the survey respondents. As Table 5
illustrates, agriculture was the largest represented sector. Clove farming comprised 15
percent of those respondents who answered the question, as did non-clove farming.
Clove farming is not the primary source of economic livelihood for most house-
holds that grow cloves. In the column on the farthest right, the table reports the
average daily income of individuals from the survey working in that sector and the aver-
age number of months worked in that sector in the previous 12 months. Individuals
reporting clove farming as the main source of livelihood averaged $7.93 per day in daily
income, which was slightly above the average of all survey respondents, $7.32. However,
on average, respondents worked fewer than four months at clove farming. Respondents
reporting non-clove agriculture as a main livelihood generated an average of $4.77 per
day from this activity. Importantly, many of these activities were not full time (perhaps
especially some agricultural activities), which must be considered, particularly when eval-
uating/comparing these values across sectors (for a version of Table 5 for all household
members, please see the online appendix).
22 // ResultsTable 5: Main Source of Livelihood
N PERCENT AVERAGE DAILY AVERAGE MONTHS
WAGE (IN USD) WORKED FOR LAST
12 MONTHS
Agriculture: clove 95 14.68 7.93 3.79
Agriculture: non-clove 97 14.99 4.77 4.00
Forestry; animal husband-
70 10.82 5.09 5.44
ry; fishing;
Mining and quarry 27 4.17 12.13 6.11
Electricity; gas; water
6 0.93 8.03 7.50
(utilities)
Construction/building 87 13.45 9.52 4.36
Transport; storage; com-
24 3.71 7.15 8.00
munications
Financial services; real
5 0.77 8.49 9.00
estate; lease
Restaurant; food sale 16 2.47 4.67 5.38
Industry: food processing/
4 0.62 3.49 6.25
production
Industry: clothing 6 0.93 5.10 7.50
Industry: other 9 1.39 13.49 5.89
Sales: nonfood 11 1.70 6.44 6.27
Service: government 60 9.27 7.05 10.30
Service: teacher 50 7.73 5.61 11.22
Service: professional 17 2.63 7.29 7.12
Service: transportation 5 0.77 7.27 6.80
Service: other 48 7.42 5.81 6.49
Other 10 1.55 3.64 7.10
Total 647 100 7.32 6.11
23The Economics of Clove Farming in Indonesia
Figure 6: Clove Farming Participation by Age and Gender
94.89% 94.96% 99.29% 95.59%
95.24%
100% 91.18%
88.00%
83.16%
80%
60%
40%
20%
0%
60
Male Female
Most members of clove-farming households participated in clove farming, though
it was usually a small proportion of their total economic activity. In Figure 6, we
report the percentage of all adult household members who indicated participating at
some point in the previous year in clove production. Across all age categories, participa-
tion rates in clove farming were very high. Thus, though only a small proportion reported
clove farming as a main activity, it was an activity for most individuals living in the sur-
veyed households.
Figure 7: Proportion of Total Household Resources from Clove Farming Income
40
34.56
30
Percent
20 17.7
9.85
10 8.347
6.01 5.175 5.008
4.174 4.841 4.341
0
0 .2 .4 .6 .8 1
Proportion of Clove Income in Total Household Resources
24 // ResultsMost clove-farming households are cultivating cloves as a secondary economic
pursuit. In Figure 7, we examine the proportion of total household resources generated
by farming cloves. The results demonstrate that more than half of these clove-farming
households generated less than 20% of their total household resources from clove farm-
ing. At the same time, less than a quarter of the clove-farming households in the survey
generated more than half of their overall resources from clove farming. The nature of
cloves as a relatively low-maintenance perennial plant reasonably lends itself to this
dynamic, though there are bursts of more labor-intensive activity during the year,
particularly at harvest and postharvest times.
Figure 8: Land Size Dedicated to Clove Cultivation by Hectare
64.01
60
40
Percent
23.79
20
7.098
1.37 1.059 .4981 .8095 .1868 .3736 .8095
0
0 5 10 15 20
Hectares of Land Cultivated
Most households—nearly two-thirds—reported cultivating less than one
quarter of a hectare of land to grow cloves. In Figure 8, we present the number
of hectares that the surveyed households dedicated to clove farming. There are two
caveats to this finding in that we observed that many farmers had difficulty assigning
the size of the land for clove trees because they were above the ground. Also, some
farmers reported using some of the land under the canopy of the clove trees for other
productive agricultural purposes (i.e., growing other crops).
Clove farmers reported growing a wide variety of crops, which varied by region.
The survey also asked about all the crops the households were cultivating across all grow-
ing seasons. In many districts, respondents reported three growing seasons. As reported
in Table 6, there was significant variation among regions. For example, in Pemalang and
Wonogiri, cassava was relatively widespread (46.7% and 44% respectively). In Pemalang,
56.7 percent of farmers reported growing bananas, and another 44.7 percent reported
cultivating bamboo or wood. In Wonogiri, 71.3% reported growing paddy (rice). In gen-
eral, clove-farming households in Bolaang Mongondow Timur and Minahasa reported
growing a smaller variety of crops beyond cloves.
25The Economics of Clove Farming in Indonesia
Table 6: Frequencies of Households by Crop Cultivation by Region—All Seasons
BOLAANG MINAHASA PEMALANG WONOGIRI TOTAL
MONGONDOW
Cassava 3 12 70 66 151
Sweet potato 0 7 22 9 38
Ground nut 1 1 1 3 6
Cashew/other
1 5 0 6
nut
Corn 7 25 37 23 92
Chili 26 19 37 1 83
Shallot 1 0 2 0 3
Coconut 30 36 15 6 87
Banana 31 33 85 13 162
Spices 11 15 36 91 153
Green vegetables 6 6 20 0 32
Other vegetables 1 3 13 5 22
Clove 150 150 150 150 600
Fruits 5 23 22 1 51
Paddy 1 7 55 107 170
Wood/bamboo 20 40 67 79 206
Tea/coffee/
51 1 47 6 105
chocolate
Other 0 1 9 16 26
26 // Results3.4 – Costs of Clove Cultivation
Mean and per kilogram nonlabour costs varied by region. In Tables 7 and 8, we exam-
ine mean and per kilogram nonlabour costs. The average costs varied among regions and
major categories of expenses (depreciation of equipment, inputs, interest, levies and land
rental). On average, households spent $231.76 on clove farming. Physical inputs (e.g.,
fertilizer, pesticides, equipment, etc.) were typically the largest cost both per kg, but also
varied, from 0.35/kg in Wongiri to $1.69/kg in Bolaang Mongondow. Rent was only a large
cost in Bolaang Mongondow ($3.37/kg). The other major cost in at least two regions was
interest on loans—$0.66/kg in Minahasa and $0.50 in Pemalang. We also calculated costs
per hectare but we found the calculations fundamentally problematic because farmers
have difficulty assigning a value to the size of the land dedicated to love farming.
Table 7: Mean Nonlabour Costs by Region in USD
DISTRICT DEPRECIATION INPUT INTEREST LEVIES RENT TOTAL
COST COST
Bolaang
18.27 95.08 118.89 4.15 337.41 237.37
Mongondow
Minahasa 10.28 198.11 220.40 6.46 4.50 428.49
Pemalang 6.76 55.17 73.62 0.54 269.92 131.78
Wonogiri 11.67 46.18 72.67 0.36 749.79 130.03
Total 11.74 99.28 121.39 2.88 340.41 231.76
Table 8: Per Kilogram Nonlabour by Region in USD
DISTRICT DEPRECIATION INPUT COST INTEREST LEVIES RENT TOTAL
COST
Bolaang
0.57 1.69 0.38 0.45 3.37 6.04
Mongondow
Minahasa 0.30 1.43 0.66 0.02 . 39.82
Pemalang 0.10 0.55 0.50 0.00 . 1.09
Wonogiri 0.25 0.35 0.27 0.00 . 1.35
Total 0.32 1.05 0.44 0.13 3.37 12.78
27The Economics of Clove Farming in Indonesia
Fertilizer, fuel and/or transportation were the most common costs associated with
clove farming. Table 9 reports in further detail on the physical (i.e., nonlabour) inputs that
clove farmers reported using. In total, the average per household dollar amount spent
on clove inputs was $99.21. Almost all (93%) farmers reported buying a sickle and nearly
two-thirds indicated purchasing bamboo sticks. Nearly 60% reported paying in some way
to transport their cloves to market. Most clove farmers bought fertilizers, both nonorganic
(56%) and organic (50%). Half of farmers purchased gasoline for vehicles and equipment
related to clove farming activities. The highest average cost of a widely-used input was
nonorganic fertilizer at $58.79. The average cost of equipment rental was higher ($85.13),
but only 12 percent of farmers reported such a cost.
Table 9: Clove Farming Principal Inputs and Corresponding Costs (annual)
INPUT PROPORTION OF FARMERS AVERAGE COST (USD)
WHO USED INPUT
Fertilizer nonorganic 56.17% 58.79
Fertilizer 49.83% 21.45
Pesticides (chemicals) 35.50% 13.31
Gasoline for clove farming
49.50% 47.48
equipment
Oil 25.00% 5.31
Firewood/fuel wood 4.17% .
Bamboo, bamboo sticks, rice
63.67% .
hay, descuke-ride
Knapsack sprayer 52.67% .
Drums 14.00% .
Sprinkler 18.83% 46.64
Rental of equipment/live-
12.00% 85.13
stock
Transportation (to market) 59.17% .
Water pump 2.50% .
Mattock, sickle 93.00% .
Others 47.00% 24.30
28 // ResultsMost clove farmers reported total nonlabour costs of less than $200. Figure 9 is a
graphical representation of the distribution of average costs related to clove farming by
region. Across all four regions, we can observe that most households report clove-related,
nonlabour input costs below $200 per year, which was comparable to the mean costs of
the tobacco farmers from the companion survey.
Figure 9: Distribution of Nonlabour Costs in USD
3,000
2,000
Non-labour Input
1,000
0
BMT MINAHASA PEMALANG WONOGIRI
Older household members were likelier to dedicate the most hours to clove
farming. The survey queried respondents about the number of hours of labour the
individuals in the survey dedicated to cultivating their cloves. On average, households
dedicated an average of 479 hours per year to clove cultivation. Figure 10 demonstrates
that male household members spend about 281 hours on average, with particularly older
men expending more hours, on clove farming. The less physically-intensive nature of this
work—mainly pruning, weeding, and watering compared to ploughing and other labo-
rious field preparation—may help to explain this finding. For example, men older than
60 years spent on average 332 hours, while those between 21 and 35 spent 195 hours.
Women spent fewer hours than men, on average about 170 hours, and with the same
pattern that older women dedicated more hours than younger women.
The total value of labour varied by age and sex with the labour of men older than
36 years demonstrating the highest value. In Figure 11, we report the average labour
costs of household members. We calculated the value of the labour by first establishing
the district-level agricultural minimum wage (Government of Indonesia, 2016), then con-
verted the number of total hours into the appropriate units (e.g., day, week, month, etc.)
and multiplied by the wage rate. The value of labour for men older than 60 was the
highest at approximately $260 for the year.
29The Economics of Clove Farming in Indonesia
Figure 10: Clove-Farming Household Labour Hours by Gender and Age
400
350 336.30
Hours Worked For Clove Farming
331.36
300
250
215.02
200 194.81 192.53
150 133.92
100.99
100
50 46.13
0
Age Group < 21 21–35 36 – 60 > 60
Male Female
Figure 11: Clove Farming Labour Cost by Gender and Age (in USD)
300
259.12 261.51
250
221.36
200 178.43
157.58
143.06
150 130.81
109.78
100 87.00
50 38.06
0
< 21 21–35 36–60 > 60 Total
Male Female
Most clove farmers hired some external seasonal workers, particularly for harvest.
The results presented in Figure 12 demonstrate that many clove-farming households
hired laborers to help with clove cultivation. It was particularly common for households
to hire help during the harvest season. Nearly 90 percent of households hired men to
work in this season, while nearly 19 percent hired women.
30 // ResultsFigure 12: Percentage of Households Hiring Men and/or Women to Cultivate Cloves
18.60%
100%
80%
Proportion of farmers
60% 4.58%
3.50%
0.27% 89.49%
40%
3.77% 1.62%
51.48%
20% 48.25% 12.40%
16.17% 0.54%
31.00%
0% 2.70%
Nursery Trans-planting Field tending Harvest Postharvest Selling/marketing
Adult male Adult female Child
The amount of hired labour varies widely across regions. Table 10 furnishes more
information about hired labour. The total number of hours varies by region with farmers
in Minahasa hiring for the most hours at 354. As illustrated in Table 11, farmers were more
likely to hire men. On average, a hired male laborer will work 135 hours at harvest time,
significantly more than the average hired woman (57 hours). Field tending is the next
most labor-intensive activity with hired men laborers averaging nearly 67 hours and hired
women laborers 98 hours. The postharvest hours for child labourers is a potential issue
and is explored in a later section of the report.
Table 10: Average Hours of Hired Labour per Household by Region
DISTRICT TOTAL LABOUR HOURS
Bolaang Mongondow 139.99
Minahasa 354.28
Pemalang 143.00
Wonogiri 69.07
Total 203.67
Table 11: Average Hours of Hired Labour by Gender
NURSERY TRANS- FIELD HARVEST POST- SELLING/
PLANTING TENDING HARVEST MARKETING
Adult male 13.81 25.45 66.61 135.73 46.78 4.30
Adult
13.14 22.62 98.29 57.12 44.07 2.00
female
Child 0.00 . . 44.25 80.83 .
Total 13.63 25.26 69.20 121.43 47.49 3.92
31The Economics of Clove Farming in Indonesia
3.5 - Clove Prices and Income
There is significant variation in the price of cloves depending on the variety and
grade. For example, Table 12 reports that white cloves earned the lowest prices with
Grade A White cloves earning on average $3.27/kg. In contrast, Sikotok and Zazibar Grade
A cloves earned nearly $6/kg. Notably, Sikotok Grades B and C cloves earn about the
same, while lower quality Zanzibar cloves earn significantly less. Note that none of these
prices matches the $7.19/kg estimate of the Indonesia Clove Farmers Association.
Table 12: Average Price per Kilogram by Grade and Type (USD)
TYPE
Grade White Sikotok Ambonese Zazibar
A 3.27 5.89 4.11 5.92
B 2.81 5.82 4.65 4.62
C 2.04 6.37 2.89
D 1.97 3.05
W 2.42 2.10 2.80 2.36
Total 2.91 5.43 3.87 5.30
There was wide variation in clove prices and income reported, both within and
across regions. The survey asked each household to report on average clove production,
price and income. As Table 13 suggests, average clove production varied considerably,
from 203.61 kg in Minahasa to 320.72 kg in Pemalang. The average price received by the
farmers depended on the type of clove and varied among regions. The cloves grown on
Sulawesi (Bolanng Mongondow and Minahasa) are typically of the Zanzibar variety and
fetched higher average prices—between $6.50/kg and $7/kg USD—than in Central Java
where farmers in Pemalang received an average price of $3.14/kg and those in Wongiri,
$1.96/kg. In Central Java, farmers grew both white clove and Zanzibar clove (and at least
a couple of other types, too). Partly because of price (and total cultivation per house-
hold), average income from cloves ranged widely among the districts from $439.13 in
Wonogiri to $2,575.72 in Minahasa. Another variable that affected price was whether the
farmer sold the clove bud dry or wet. Dry bud—more common in Sulawesi—typically
fetched a higher price.
32 // ResultsTable 13: Average Clove Production, Price and Income
DISTRICT QUANTITY OF AVERAGE PRICE REPORTED
CLOVE (KG) (USD) ANNUAL CLOVE
INCOME (USD)
Bolaang Mongondow 249.56 6.52 1,665.54
Minahasa 203.61 6.73 2,575.72
Pemalang 320.72 3.14 778.44
Wonogiri 254.10 1.96 439.13
All 251.02 4.69 1,364.71
Profits from clove cultivation varied widely by district. In Figure 13, we examine the profits
per kilogram by region. The red bars indicate profits in terms of “perceived” profits or what
most agricultural economists would term “gross margins,” which is the gross revenues from sell-
ing cloves less the direct costs incurred to grow them including physical inputs (e.g., fertilizer
and pesticide), hired labour, marketing expenses and transportation. The blue bars represent
what we term “realized profits” because they assign a value to the household labor dedicated
to clove cultivation. We determine this value using the regional agricultural minimum wage.
Overall, we observe that the average profit per kg using the gross margin method was $4.84.
This was driven in large part by the high prices paid to clove farmers in Bolaang Mongondow
where the gross margin was $12.34/kg. The lowest gross margin was in Minahasa where it
was $0.26/kg. In the blue columns, we incorporate the value of labour in the cost calculations.
Overall, we find that average realized profits from cultivating cloves were negative for the sur-
veyed households at –2.24/kg. We find that Pemalang is the most profitable at $1.45/kg, while
Bolaang Mongondow is the least profitable at –$2.72. Considering this district’s higher average
prices, labour costs for clove cultivation are clearly very high in this area.
Figure 13: Profits per Kilogram—Real and Perceived—by Region
PER KILOGRAM PROFIT
15
12.34
10
4.69 4.84
5 0.26
1.45 1.67
US $
0.27
0
-2.24
-5
-2.72
-7.11
-10
Bolaang Minahasa Pemalang Wonogiri Total
Mongondow
Real Profit Perceived Profit
33The Economics of Clove Farming in Indonesia
3.6 - Credit and Debt
Less than one-third of clove farmers sought credit to cultivate cloves. In Figure 14,
we report the number of survey respondents who were seeking credit—ostensibly—to
grow cloves. We find that the proportion never exceeds one-third and drops as low as
22.7% in Wonogiri. It appears that clove farming is not an economic activity that farmers
commonly seek credit to pursue.
Figure 14: Demand for Credit by Region
40%
32.00%
30.00%
30% 28.67%
22.67%
20%
10%
0%
Bolaang Mongondow Minahasa Pemalang Wonogiri
Clove farmers typically reported seeking credit for broader business and house-
hold reasons than to support clove production directly. Figure 15 illustrates why
some of the clove farmers are borrowing money and suggests that many of the reasons
that they borrow do not pertain to actual clove farming. The most common explanation
for borrowing money was a rather general explanation of “investing” in their clove-farming
business (21.3%). But, the two next most common explanations were not farming-re-
lated: to pay for school fees (11.3%) or to purchase a vehicle (11.3%). These findings are
similar to patterns with tobacco farmers in the Philippine (Briones, 2013; Chavez et al.,
2016) and Sub-Saharan Africa (Goma et al., 2015; Magati et al., 2016; Makoka et al., 2016).
Notably, only five percent mentioned that they wanted to borrow to pay for the inputs to
cultivate cloves.
34 // ResultsFigure 15: Why Farmers Borrow
PRIMARY USE OF LOAN
5.17%
5.47%
3.95%
29.18% 0.91%
Inputs for Clove Farming
Land for Farming Other Crop
11.25%
Purchase vehicle
Other; specify
3.04% Land for Clove Farming
Schooling
8.51% Investing in business
11.25% Inputs for Farming Other Crop
Purchasing house
21.28%
Special Occasions (wedding,etc.)
Clove farmers most typically borrowed from commercial banks or microfinance
institutions. In Figure 16, we examine the sources of clove farmers’ loans. The most
common source of credit was commercial
4.86% banks (28.5%). The next most common source
of credit was microfinance institutions (21%). The third most common source of credit
was from relatives (16.7%). In a related dynamic, we found that 33 households were
under contract to sell their cloves to a buyer. In seven of those cases, the buyer had pro-
vided them with inputs such as fertilizer, which was then deducted from the sales to that
buyer; notably, none of these farmers reported this as a loan even though it effectively
was because, on average, they paid above market prices for these inputs.
Figure 16: Who Clove Farmers Owe
10.64% Relatives
16.72%
2.43% Neighbors (not a farmer)
Fellow farmer
4.26% Farmers organization
1.52% BMT
1.82%
2.43% Local money lender
28.57%
Microfinance institution
7.29%
Rural bank
Commercial bank
Government
3.34% 20.97%
Other
4.86% 35The Economics of Clove Farming in Indonesia
3.7 – Household Economic Situation
We generate and compare per household median and mean resources and
incomes of clove-farming households. As presented in Figure 17, we calculated each
household’s total resources, which includes all revenues and other production (e.g., food
cultivated and consumed), and generated a per household measure. Similarly, we calcu-
lated household income, which was resources less all expenses incurred by the house-
hold to produce the goods/services (either sold or consumed).
PER CAPITA HOUSEHOLD RESOURCE/INCOME
Figure 17: Per Capita Resources and Incomes of Clove-Farming Households
Annual median per capita income 432.54
Annual mean per capita income 1288.68
Annual median per capita resource 711.45
Annual mean per capita resource 1802.24
0 500 1,000 1,500 2,000
2016 US$
Poverty among clove-farming households is widespread. In Indonesia, generally,
8.3% of households fall below the World Bank poverty rate of $1.90/day (PPP), while 11.1%
fall under the Indonesian government’s poverty line of ~$22.60 USD per month. In Figure
18, we illustrate the proportion of clove-farming households that fall below these pov-
erty lines. Using the measure of household total resources, which does not incorporate
any agricultural or other business costs, the poverty rate for clove-farming households is
16.5% at the World Bank threshold and 21.83% at the Indonesian government threshold.
When we use the more realistic measure of household total income, which subtracts all of
the expenses incurred to farm or to run other household businesses from total resources,
the poverty rate of clove-farming households increases to 34.17% at the World Bank line
and 37% at the official government line.
36 // ResultsFigure 18: Poverty Status of Clove-Farming Households
POVERTY STATUS
38.05%
Poverty at National Poverty Line 330,776
Rupiah a month per person
23.91%
35.29%
Poverty at $1.90 a day per person,
PPP 2011 18.77%
0% 10% 20% 30% 40%
Headcount ratio measured by per capita income Headcount ratio measured by per capita resources
Farmers provide a variety of explanations for choosing clove farming. The chal-
lenging economic situations described above reasonably beg the question: why do clove
farmers choose to cultivate this crop? As Figure 19 shows, the most common reason—
given by just over a quarter of survey respondents—is that clove farming is lucrative. The
results above from Bolaang Mongondow support this perspective. About 20% of respon-
dents indicated that it was the only viable cash crop while another 20% reported that it
had more to do with the availability of land to cultivate cloves. In order to determine how
accurate their perception was, we cross-referenced perception and reality and those who
identified clove farming as lucrative (either as a primary or “ever mentioned” reason) were
not any more profitable (either per kilogram or per hectare) on average than those who
did not identify it as lucrative. One weakness is individuals may define lucrative differently.
Figure 19: Reasons for Engaging in Clove Farming
4.71%
12.08% Existence of ready market
It was the only viable cash crop
25.73%
Inherited it from parents
19.59%
Availability of land
0.20%
Influence by other clove
producers
It was a highly lucrative
17.82% enterprise
19.86%
37The Economics of Clove Farming in Indonesia
3.8 - Alternative Livelihood Options
Most clove farmers were not considering alternatives to clove farming. As Figure 20
illustrates, nearly 70 percent of clove farmers were not considering switching. Less than
20 percent of farmers indicated being serious or very serious about switching to an alter-
native livelihood.
Figure 20: Percentage of Clove Farmers Considering Alternatives
No, not at all 69.67
Not so serious - thought about it 11.67
Serious - researched other options 16.17
Very Serious - Already planning to switch 2.5
0 10 20 30 40 50 60 70 80
We also used logistic regression to examine which farmers were willing to try alter-
natives to clove farming. The survey inquired about the possibility of farmers switching
from clove cultivation to another crop. Some farmers indicated a willingness to switch, a
process that has been happening involuntarily in some parts of the country due to chal-
lenges with clove disease and insect infestations (Rachman, 2016). In Table 14 we present
the results from a logistic regression. The dependent variable is dichotomous with a “1”
value representing those who are actively switching their clove crops to some extent
already or have thought recently about switching. We used the previous literature on
switching from tobacco growing as a starting point (e.g., Chavez et al., 2016; Goma et al.,
2015; Magati et al., 2016; Makoka et al., 2016), and then used machine-learning methods
and stepwise regression to further identify relevant independent variables from the
survey results.
Farmers who farm fewer cloves or who have larger agricultural enterprises were
the most willing to switch away from cloves. We report only the statistically signifi-
cant coefficients in the table, though all the foundational analyses are available in our
online appendices. We found that clove farmers who cultivated smaller amounts of land
for cloves are more likely to be willing to switch from cloves to another crop. Farmers
who cultivate more land in general are also more likely to be willing to switch – perhaps
because they have flexibility to hedge each season and grow different crops and/or they
38 // ResultsTable 14: Logistic Regression of Willingness to Switch
VARIABLES COMPLETE CASE IMPUTED MISSING
–2.520**
Hectares of land for clove farming (1.029)
2.655***
Hectares of land cultivated (0.627)
0.0774*
Nonlabour income ($100) (0.0431)
0.218* 0.0832***
Non-clove crop sales ($100) –0.114 (0.0247)
–0.0739***
Clove sales ($100) (0.0229)
0.424**
Depreciation ($100) (0.171)
0.0922***
Hired labour cost for clove ($100) (0.0262)
0.725*** 0.282***
Input cost for clove ($100) (0.255) (0.109)
–3.610*** –0.954***
Cost of interest ($100) (1.021) (0.230)
Hired labour cost for non-clove –0.239***
crops ($100) (0.0752)
Nonagricultural household enterprises 0.00585* 0.00516***
income ($100) (0.00301) (0.00133)
nonagricultural household enterprises –0.101** –0.0850***
cost ($100) (0.0488) (0.0260)
Observations 254 600
Standard errors in parentheses
*** pSMOKING HAS BEEN A MAJOR CONTRIBUTOR O DISEASE BURDEN INDONESIA. SMO PREVALENCE AMONG WORKIN AGE INDIVIDUAL HAS EXCEEDED 3 PERCENT SINCE 2 40 // Introduction
4
    HOUSEHOLD WELL-BEING

    4.1 — Asset to Social Safety Nets
    Nearly half of clove farming households in the survey received a social assistance
    benefit. In Table 15, we examine the proportion of households receiving social protec-
    tion. We observe first that the total percentage of the surveyed households that received
    benefits either under a Social Security Card (KPS) or a Family Welfare Card (KKS) was just
    under 15 percent. In terms of a cash assistance/transfer, 3.7 percent of the total surveyed
    households received this benefit and had a KPS/KKS card. Another 1 percent of the
    surveyed households received this benefit but did not have the card. The largest benefit
    received by these farmers was through the rice for the poor program: 11.7 percent of
    surveyed households were receiving the rice benefit and had a KPS/KKS, while another
    31.7 percent of households were receiving the benefit and did not have a card. Rates of
    receiving the other two major benefits—health and education assistance—were fairly
    similar to the cash assistance rates. These rates were below national averages—nearly a
    quarter of Indonesians are eligible for KKS and nearly 70 percent of households receive
    “rice for the poor” benefits.

    Enrollments in government health programs were higher among clove farmers
    than in the general population. As shown in Table 16, approximately 16 percent of
    individuals in clove-farming households were beneficiaries of KIS while approximately 13
    percent benefits from BPJS. Enrollment in each program nationwide is about 10 percent.

                                                                                                 41
The Economics of Clove Farming in Indonesia
Table 15: KPS and KKS Participation
INDICATORS STATUS OF CLOVE FARMERS’
HOUSEHOLDS
Percentage of households who have KPS/KKS 14.67%
BENEFIT 1: PERCENTAGE OF HOUSEHOLDS WHO RECEIVED CASH ASSISTANCE/
TRANSFER IN LAST YEAR
With KPS/KKS 3.67%
Not with KPS/KKS 1.00%
BENEFIT 2: PERCENTAGE OF HOUSEHOLDS WHO RECEIVED RICE FOR THE POOR
(RASKIN) IN LAST YEAR
With KPS/KKS 11.67%
Not with KPS/KKS 31.67%
BENEFIT 3: PERCENTAGE OF HOUSEHOLDS WHO RECEIVED ASSISTANCE FOR
HEALTH PAYMENT IN LAST YEAR
With KPS/KKS 2.50%
Not with KPS/KKS 3.00%
BENEFIT 4: PERCENTAGE OF HOUSEHOLDS WHO RECEIVED ASSISTANCE FOR POOR
STUDENT IN LAST YEAR
With KPS/KKS 3.33%
Not with KPS/KKS 2.83%
OVERALL PERCENTAGE OF HOUSEHOLDS WHO RECEIVED ASSISTANCE FROM KPS/
KKS OR OTHER SOURCES IN LAST YEAR
One benefit 36.67%
Two benefits 8.50%
Three benefits 2.00%
Total 47.17%
42 // Household Well-BeingTable 16: Participation in Indonesia Health Card (KIS) and National Health Insurance
System (BPJS)
INDICATORS STATUS OF CLOVE FARMERS’
HOUSEHOLDS
PERCENTAGE OF HOUSEHOLDS WHO HAVE KIS/BPJS-PBI
KIS 16.17%
BPJS-PBI 13.17%
Both KIS and BPJS-KIS 0.67%
None 71.33%
Percentage of households who have KIS and used it
0.53%
in last year
PERCENTAGE OF HOUSEHOLDS WITH VOLUNTARY BPJS (BPJS SUKARELA/JKN)
Plus KIS 0.67%
Plus BPJS-PBI 1.33%
Plus both KIS and BPJS-PBI 0.00%
Only voluntary BPJS 16.83%
None 81.17%
PERCENTAGE OF HOUSEHOLDS WHO HAVE
VOLUNTARY BPJS AND USED IT IN LAST 16.83%
YEAR AVERAGE NUMBER OF HOUSEHOLD
MEMBERS WHO OWN
KIS 2.78
BPJS-PBI 2.75
Voluntary BPJS 2.77
43The Economics of Clove Farming in Indonesia
Figure 21: Access to Sufficient Food
Always has sufficient food 34.5
Usually has sufficient food 53.5
Usually lacks sufficient food 10.33
Always lacks sufficient food 1.67
0 10 20 30 40 50 60
Percentage
4.2 – Food Security
Most clove farmers report “usually” or always having access to sufficient food.
Food security, as presented in Figure 21, is an important well-being–related issue among
some farmers in Indonesia (e.g., Hanie and Tsegai, 2016) and among tobacco farmers in
many parts of the world (Eriksen et al., 2015). Approximately 12 percent of individuals
from clove-farming households reported serious food insecurity, which was comparable
to what we found in the companion survey in several tobacco-growing regions though
considerably less than in Lombok where food security was a serious challenge for many
tobacco farmers.
Less than one-third of clove-farming households grew their own food. Among the survey
respondents, 32 percent reported producing their own food. The survey asked house-
holds for how many months the cultivated food fed the household (see Table 17).
Thirty percent reported that they grew enough for the entire year. Importantly, this does
not necessarily equate to a lack of food security. In many cases in the FGDs, farmers
reported growing other cash crops and using the monetary proceeds of the cultivation
to buy food in the marketplace. This dynamic was similar to what others found in recent
surveys of tobacco farmers (e.g., Chavez et al., 2016; Goma et al., 2015; Magati et al., 2016;
Makoka et al., 2016).
44 // Household Well-BeingYou can also read