CITY OF MCMINNVILLE HOUSING NEEDS ANALYSIS - DRAFT REPORT - MCMINNVILLE OREGON
←
→
Page content transcription
If your browser does not render page correctly, please read the page content below
PAC MEETING #3, EXHIBIT #6

City of McMinnville
Housing Needs Analysis
                    November 2018

                           Prepared for:

                  City of McMinnville

                     Draft REPORT

                              KOIN Center
                   222 SW Columbia Street
                                Suite 1600
                       Portland, OR 97201
                            503.222.6060
This page intentionally blank

ECONorthwest   McMinnville Housing Needs Analysis   ii
This page intentionally blank

ECONorthwest   McMinnville Housing Needs Analysis   iii
Table of Contents
1. INTRODUCTION                                                           6
BACKGROUND                                                                6
FRAMEWORK FOR A HOUSING NEEDS ANALYSIS                                    7
ORGANIZATION OF THIS REPORT                                               9

2. RESIDENTIAL BUILDABLE LANDS INVENTORY                                 10
DEFINITIONS                                                              10
DEVELOPMENT CONSTRAINTS                                                  10
BUILDABLE LANDS INVENTORY RESULTS                                        10
REDEVELOPMENT POTENTIAL                                                  10

3. HISTORICAL AND RECENT DEVELOPMENT TRENDS                              11
DATA USED IN THIS ANALYSIS                                               12
TRENDS IN HOUSING MIX                                                    13
TRENDS IN TENURE                                                         16
VACANCY RATES                                                            18
SHORT-TERM RENTALS AND SEASONAL HOUSING                                  19
GOVERNMENT-ASSISTED HOUSING PROJECTS                                     21
MANUFACTURED HOMES                                                       22

4. DEMOGRAPHIC AND OTHER FACTORS AFFECTING RESIDENTIAL DEVELOPMENT
IN MCMINNVILLE                                                  23
DEMOGRAPHIC AND SOCIOECONOMIC FACTORS AFFECTING HOUSING CHOICE           24
REGIONAL AND LOCAL TRENDS AFFECTING AFFORDABILITY IN MCMINNVILLE         47
SUMMARY OF THE FACTORS AFFECTING MCMINNVILLE’S HOUSING NEEDS             55

ECONorthwest                        McMinnville Housing Needs Analysis        iv
This page intentionally blank

ECONorthwest   McMinnville Housing Needs Analysis   v
1. Introduction
This report presents a Housing Needs Analysis (HNA) for the City of McMinnville. It is
intended to comply with statewide planning policies that govern planning for housing and
residential development, including Goal 10 (Housing), and OAR 660 Division 8. The methods
used for this study generally follow the Planning for Residential Growth guidebook, published by
the Oregon Transportation and Growth Management Program (1996).

Consistent with Statewide Planning Goal 10, the HNA documents McMinnville’s housing needs
for the 20-year period from 2021 through 20411 It is more comprehensive than the state requires,
looking at housing needs for a 5, 10, 20, and 50-year period. The shorter-term analyses are
intended to identify immediate land need deficiencies, and the 50-year analysis can provide a
basis for the establishment of Urban Reserve Areas (URAs).

Background
The City of McMinnville initially adopted a UGB in January 1981, intended to meet needs for a
20-year period from 1980-2000. The City of McMinnville last initiated a Housing Needs
Analysis in 2000 for a planning period of 2000-2020 as part of a comprehensive review of its 20-
year needs.
In 2007-2008, the City submitted a UGB amendment to DLCD for inclusion of 1,188 gross acres
resulting in a total inclusion request of 890 buildable acres (of which 537 buildable acres were
designated to meet identified housing needs) in addition to adoption of a number of land use
efficiency measures.
This UGB amendment was subsequently appealed on a number of issues inclusive of a lack of
including additional exception areas in the expansion proposal, lack of utilization of more
floodplain land for public park use, a claim that while cost of service estimates for some
exception areas was demonstrably higher than others their non-inclusion was unwarranted, the
City’s decision to not designate residential land near the sewage treatment plant, steel mill and
other industrial uses was unwarranted, distance from supportive public services relative to
pedestrian accessibility was not sufficient to meet ORS 197.298(1) as is the evaluation of cost-
effectiveness of public facilities, increased cost of residential development higher up into the
west hills is not sufficient to non-inclusion of higher elevation steeply sloped land.
Final action on the appeal was a Court of Appeals remand in July 2011 approving inclusion of
only 216.8 buildable acres of exception only land in the UGB, meeting a portion of the identified
housing need, with the other 320.2 acres of identified buildable residential need remaining
unmet. The city has approved some plan amendments and rezones since then that time from

1ORS 197.296(2) requires cities to “demonstrate that its comprehensive plan or regional framework plan provides
sufficient buildable lands within the urban growth boundary established pursuant to statewide planning goals to
accommodate estimated housing needs for 20 years. The 20-year period shall commence on the date initially
scheduled for completion of the periodic or legislative review.” McMinnville anticipates adopting the Housing Needs
Analysis no earlier than 2020. As a result, this report presents housing needs for the 2020 to 2040 period.

ECONorthwest              McMinnville Buildable Land Inventory and Housing Needs Analysis                        6
lower to higher density residential designations. Other than some smaller non-residential to
residential plan amendments and zone changes, no additional land has been added to the
residential plan designation since land was added in 2007-2008.
Moreover, annexation of residentially designated land within the unincorporated UGB has been
subject to voter approval since an initiative passed in May 1996 until the practice was
overturned statewide. Annexations of land in McMinnville during that twenty-year timeframe
total 468.4 acres with at least 189.9 of those acres designated for uses other than housing.
The city has changed considerably since then. Since 2000, McMinnville added nearly 15,800
residents, accounting for 40% of Yamhill County’s growth over that period. Over the same
period, McMinnville added about 2,950 new dwelling units. McMinnville’s population has
grown a little older on average and has become slightly more ethnically diverse since 2000,
consistent with statewide trends.
This report provides McMinnville with a factual basis to update the Housing Element of the
City’s Comprehensive Plan, zoning code, and to support future planning efforts related to
housing and options for addressing unmet housing needs in McMinnville. It provides
information that will inform future planning efforts, including a review of the McMinnville
UGB and establishment of URAs. It provides the City with information about the housing
market in McMinnville and describes the factors that will affect future housing demand and
need in McMinnville, such as changing demographics and housing preferences. This analysis
will help decision makers understand whether McMinnville has enough land to accommodate
growth over the next 5, 10, 20, and 50 years.

Framework for a Housing Needs Analysis
Economists view housing as a bundle of services for which people are willing to pay: shelter
certainly, but also proximity to other attractions (job, shopping, recreation), amenities (type and
quality of fixtures and appliances, landscaping, views), prestige, and access to public services
(quality of schools). Because it is impossible to maximize all these services and simultaneously
minimize costs, households must, and do, make tradeoffs. What they can get for their money is
influenced both by economic forces and government policy. Moreover, different households
will value what they can get differently. They will have different preferences, which in turn are
a function of many factors like income, age of household head, number of people and children
in the household, number of workers and job locations, number of automobiles, and so on.

Thus, housing choices of individual households are influenced in complex ways by dozens of
factors and the housing market in Yamhill County, and McMinnville are the result of the
individual decisions of hundreds of thousands of households. These points help to underscore
the complexity of projecting what types of housing will be built in McMinnville between 2020
and 2040.

The complex nature of the housing market was demonstrated by the unprecedented boom and
bust during the past decade. This complexity does not eliminate the need for some type of
forecast of future housing demand and need, with the resulting implications for land demand
and consumption. Such forecasts are inherently uncertain. Their usefulness for public policy

ECONorthwest           McMinnville Buildable Land Inventory and Housing Needs Analysis            7
often derives more from the explanation of their underlying assumptions about the dynamics of
markets and policies than from the specific estimates of future demand and need. Thus, we start
our housing analysis with a framework for thinking about housing and residential markets, and
how public policy affects those markets.

Statewide planning Goal 10
The passage of the Oregon Land Use Planning Act of 1974 (ORS Chapter 197) established the
Land Conservation and Development Commission (LCDC) and the Department of Land
Conservation and Development (DLCD). The Act required the Commission to develop and
adopt a set of statewide planning goals. Goal 10 addresses housing in Oregon and provides
guidelines for local governments to follow in developing their local comprehensive land use
plans and implementing policies.

At a minimum, local housing policies must meet the requirements of Goal 10 and the statutes
and administrative rules that implement it (ORS 197.295 to 197.314, ORS 197.475 to 197.490, and
OAR 600-008).2 McMinnville is also subject to the requirements of ORS 197.296. Goal 10 requires
incorporated cities to complete an inventory of buildable residential lands and to encourage the
availability of adequate numbers of housing units in price and rent ranges commensurate with
the financial capabilities of its households.

Goal 10 defines needed housing types as “housing types determined to meet the need shown
for housing within an urban growth boundary at particular price ranges and rent levels.” ORS
197.303 defines needed housing types:
       (a) Housing that includes, but is not limited to, attached and detached single-family housing
           and multiple family housing for both owner and renter occupancy;
       (b) Government assisted housing;3
       (c) Mobile home or manufactured dwelling parks as provided in ORS 197.475 to 197.490;
           and
       (d) Manufactured homes on individual lots planned and zoned for single-family residential
           use that are in addition to lots within designated manufactured dwelling subdivisions.

DLCD provides guidance on conducting a housing needs analysis in the document Planning for
Residential Growth: A Workbook for Oregon’s Urban Areas, referred to as the Workbook. In
addition, cities with a population of 25,000 or more (including McMinnville) are required to
comply with ORS 197.296 and must conduct an analysis of housing need by housing type and
density range to determine the number of needed dwelling units and amount of land needed
for each needed housing type in the next 20-years (ORS 197.296(3)(b)).

McMinnville must identify needs for all of the housing types listed above as well as adopt
policies that increase the likelihood that needed housing types will be developed. This housing

2   ORS 197.296 only applies to cities with populations over 25,000.
3   Government assisted housing can be any housing type listed in ORS 197.303 (a), (c), or (d).

ECONorthwest                  McMinnville Buildable Land Inventory and Housing Needs Analysis      8
needs analysis was developed to meet the requirements of Goal 10 and its implementing
administrative rules and statutes. This report references relevant state guidance in relation to
various elements of the HNA.
Organization of this Report
The rest of this document is organized as follows:
Chapter 2. Residential Buildable Lands Inventory presents the methodology and results
of McMinnville’s inventory of residential land.
Chapter 3. Historical and Recent Development Trends summarizes the state, regional,
and local housing market trends affecting McMinnville’s housing market.
Chapter 4. Demographic and Other Factors Affecting Residential Development in
McMinnville presents factors that affect housing need in McMinnville, focusing on the
key determinants of housing need: age, income, and household composition. This chapter
also describes housing affordability in McMinnville relative to the larger region.
Chapter 5. Housing Need in McMinnville presents the forecast for housing growth in
McMinnville, describing housing need by density ranges and income levels.
Chapter 6. Residential Land Sufficiency within McMinnville estimates McMinnville’s
residential land sufficiency needed to accommodate expected growth over the planning
period.
Appendix A. Residential Buildable Lands Inventory provides details on the process and
methods for conducting the analysis as well as findings.
We’ll include more appendices as needed.
ECONorthwest McMinnville Buildable Land Inventory and Housing Needs Analysis 92. Residential Buildable Lands Inventory
This chapter summarizes the residential buildable lands inventory (BLI) for the McMinnville
UGB. The buildable lands inventory analysis (BLI) complies with statewide planning Goal 10,
ORS 197.296(4), and OAR 660-008. A detailed discussion of methods and additional results is
presented in Appendix A.
First, the analysis established the residential land base (parcels or portion of parcels with
appropriate zoning), classified parcels by buildable status, identified/deducted environmental
constraints, and lastly summarized total buildable area by Plan Designation.
City: We’ll submit the draft under a separate cover.
Definitions
Development constraints
Buildable Lands Inventory Results
Land Base
Vacant Buildable Land
Redevelopment Potential
ECONorthwest McMinnville Buildable Land Inventory and Housing Needs Analysis 103. Historical and Recent Development
Trends
Analysis of historical development trends in McMinnville provides insight into the functioning
of the local housing market. Moreover, it is required by ORS 197.296(5)(a). The mix of housing
types and densities, in particular, are key variables in forecasting future land need. The specific
steps are described in Task 2 of the DLCD Planning for Residential Lands Workbook as:
1. Determine the time period for which the data will be analyzed
2. Identify types of housing to address (all needed housing types)
3. Evaluate permit/subdivision data to calculate the actual mix, average actual gross
density, and average actual net density of all housing types
ORS 197.296 requires the analysis of housing mix and density to include the past five years or
since the most recent periodic review, whichever time period is greater.4 The City’s last periodic
review ended in 1999. As a result, this HNA examines changes in McMinnville’s housing
market from January 2000 to December 2017 for information about housing mix and density.
For other information about McMinnville’s housing market, we present information for 2000
through 2016 from the U.S. Census, as that is the most recently available data. We selected this
time period both because it complies with ORS 197.296 and because it provides information
about McMinnville’s housing market before and after the national housing market bubble’s
growth and deflation. In addition, data about McMinnville’s housing market during this period
is readily available from sources such as the Census and the City building permit database.
This chapter presents information about residential development by housing type. There are
multiple ways that housing types can be grouped. For example, they can be grouped by:
1. Structure type (e.g., single-family detached, apartments, etc.)
2. Tenure (e.g., distinguishing unit type by owner or renter units)
3. Housing affordability (e.g., units affordable at given income levels)
4. Some combination of these categories
For the purposes of this study, we grouped housing types based on: (1) whether the structure is
stand-alone or attached to another structure and (2) the number of dwelling units in each
structure. The housing types used in this analysis are:
Single-family detached includes single-family detached units, manufactured homes on
lots and in mobile home parks, and accessory dwelling units.
4 Specifically, ORS 197.296(5) (b) states: “A local government shall make the determination described in paragraph
(a) of this subsection using a shorter time period than the time period described in paragraph (a) of this subsection if
the local government finds that the shorter time period will provide more accurate and reliable data related to
housing capacity and need. The shorter time period may not be less than three years.”
ECONorthwest McMinnville Buildable Land Inventory and Housing Needs Analysis 11 Single-family attached is all structures with a common wall where each dwelling unit
occupies a separate lot, such as row houses or townhouses.
Multifamily is all attached structures (e.g., duplexes, tri-plexes, quad-plexes, and
structures with five or more units) other than single-family detached units,
manufactured units, or single-family attached units.
Data Used in this Analysis
Throughout this analysis, we use data from multiple sources, choosing data from well-
recognized and reliable data sources. One of the key sources for data about housing and
household data is the U.S. Census. This report primarily uses data from two Census sources:
The Decennial Census, which is completed every ten years and is a survey of all
households in the U.S. The Decennial Census is considered the best available data for
information such as demographics (e.g., number of people, age distribution, or ethnic or
racial composition), household characteristics (e.g., household size and composition),
and housing occupancy characteristics. As of the 2010 Decennial Census, it does not
collect more detailed household information, such as income, housing costs, housing
characteristics, and other important household information. Decennial Census data is
available for 2000 and 2010.
The American Community Survey (ACS), which is completed every year and is a
sample of households in the U.S. From 2012 through 2016, the ACS sampled an average
of 3.5 million households per year, or about 2.6% of the households in the nation. The
ACS collects detailed information about households, such as: demographics (e.g.,
number of people, age distribution, ethnic or racial composition, country of origin,
language spoken at home, and educational attainment), household characteristics (e.g.,
household size and composition), housing characteristics (e.g., type of housing unit, year
unit built, or number of bedrooms), housing costs (e.g., rent, mortgage, utility, and
insurance), housing value, income, and other characteristics.
In general, this report uses data from the 2012-2016 ACS for McMinnville. Where information is
available, we report information from the 2000 and 2010 Decennial Census.
The foundation of the housing needs analysis is the population forecast for McMinnville from
the Oregon Population Forecast Program by the Portland State University Population Research
Center.
ECONorthwest McMinnville Buildable Land Inventory and Housing Needs Analysis 12Trends in Housing Mix
This section provides an overview of changes in the mix of housing types in McMinnville and
compares McMinnville to selected cities, Yamhill County, and Oregon. These trends
demonstrate the types of housing developed in McMinnville historically. Unless otherwise
noted, this chapter uses data from the 2000 and 2010 Decennial Census and the 2012-2016
American Community Survey 5-Year Estimates.
This section shows the following trends in housing mix in McMinnville:
Since 2000, McMinnville’s total housing stock was predominantly single-family
detached housing units. As of the 2012-2016 period, 66% of McMinnville’s housing
stock was single-family detached, 26% was multifamily, and 8% was single-family
attached (e.g., townhouses). McMinnville has a proportionally smaller share of single-
family housing compared to Yamhill County (78%) and the state (72%).
McMinnville’s total housing stock grew by about 30% between 2000 and the 2012-2016
period. McMinnville added 2,946 new dwelling units to their housing stock (see Exhibit
1).
Based on building permits issued in McMinnville, single-family detached housing
accounted for the majority of new housing growth between 2000 and 2017. Fifty-seven
percent of new housing permitted between 2000 and 2017 was single-family detached
housing.
Housing Mix
The total number of Exhibit 1. Total Dwelling Units, McMinnville, 2000 and 2012-16
Source: Census Bureau, 2000 Decennial Census, SF3 Table and 2012-2016 ACS Table
dwelling units in B25024.
McMinnville increased by
2,946 units from 2000 to
2016 (30% change).
2000 9,832
2012-2016 12,778
0 5,000 10,000 15,000
Total Dwelling Units
ECONorthwest McMinnville Buildable Land Inventory and Housing Needs Analysis 13About 66% of Exhibit 2. Housing Mix, 2012-2016
Source: Census Bureau, 2012-2016 ACS Table B25024.
McMinnville’s total
housing stock is single-
family detached.
McMinnville has a larger McMinnville 66% 8% 26%
share of multifamily housing
than Yamhill County and the
State.
Yamhil County 78% 5% 17%
Oregon 72% 5% 23%
0% 20% 40% 60% 80% 100%
Single-family Detached Single-family Attached Multifamily
The mix of housing in Exhibit 3. Change in Housing Mix, McMinnville, 2000 and 2012-16
Source: Census Bureau, 2000 Decennial Census, SF3 Table H030, and 2012-2016 ACS Table
McMinnville stayed B25024.
relatively static from 2000
to 2016.
McMinnville had 12,778 2000 67% 9% 24%
dwelling units in the 2012-
2016 period. About 8,445
were single-family detached,
1,009 were single-family 2012-2016 66% 8% 26%
attached, and 3,324 were
multifamily.
0% 20% 40% 60% 80% 100%
Single-family Detached Single-family Attached
Multifamily All units
ECONorthwest McMinnville Buildable Land Inventory and Housing Needs Analysis 14Building Permits
Over the 2000 to 2017 Exhibit 4. Building Permits by Type of Unit, McMinnville, 2000 through
period, McMinnville 2017
Source: City of McMinnville. Note 1: Single-Family includes detached and attached single family
issued permits for 3,561 units as well as manufactured homes. Note 2: This chart shows a ~500 unit discrepency from ACS
dwelling units, with an data presented in Exhibit 1. The City may have permited units that were not developed.
average of 198 permits 400
issued annually.
350
Since 2000, McMinnville
Dwelling Units Permitted
300
issued 57% of permits for
single family dwelling units, 250
36% for multi-family 200
dwelling units, and 7% for 150
manufactured homes.
100
50
0
00
01
02
03
04
05
06
07
08
09
10
11
12
13
14
15
16
17
20
20
20
20
20
20
20
20
20
20
20
20
20
20
20
20
20
20
Single-Family Multi-Family
In the current decade Exhibit 5. Building Permits by Type of Unit, McMinnville, 1990-1999,
(2010-17), McMinnville 2000-2009, and 2010-2017
Source: City of McMinnville. Note: DU is dwelling unit.
permitted substantially
fewer units than 3,000
previous decades.
2,500
2,000
Permits
1,500
1,000
500
-
1990 to 1999 2000 to 2009 2010 to 2017
Single Family Manufactured Home Multi-Family
ECONorthwest McMinnville Buildable Land Inventory and Housing Needs Analysis 15Trends in Tenure
Housing tenure describes whether a dwelling is owner- or renter-occupied. This section shows:
About 58% of McMinnville’s households own their own home. In comparison, 67% of
Yamhill County households and 61% of Oregon households are homeowners.
Homeownership in McMinnville stayed relatively stable between 2000 and 2012-2016.
In 2000, 60% of McMinnville households were homeowners. In 2010 and 2012-2016, 58%
of households were homeowners.
Nearly all McMinnville homeowners (95%) live in single-family detached housing,
while many renters (58%) live in multifamily housing.
The implications for the forecast of new housing are: (1) opportunities for rental housing in
McMinnville are limited, given that over half of renters live in multi-family housing and limited
multi-family housing has been built in McMinnville since 2000, and (2) there may be
opportunities to encourage development of a wider variety of affordable attached housing
types for homeownership, such as townhomes.
McMinnville’s Exhibit 6. Homeownership for Occupied Units, McMinnville, Yamhill
homeownership rate is County, and Oregon 2012-16
Source: Census Bureau, 2012-2016 ACS Table B24003.
lower than that of the
county.
McMinnville 58%
Yamhill County 67%
Oregon 61%
0% 15% 30% 45% 60% 75%
Homeownership Rate
ECONorthwest McMinnville Buildable Land Inventory and Housing Needs Analysis 16McMinnville’s Exhibit 7. Tenure, Occupied Units, McMinnville 2012-2016
Source: Census Bureau, 2000 Decennial Census SF1 Table H004, 2010 Decennial Census SF1
homeownership rate Table H4, 2012-16 ACS Table B24003.
has remained steady
since 2000 at about
60%. 2000 60% 40%
2010 58% 42%
2012-2016 58% 42%
0% 20% 40% 60% 80% 100%
Occupied Housing Units
Owner occupied Renter occupied
Nearly all homeowners Exhibit 8. Housing Units by Type and Tenure, McMinnville, 2012-
and about a third of all 2016
Source: Census Bureau, 2012-2016 ACS Table B25032.
renters live in single-
family detached
housing.
Over half of McMinnville’s Renter 29% 13% 58%
households that rent live
in multifamily housing.
Owner 95% 4%1%
0% 20% 40% 60% 80% 100%
Single-family detached Single-family attached Multifamily
ECONorthwest McMinnville Buildable Land Inventory and Housing Needs Analysis 17Twenty-eight percent of Exhibit 9. Tenure by Year Householder Moved, McMinnville, 2012-
homeowners moved in 2016
Source: Census Bureau, 2012-2016 ACS Table B25026.
2010 or after –
compared to 77% of 90%
renters that moved in 80%
2010 or after. 70%
60%
50%
40%
30%
20%
10%
0%
Moved in 2010 Moved in 2000 Moved in 1990 Moved in 1989
or later to 2009 to 1999 or earlier
Owner Renter
Vacancy Rates
The Census defines vacancy as: "Unoccupied housing units are considered vacant. Vacancy
status is determined by the terms under which the unit may be occupied, e.g., for rent, for sale,
or for seasonal use only." The 2010 Census identified vacancy through an enumeration, separate
from (but related to) the survey of households. The Census determines vacancy status and other
characteristics of vacant units by enumerators obtaining information from property owners and
managers, neighbors, rental agents, and others.
Vacancy rate in Exhibit 10. Percent of Housing Units that are Vacant, 2000, 2010,
McMinnville was 6.2% in 2012-2016
Source: Census Bureau, 2000 Decennial Census SF1 Table QT-H1, 2010 Decennial Census
2016, up from 4.7% in SF1 Table QT-H1, 2012-16 ACS Table B25002.
2000.
10%
As of 2016, McMinnville’s
vacancy rate was below that
8%
of Yamhill County and
Oregon (7.2%).
Vacancy Rate
6%
4%
2%
0%
McMinnville Yamhill County Oregon
2000 2010 2012-2016
ECONorthwest McMinnville Buildable Land Inventory and Housing Needs Analysis 18Short-Term Rentals and Seasonal Housing
A short-term rental is an entire dwelling unit rented for a period of no more than 30 (thirty)
consecutive days. Short-term rentals include vacation home rentals.
McMinnville has about Exhibit 11. Short-Term Rentals, McMinnville, 2018 Point in Time
Source: City of McMinnville.
53 short-term rentals,
of which 15 rentals are
occupied by a resident.
Of these rentals, 60% are
located in units built in
1950 or earlier, 19% in
units built between 1951
and 1990, 13% in units
built in 1991 or later, and
8% are unknown.
About 87% of Exhibit 12. Short-Term Rental by Zone Classification, McMinnville,
McMinnville’s short- 2018 Point in Time
term rentals are located Source: City of McMinnville.
in a residential zone (O- 18
R, R-1, R-2, R-3, and R- 16
16
4).
14
12
Another 11% of short-term 12
rentals are located in a
commercial zone (C-3) and 10
8
the remaining 2% of short- 8 7
term rentals are located in 6
6
a flood plain (F-P).
4 3
2 1
0
C-3 F-P O-R R-1 R-2 R-3 R-4
ECONorthwest McMinnville Buildable Land Inventory and Housing Needs Analysis 19McMinnville has more Exhibit 13. Vacancy of Seasonal, Recreational, or Occasional Use
seasonal housing units Housing, McMinnville 2000 to 2012-2016
Source: Census Bureau, 2000 Decennial Census SF1 Table H005, 2010 Decennial Census
than it did in 2000. SF1 Table H5, 2012-16 ACS Table B25004.
However, a smaller share 23 Units 52 Units 74 units 222%
of McMinnville’s vacant 2000 2010 2012-2016 Change from
units is for seasonal, 2000 to 2016
recreational, or occasional
use (9% in 2000, 7% in
2010, and 5% in 2016).
In 2017, property Exhibit 14. Airbnb Prevalence, McMinnville, 2017
owners used 74 units or Source: DiNatale, Sadie. (2017). Assessing and Responding to Short-Term Rentals in Oregon.
Data source: Airdna, Property Data, US Census, ACS 2012-2016, Table B25024.
0.6% of McMinnville’s
housing stock as an 0.6% $133 62% 58% 42%
Airbnb. Airbnbs as Average Daily Share of Share of Share of
percent of Rate per Properties Properties Properties
total housing Property Reserved (Entire Home) (Private/
This figure is in line with stock >30 Days in Shared
Census data for Seasonal, Calendar Room)
Recreational, or Year
Occasional Use Vacancies.
ECONorthwest McMinnville Buildable Land Inventory and Housing Needs Analysis 20Government-assisted Housing Projects
Governmental agencies and nonprofit organizations offer a range of housing assistance to low-
and moderate-income households in renting or purchasing a home. There are 19 government-
assisted housing developments in McMinnville:
McMinnville has a total Exhibit 15. Inventory of Government-assisted Housing Projects,
of 19 government McMinnville, 2018
Source: Oregon Department of Housing and Community Services, Affordable Housing
assisted housing Inventory, 2018.
complexes, totaling 665
units. Development Name Total Units Population Served
The majority of these Bridges 6 Low-income residents
spaces are for low-income Fresa Park B 6 Agricultural workers
families. Hendricks Place 8 Persons with disabilities
Heritage Place 60 Seniors
Homeport 12 Persons with Disabilities
Jandina Park 36 Persons with Disabilities
Low Rent Public Housing Conversion 70 IND
Orchards Plaza 60 Family and seniors
Redwood Commons 64 Family
Sunflower Park 33 Family
Sunnyside Apts 15 Family
Third Street 5 Persons with disabilities
Tice Park 88 Family
Villa Del Sol 24 Family and agricultural workers
Villa West 48 Family
Village Quarter 50 Family
Western Terraces 32 Seniors
Willamette Place I 24 Family
Willamette Place II 24 Seniors
ECONorthwest McMinnville Buildable Land Inventory and Housing Needs Analysis 21Manufactured Homes
Manufactured homes have provided a source of affordable housing in McMinnville. They
provide a form of homeownership that can be made available to low- and moderate-income
households. Cities are required to plan for manufactured homes—both on lots and in parks
(ORS 197.475-492).
Generally, manufactured homes in parks are owned by the occupants who pay rent for the
space. Monthly housing costs are typically lower for a homeowner in a manufactured home
park for several reasons, including the fact that property taxes levied on the value of the land
are paid by the property owner rather than the manufactured home owner. The value of the
manufactured home generally does not appreciate in the way a conventional home would,
however. Manufactured home homeowners in parks are also subject to the mercy of the
property owner in terms of rent rates and increases. It is generally not within the means of a
manufactured homeowner to relocate another manufactured home to escape rent increases.
Living in a park is desirable to some because it can provide a more secure community with on-
site managers and amenities, such as laundry and recreation facilities.
OAR 197.480(4) requires cities to inventory the mobile home or manufactured dwelling parks
sited in areas planned and zoned or generally used for commercial, industrial or high-density
residential development. This next exhibit presents the inventory of mobile and manufactured
home parks within McMinnville as a 2018.
McMinnville has three Exhibit 16. Inventory of Mobile/Manufactured Home Parks,
manufactured home McMinnville UGB, 2018
Source: Oregon Manufactured Dwelling Park Directory.
parks within the UGB
with a total of 229 Name Location Type
Total Vacant Zone or Plan
Spaces Spaces Designation
spaces.
Flamingo Mobile Home Park 1338 E Quincy 55+ 24 0 R-4
Squires Estates 1557 N Pacific Hwy Family 103 0 R-3
Squires Mobile West Estates 1011 N 9th St Family 102 2 R-3
ECONorthwest McMinnville Buildable Land Inventory and Housing Needs Analysis 224. Demographic and Other Factors Affecting
Residential Development in McMinnville
Demographic trends are important for a thorough understanding of the dynamics of the
McMinnville housing market. McMinnville exists in a regional economy; trends in the region
impact the local housing market. This chapter documents demographic, socioeconomic, and
other trends relevant to McMinnville at the national, state, and regional levels.
Demographic trends provide a context for growth in a region; factors such as age, income,
migration and other trends show how communities have grown and how they will shape future
growth. To provide context, we compare McMinnville to Yamhill County. We also compare
McMinnville to nearby cities with comparable populations and community attributes
(Monmouth, Independence, Dallas, and Newberg) where appropriate. Characteristics such as
age and ethnicity are indicators of how population has grown in the past and provide insight
into factors that may affect future growth.
A recommended approach to conducting a housing needs analysis is described in Planning for
Residential Growth: A Workbook for Oregon’s Urban Areas, the Department of Land Conservation
and Development’s guidebook on local housing needs studies. As described in the workbook,
the specific steps in the housing needs analysis are:
1. Project the number of new housing units needed in the next 20 years.
2. Identify relevant national, state, and local demographic and economic trends and factors
that may affect the 20-year projection of structure type mix.
3. Describe the demographic characteristics of the population and, if possible, the housing
trends that relate to demand for different types of housing.
4. Determine the types of housing that are likely to be affordable to the projected
households based on household income.
5. Determine the needed housing mix and density ranges for each plan designation and the
average needed net density for all structure types.
6. Estimate the number of additional needed units by structure type.
This chapter presents data to address steps 2, 3, and 4 in this list. Chapter 5 presents data to
address steps 1, 5, and 6 in this list.
ECONorthwest McMinnville Buildable Land Inventory and Housing Needs Analysis 23Demographic and Socioeconomic Factors Affecting Housing
Choice 5
Analysts typically describe housing demand as the preferences for different types of housing (i.e.,
single-family detached or apartment), and the ability to pay for that housing (the ability to
exercise those preferences in a housing market by purchasing or renting housing; in other
words, income or wealth).
Many demographic and socioeconomic variables affect housing choice. However, the literature
about housing markets finds that age of the householder, size of the household, and income are
most strongly correlated with housing choice.
Age of householder is the age of the person identified (in the Census) as the head of
household. Households make different housing choices at different stages of life. This
chapter discusses generational trends, such as housing preferences of Baby Boomers,
people born from about 1946 to 1964, and Millennials, people born from about 1980 to
2000.
Size of household is the number of people living in the household. Younger and older
people are more likely to live in single-person households. People in their middle years
are more likely to live in multiple person households (often with children).
Income is the household income. Income is probably the most important determinant of
housing choice. Income is strongly related to the type of housing a household chooses
(e.g., single-family detached, duplex, or a building with more than five units) and to
household tenure (e.g., rent or own).
5 The research in this chapter is based on numerous articles and sources of information about housing, including:
Davis, Hibbits, & Midghal Research, “Metro Residential Preference Survey,” May 2014.
The American Planning Association, “Investing in Place; Two generations’ view on the future of
communities.” 2014
“Access to Public Transportation a Top Criterion for Millennials When Deciding Where to Live, New Survey
Shows,” Transportation for America.
“Survey Says: Home Trends and Buyer Preferences,” National Association of Home Builders International
Builders
The Case for Multi-family Housing. Urban Land Institute. 2003
E. Zietz. Multi-family Housing: A Review of Theory and Evidence. Journal of Real Estate Research, Volume 25,
Number 2. 2003.
C. Rombouts. Changing Demographics of Homebuyers and Renters. Multi-family Trends. Winter 2004.
J. McIlwain. Housing in America: The New Decade. Urban Land Institute. 2010.
D. Myers and S. Ryu. Aging Baby Boomers and the Generational Housing Bubble. Journal of the American
Planning Association. Winter 2008.
M. Riche. The Implications of Changing U.S. Demographics for Housing Choice and Location in Cities. The
Brookings Institution Center on Urban and Metropolitan Policy. March 2001.
L. Lachman and D. Brett. Generation Y: America’s New Housing Wave. Urban Land Institute. 2010.
ECONorthwest McMinnville Buildable Land Inventory and Housing Needs Analysis 24This chapter focuses on these factors, presenting data that suggests how changes to these factors
may affect housing need in McMinnville over the next 20 years.
National Trends6
This brief summary on national housing trends builds on previous work by ECONorthwest, the
Urban Land Institute (ULI) reports, and conclusions from The State of the Nation’s Housing, 2018
report from the Joint Center for Housing Studies of Harvard University. The Harvard report
summarizes the national housing outlook as follows:
“By many metrics, the housing market is on sound footing. With the economy near full
employment, household incomes are increasing and boosting housing demand. On the supply
side, a decade of historically low single-family construction has left room for expansion of this
important sector of the economy. Although multifamily construction appears to be slowing,
vacancy rates are still low enough to support additional rentals. In fact, to the extent that
growth in supply outpaces demand, a slowdown in rent growth should help to ease
affordability concerns.”
However, challenges to a strong domestic housing market remain. High mortgage rates make
housing unaffordable for many Americans, especially younger Americans. In addition to rising
housing costs, wages have also failed to keep pace, worsening affordability pressures. Single-
family and multifamily housing supplies remain tight, which compound affordability issues.
The State of the Nation’s Housing report emphasizes the importance of government assistance and
intervention to keep housing affordable moving forward. Several challenges and trends shaping
the housing market are summarized below:
Moderate new construction and tight housing supply. New construction experienced
its eighth year of gains in 2017 with 1.2 million units added to the national stock. Despite
gains in new construction, last year’s increase marked the smallest annual percent gain
since the Great Recession, and multifamily starts declined from 2016 to 2017, falling 9.7
percent. The State of the Nation’s Housing report cites lack of skilled labor, higher
building costs, scarce developable land, and the cost of local zoning and regulation as
impediments to new construction.
Demand shift from renting to owning. After twelve straight years of decline, the
national homeownership rate increased slightly from around 63% to 64% as of 2017.
Homeownership rates may be stabilizing around a new normal, similar to the rate in the
early 1990s (before the housing boom and bust).
Housing affordability. In 2016, almost one-third of American households spent more
than 30% of their income on housing. This figure is down from the prior year, bolstered
by a considerable drop in the owner share of cost-burdened households. Low-income
households face an especially dire hurdle to afford housing. With such a large share of
6These trends are based on information from: (1) The Joint Center for Housing Studies of Harvard University’s
publication “The State of the Nation’s Housing 2016,” (2) Urban Land Institute, “2014 Emerging Trends in Real
Estate,” and (3) the U.S. Census.
ECONorthwest McMinnville Buildable Land Inventory and Housing Needs Analysis 25households exceeding the traditional standards for affordability, policymakers are
focusing efforts on the severely cost-burdened. Among those earning less than $15,000,
more than 70% of households paid more than half of their income on housing.
Long-term growth and housing demand. The Joint Center for Housing Studies forecasts
that nationally, demand for new homes could total as many as 13.6 million units
between 2015 and 2025. Much of the demand will come from Baby Boomers,
Millennials,7 and immigrants.
Changes in housing preference. Housing preference will be affected by changes in
demographics; most notably, the aging of the Baby Boomers, housing demand from
Millennials, and growth of immigrants.
Baby Boomers. The housing market will be affected by continued aging of the Baby
Boomers, the oldest of whom were in their seventies in 2018 and the youngest of
whom were in their fifties in 2017. Baby Boomers’ housing choices will affect
housing preference and homeownership. Research shows that “older people in
western countries prefer to live in their own familiar environment as long as
possible,” but aging in place does not only mean growing old in their own
homes.8 A broader definition exists which explains that aging in place also means
“remaining in the current community and living in the residence of one’s choice.”9
Therefore, some Boomers are likely to stay in their home as long as they are able,
and some will prefer to move into other housing products, such as multifamily
housing or age-restricted housing developments, before they move into to a
dependent living facility or into a familial home. Moreover, “the aging of the U.S.
population, [including] the continued growth in the percentage of single-person
households, and the demand for a wider range of housing choices in communities
across the country is fueling interest in new forms of residential development,
including tiny houses.”10
Millennials. Over the last several decades, young adults increasingly lived in
multi-generational housing – and increasingly more so than older
demographics.11 Despite this trend, as Millennials age over the next 20 years, they
will be forming households and families. In 2018, the oldest Millennials were in
their mid-30s and the youngest were in their twenties. By 2035, Millennials will be
between 39 and 54 years old.
7According to the Pew Research Center, Millennials were born between the years of 1981 to 1996 (inclusive) and as of
2018, they were between the ages of 22-37. Read more about generations and their definitions here:
http://www.pewresearch.org/fact-tank/2018/03/01/defining-generations-where-millennials-end-and-post-millennials-
begin/.
8 Vanleerberghe, Patricia, et al. (2017). The quality of life of older people aging in place: a literature review.
9 Ibid.
10 American Planning Association. Making Space for Tiny Houses, Quick Notes.
11According to the Pew Research Center, in 1980, just 11% of adults aged 25 to 34 lived in a multi-generational family
household and by 2008, 20% did (82% change). Comparatively, 17% of adults aged 65 and older lived in a multi-
generational family household and by 2008, 20% did (18% change).
ECONorthwest McMinnville Buildable Land Inventory and Housing Needs Analysis 26Millennials were in the early period of household formation at the beginning of
the 2007-2009 recession. Across the nation, household formation fell to around
600,000 to 800,000 in the 2007-2013 period, well below the average rate of growth
in previous decades. Despite recent sluggish growth, several demographic factors
indicate increases in housing growth to come. The Millennial generation is the age
group most likely to form the majority of new households. While low incomes
have kept current homeownership rates among young adults below their
potential, Millennials may represent pent-up demand that will release when the
economy fully recovers. As Millennials age, they may increase the number of
households in their 30s (through 2025) by 2.4 to 3.0 million.
Immigrants. Research on foreign-born populations find that immigrants, more
than native-born populations, prefer to live in multi-generational housing. Still,
immigration and increased homeownership among minorities could also play a
key role in accelerating household growth over the next 10 years. Current
Population Survey estimates indicate that the number of foreign-born households
rose by nearly 400,000 annually between 2001 and 2007, and they accounted for
nearly 30% of overall household growth. Beginning in 2008, the influx of
immigrants was staunched by the effects of the Great Recession. After a period of
declines, however, the foreign born are again contributing to household growth.
The Census Bureau’s estimates of net immigration in 2015–2016 indicate an
increase of 1.0 million persons over the previous year. This is a decrease from 1.04
million during 2014–2015, but higher than the average annual pace of 850,000
during the period of 2009–2011. However, if proposed policies are successful,
growth in undocumented and documented immigration could slow and cause a
drag on household growth in the coming years.
Diversity. The growing diversity of American households will have a large impact
on the domestic housing markets. Over the coming decade, minorities will make
up a larger share of young households and constitute an important source of
demand for both rental housing and small homes. The growing gap in
homeownership rates between whites and blacks, as well as the larger share of
minority households that are cost burdened warrants consideration. Since 1994,
the difference in homeownership rates between whites and blacks rose by 1.9
percentage points to 29.2% in 2017. Alternatively, the gap between white and
Hispanic homeownership rates, and white and Asian homeownership rates, both
decreased during this period but remained sizable at 26.1 and 16.5 percentage
points, respectively. Although homeownership rates are increasing for some
minorities, large shares of minority households are more likely to live in high-cost
metro areas. This, combined with lower incomes than white households, leads to
higher rates of cost burden for minorities—47% for blacks, 44% for Hispanics, 37%
for Asians/others, and 28% for whites in 2015.
Changes in housing characteristics. The U.S. Census Bureau’s Characteristics of New
Housing Report (2017) presents data that show trends in the characteristics of new
ECONorthwest McMinnville Buildable Land Inventory and Housing Needs Analysis 27housing for the nation, state, and local areas. Several long-term trends in the
characteristics of housing are evident from the New Housing Report:12
Larger single-family units on smaller lots. Between 1999 and 2017, the median size of
new single-family dwellings increased by 20% nationally, from 2,028 sq. ft. to
2,426 sq. ft., and 20% in the western region from 2,001 sq. ft. in 1999 to 2,398 sq. ft
in 2017. Moreover, the percentage of new units smaller than 1,400 sq. ft.
nationally, decreased by more than half, from 15% in 1999 to 6% in 2017. The
percentage of units greater than 3,000 sq. ft. increased from 17% in 1999 to 25% of
new one-family homes completed in 2017. In addition to larger homes, a move
towards smaller lot sizes is seen nationally. Between 2009 and 2017, the
percentage of lots less than 7,000 sq. ft. increased from 25% to 31% of lots.
Larger multifamily units. Between 1999 and 2017, the median size of new multiple
family dwelling units increased by 5.3% nationally and 2.4% in the Western
region. Nationally, the percentage of new multifamily units with more than 1,200
sq. ft. increased from 28% in 1999 to 33% in 2017 and increased from 25% to 28%
in the Western region.
Household amenities. Across the U.S. and since 2013, an increasing number of new
units had air-conditioning (fluctuating year by year at over 90% for both new
single-family and multi-family units). In 2000, 93% of new single-family houses
had two or more bathrooms, compared to 97% in 2017. The share of new
multifamily units with two or more bathrooms decreased from 55% of new
multifamily units to 45%. As of 2017, 65% of new single-family houses in the U.S.
had one or more garage (from 69% in 2000).
State Trends
Oregon’s 2016-2020 Consolidated Plan includes a detailed housing needs analysis as well as
strategies for addressing housing needs statewide. The plan concludes that “a growing gap
between the number of Oregonians who need affordable housing and the availability of
affordable homes has given rise to destabilizing rent increases, an alarming number of evictions
of low- and fixed- income people, increasing homelessness, and serious housing instability
throughout Oregon.”
It identified the following issues that describe housing need statewide:13
For housing to be considered affordable, a household should pay up to one-third of their
income toward rent, leaving money left over for food, utilities, transportation, medicine,
and other basic necessities. Today, one in two Oregon households pays more than one-
12U.S. Census Bureau, Highlights of Annual 2017 Characteristics of New Housing. Retrieved from:
https://www.census.gov/construction/chars/highlights.html.
13These conclusions are copied directly from the report: Oregon’s 2016-2020 Consolidated Plan
http://www.oregon.gov/ohcs/docs/Consolidated-Plan/2016-2020-Consolidated-Plan-Amendment.pdf.
ECONorthwest McMinnville Buildable Land Inventory and Housing Needs Analysis 28third of their income toward rent, and one in three pays more than half of their income
toward rent.
More school children are experiencing housing instability and homelessness. The rate of
K-12 homeless children increased by 12% from the 2013-2014 school year to the 2014–
2015 school year.
Oregon has 28,500 rental units that are affordable and available to renters with
extremely low incomes. There are about 131,000 households that need those apartments,
leaving a gap of 102,500 units.
Housing instability is fueled by an unsteady, low-opportunity employment market.
Over 400,000 Oregonians are employed in low-wage work. Low-wage work is a growing
share of Oregon’s economy. When wages are set far below the cost needed to raise a
family, the demand for public services grows to record heights.
Women are more likely than men to end up in low-wage jobs. Low wages, irregular
hours, and part-time work compound issues.
People of color historically constitute a disproportionate share of the low-wage work
force. About 45% of Latinos, and 50% of African Americans, are employed in low-wage
industries.
The majority of low-wage workers are adults over the age of 20, many of whom have
earned a college degree, or some level of higher education.
Minimum wage in Oregon is $9.25. A minimum wage worker must work 72 hours a
week, and 52 weeks a year, to afford a two-bedroom apartment at Fair Market Rents.
ECONorthwest McMinnville Buildable Land Inventory and Housing Needs Analysis 29Regional and Local Demographic Trends that may affect housing need in
McMinnville
Demographic trends that might affect the key assumptions used in the baseline analysis of
housing need are: (1) the aging population, (2) changes in household size and composition, and
(3) increases in diversity.
An individual’s housing needs change throughout their life, with changes in income, family
composition, and age. The types of housing needed by a 20-year-old college student differ from
the needs of a 40-year-old parent with children, or an 80-year-old single adult. As
McMinnville’s population ages, different types of housing will be needed to accommodate older
residents. The housing characteristics by age data below reveal this cycle in action in
McMinnville.
Housing needs and Exhibit 17. Effect of demographic changes on housing need
Source: ECONorthwest, adapted from Clark, William A.V. and Frans M. Dieleman. 1996.
preferences change in Households and Housing. New Brunswick, NJ: Center for Urban Policy Research.
predictable ways over
time, with changes in
marital status and size of
family.
Families of different sizes
need different types of
housing.
ECONorthwest McMinnville Buildable Land Inventory and Housing Needs Analysis 30Growing Population
McMinnville’s population grew by 88% between 1990 and 2017, adding 15,771 new residents.
Over this period, McMinnville’s population grew at an average annual growth rate of 2.4%.
McMinnville’s population growth will drive future demand for housing over the planning
period.
Exhibit 18. Population, McMinnville, 1990 - 2017
Source: U.S. Decennial Census 1990, 2000, and 2010. Portland State University Population Research Center, 2017 Estimate.
Change 1990 to 2017
1990 2000 2010 2017 Number Percent AAGR
U.S. 248,709,873 281,421,906 308,745,538 325,719,178 77,009,305 31% 1.0%
Oregon 2,842,321 3,421,399 3,831,074 4,141,100 1,298,779 46% 1.4%
Yamhill County 65,551 84,992 99,193 106,300 40,749 62% 1.8%
McMinnville 17,894 26,499 32,187 33,665 15,771 88% 2.4%
By 2040, McMinnville’s Exhibit 19. McMinnville Projected Population Growth in UGB 2017-
population within its UGB is 67
Source: Portland State University Population Research Center, Population Estimates and
expected to surpass 60,000 Reports, http://www.pdx.edu/prc/population-reports-estimates.
people by 2067.
70,000
60,000 58,449
52,541
50,000 46,956
41,255
40,000 35,709
34,293
30,000
20,000
10,000
0
2017 2020 2030 2040 2050 2060
McMinnville’s population Exhibit 20. McMinnville Projected Population Growth in UGB, 2020 -
within its UGB is expected 2067
Source: Portland State University Population Research Center, Population Estimates and
to grow by around 75% Reports, http://www.pdx.edu/prc/population-reports-estimates.
between 2020 and 2067.
35,709 38,437 41,255 46,956 62,803
2020 2025 2030 2040 2067
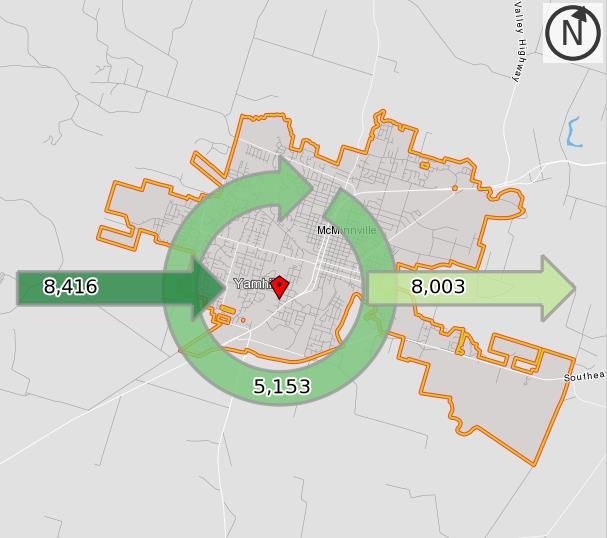
ECONorthwest McMinnville Buildable Land Inventory and Housing Needs Analysis 31A majority of new Exhibit 21. Migrant Share of New Population, Yamhill County and
population growth in Oregon, 2000 - 2016
Source: Portland State University Population Research Center.
Yamhill County and
Oregon is because of in- Yamhill
County
19,998 13,477 67%
migration. New Population New Migrant Population Migrant Share of
Growth
Oregon 654,951 420,150 64%
New Population New Migrant Population Migrant Share of
Growth
Aging Population
This section shows two key characteristics of McMinnville’s population, with implications for
future housing demand in McMinnville:
Seniors. McMinnville and Yamhill County populations are increasingly getting older.
As McMinnville’s elderly population grows, it will have increasing demand for housing
that is suitable for elderly residents. By 2040, McMinnville’s residents aged 60 years and
older will account for 28% of the population, compared to 20% in 2010.
The impact of growth in seniors in McMinnville will depend, in part, on whether older
people already living in McMinnville continue to live there as they retire. National
surveys show that, in general, most retirees prefer to age in place by continuing to live in
their current home and community as long as possible.14
Growth in the number of seniors will result in demand for housing types specific to
seniors, such as small and easy-to-maintain dwellings, assisted living facilities, or
age-restricted developments. Senior households will make a variety of housing choices,
including: remaining in their homes as long as they are able, downsizing to smaller
single-family homes (detached and attached) or multifamily units, or moving into group
housing (such as assisted living facilities or nursing homes), as their health declines. The
challenges aging seniors face in continuing to live in their community include: changes
in healthcare needs, loss of mobility, the difficulty of home maintenance, financial
concerns, and increases in property taxes.15
McMinnville has a larger proportion of younger people than the county and state.
About 30% of McMinnville’s population is under 20 years old, compared to 28% of
Yamhill County’s population and 25% of the state’s population. The forecast for
population growth in McMinnville shows the number of people under 20 years will
increase but the share of younger people will decline marginally from 29% of the
population in 2017 to 27% of the population by 2040.
14A survey conducted by the AARP indicates that 90% of people 50 years and older want to stay in their current
home and community as they age. See http://www.aarp.org/research.
15 “Aging in Place: A toolkit for Local Governments” by M. Scott Ball.
ECONorthwest McMinnville Buildable Land Inventory and Housing Needs Analysis 32You can also read