MODELS FOR RISK ASSESSMENT OF MOBILE APPLICATIONS - CHIGOZIE CHARLES IKWUEGBU - MASTER OF SCIENCE IN COMPUTER SCIENCE MAY 2020 - DIVA
←
→
Page content transcription
If your browser does not render page correctly, please read the page content below

Master of Science in Computer Science
May 2020

  Models for Risk assessment of Mobile
              Applications

                     Chigozie Charles Ikwuegbu

  Faculty of Computing, Blekinge Institute of Technology, 371 79 Karlskrona, Sweden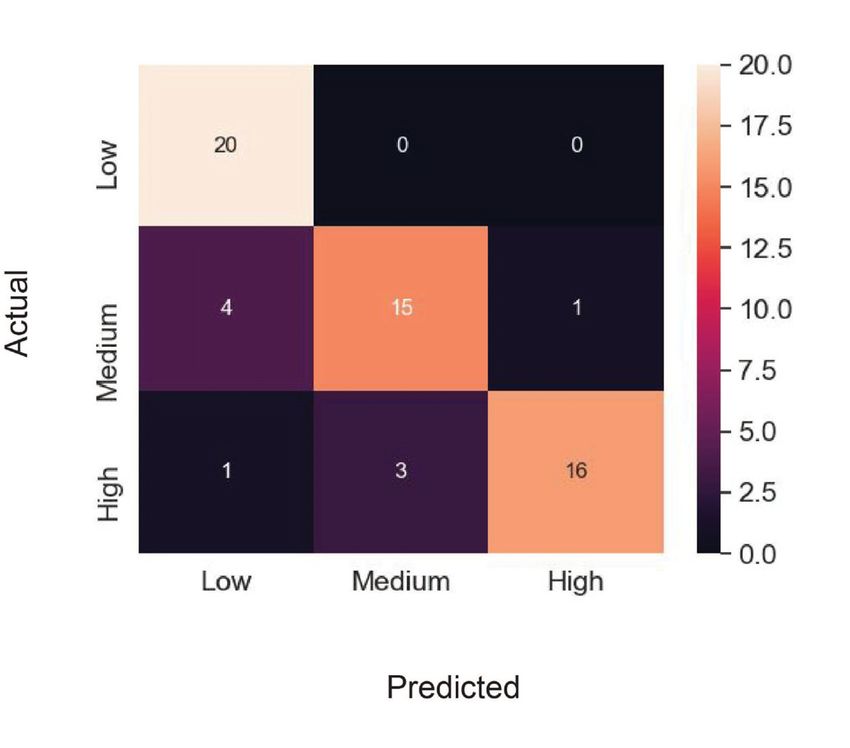
This thesis is submitted to the Faculty of Computing at Blekinge Institute of Technology in
partial fulfilment of the requirements for the degree of Master of Science in Computer Science.
The thesis is equivalent to 20 weeks of full time studies.

The authors declare that they are the sole authors of this thesis and that they have not used
any sources other than those listed in the bibliography and identified as references. They further
declare that they have not submitted this thesis at any other institution to obtain a degree.

Contact Information:
Author(s):
Chigozie Charles Ikwuegbu
E-mail: chik19@student.bth.se

University advisor:
Dr. Anders Carlsson
Department of Computer Science

Faculty of Computing                               Internet : www.bth.se
Blekinge Institute of Technology                   Phone    : +46 455 38 50 00
SE–371 79 Karlskrona, Sweden                       Fax      : +46 455 38 50 57

Abstract

Background: Mobile applications are software that extend the functionality our
smartphones by connecting us with friends and a wide range of other services. An-
droid, which is an operating system based on the Linux kernel, leads the market with
over 2.6 million applications recorded on their official store. Application developers,
due to the ever-growing innovation in smartphones, are compelled to release new
ideas on limited budget and time, resulting in the deployment of malicious appli-
cations. Although there exists a security mechanism on the Google Play Store to
remove these applications, studies have shown that most of the applications on the
app store compromise privacy or pose security related risks. It is therefore essential
to investigate the security risk of installing any of these applications on a device.
Objectives: To identify methods and techniques for assessing mobile application
security, investigate how attributes indicate the harmfulness of applications, and
evaluate the performance of K Nearest Neighbors(K-NN) and Random forest ma-
chine learning models in assessing the security risk of installing mobile applications
based on information available on the application distribution platform.
Methods: Literature analysis was done to gather information on the different meth-
ods and techniques for assessing security in mobile applications and investigations on
how different attributes on the application distribution platform indicate the harm-
fulness of an application. An experiment was also conducted to examine how various
machine learning models perform in evaluating the security risk associated with in-
stalling applications, based on information on the application distribution platform.
Results: Literature analysis presents the various methods and techniques for mobile
application security assessment and identifies how mobile application attributes indi-
cate the harmfulness of mobile applications. The experimental results demonstrate
the performance of the aforementioned machine learning models in evaluating the
security risk of installing mobile applications.
Conclusion: Static, dynamic, and grey-box analysis are the methods used to eval-
uate mobile application security, and machine learning models including K-NN and
Random forest are suitable techniques for evaluating mobile application security risk.
Attributes such as the permissions, number of installations, and ratings reveal the
likelihood and impact of an underlying security threat. The K-NN and Random
forest models when compared to evaluate the security risk of installing mobile appli-
cations based on information on the application distribution platform showed high
performance with little differences.

Keywords: Risk Assessment, Machine Learning, Mobile application security, Mo-
bile application metadata.
Acknowledgments

I would like to appreciate my parents, siblings, and close relatives for their
unending support throughout my studies.

I would like to thank my supervisors Anders Carlsson and Alexander Adamov for
their guidance throughout my thesis.

I would like to further extend my appreciation to my professors Arkadii Snihurov,
Maryna Yevdokymenko, and Amal Mersni for their continued support and
encouragement throughout my thesis work.

Special thanks to Adeyemi Bernard, Ahoukpeme Amarachi, my ERASMUS family,
and all my friends for their unending support and motivation.

                                          iii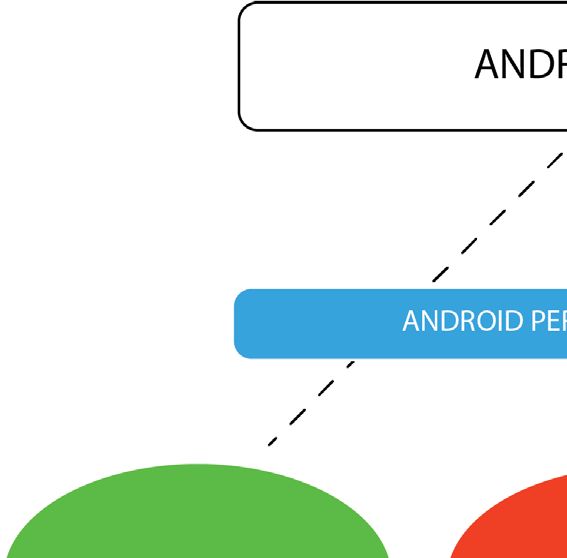
Contents

Abstract                                                                                                                         i

Acknowledgments                                                                                                                iii

Abbreviations                                                                                                                  iii

List of figures                                                                                                                 vi

List of tables                                                                                                                 vii

1 Introduction                                                                                                                  1
  1.1 Problem Statement . . . . . . . . . . . . . . . . .                          .   .   .   .   .   .   .   .   .   .   .    1
  1.2 Aim and Objectives . . . . . . . . . . . . . . . . .                         .   .   .   .   .   .   .   .   .   .   .    2
  1.3 Research Questions . . . . . . . . . . . . . . . . .                         .   .   .   .   .   .   .   .   .   .   .    2
  1.4 Decisions . . . . . . . . . . . . . . . . . . . . . . .                      .   .   .   .   .   .   .   .   .   .   .    2
       1.4.1 Selected Application Distribution Platform                            .   .   .   .   .   .   .   .   .   .   .    2
       1.4.2 Selected Machine learning Models . . . . .                            .   .   .   .   .   .   .   .   .   .   .    3
       1.4.3 Performance Metrics . . . . . . . . . . . .                           .   .   .   .   .   .   .   .   .   .   .    3
  1.5 Thesis Scope . . . . . . . . . . . . . . . . . . . . .                       .   .   .   .   .   .   .   .   .   .   .    3
  1.6 Thesis Outline . . . . . . . . . . . . . . . . . . . .                       .   .   .   .   .   .   .   .   .   .   .    3

2 Background                                                                                                                    4
  2.1 Mobile Operating Systems . . . .         .   .   .   .   .   .   .   .   .   .   .   .   .   .   .   .   .   .   .   .    4
  2.2 Mobile Applications . . . . . . . .      .   .   .   .   .   .   .   .   .   .   .   .   .   .   .   .   .   .   .   .    5
  2.3 Machine Learning . . . . . . . . .       .   .   .   .   .   .   .   .   .   .   .   .   .   .   .   .   .   .   .   .    5
      2.3.1 Classification & Regression         .   .   .   .   .   .   .   .   .   .   .   .   .   .   .   .   .   .   .   .    6
      2.3.2 Machine learning models .          .   .   .   .   .   .   .   .   .   .   .   .   .   .   .   .   .   .   .   .    6
  2.4 Security Risk Assessment . . . . .       .   .   .   .   .   .   .   .   .   .   .   .   .   .   .   .   .   .   .   .    6

3 Related Work                                                                                                                  7
  3.1 Similar Research Work . . . . . . . . . . . . . . . . . . . . . . . . . .                                                 7
  3.2 Knowledge Gap . . . . . . . . . . . . . . . . . . . . . . . . . . . . . .                                                 9

4 Method                                                                                                                       10
  4.1 Literature Analysis . . . . . . . . . . . . . .                  .   .   .   .   .   .   .   .   .   .   .   .   .   .   10
      4.1.1 Data Sources and Research Strategy                         .   .   .   .   .   .   .   .   .   .   .   .   .   .   10
      4.1.2 Criteria for selected studies . . . . .                    .   .   .   .   .   .   .   .   .   .   .   .   .   .   11
  4.2 Experiment . . . . . . . . . . . . . . . . . .                   .   .   .   .   .   .   .   .   .   .   .   .   .   .   11
      4.2.1 Libraries . . . . . . . . . . . . . . . .                  .   .   .   .   .   .   .   .   .   .   .   .   .   .   11

                                          iv
4.2.2 Experiment Design . . . . . . . . . . . . . . . . . . . . . . . . 12
4.2.3 Used Approach . . . . . . . . . . . . . . . . . . . . . . . . . . 12
4.2.4 Expert Evaluation and Data Pre-processing . . . . . . . . . . 14
4.2.5 Implementation of the Machine learning models . . . . . . . . 18
4.2.6 Evaluating the performance of the models . . . . . . . . . . . 18
4.2.7 Distribution Analysis . . . . . . . . . . . . . . . . . . . . . . . 19
4.2.8 Mann-Whitney U test . . . . . . . . . . . . . . . . . . . . . . 19
4.3 Validity . . . . . . . . . . . . . . . . . . . . . . . . . . . . . . . . . . 20
4.3.1 Internal Validity . . . . . . . . . . . . . . . . . . . . . . . . . 20
4.3.2 External Validity . . . . . . . . . . . . . . . . . . . . . . . . . 20
5 Results and Analysis 22
5.1 Results for Literature Analysis . . . . . . . . . . . . . . . . . . . . . . 22
5.1.1 Security Risk Assessment for Mobile Application. . . . . . . . 22
5.1.2 Machine learning techniques suitable for evaluating mobile ap-
plication security risk. . . . . . . . . . . . . . . . . . . . . . . 23
5.1.3 How attributes indicate the harmfulness of Mobile Applications. 24
5.2 Experimental Results . . . . . . . . . . . . . . . . . . . . . . . . . . . 27
5.2.1 Classification Results . . . . . . . . . . . . . . . . . . . . . . . 28
5.2.2 Regression Results . . . . . . . . . . . . . . . . . . . . . . . . 29
5.3 Distribution Analysis Results . . . . . . . . . . . . . . . . . . . . . . 31
5.4 Mann-Whitney U test Results . . . . . . . . . . . . . . . . . . . . . . 32
6 Discussion 33
7 Conclusions and Future Work 34
7.1 Conclusions . . . . . . . . . . . . . . . . . . . . . . . . . . . . . . . . 34
7.2 Future Work . . . . . . . . . . . . . . . . . . . . . . . . . . . . . . . . 35
A Expert evaluation of applications security risk score and class 39
B Machine Learning Models 44
B.1 Random Forest Regression . . . . . . . . . . . . . . . . . . . . . . . 44
B.2 Random Forest Classification . . . . . . . . . . . . . . . . . . . . . . 46
B.3 K-NN Regression . . . . . . . . . . . . . . . . . . . . . . . . . . . . . 48
B.4 K-NN Classification . . . . . . . . . . . . . . . . . . . . . . . . . . . . 50
C Mann-Whitney U Test 53
vList of Figures
4.1 Boolean Search Strings . . . . . . . . . . . . . . . . . . . . . . . . . . 10
4.2 Expert evaluation of applications . . . . . . . . . . . . . . . . . . . . 18
5.1 Mobile Application Assessment Methods . . . . . . . . . . . . . . . . 22
5.2 Android access control model [23] . . . . . . . . . . . . . . . . . . . . 25
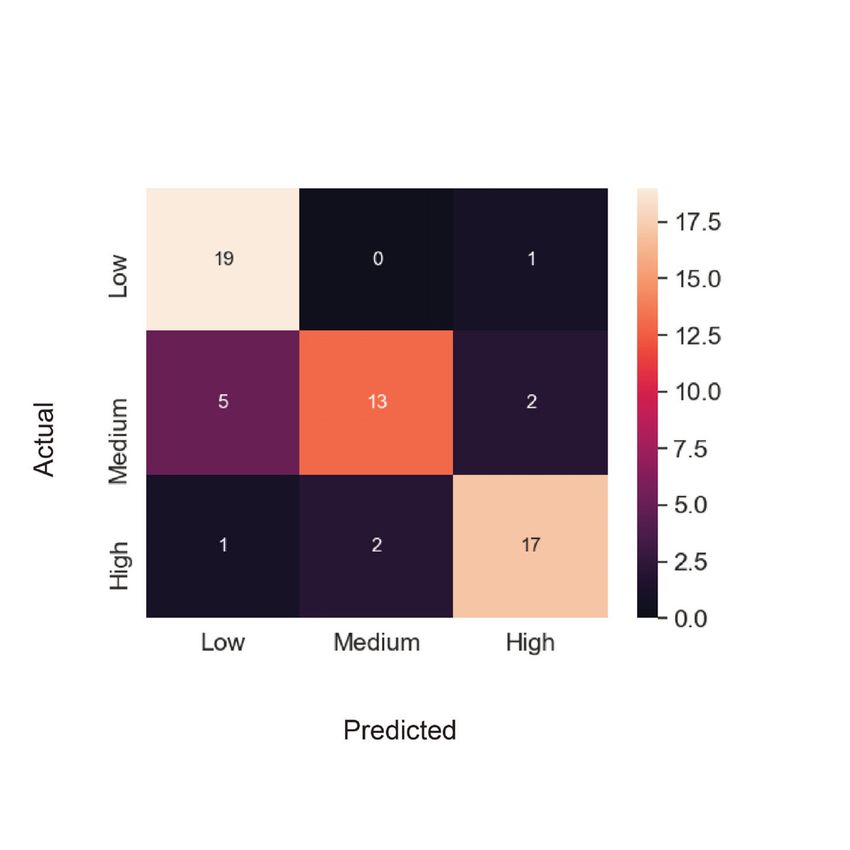
5.3 Confusion Matrix for Machine Learning Models . . . . . . . . . . . . 29
5.4 Mean absolute error results of the models . . . . . . . . . . . . . . . . 30
5.5 Random Forest Regression Distribution Analysis . . . . . . . . . . . . 31
5.6 K-NN Regression Distribution Analysis . . . . . . . . . . . . . . . . . 31
5.7 Random Forest Classification Distribution Analysis . . . . . . . . . . 32
5.8 K-NN Classification Distribution Analysis . . . . . . . . . . . . . . . 32
viList of Tables
4.1 Digital Libraries. . . . . . . . . . . . . . . . . . . . . . . . . . . . . . 11
4.2 Used Libraries. . . . . . . . . . . . . . . . . . . . . . . . . . . . . . . 11
4.3 Extracted Categories. . . . . . . . . . . . . . . . . . . . . . . . . . . . 12
4.4 List of Selected Applications. . . . . . . . . . . . . . . . . . . . . . . 13
4.5 Details of extracted features. . . . . . . . . . . . . . . . . . . . . . . . 14
4.6 List of Evaluated permissions . . . . . . . . . . . . . . . . . . . . . . 15
4.7 Rating Assessment. . . . . . . . . . . . . . . . . . . . . . . . . . . . . 15
4.8 App developers Assessment. . . . . . . . . . . . . . . . . . . . . . . . 16
4.9 App protection level assessment. . . . . . . . . . . . . . . . . . . . . . 17
4.10 App security risk level assessment. . . . . . . . . . . . . . . . . . . . . 17
4.11 Security Risk Class assessment. . . . . . . . . . . . . . . . . . . . . . 17
5.1 Security assessment methods summary table . . . . . . . . . . . . . . 23
5.2 Machine learning techniques summary table . . . . . . . . . . . . . . 24
5.3 Application attribute summary table . . . . . . . . . . . . . . . . . . 26
5.4 Literature Analysis summary table. . . . . . . . . . . . . . . . . . . . 27
5.5 Classification Rates of the Random Forest and K-NN Models. . . . . 28
5.6 Classification Accuracy Results of the Random Forest and K-NN Models. 28
5.7 Random Forest and K-NN Regression Results. . . . . . . . . . . . . . 30
5.8 Summary of the Mann-Whitney U-test results. . . . . . . . . . . . . . 32
A.1 Results of the Expert Evaluation of applications. . . . . . . . . . . . . 40
A.2 Results of the Expert Evaluation of applications(2). . . . . . . . . . . 41
A.3 Results of the Expert Evaluation of applications(3). . . . . . . . . . . 42
A.4 Results of the Expert Evaluation of applications(4). . . . . . . . . . . 43
C.1 Results of Regression and Classification Mann-Whitney U Test . . . . 53
viiChapter 1
Introduction
Mobile devices are portable electronic devices or computers. These devices in recent
times have high processing power, novel forms of interaction such as touch screen,
new protocols of connectivity, and software that explore all these features [27].
Mobile applications(apps) are software that are downloaded unto mobile devices,
tablets, and other smart devices. They extend the functionality of our smartphones
to connect us with friends, give access to the internet, play games, monitor our
health, and a wide range of other services [29]. These applications are issued to
users through various distribution platforms defined by Pandita et al as “a central
location for users to discover, purchase, download, and install software with only
a few clicks within on-device market interfaces” [25]. These distribution platforms
include Amazon Appstore, App Store(iOS), BlackBerry World, Google Play, and
Windows store [35].
Mobile operating systems are specially made for mobile devices and make it pos-
sible for mobile applications to function. These operating systems include Symbian
OS, Android OS, iOS (iPhone), BlackBerry OS, and Windows Phone [20]. Android
OS, which is based on the Linux Kernel and supports third-party application devel-
opment, has lead the market since 2011 with over 1.2 billion active devices as of 2015
[15]. The number of applications published on the Google Play Store expresses the
demand and competition in the market with a study noting that there were more
than 1.6 million apps on the Google Play Store by July 2015 and another observing
the numbers to be over 2.6 million applications as of December 2016 [16, 5].
1.1 Problem Statement
Studies suggest that many of the applications on the Google Play Store suffer from
some form of privacy or security risk related issue due to the time and budget limit
given to developers to release new ideas on the distribution platform. This can
result in the deployment of malicious applications. Although there exists a security
mechanism on the Google Play Store to identify malicious applications, it is not able
to inform users of the security risk associated with installing any of these applications
on their device [5].
Numerous studies including that presented by Asma Hamed and Hella Kaffel
Ben Ayed [29] and Haoyu et. al [4] demonstrate various techniques in identifying
malicious applications with machine learning emerging as one of the popular tech-
niques. However, the performance of various models in evaluating mobile application
security risk based on app metadata is not clear. This study identifies the methods
12 Chapter 1. Introduction
and techniques for evaluating mobile application security, examines how mobile ap-
plication attributes indicates the harmfulness of an application, and evaluates the
performance of alternative machine learning models in assessing the security risk
of installing mobile applications based on information available on the application
distribution platform.
1.2 Aim and Objectives
The aim of the research is to evaluate the performance of alternative machine learn-
ing models in assessing the security risk of installing mobile applications on a user’s
device based on information available on the distribution platform i.e. requested
permissions, developers’ reputation, users ratings, etc. The results of the models will
be compared with the given experts’ evaluation of the applications represented by
the security risk score and class. Thus, it will be possible to evaluate the effectiveness
of the proposed models.
The aim of the study is divided into the following objectives:
O1 Identify methods and techniques for assessing security risk on mobile applica-
tions and investigate how the attributes indicate the harmfulness of applica-
tions.
O2 Evaluate the performance of Random forest and K-Nearest Neighbors in as-
sessing mobile application security risk.
1.3 Research Questions
The research questions to be answered in this thesis are as follows:
RQ1. How should security risk be assessed for mobile applications?
RQ1.1 What machine learning techniques are suitable for evaluating mobile applica-
tion security risk?
RQ2. How do the attributes (permissions, privacy policies, etc.) indicate the harm-
fulness of an application?
RQ3. How do different models, based on application metadata, perform when imple-
mented to evaluate mobile application security risk?
1.4 Decisions
1.4.1 Selected Application Distribution Platform
This research evaluates the security risk of installing mobile applications from the
Google Play Store. This distribution platform was selected because it is assumed that1.5. Thesis Scope 3 all the applications on the Google Play Store are benign due to the existing security mechanism deployed. This platform is therefore selected in order to investigate the security risk associated with installing benign applications. 1.4.2 Selected Machine learning Models This research compares the performance of alternative machine learning models in evaluating the security risk of installing mobile applications on a user’s device. The models to be evaluated include Random forest and K-Nearest Neighbors (K-NN). The models are selected because of their popularity and their performance as recognized by studies. 1.4.3 Performance Metrics The performance metrics used in this study include Mean Absolute Error(MAE) and Accuracy. These metrics are used to evaluate the performance of models in regression and classification. Other metrics exist, but these were selected in order to observe the results of the research in comparison with other studies. 1.5 Thesis Scope This thesis compares the performance of different machine learning models in evalu- ating the security risk of installing mobile applications based on information provided on the apps’ digital distribution platform. The performances of the various models are evaluated using the experts’ evaluation of the apps’ represented by the security risk score and class. 1.6 Thesis Outline The remainder of the thesis is broken down into 7 chapters. Chapter 2 provides background information on various concepts adapted throughout the study. Chapter 3 discusses related works while Chapter 4 describes the methods used in the study. Chapter 5 presents the results and its analysis, while Chapter 6 covers the discus- sion of the results. Finally, Chapter 7 discusses the conclusions drawn, answers the research questions, and describes possible future work.
Chapter 2
                                                             Background

This chapter provides a background on various concepts adapted in the study for
better understanding.

2.1     Mobile Operating Systems
Mobile operating systems are platforms made for mobile devices to run applications.
These operating systems have the features of a Personal Computer(PC) operating
system and determine the functions of the device. Mobile operating systems are
provided by various companies with each having their own hardware and software
features and they are in constant competition. These operating systems include
Symbian OS, Android OS, iOS(iPhone), BlackBerry OS, and Windows Phone to
name a few [2, 20].

   • Symbian OS: The Symbian OS is currently developed by Nokia but was
     originally developed by Nokia, Ericsson, and Motorola. The Operating System
     is equipped with communication and Personal Information Management (PIM)
     functionalities [20].

   • Android OS: The Android OS is based on the Linux kernel developed by
     Google. It supports third-party development which means it allows its users
     load software form other developers. The technology is based on Java program-
     ming language and runs on devices such as Samsung, HTC, Google Pixel, and
     OnePlus [20, 2, 15].

   • BlackBerry OS: is developed by Research in Motion (RIM) for the smart-
     phone and tablets they provide. The technology is now based on Java pro-
     gramming language for their smart-phones and C++ on other web-based pro-
     gramming languages for their PlayBook tablets. The operating system provides
     BlackBerry Enterprise Server (BES), and BlackBerry Internet Services (BIS).
     These supply their devices with internet services, push-based calendar, task,
     contact, email, and note exchange [2].

   • iOS: is an Operating System developed by Apple Inc for Apple devices. The
     technology is based on C programming language and does not allow third-party
     development. The Operating System supports touch-based motions such as
     swipe, tap, tap and hold, and squeeze to control on-screen interface components
     and to perform interface activities [2].

                                         4
2.2. Mobile Applications 5
• Windows Phone: is an Operating System developed by Microsoft. The
technology is based on C++ programming language. It is used by various
manufactures such as HTC and Nokia. The newer versions of the operating
system support user interface management, and a Cloud Integration module
for web search via Bing, location services, and push notifications [2].
2.2 Mobile Applications
Mobile applications are software that are installed on mobile devices, tablets, and
other smart devices and are used to perform various tasks [29]. Studies have adopted
various methods in the development cycle of mobile applications, but these methods
generally categorize the development process into 4 phases: identification phase,
design phase, development/testing phase, and deployment phase [36].
• Identification phase: In this phase of the application development, informa-
tion, such as the features and time needed in the development or improvement
of an existing application, is discussed and documented [36].
• Design phase: In this phase of the development, the target distribution plat-
form is taken into account and an initial design of the application is compiled
with all the functionalities of the application broken down into various compo-
nents [36].
• Development/Testing: In the development phase, the different components
are coded and analyzed. In the testing phase, the application’s usability, func-
tionality, and consistency is tested to ensure software confidence. This is a
continuous process as the software is tested for various vulnerabilities that
could be exploited and patches are provided to fix them [12, 24, 14].
• Deployment phase: In this phase, the application is deployed to its respec-
tive distribution platforms for users to install on their devices. An application
distribution platform is a place users buy and install applications. There ex-
ist various distribution platforms and they include Amazon Appstore, App
Store(iOS), BlackBerry World, Google Play, and Windows store [35, 36].
2.3 Machine Learning
Machine learning is a field of study which enables computers to learn from data [3].
Studies of recent use various machine learning algorithms as techniques to identify
vulnerabilities in applications by extracting beneficial features. This recent trend is
due to the fact that the manual extraction of patterns to identify vulnerabilities in
software has proven to be tedious [37, 10].
• Supervised Learning: In supervised learning, the information fed to the
algorithms contains the labeled output which it learns with to make predictions.
Supervised machine learning models perform classification and regression tasks
and some models are able to perform both tasks [3].6 Chapter 2. Background
• Unsupervised Learning: In unsupervised learning, the information fed to
the algorithms is not labeled and the models are left to decipher the underlying
structure of the data.
2.3.1 Classification & Regression
• Classification: Classification is a supervised learning concept a model per-
forms to group a subject into different categories. A classification problem
could either be binary or multi-class. Binary classification groups data into
two categories (on/off, 0/1, true/false) while multi-classification groups into
multiple categories. An imbalance in classification occurs if one category has
more values than the other [3].
• Regression: Regression unlike classification, is a concept that is used in ma-
chine learning where the models predict numerical values such as weights. [3].
2.3.2 Machine learning models
Machine learning has been used as a technique to identify applications that pose a
security risk to users’ information and models such as random forest and k-nearest
neighbors have shown high accuracy in identifying risky applications.
• Random Forest: is an ensemble learning method that is used for classification
and regression. This method makes predictions by creating and merging mul-
tiple decision trees together and return the mode of results (for classification)
and the mean (for regression) [3, 8].
• K-Nearest Neighbors (K-NN): is a non-parametric learning method used
for both classification and regression and does this by observing variables. The
model then makes predictions based on similarity measures which account for
the distance between variables [3, 8].
2.4 Security Risk Assessment
Risk assessment is the identification and analysis of potential events that could impli-
cate the confidentiality, integrity, and availability of information resources on an asset
and the tolerance of such an event [32]. These events in mobile applications could
be as a result of vulnerabilities in the mobile application. A software vulnerability
is a flaw in a system that can be exploited by an attacker [12]. Certain standards
have been adopted by organizations to evaluate security risk with results produced in
either a qualitative or quantitative model. These standards include OWASP, EBIOS,
MEHARI, SP800-30(NIST), CRAMM, ISO27005 [24, 14].Chapter 3
Related Work
3.1 Similar Research Work
Due to the increasing trend of malicious activities in mobile applications, studies
have grown exponentially showing different approaches to assess mobile application
security. This section presents the related works in the area of this thesis.
In [29] by presenting an experimental study on a set of 64 applications, Asma
Hamed and Hella Kaffel Ben Ayed in their article titled “Privacy Risk Assessment and
Users’ Awareness for Mobile Apps Permissions” present a scoring model that assesses
the risk to users’ privacy while granting a set permissions required by an application.
They observed that the number of permissions requested by an application does not
influence the risk score while determining the maliciousness of an application.
Wei Wang et. al in their article titled “Detecting Android malicious apps and
categorizing benign apps with an ensemble of classifiers” use 5 machine learning
classifiers to categorize benign and malicious apps with the aim of easing the man-
agement of android app markets. They extract 2,374,340 features from each app to
create a large dataset and use those features to detect if the app is malicious or not.
In their experiment, they are able to identify malicious apps with an accuracy of
99.39%. They are also able to categorize apps with an accuracy of 82.93% [8].
Haoyu et.al in their article titled “RmvDroid: Towards A Reliable Android Mal-
ware Dataset with App Metadata” present an android malware dataset by taking
snapshots of the Google Play Store for 4 years and using VirusTotal to tag apps with
sensitive behaviors. In their approach, they monitor these apps on the Google Play
Store to see if Google removes them or not. They were able to create a dataset that
consists of 9,133 samples that belong to 56 malware families [4].
Jingzheng et. al in their article “PACS: Permission Abuse Checking System for
Android Applications based on Review Mining” present a permission abuse system
that classifies apps into different categories by considering app descriptions and users’
reviews as conditions for detection and using machine learning and data mining
techniques, it mines the patterns of applications in the same category and creates a
set of permissions. In their approach, they find that 726 out of 935 apps are abusing
permissions [5].
In the article “ Quantitative Security Risk Assessment of Android Permissions
and Applications” Wang Y et. al proposed a framework for quantitative analysis
of security on both android applications and permissions which was established on
request patterns from both benign and malicious applications with the aim of boost-
78 Chapter 3. Related Work
ing the efficiency of android permission systems. In their study, they compiled two
datasets which comprised of 27,274 benign apps from the Google Play Store and
1,260 android malware samples to evaluate the effectiveness of their framework [7].
Jose et. al in their article titled “Android Malware Characterization Using Meta-
data and Machine Learning Techniques” detect the patterns in malicious applications
by analyzing indirect features and metadata of applications. In their experiment,
they observe that permissions requested by an application only offer moderate per-
formance results and that other features such as the application developer, certificate
issuer, etc. are more relevant in detecting malware [6].
Pandita et. al in [25] present a framework using Natural Language Processing
that identifies the need for permissions requested by an application based on the in-
formation given in the application description. Their framework achieves an average
precision of 82.8% with an average recall of 81.5% for 3 permissions.
Aminordin et al. [10] in their study observed that apps in their category achieve
greater accuracy compared to non-category. Their observation was based on the
creation of a framework to detect malware on android applications using machine
learning classifiers. In their approach, they performed a static analysis of android
applications using their permissions, API calls, and the app category.
Yinglan Feng et al. in their article titled “AC-Net: Assessing the Consistency of
Description and Permission in Android Apps” propose a framework which identifies
the accuracy between permissions and their description by using Neural Networks,
they built a dataset comprising 1,415 popular android apps and extracted the de-
scription and permissions from 11 permission groups for evaluation. Their framework
records a receiver operating characteristic and a precision-recall curve value of 97.4%
and 66.9% respectively [17].
Zhou et al. in their study titled “Hey, You, Get Off of My Market: Detecting Ma-
licious Apps in Official and Alternative Android Markets” present a way of detecting
malicious apps from both the official and unofficial Android markets. In their study,
they crawled 5 android markets and gathered a total of 204,040 apps with the aim of
detecting known and unknown malware. They present 2 methods for analysis which
are permission-based and heuristics-base and their methods detected 211 malicious
apps and two zero-day attacks from both official and unofficial markets [18].
Enck et al. present a framework in their research titled “TaintDroid: An Information-
Flow Tracking System for Realtime Privacy Monitoring on Smartphones” that mon-
itors the behavior of 30 popular third-party android apps to identify applications
that transferring data to another destination. In their study, they observed that
two-thirds of the applications in their study, exhibit mishandling of sensitive data by
sending precise location, phones’ unique ID, phone number, etc. due to the permis-
sions granted during installation [13].
Jiayu Wang and Qigeng Chen Present a paper titled “ASPG: Generating Android
Semantic Permissions” which aims at identifying the relationship between application
description and the permission they request for. Their model is able to generate a
list of permission an application needs based on the description of the application
[31].3.2. Knowledge Gap 9 3.2 Knowledge Gap Studies have proposed reliable approaches to detect malicious applications but to the best of the author’s knowledge, none of the identified studies evaluate the security risk of installing mobile applications considering the permissions and an extensive list of other attributes on the app distribution platform. Therefore, it is believed that the contributions of this study will be substantial to the community.
Chapter 4
                                                                      Method

This chapter outlines the methods used to answer research questions tackled during
the course of the thesis. To answer RQ1, RQ1.1 and RQ2, A Literature analysis was
carried out and an experiment was conducted to answer RQ3.

4.1     Literature Analysis
Carrying out a literature review, the answers to RQ1, RQ1.1, and RQ2 were attained.
The intention behind selecting this method was to recognize the various methods and
techniques for evaluating mobile applications security, identify the machine learning
technique suitable for evaluating the security risk of installing mobile applications,
and investigate the application attributes that indicate the harmfulness of mobile
applications with the aim of understanding how they reveal a security threat.

4.1.1    Data Sources and Research Strategy
Results that aligned to the research questions were obtained using the papers re-
turned by the search strings in figure 4.1:

Figure 4.1: Boolean Search Strings

    These strings were applied when researching for papers on digital libraries; The
libraries used to extract relevant papers in the study are highlighted in table 4.1.

                                         10
4.2. Experiment 11 Table 4.1: Digital Libraries. Digital Library ACM Digital library BTH Summon IEEE Science Direct Semantic Scholar Springer 4.1.2 Criteria for selected studies This section highlights the process used to handle the selected papers for the study. The selection was done in distinct stages. It began with reviewing the abstract and title of archived papers, followed by reading through the full texts of all the individual papers that were related to the study. Backward snowballing (a search method for extracting studies on a topic) was also used to further source out for new studies to include from the reference list of a paper. Studies were excluded based on the following criteria: • The paper is not published. • The paper is not written in the English Language • It does not present methods to assess security risk in mobile applications 4.2 Experiment The results of RQ3 was obtained after an experiment was conducted. The motivation for choosing this method was to review how the selected attributes indicate the secu- rity risk of installing mobile applications and assess the performance of the selected techniques in evaluating the security risk of installing mobile applications. This method was also chosen due to its efficiency in providing performance measurement values as results which can be compared. 4.2.1 Libraries The libraries used during execution are illustrated in table 4.2 Table 4.2: Used Libraries. Library Version Scikit-Learn 0.22.1 Pandas 1.0.1 Numpy 1.18.1 Seaborn 0.10.1
12                                                                Chapter 4. Method

4.2.2          Experiment Design
The experiment is designed to compare the performance of the selected machine
learning techniques (K-Nearest Neighbors and Random Forest models) in assessing
the security risk of installing mobile applications. The models take the applications’
metadata and the security risk score and class of the applications obtained as a result
of the expert evaluation and compile them into a dataset. The models are evaluated
using k-fold cross-validation and analyzing the accuracy (in classification) and mean
absolute error(in regression).
    The independent variables of the experiment are the machine learning models
while the dependent variables are the performance of the models in evaluating mobile
application security risk score and class.

4.2.3          Used Approach
The experiment was carried out by creating a web scraping script1 that gathered
the metadata of 60 mobile applications from the Google Play Store on 12/03/2020
and saved them in a csv file. The applications were selected from a wide range of
categories shown in table 4.3. Table 4.4 shows the selected applications, Table 4.5
illustrates the details of extracted features obtained.

Table 4.3: Extracted Categories.

 Category                Number of apps
 Dating                  6
 Social                  16
 Entertainment           3
 Music & Audio           8
 Shopping                8
 Action                  2
 Arcade                  1
 Card                    1
 Racing                  1
 Roleplaying             1
 Casual                  1
 Simulation              4
 Word                    1
 Sports                  1
 Communication           4
 Tools                   2

     1
         https://github.com/Goz1/WebCrawler.git
4.2. Experiment 13
Table 4.4: List of Selected Applications.
List of Selected Applications in study
1 Perfect Piano
2 Paint By Number - Free Coloring Book & Puzzle ...
3 Akinator
4 SHEIN-Fashion Shopping Online
5 Love Messages for Girlfriend ♥ Flirty Love L...
6 Amino: Communities and Chats
7 Curvy Singles Dating - Meet online, Chat & Date
8 Sua Música
9 iQIYI – Movies, Dramas & Shows
10 Amazon Music: Stream Trending Songs & New Beats
11 AIMP
12 Bukalapak - Jual Beli Online
13 Hepsiburada
14 Tiki Shopping & Fast Shipping
15 eBay Kleinanzeigen for Germany
16 Trendyol - Hızlı ve Güvenli Alışverişin ...
17 ROMEO - Gay Dating & Chat
18 PinkCupid - Lesbian Dating App
19 EliteSingles: Dating App for singles over 30
20 Sverige Chat & Dating
21 Bale
22 WIPPY - When you need a friend nextdoor
23 VK — live chatting & free calls
24 Telegram X
25 Facebook Lite
26 All social media and social networks in one app
27 Snapchat
28 TikTok
29 Mad For Dance - Taptap Dance
30 Instagram
31 House Flip
32 Scrabble® GO - New Word Game
33 Moto Rider GO: Highway Traffic
34 Bullet League - 2D Battle Royale
35 Idle War: Legendary Heroes
36 Real Boxing – Fighting Game
37 Dragon City - Collect, Evolve & Build your Island
38 Dice Dreams
39 Property Brothers Home Design
40 Snake.io - Fun Addicting Arcade Battle .io Games
41 Cooking Fever
42 Solitaire Showtime: Tri Peaks Solitaire Free &...
Continued on next page14 Chapter 4. Method
Table 4.4 – continued from previous page
List of Selected Applications in study
43 Free QR code Scanner app
44 Radyo Kulesi - Turkish Radios
45 Smule - The Social Singing App
46 True ID Caller Name: Caller ID, Call Block
47 AliExpress - Smarter Shopping, Better Living
48 Kate Mobile for VK
49 OK
50 Samsung music
51 My Mixtapez Music
52 11st
53 Imo
54 Video chat - Oz Cam
55 Super Backup & Restore
56 Nymgo: Cheap VoIP International Mobile, Call I...
57 MobileVOIP Cheap international Calls
58 DateU Pro - Meet, Love & Date
59 WAVE - Video Chat Playground
60 SMOOTHY - Group Video Chat
Table 4.5: Details of extracted features.
Name Description Value
Name of App Name of application Alphabetical
Rating Ratings of applications Numeric
No of Installs Indicates the number of installs Numeric
Offered By Showing the developers of the app Alphabetical
Website Gives more detail about the developer(s) Alphabetical
Privacy Policy Describes the policy of the application Alphabetical
email Contact of the developer(s) Alphabetical
Permissions Requested permissions of applications Alphabetical
4.2.4 Expert Evaluation and Data Pre-processing
The expert evaluation presents the assessment of applications which determined the
security risk score and class of an application using risk assessment formulas. It was
implemented in an excel file taking into account the commonly requested permissions
as considered by recent studies [7, 17, 6] and shown in table 4.6, ratings, developers’
details, and the number of installs of each application and assigning them two values:
a risk factor according to assessment methods, and a weight factor between (0.0 and
1.0) which described the value of the attribute when evaluating security risk for
mobile applications.4.2. Experiment 15
Table 4.6: List of Evaluated permissions
Permission Protection Level
1 ACCESS_COARSE_LOCATION Dangerous
2 ACCESS_FINE_LOCATION Dangerous
3 ACCESS_LOCATION_EXTRA_COMMANDS Dangerous
4 ACCESS_MEDIA_LOCATION Dangerous
5 ACCESS_BACKGROUND_LOCATION Dangerous
6 READ_CONTACTS Dangerous
7 READ_PHONE_NUMBERS Dangerous
8 WRITE_CONTACTS Dangerous
9 RECORD_AUDIO Dangerous
10 BLUETOOTH Normal
11 BLUETOOTH_ADMIN Normal
12 SEND_SMS Dangerous
13 READ_CALL_LOG Dangerous
14 WRITE_CALL_LOG Dangerous
15 ANSWER_PHONE_CALLS Dangerous
16 CALL_PHONE Dangerous
17 READ_CALENDAR Dangerous
18 WRITE_CALENDAR Dangerous
19 ACCESS_WIFI_STATE Normal
20 CAMERA Dangerous
22 BODY_SENSORS Dangerous
22 READ_EXTERNAL_STORAGE Dangerous
23 WRITE_EXTERNAL_STORAGE Dangerous
The ratings of applications give a user the numeric estimation of what others
think of the said application. During the assessment, the ratings were assigned a risk
factor as shown in table 4.7 and a weight factor of (0.1).
Table 4.7: Rating Assessment.
Ratings value Description
0.0 - 3.0 1 An application with these ratings is not trustworthy
3.1 - 5.0 0 An application with these ratings is trustworthy
The number of installations gives a user an idea of the number of people that
trust the application well enough to install it on their device. Using the computation
described in 4.2, the numbers were scaled down to be in the range between (1 and
10). Applications that fell between (5 and 10) after the scaling was assigned the risk
factor of (0) while others were assigned (1) and the weight factor of (0.1).
It is understood that developers spend a fortune to secure their apps and to
assess the developer(offered by), a white-list comprising of developers/companies on
the Forbes list [28] was put together and applications were assigned a risk factor16 Chapter 4. Method
(according to the table 4.8) as a result of the companies/developers resources to
better secure their applications during its life cycle. The attribute was then assigned
a weight factor of (0.1) for each application.
Table 4.8: App developers Assessment.
Value Description
1 Default values for applications
0 If the application is developed by a well-known develop-
er/company (derived from Forbes list of top companies)
The developers’ details give more information about the developer(s) to a user.
App developers that provide information such as privacy policy, email address, and
website give users a means to reach them and can be deemed trustworthy and trans-
parent. These apps were assigned the risk factor of (0) while others without such
information were assigned (1) and a weight factor of (0.1) during the assessment of
each developers’ detail.
Applications come with varying numbers of permissions that are used to enforce
access control. Therefore to get the first value, each permission was accessed taking
into account the following:
• The permissions impact on confidentiality, integrity, and availability of infor-
mation (CIA).
• The permissions protection levels assigned by android systems as illustrated in
table 4.9.
• The security risk level describes how many resources the permission controls
as shown in table 4.10.
And was computed using the formula in 4.1 as described by [14, 33]. The results
were then normalized to fit a range from (0, 100) using the computation in 4.2 and
assigned a weight factor of (0.4) as the second value for each permission.
Pi = (Ii × Ti × Si ) (4.1)
Where Ii is the impact of each permission on Confidentiality, Integrity, and
Availability, Ti is the protection level and Si is the security risk level.
(Pi − Pi (min))(b − a)
Pi = a + (4.2)
Pi (max) − Pi (min)
Where Pi is the normalized value and [a, b] is the range.
Once all the values were assigned, the risk score of an application was evaluated
by multiplying the risk factor with the weight of factor for each application and
summing up the values for all the attributes as illustrated in the computation 4.3:
Ri = (Ai × Wi ) (4.3)4.2. Experiment 17
Table 4.9: App protection level assessment.
Protection level value
Normal 1
Dangerous 2
Signature 1
Table 4.10: App security risk level assessment.
Sec. Risk level Description
1 The permission allows access to a specific resource
2 The permission allows access to more than one resource
3 The permission allows access to multiple resources
Where Ai is the risk factor for each application, and Wi is the weight of the
attribute and the sum of the weights equals 1.
Taking account of the risk score assigned to each application, a class of either
high, medium, or low was then assigned to an application as illustrated in table 4.11.
The computation in 4.4 was used to ensure the scores were split into thirds. figure
4.2 shows the application attribute, risk score and class of 9 applications. The full
list can be found in appendix A.
Q = q(n + 1) (4.4)
Where q is the quantile, the proportion below the ith value and n is the number of
observations.
Table 4.11: Security Risk Class
assessment.
Class Range
High Ri > 20.0
Medium 9.5 < Ri ≤ 20.0
Low 0 ≤ Ri ≤ 9.5
Where Ri is the risk score of an application.18 Chapter 4. Method
Figure 4.2: Expert evaluation of applications
4.2.5 Implementation of the Machine learning models
The machine learning models were implemented in python using scikit-learn library
and comprised K-Nearest Neighbors and Random Forest implementations.
The models take the application attributes represented with the risk score and
class as variables and by encoding nominal labels, convert non-numerical values. If
the applications provide a privacy policy, email address, and a website, they were
assigned the values (1) else, they were set to (0). The number of installs and ratings
for applications were scaled down as described in the expert evaluation. The devel-
oper(offered by) was also labeled as explained during the assessment. If the appli-
cation had permissions corresponding to those being considered, they were assigned
the value (1) else they were assigned (0) after which they were split into training and
testing sets to evaluate their performance in classification and regression.
4.2.6 Evaluating the performance of the models
To assess the models, grid search hyperparameter tuning (which outputs the best
parameters for a model by running through a set of manually specified values) was
used since the models should return their best performances for regression and clas-
sification. This was followed by 10-fold cross-validation. The k-fold cross-validation
is a re-sampling method used to evaluate the effectiveness of a model on unseen data.
This method divides the set into a number of folds and handles the first fold as a
validation set and fits the remaining to the first fold [3].
In evaluating the efficiency of the models in regression analysis, the mean absolute
error(The average sum of all absolute errors) of the models were analyzed using the
computation in 4.5.
n
abs(y1 − λ(x1 ))
M AE = i=1 (4.5)
n
Where yi is the prediction and λ(xi ) is the true value.
To evaluate the accuracy of the models in classifications, the computation in 4.6
was used taking into account the following:4.2. Experiment 19
• True Positive Rate: describes the rate the values are correctly predicted for
a class.
• True Negative Rate: describes the rate the incorrect values are identified
for a class.
• False Positive Rate: describes the rate incorrect values are predicted as
correct for a class.
• False Negative Rate: describes the rate correct values were predicted as
incorrect for a class.
T Pi
T Pi =
T P i + T Ni
T Ni
T Ni =
T Ni + F P i
F Pi
F Pi = (4.6)
F P i + T Ni
F Ni
F Ni =
F N i + T Pi
k T Pi +T Ni
i=1 T Ni +T Pi +F Pi +F Ni
Accuracy =
k
Where k is the total number of classes, TP is the true positive, TN is the true
negative value, FP is the false positive values, and FN which is the false negative.
4.2.7 Distribution Analysis
To evaluate the significance in the samples, a hypothesis test was carried out using
the t-test which is a parametric test that identifies if there is a significant difference
between samples. However, the test assumes the distribution of samples is normal
and sample distribution analysis was used to examine if the assumption holds. His-
tograms and QQ plots of the samples were then created.
4.2.8 Mann-Whitney U test
The data samples of the experiment were compared using a Mann-Whitney U test.
A Mann-Whitney U test is a nonparametric test used to compare significance in
samples by ranking them and determining if the two sets are mixed randomly or
gathered on opposite ends. The test is performed on the samples using the formula
4.7:
n1 (n1 + 1)
U1 = n1 n2 + − R1
2 (4.7)
n2 (n2 + 1)
U2 = n1 n2 + − R2
220 Chapter 4. Method
Where n1 and n2 are the sample sizes, R1 and R2 are the ranks of the samples.
Moving forward, the two-tailed probability estimate, the p-value is realized based
on the U-values calculated. The significance level α is set to 0.05. This will ensure
that the statistical difference (if any is observed) did not occur by chance. If p > α
the null hypothesis is not rejected else if p < α the null hypothesis will be rejected.
The research hypothesis is stated as follows:
H0 : There are no significant differences between the models when implemented to
assess mobile application security risk based on publicly available information.
Ha : There is a significant difference between the models when implemented to
assess mobile application security risk based on publicly available information.
4.3 Validity
4.3.1 Internal Validity
Literature Analysis
The search strings used in gathering articles did not produce all the studies in the
research area and to battle this issue, snowballing was combined with the search to
improve the discovery of studies.
Experiment
The time used in gathering the attributes of mobile applications for assessment could
affect the results of the experiment. If the metadata of some applications were
manually documented on a certain date and others were documented on a later date,
the attribute values such as rating and number on installations might differ from
what they would have been if all were documented on the same day. To eliminate
this issue, a script was written which collected all the metadata on the same day and
saved them.
4.3.2 External Validity
Firstly, the applications studied only cover a small fraction of applications that can
be found on the Google Play Store. To reduce this threat, the applications were
selected from different categories as shown in figure 4.3 to guarantee wide coverage.
Furthermore, the expert evaluation of the applications was carried out by the
author which could lead to bias of the results. To reduce this bias and ensure gener-
alization, the expert evaluation of the application attributes adopted risk assessment
methods such as that provided by [1] and took account of the permissions protection
level assigned by Android. The machine learning models were implemented using the
mentioned libraries to improve external validity as it makes it possible to execute
outside the experiment. The implementation source code was vetted across docu-
mentation to ensure accuracy. The size of the samples amongst other factors makes
it challenging to determine the type of statistical test to employ. Using the sample4.3. Validity 21 distribution test and analyzing the Histogram and QQ plots of the samples improves the results.
Chapter 5
                                                Results and Analysis

This chapter presents the results of the study. The results of the literature analysis
are presented in 5.1 and the results of the experiment are presented in 5.2.

5.1     Results for Literature Analysis
The results of the literature analysis are presented in 5.1.1, 5.1.2, and 5.1.3 giving
answers to RQ1, RQ1.1, and RQ2. Table 5.4 presents a list showing the articles used
for the literature analysis.

5.1.1     Security Risk Assessment for Mobile Application.
Studies identify software vulnerabilities and evaluate the security risk of mobile appli-
cations using various assessment methods. These methods are generally categorized
into static analysis, dynamic analysis, and grey-box analysis as shown in figure 5.1.
Table 5.1 presents a summary of the studies that answered the research question.

Figure 5.1: Mobile Application Assessment Methods

Static Analysis
Static Analysis, also called white-box analysis, is the assessment of the source code of
software for vulnerabilities and is carried out without the execution of the program
[19, 38]. This method allows for careful evaluation of the structure of the program
to review it for privacy data leaks, permission misuse, vulnerabilities, and code ver-
ification [11]. It does not depend on compilers and compiler environments making

                                           22
5.1. Results for Literature Analysis 23
it possible to find errors that might surface years later. Control-flow analysis, data-
flow analysis, lexical analysis, and static taint analysis are techniques that fall under
static analysis [30, 12, 37, 38, 34, 37].
Dynamic Analysis
Dynamic Analysis, also known as black-box analysis, is another method of assessing
mobile applications for security flaws. It requires the execution of the program
being tested in a sandbox which replicates the exact environment of the application.
Various attacks are then simulated and the software is monitored to identify where
it might default. Techniques that adopt dynamic analysis include dynamic taint
analysis and behavioral analysis [19, 38, 34, 37, 9].
Grey-Box Analysis
Grey box analysis is a hybrid method used to identify software flaws and is a com-
bination of both static and dynamic. In this method of testing, the source code
of the application is partially known to allow for better development of test cases
Techniques that adopt dynamic analysis include regression analysis, pattern testing,
and matrix testing [11, 38].
Table 5.1: Security assessment methods summary table
Security assessment Methods References
Static Analysis [30], [12], [37], [38], [34], [37], [19], [11]
Dynamic Analysis [19],[38], [34], [37], [9]
Grey-Box Analysis [11], [38]
5.1.2 Machine learning techniques suitable for evaluating mo-
bile application security risk.
Machine learning has been used in various studies as a technique for analyzing soft-
ware security due to the difficulty of manually specifying and updating patterns for
other analysis methods. This has been attained by extracting static and dynamic
features and using them to train various machine learning models. The models iden-
tified as a result of the literature analysis include random forest, k-nearest neighbors,
support vector machine(SVM), logistic regression, decision trees [22, 8, 37, 15, 10,
9]. This study evaluates the performance of k-nearest neighbors and random forest
due to their performance and popularity as identified by studies. Machine learning
technique was therefore selected to examine its performance in evaluating security
and comparing the results with other studies. Table 5.2 presents a summary of the
studies that answered the research question.24 Chapter 5. Results and Analysis
Table 5.2: Machine learning techniques summary table
Machine learning techniques References
Support Vector Machine (SVM) [22], [8], [37], [15], [10]
K Nearest Neighbors (K-NN) [9], [8]
Logistics regression [15]
Decision trees [9], [15], [10]
Random Forest [9], [8], [10]
5.1.3 How attributes indicate the harmfulness of Mobile Ap-
plications.
Mobile application attributes such as the permissions, the application description,
review, number of installs, ratings, privacy policy, the developer, and the developers’
details uncover the likelihood of a security threat and the impact of the security
threat.
Permissions
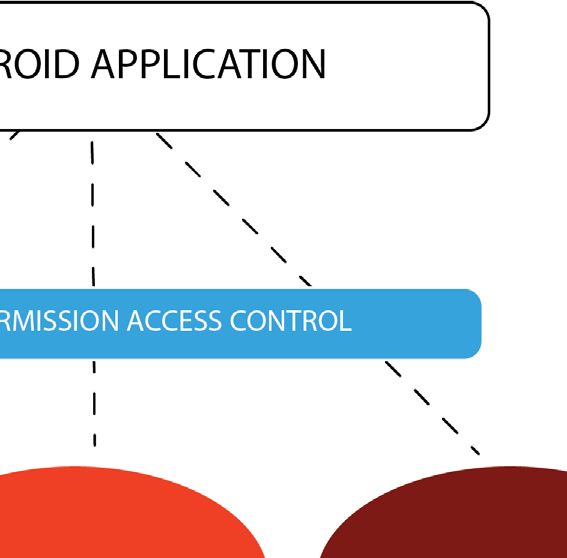
The permissions in the Android system are used to enforce access control i.e they
are used to access resources such as files and access to network settings. For mobile
applications to carry out their functions, they make requests for these permissions
which include API calls and file system permissions from a user’s device [5, 29, 39].
Android provides a security model to govern how mobile application developers
make such requests via the use of a permission model as shown in figure 5.2. This
model compels the app developers to declare the permissions they need to run their
apps in the “ Manifest.xml file” of their application which the app users will see
during install-time ( before the application starts running for android version 5.1
and below ) or run-time (while the application is being installed for android version
6.0 and higher) and are free to opt-out from granting them. However, most users
ignore or do not understand the impact of these permissions which could lead to
permission abuse, information leakage and many other malicious activities [5, 23,
39].
In investigating the permissions of an application, the amount of information that
could be exposed and the affected resources in the case of a security breach can be
revealed [5, 23, 39, 29, 37].
• Normal: These are permissions that pose very little risk to a users’ privacy
or operations on other apps and are granted automatically by the system [21].
• Dangerous: These are those permissions that requests for data or resources
that involve the users’ personal information and pose a high risk to the user.
These permissions can read and potentially write users’ data [21, 17].
• Signature: These are permissions that are granted by the system during install
time, but only does so when the application requesting them is signed by the
same certificate as the application [21].5.1. Results for Literature Analysis 25
Figure 5.2: Android access control model [23]
Application Description
The application description gives users information about the application. Appli-
cation developers are presented with this field to give structured information of the
application when launching it on the application distribution platform.
In reviewing the application description of an application, the functionality of
the application can be uncovered revealing the information that will be needed from
users shedding light on the resources that could be affected in the case of a security
incident [5, 17].
Application Review
The application review is a description of what users think about an application.
Users of an application are encouraged to review an application giving their opinion
of the application and this detail is displayed on the application distribution platform.
Investigating the review of an application reveals how trustworthy an application
is [5, 6].
Number of Installations
The number of installations of an application is a numeric description detailing the
number of users of an application. This information resides on the application distri-
bution platform and reviewing this detail describes the number of people that trust
an application well enough to install it on their device. It also describes the number
of people that will be infected in the case of a security incident [6].
Ratings
The application ratings are a numeric review of an application. Users of an appli-
cation are encouraged to rate an application and though this is done once, they are
free to update their opinion anytime and the average of all users’ ratings is displayed
on the application distribution platform.
Investigating the ratings of an application reveals how trustworthy an application
is [5, 6].You can also read