Vertical Integration of Platforms and Product Prominence
←
→
Page content transcription
If your browser does not render page correctly, please read the page content below
Vertical Integration of Platforms and Product
                           Prominence ∗

            Morgane Cure†               Matthias Hunold‡               Reinhold Kesler§
                       Ulrich Laitenberger¶                 Thomas Larrieuk

                                           July 30, 2021

                                               Abstract
          Meta-search platforms (MSPs) help consumers to compare product prices between
      different sales platforms. MSPs are often integrated with one of the sales platforms,
      which can give rise to self-preferencing. A case in point is the online hotel booking
      industry, where the major online travel agencies (OTAs) are integrated with MSPs.
      Studying web-scraped data from the MSP Kayak, we find indications that for a given
      hotel, the offers of affiliated OTAs (like Booking.com) are more visible than those of
      other OTAs with the same price. Moreover, hotels appear to be less prominent in
      Kayak’s search results when the rival OTA Expedia has the lowest price.

      JEL Classification: D22, D43, L11, L42, L81

      Keywords: meta-search, hotel booking, online travel agents, ranking, algorithm bias

∗
  We thank participants of the 14th Digital Economics Conference 2021 at Toulouse, the Online Seminar of
the Economics of Platforms, the 19th ZEW ICT Conference as well as participants of internal seminars in
Paris and Zurich. In particular, we thank Luis Cabral, Alexandre de Cornière, Marc Ivaldi, Anuj Kumar,
Martin Peitz, Greg Taylor, Thibaud Vergé, and Julian Wright for helpful comments. The authors alone are
responsible for the content.
†
  CREST, ENSAE Paris, Institut Polytechnique de Paris, 91120 Palaiseau, France; e-mail:
morgane.cure@ensae.fr. ORCID: 0000-0001-6569-5657.
‡
  University of Siegen, Unteres Schloß 3, 57068 Siegen, Germany; e-mail: matthias.hunold@uni-siegen.de.
ORCID: 0000-0002-4782-8177.
§
  University     of     Zurich,    Plattenstrasse   14,    CH-8032      Zurich,   Switzerland;    e-mail:
reinhold.kesler@business.uzh.ch. ORCID: 0000-0002-7020-6931.
¶
  i3, Telecom Paris, Institut Polytechnique de Paris, 91120 Palaiseau, France and CRED - Université Paris
II; e-mail: ulrich.laitenberger@telecom-paris.fr. ORCID: 0000-0002-7009-0190.
k
  CREST, Ecole Polytechnique, Institut Polytechnique de Paris, 91120 Palaiseau, France; e-mail:
thom.larrieu@gmail.com.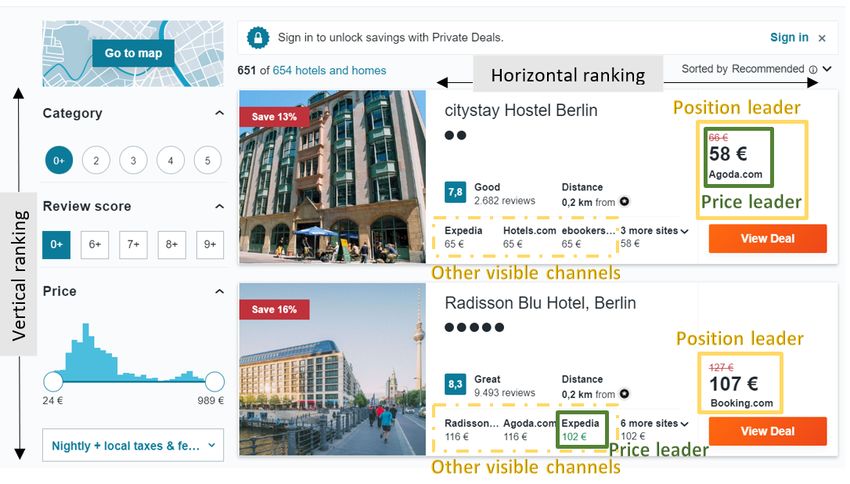
1    Introduction
Online platforms are an essential part of e-commerce. Their emergence promises substantial
advantages for consumers, especially in terms of transparency on offers and prices, low search
and distribution costs, and better matches between supply and demand. Nowadays, platforms
use complex algorithms to present product information to consumers. The way they function
is often opaque and the transparency of ranking criteria is the subject of intense policy
debates. An important issue is how vertical integration affects the presentation of information
on online platforms. Some of the prominent cases in point concern Google Shopping1 and
Amazon’s hybrid role as both a marketplace and a seller.2
    Focusing on online hotel booking, we study whether vertical integration between meta-
search platforms (MSPs) and online travel agents (OTAs) affects the meta-search results.
While OTAs account for most of the website-based hotel bookings, MSPs enable users to
compare the prices of hotels at different OTAs and on the hotel websites. There are significant
ownership links, as each of the two major OTAs Booking.com and Expedia is vertically
integrated with an MSP (Kayak and Trivago, respectively, cf. Section 5.1 for details).
    The relationship between hotels and OTAs has come under scrutiny with the different
national policies in Europe regarding the price parity clauses (PPCs)3 and academic research
(cf. Section 2). Much less visible in the debate is another important link in the chain of
this industry: meta-search platforms, such as Kayak, gather a large part of the offers from
different hotel booking websites and thus enable a price comparison both across hotels and
across sales channels for a given hotel. Although possibly somewhat overlooked, meta-search
is arguably economically relevant. For instance, according to figures for Germany for 2017,
hotel meta-search generated roughly 200 million euros compared to more than 800 million
euros for OTAs.4 Against the expectation that a key promise of price comparison websites is
to show consumers the best offers on the market, Booking Holdings’ acquisition of the meta-

1
    See European Commission - Case AT.39740 - Google Search (Shopping), 2017, https:
    //eur-lex.europa.eu/legal-content/EN/TXT/?qid=1516198535804&uri=CELEX:52018XC0112(01),
    last accessed June 22, 2021.
2
    See European Commission - Antitrust: Commission sends Statement of Objections to Amazon for the
    use of non-public independent seller data and opens second investigation into its e-commerce busi-
    ness practices, 2020, https://ec.europa.eu/commission/presscorner/detail/en/ip_20_2077, last
    accessed June 22, 2021.
3
    See, for instance, European Competition Network - Report on the monitoring exercise carried out in
    the online hotel booking sector, 2016, https://ec.europa.eu/competition/ecn/hotel_monitoring_
    report_en.pdf, last accessed June 22, 2021.
4
    See Bundeskartellamt - Sektoruntersuchung Vergleichsportale (Bericht), 2019, pp.            32-33,
    https://www.bundeskartellamt.de/SharedDocs/Publikation/DE/Sektoruntersuchungen/
    Sektoruntersuchung_Vergleichsportale_Bericht.pdf?__blob=publicationFile&v=7, last ac-
    cessed June 22, 2021.

                                                  1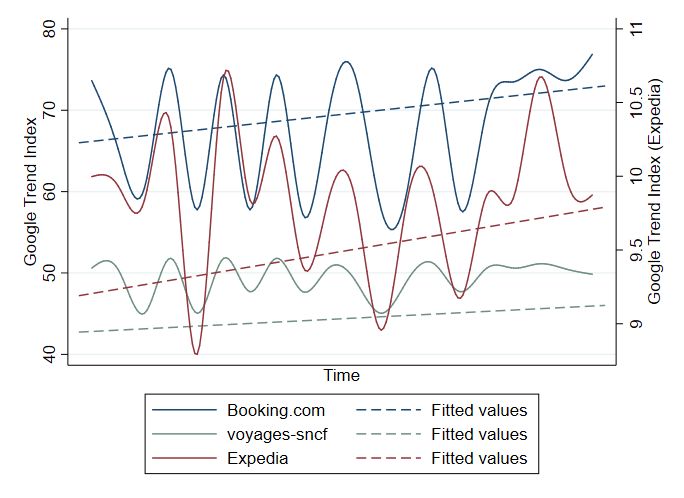
search platform Kayak in 2013 raised neutrality concerns about the ranking algorithm of sales
channels and products on Kayak. Some observers argued that Kayak may have the incentive
to promote Booking Holdings OTAs rather than the cheapest ones. Instead, the CEO of
Booking Holdings claimed: ”We won’t bias Kayak search results.” 5 Moreover, in January
2020, the Australian Competition and Consumer Commission (ACCC) concluded that the
meta-search platform Trivago had misled consumers by indicating that its website helped
them to identify the cheapest rates available for a given hotel while its ranking algorithm
gave preponderant weight to the cost per click paid by the sales channel.6
We study the effect of vertical integration between OTAs and MSPs on how the MSPs
ranks hotels and sales channels. For this, we use data collected between October 2014
and September 2017 from the meta-search platform Kayak for hotels in Paris. At that
time, Kayak already belonged to the Booking Holdings. The data comprises information
from about 1,800 Parisian hotels on room availability and prices on up to 22 different sales
channels and different time horizons, adding up to 17 million observations. We distinguish
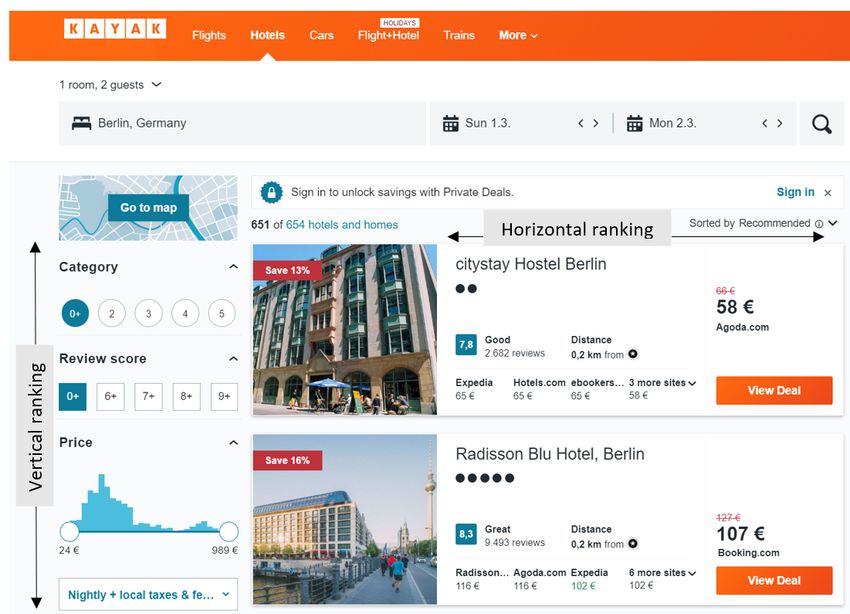
the horizontal ranking of sales channels for a given hotel and the vertical ranking of hotels
for given reservation and arrival dates (see Figure 1).
The horizontal ranking refers to the positioning of offers from different channels for a given
hotel. We study the hypothesis that offers of sales channels that are vertically integrated with
the MSP Kayak are more visible. Our analyses indicate that OTAs of Booking Holdings are
more often position leaders (i.e., highlighted sales channels on hotel offers) than price leaders
(i.e., among the cheapest sales channels). We primarily use linear regressions with fixed
effects on the hotel- and request-level and account for prices and popularity measures. These
indicate that the OTAs of Booking Holdings have a higher probability than other OTAs of
being among the visible providers and of being the highlighted sales channel. These results
are mainly driven by the two major OTAs Booking.com and Expedia.
The vertical ranking refers to the positioning of hotels in the search results. We study
the hypothesis that hotels which have higher prices on the Booking Holdings channels than
on other sales channels are more likely to be ranked worse in the Kayak search results. Our
regression analyses indicate that hotels are ranked worse by, on average, about eight positions
in the Kayak search results when an OTA of the Expedia Group is the cheapest sales channel.
We contrast this latter finding using data from an MSP that is not integrated with an
OTA – Google Hotels. Regarding the vertical ranking, we find that Google Hotels does not
5
See the article by Dennis Schaal (Skift) - Priceline CEO: We won’t bias Kayak search results, 2013,
https://skift.com/2013/05/10/priceline-ceo-we-wont-bias-kayak-search-results/, last ac-
cessed June 22, 2021.
6
See ACCC - Trivago misled consumers about hotel room rates, 2020, https://www.accc.gov.au/
media-release/trivago-misled-consumers-about-hotel-room-rates, last accessed June 22, 2021.
2Figure 1: Kayak rankings
assign a worse position to hotels which are cheaper on OTAs of the Expedia Group.
The rest of the article is structured as follows: Section 2 covers the related literature and
Section 3 provides background information on hotel meta-search platforms. In Section 4 the
empirical strategy is developed, and Section 5 introduces the data, descriptive statistics, and
preliminary evidence. Section 6 is devoted to the econometric results. Section 7 concludes.
2 Related literature
One relevant strand of theoretical literature studies the decisions of intermediaries to bias
product presentations by making certain products more prominent than others (Raskovich
2007, Inderst & Ottaviani 2012, Hagiu & Jullien 2011, 2014, De Corniere & Taylor 2014,
De Cornière & Taylor 2019, Hunold & Muthers 2017, Shen & Wright 2019). Hagiu & Jul-
lien (2011, 2014) specifically analyze biases in the rankings of search engines. In a setting
where customers have heterogeneous search costs and the platform has a per-click payment
scheme, Hagiu & Jullien (2011) predict distortions in the ranking in the sense that the less
suitable product is displayed first to generate additional revenue from the product providers.
De Corniere & Taylor (2014) show that integrated search engines distort search results, but
the overall welfare effect is unclear. For instance, the integrated search engine can have
a strong incentive to generate demand. Similarly, De Cornière & Taylor (2019) study bi-
3ased recommendations of intermediaries and show that if the payoff functions of sellers and
consumers are conflicting, bias can harm consumers. Hagiu et al. (2020) analyze an interme-
diary’s dual role of being both a reseller and marketplace. They contrast a ban of this practice
to other policies which restrict the imitation of products by third parties or steer consumers
toward the intermediary’s product. Using the example of a streaming platform, Bourreau &
Gaudin (2018) and Drugov & Jeon (2019) study incentives to bias recommendations to con-
sumers toward vertically integrated content. We contribute by providing empirical evidence
in support of these theories on the potential biases of recommendations.
Related empirical literature highlights the importance of the ranking by intermediaries in
the context of online hotel booking. Chen & Yao (2016), De los Santos & Koulayev (2017),
Koulayev (2014), Ghose et al. (2012, 2014) study how rankings affect consumer choices and
provide estimates of the US-dollar equivalent of a change in a hotel offer’s indirect utility for
a consumer resulting from a one-position increase in a hotel’s ranking (position effect). Ursu
(2018) exploits a random variation in the ranking of hotels at the OTA Expedia and also finds
significant position effects, albeit of a somewhat lower magnitude. She finds that consumers
are more likely to click on an offer that is ranked better to obtain detailed information on
it. However, conditional on seeing the detailed information, the ranking position does not
influence the booking behavior of consumers.
Our work is also related to the recent theoretical literature on the competitive effects of
price parity clauses of intermediaries, such as OTAs (Edelman & Wright 2015, Boik & Corts
2016, Johnson 2017, Wang & Wright 2020, Johansen & Vergé 2017, Ronayne et al. 2018,
Wals & Schinkel 2018, Mantovani et al. 2018, Hunold et al. 2020). Hunold et al. (2020) show
theoretically that OTAs may condition the rankings of hotels in their search results on prices
these hotels set elsewhere and thereby achieve the same effects as a price parity clause. Their
empirical evidence is consistent with OTAs that condition their rankings on the prices on
other channels. We show in the present article that the hotel ranking at an MSP may also
depend on the prices of the hotel offer at different OTAs.
Our analysis of meta-search sites’ product presentations relates more broadly to the lit-
erature on algorithmic bias from recommender systems and targeted advertising. For video-
on-demand, Zhang et al. (forthcoming) use a large-scale field experiment to show that the
recommender system of a profit-maximizing firm can reduce consumer surplus and welfare.
Lambrecht & Tucker (2019) run career ads on Facebook which are intended to be gender
neutral. However, they find that these are more often delivered to men. They provide sug-
gestive evidence that it is more expensive to show ads to women, which might explain the
allocation as a result of the algorithm’s minimizing costs.
43 Industry background
Online hotel booking and meta-search. Hotels can be booked through numerous dis-
tribution channels, both offline and online. In the last decade, the latter distinctively gained
in popularity (Cazaubiel et al. 2020). Three out of four website-based hotel bookings take
place on OTAs according to the European hotel association HOTREC.7 OTAs pool offers of
different hotels and display them through a ranking in response to a user’s search request,
typically composed of the destination, period, and amount of people travelling. Similar to
OTAs, hotel MSPs gather offers of different hotels. In addition, for each hotel, the MSPs
display the offers of various online sales channels, typically several OTAs and partly also
the hotel’s own direct channel (see Figure 2). Thus, MSPs provide a comparison service on
a more aggregate (meta-)level than OTAs without actually selling hotel rooms or posting
prices themselves (Hunold et al. 2018).
Figure 2: Money flows in the vertical hotel industry
*CPC: cost per click
Revenue generation in meta-search. While OTAs generate revenues mainly through
booking commissions, the revenues of hotel MSPs are generated by sending referrals to (ac-
tual) sales channels and advertising placements on the website.8 The revenues of MSPs are
7
See HOTREC - European Hotel Distribution Study 2020, 2020, p. 19, https://www.hotrec.eu/
european-hotel-distribution-study-2020/, last accessed June 22, 2021.
8
See, as an example for Kayak, Booking Holdings Inc. - Annual Report on Form 10-K for
the Year Ended December 31, 2019, 2019, https://ir.bookingholdings.com/static-files/
92c3d5b6-8f42-4686-afc1-f6bd61b94e06, last accessed June 22, 2021.
5realized either once a user clicks on a referral and an advertisement or upon completion of
the travel. Advertisers, be they OTAs or hotels, typically make bids for these placements
(see Figure 2 in green). These bids can be made dependent on various characteristics, such
as the user’s location, device, and dates.9 According to the sector inquiry of the German
competition authority (Bundeskartellamt) on comparison websites, the 14 surveyed hotel
meta-searchers report that the vast majority of their revenue comes from OTAs and the
most frequent remuneration modes are cost per order and cost per click (CPC), the latter
being the most important, ranging from a fraction of a cent to several euros per click.10
However, industry reports suggest a recent trend of OTAs pulling back from MSPs, while
hotels are turning to them.11
Aggregate revenues and visits of OTAs and MSPs. Almost every hotel meta-search
visit by a user results in a redirect to a sales channel.12 Thus, a presumably large share
of bookings originate at hotel meta-search websites. Their relevance is reflected in their
revenues and site visits. Hotel meta-searchers report:
• revenues of roughly 200 million euros compared to more than 800 million euros for
OTAs (data for 2017 in Germany); and
• 316 million website visits compared to 1.2 billion for OTAs (from November 2016 to
October 2017 in Germany).
This resonates well with global website rankings, where multiple hotel meta-search web-
sites are among the Top 50 in the travel category and are shown to be important referrers of
the major online travel agents.13
Main players and industry concentration. There is a rather high concentration with
a few large players, both at the OTA and MSP level. For Germany, in terms of visits and
revenues, Trivago has a share of more than 50 percent, followed by Google, TripAdvisor, and
Kayak.14 The surveys by HOTREC between 2013 and 2019 also suggest that these four MSPs
9
See, as an example, the bidding overview for Hotel ads on Google, where we expect other hotel meta-
search websites to work similarly, https://support.google.com/google-ads/answer/9244120, last
accessed June 22, 2021.
10
See p. 33 of Fn. 4.
11
See the article by Sean O’Neill (Skift) - The Surprising Rise of Ho-
tel Spending on Metasearch Advertising, 2019, https://skift.com/2019/07/25/
the-surprising-rise-of-hotel-spending-on-metasearch-advertising/, last accessed June
22, 2021.
12
This fact and the following numbers are taken from p. 32 and p. 33 of Fn. 4.
13
See Alexa - Global Top 50 Travel Websites, 2017, http://web.archive.org/web/20170804024015/
http://www.alexa.com/topsites/category/Top/Recreation/Travel, last accessed June 22, 2021.
14
See p. 33 in Fn. 4.
6are the most important in Europe.15 Although there are no figures on MSPs for France, we
expect a comparable picture as the general patterns for online hotel bookings are similar.16
Vertical integration of online hotel booking and meta-search. The leading OTAs
Booking.com and Expedia each acquired a major hotel meta-search platform (Kayak and
Trivago, respectively). Both acquisitions took place in 2013 with values of 1.8 billion and 632
million US dollars. They led to a vertical integration of major OTAs and MSPs (see Figure
2 in blue for the Booking Holdings case) in addition to an already present interdependence
among OTAs due to other (horizontal) acquisitions by the two major OTAs (also described
in Section 5.2).17
Interestingly, following the Kayak takeover, the CEO of the parent company of Book-
ing.com argued that Kayak ‘will not bias’ search results.18 The sector inquiry by the German
competition authority on comparison portals expresses concerns regarding the vertical inte-
gration of OTAs and MSPs as this could result in self-preferencing on the hotel meta-search
website with respect to its own OTAs and thereby a steering of users.19 However, the survey
among OTAs and MSPs apparently did not reveal such a bias.20
In our empirical analysis, we will systematically investigate possible self-preferencing in
the (actual) search results of the MSP Kayak by means of a large set of actual website data.
Display of offers on meta-search platforms. MSPs typically use two rankings to orga-
nize their websites. The vertical ranking refers to the top-to-bottom order of hotel offers in
the search results, which is similar to what OTA websites show. For each hotel offer, MSPs
often display some sales channels but hide others. We refer to this as the horizontal ranking.
For Kayak (and other MSPs), the horizontal ranking can be further divided into a prominent
sales channel, three further visible offers, as well as the remaining offers that are somewhat
hidden and denoted by ’x more sites’ (see Figure 1).
According to the Bundeskartellamt’s sector inquiry, Kayak ranks hotels worse if their
15
See p. 53 in Fn. 7.
16
See HOTREC - Hotel Distribution Study France, 2020, https://www.hotrec.eu/wp-content/
uploads/2020/07/Addendum-2020_European_Hotel_Distribution_Survey_France.pdf, last ac-
cessed June 22, 2021.
17
See the press releases by Booking.com (https://www.phocuswire.com/
Priceline-buys-Kayak-for-1-8-billion) and Expedia (https://www.phocuswire.com/
Expedia-pays-632-million-for-majority-stake-in-Trivago-let-the-travel-search-games-begin),
last accessed June 22, 2021.
18
See Fn. 5.
19
See p. 38 in Fn. 4.
20
See p. 50 in Fn. 4.
7average earning potential is low.21 The sector inquiry also reveals that meta-search websites
make the horizontal ranking of sales channels for one hotel dependent on bids, especially
when the prices of the respective hotel are the same. The MSP decides on the prominence of
offers based on the expected revenues, which may not coincide with the sales channels having
the lowest price.22
The hotel meta-searchers in the inquiry further claim that only in 80 percent of the
cases is one of the cheapest sales channels the most prominent.23 This has implications as a
significant share of users are reportedly clicking on the prominent spot even though cheaper
options exist (thereby steering customers). As a result, there may be tension between a
revenue-focused and customer-oriented presentation of hotel and sales channels prices.
The above observations on the prominence of sales channels are in line with that Trivago
was found to have breached the Australian Consumer Law for misleading customers. Rather
than prominently presenting, as advertised, the cheapest rates for consumers, instead, the
rankings were made dependent on the highest cost per click fees paid.24
4 Empirical strategy
4.1 Hypotheses
To develop our hypotheses, let us consider a stylized industry with one MSP and several
OTAs as well as several hotels. Each OTA and hotel decides which cost per click (CPC) it
is willing to pay to the MSP when a user clicks on the respective offer on the meta-search
page. Observing the CPCs and the popularity of the different channels, the MSP will decide
on the vertical and horizontal rankings.
Non-integration. As a benchmark, let us first consider the case of non-integration, i.e., no
ownership links between the MSP and OTA. We consider it plausible that an MSP maximizes
a weighted average of short and long-term profits. Short-term profit-maximization would
presumably focus on immediate revenues, determined by CPCs and the likelihood of a click
(possibly influenced by channel and hotel popularity). Long-term profit-maximization should
put more emphasis on repeated visits and thus search quality (consumer surplus).
In the horizontal ranking, the selection of visible sales channels differs between hotels.
We would expect more popular channels with higher CPCs to be shown more prominently.
21
See p. 91 in Fn. 4.
22
See p. 94 in Fn. 4.
23
See p. 95 in Fn. 4.
24
See Fn. 6.
8Other things equal, visible sales channels should have lower prices than invisible channels.
These conjectures are consistent with statements made by Kayak.25
For the vertical ranking, we would expect more popular hotels with more popular sales
channels to be shown more prominently. Higher CPC at the hotel-level (for example, for
the hotel website) might also lead to a better position of a hotel. This is consistent with
statements of Kayak whereby the earning potential of hotels plays a role.26
Vertical integration. Let us now consider the case where the MSP is integrated with one
OTA. Vertical integration may affect the horizontal and vertical ranking in different ways.
Integrated firms may agree on other internal transfer prices (through CPCs) than the typical
market prices. For instance, the OTA may pay a higher CPC to the own MSP, knowing that
the money remains in the integrated entity. Moreover, irrespective of internal transfer prices,
the objective function of the integrated business units (MSP and OTA) may take the joint
profit into account. In particular, the integrated MSP may take the booking commissions
into account, which the OTA obtains whenever a consumer books a hotel through the OTA
website. This may induce the MSP to show the OTA more prominently in the horizontal
ranking.
In summary, we expect an MSP to have incentives to favor the integrated OTA in its
horizontal and vertical rankings. This may be either because the integrated OTA pays
higher CPCs as a result of integration or because the MSP (partially) internalizes the OTA’s
booking commissions.27 For the horizontal ranking, the effects of these possible incentives
due to integration could arise as follows.
Hypothesis 1 (H1, horizontal ranking). Other things equal, the affiliated OTAs of a meta-
25
See ”How Kayak works,” in the version of December 6, 2018, available at https://web.archive.org/
web/20181206023556/https://www.kayak.com/company, last accessed June 22, 2021, Kayak states:
”Within a hotel listing, we order our results based on an internal algorithm that balances the prices and
our revenue for the results shown. If the cheapest offer is not displayed above the ”View Deal” or ”Select”
button, we highlight it in green in the central section of the listing.” During 2019, another sentence was
added stating ”Hotels shown on KAYAK are often available to book on several provider sites, each of
which will pay for clicks or bookings that they get via KAYAK.”
26
See ”How Kayak works,” in the version of December 6, 2018, available at https://web.archive.org/
web/20181206023556/https://www.kayak.com/company, last accessed June 22, 2021, Kayak states:
”In the specific case of hotels, the “Recommended” algorithm is based on a few key factors. The main
two rely on the hotel’s guest rating and its popularity (in terms of clicks). Hotels shown on KAYAK are
often available to book on several provider sites, each of which will pay for clicks or bookings that they
get via KAYAK. We also factor the average revenue potential of each hotel into our recommendations.”
This was later shortened to ”With hotels, the “Recommended” algorithm is based on a few key factors.
We mainly rely on the price, the hotel’s guest rating and its popularity (measured in clicks). We also
factor in the average revenue potential for KAYAK from each hotel result.”
27
Other effects of vertical integration may arise from changes in the behavior of other parties, such as the
other OTAs, hotels, and possibly other MSPs. We abstract from these here.
9search platform have a higher probability of being visible and are more likely to be a position
leader in the horizontal ranking.
For the vertical ranking of hotel offers, it is less obvious how incentives to favor an OTA
would materialize. An avenue is that the likelihood with which a consumer clicks on the
offer of a particular OTA may differ between hotels. For example, the integrated OTA may
have the lowest price for hotel X but not for hotel Y, relative to the prices of non-integrated
OTAs. Integration may then induce the MSP to show hotel X more prominently in the
vertical ranking, which presumably makes it more likely that consumers will click on the
offer of the integrated OTA and eventually book the hotel there.
Hypothesis 2 (H2, vertical ranking). Other things equal, the meta-search platform puts
hotels with higher prices on affiliated OTAs sales in a worse vertical position in its search
results.
4.2 Empirical model
Our empirical approach is twofold. First, we investigate how Kayak decides for each hotel
offer which sales channels to make prominent (horizontal ranking). Second, we investigate
whether Kayak takes the pricing and other factors related to the sales channels into account
when deciding which hotels to list first (vertical ranking). Let us describe both approaches
in more detail.
Horizontal ranking. To test H1, we estimate the following linear probability model for
an offer of sales channel s in hotel h for a request r:
Yhrs = Xhrs β + βh,r + εhrs . (1)
Yhrs is an indicator variable that takes the value one if the sales channel s for hotel h in
request r is a position leader and zero otherwise; Xhrs are explanatory variables, βh,r denotes
a hotel – request fixed effect. Xhrs includes the log-price of the sales channel, the number of
price leader(s) for the offer, the group affiliation of the sales channel, as well as sales channel
and hotel popularity that vary across time. The hotel fixed effects take time-invariant hotel
characteristics into account, such as the number of stars, amenities, chain affiliation, or
location. The group affiliation of the sales channel takes Booking Holdings as the reference
category. Therefore, if hypothesis 1 is true, we should observe a negative and significant
coefficient associated with other groups, suggesting that sales channels not affiliated with
Booking Holdings have a lower probability of being prominent. Although Yhrs is a binary
variable, we use a linear probability model (LPM) because this allows us to obtain consistent
10estimates while including a large number of fixed effects and interaction terms. 28 We report
findings of using non-linear models in Appendices E.2 and F.2 and discuss them along with
our findings in Section 6.
Vertical ranking. For a given search request, Kayak provides a list of the available hotel
offers. From the perspective of pure consumer surplus maximization, we would expect that
the rank of a hotel in that list should be better if the hotel’s gross match value for the average
consumer is higher. This value should increase in the number of stars, the user rating, free
breakfast, and so on. Given the gross value, the sales channels’ prices should negatively affect
the ranking as, other things equal, a higher price should mean a lower net match value for
the average consumer. If Kayak cares for its short-term revenues from cost per click fees, it
presumably incorporates the likelihood of a click (which might depend negatively on prices
and positively on quality) as well as the cost per click fees.
To test H2, we estimate the following linear model for a hotel h in a request r:
− Rhr = Zhr κ + αh + γr + hr . (2)
Rhr is the ranking position of a hotel h in the Kayak search results. As a higher value of
R reflects a ”worse” rank, we multiplied the dependent variable with −1 to allow a similar
interpretation as with the horizontal ranking analysis. Zhr includes the minimum log-prices
of the sales channels available for this hotel, the group affiliation of the price leader, as well
as the average popularity of all sales channels available for this hotel and the hotel popularity
that both vary across time. Compared to the horizontal ranking, we additionally control for
sales channel availability for the hotel including group availability indicators and the number
of sales channels. Hotel (αh ) and request (γr ) fixed effects are included separately (different to
the horizontal ranking analysis). The group affiliation takes the form of several indicators, one
for each group, taking the value one if the group is among the price leaders. Therefore, under
hypothesis 2, we should observe a negative and statistically significant coefficient associated
with the dummy variable of the Expedia Group and/or other OTAs. This would suggest that
if a group other than Booking Holdings is among the price leaders, then the hotel is ranked
worse in the Kayak search results.
28
Using the LPM further allows us to easily correct for heteroskedastic standard errors. Moreover, the LPM
has a reduced computation time and enables a straightforward interpretation of the implied marginal
effects from our parameter estimates. This is especially relevant when we perform interactions with
other variables, such as chain affiliation, to explore effect heterogeneity: the interaction term in nonlinear
models generally does not identify the partial cross-derivative, as discussed in Ai & Norton (2003).
114.3 Identification
Unobserved demand shocks. A concern could be that a demand shock may impact
both the prices of sales channels and the ranking on the MSP. For instance, an increase in
demand could lead to a stock-out of cheaper hotels, such that only hotels with a higher price
remain in the list of search results and subsequently get a better ranking. We deal with this
concern by adding request fixed effects γr (or request-hotel fixed effect βhr ) which capture
the effects linked to the combination of the booking and arrival date (and thereby also the
booking horizon).
Unobserved heterogeneity in hotel popularity. If the MSP expects higher revenues
from a hotel, it has an incentive to rank the hotel better – other things equal. Higher revenues
can be due to either a higher CPC paid by the hotel (see below) or a higher likelihood of
a hotel being clicked on (measured by the click-through-rate, CTR). For instance, if hotels
with a lower CTR typically have lower prices on other sales channels affiliated with the MSP,
we could get a spurious positive correlation between a bad ranking position and the price
markup relative to other channels. We deal with this unobserved heterogeneity across hotels
by removing time-constant unobserved heterogeneity between hotels through the inclusion of
hotel fixed effects (and even hotel-request fixed effects in the case of the horizontal ranking).
We control for temporary deviations in hotel popularity using short-term consumer ratings
from TripAdvisor for each hotel.
Unobserved heterogeneity in sales channel popularity. Similar to the argument
of unobserved hotel popularity, the MSP should take into account that consumers might
have a preference for specific sales channels. The popularity of sales channels could follow
seasonal patterns and unobserved trends initiated by marketing activities at the different
sales channels. If an OTA affiliated with the MSP is increasingly popular and its popularity
is then associated with higher prices, a good ranking position of the OTA could be spuriously
correlated with the common ownership of OTA and MSP. To mitigate this concern, we use
data about the current relative search volume of each sales channel on Google in France as
a measure for the different popularity and associated CTR.
Unobserved channel and hotel-specific CPC. For the rankings, the MSP potentially
also takes CPC payments of the different sales channels into account. These might vary
between hotels as well as across time and might affect both the pricing across channels and
the ranking position of the hotel on the meta-search platform. For instance, when paying
a higher CPC for the direct channel, the hotel might increase the direct channel price to
account for the higher distribution costs. Better visibility of the direct channel would then
be driven by the higher CPC and would drive our ‘direct channel’ coefficient up in equation
1. It might also distort the price coefficients if the CPC changed the channel-specific prices.
12Similarly, it could be that OTAs negotiate different CPCs for specific types of hotels. To
deal with these potential problems, our approach is twofold.
First, we conduct a comparable analysis using data for the same city and observation
period of another MSP, namely Google Hotels. This platform is, at the time of our study, an
independent MSP that is not integrated with an OTA. Google Hotels is likely to be affected
by similar heterogeneity in the promotional behavior of hotels over time, like Kayak. If we
only find that Booking Holdings offers are only given more prominence on Kayak but not
on Google Hotels, this is consistent with our hypothesis of joint profit-maximization in the
Booking Holdings.
Second, we conduct complementary analyses using the Kayak data. We expect that CPCs
for independent hotels, at least, are relatively constant over time at Kayak, as independent
hotels have to make use of an intermediary to list their rooms on the MSP. As the CPC
conditions for chain hotels could be more flexible, we run the analyses separately for inde-
pendent and chain hotels. This also provides insight into potentially different CPCs paid by
OTAs depending on the hotel type.
Moreover, it is noteworthy that what should matter in theory for the incentives of an
integrated entity with an OTA and an MSP is the overall profitability – consisting of both
CPC at the MSP and booking commissions net of CPCs at the OTA. Hence, the level of
CPC that the integrated OTA pays the integrated MSP is anyway of limited informational
value for studying the effects of vertical integration.
5 Data
In this section, we present the data set and its main characteristics along with a classification
of sales channels and a conceptualization for the display of prices and offers.
5.1 Collection and features
Data collection. For our analysis, we mainly rely on data comprising hotel and channel
rankings on Kayak, plus prices that hotels post on different channels. As control variables, we
need data on the characteristics of hotels and channels which can explain their attractiveness
for consumers as well as data on their determinants of the profitability of an hotel offer
for Kayak. The data was collected as described in Larrieu (2019) from October 2014 to
September 2017 on Kayak.com.29 In particular, 2,375 search requests were made for 410
29
Search results were collected every day from 6am–8am using a web-scraping program from a Windows
desktop. IP addresses were randomized in each iteration using a list of French IPs located in the region
of Paris. For each iteration, the cache of the browser was cleared of all cookies and historical searches
13distinct reservation dates for one night for two people with different time horizons (mainly 4,
14, 30, and 180 days before arrival).30 We also collected TripAdvisor information on hotels’
characteristics and reviews over time. Moreover, we retrieved time series data from Google
Trends for our observation period to approximate the sales channel popularity (see Appendix
A for a description).
We now describe the hotels in the data set as well as characteristics of the data set used
for the analyses.
Table 1: Descriptive statistics
Variable # Obs. Min p50 Mean Max SD
Hotel characteristics
Stars 1,784 0 3 3.2 5 0.9
Chain 1,784 0 0 0.3 1 -
# Rooms 1,784 1 45 76 1,093 98
# Reviews 1,716 1 142 173 4,659 225
Score 1,716 2.6 4.3 4.3 4.7 0.2
Time-varying variables
Hotels per request 2,375 27 1,111 933 1,222 319
# Offers per hotel 2,174,571 1 7 8 22 4
Price 17,002,174 3 155 183 10,000 124
Hotels in the data set. Our data set contains 1,784 distinct hotels which are in the
greater Paris area. In the upper panel of Table 1, we provide various hotel characteristics.
Hotels in our data set have, on average, 76 rooms and three stars. Overall, 30% of the hotels
are affiliated with a chain, the most prominent ones being Ibis Hotels, Best Western, and
Mercure (see Table 11 in Appendix B). As shown in Table 12 in Appendix B, hotels with one
to three stars have, on average, 62 rooms, while four- and five-star hotels have an average of
104 rooms.31 For the time-varying hotel characteristics, we report the number of reviews and
the average consumer rating on TripAdvisor at the moment of the reservation as a measure
for hotel popularity. For the reservation date, hotels in our data set received, on average, 173
reviews with an average rating of 4.3 out of 5.
Ranked hotel and channel offers. In the lower panel of Table 1, we show descriptive
statistics on the hotel offer level. The number of hotels in the search results ranges between
27 and more than 1,222 with an average of 933 hotels which have between one and 22 different
to appear as a new user without any personalization that may affect the Kayak ranking algorithm.
30
The data set is not balanced since not all existing reservation dates were queried with all possible time
horizons. However, 80% of reservation dates were queried with at least five distinct time horizons. Other
time horizons were collected in order to account for intertemporal price discrimination following revenue
management and are kept in the analysis.
31
This is consistent with French statistics on the hotel industry by INSEE, see INSEE website.
14online sales channels. On average, for each hotel, eight sales channels display an offer. In
total, our data set contains more than 17 million observations. The average price for one
night is 183 euros32 and is negatively correlated with the time horizon.33
Sales channels in the data set and ownership. We observe 828 distinct sales chan-
nels, most of which comprise direct channels by hotels. We distinguish between hotels’ direct
channels and online travel agencies. For the OTAs, most of them are linked to two different
groups. On the one hand, the Expedia Group owns different OTAs (Expedia.com, Classic
Vacations, Hotels.com, Hotwire.com, Venere.com, and Egencia), is affiliated with some travel
companies (voyage-sncf.com, Abritel HomeAway, Travelocity, and Orbitz – including ebook-
ers, HotelClub and CheapTickets), and has Liberty Media as its parent company, which is the
main shareholder of TripAdvisor. On the other hand, Booking Holdings Inc. owns and oper-
ates several travel meta-search platforms, OTAs and other travel websites, including Book-
ing.com, Priceline.com, Agoda.com, Kayak.com, Cheapflights, Rentalcars.com, Momondo,
and OpenTable. The remaining sales channels are either competing OTAs such as HRS.com
and smaller ones (Presitiga, Melia, Hotelopia.com, HotelsClick, Amoma.com (bankrupt since
2019), Weekendesk, Lastminute group, etc.) or linked to French national companies in the
travel sector (Tablet as part of the Michelin guide, Splendia owned by the online platform
Voyage-Privé.com). In addition, there is a large national player, AccorHotels.com, hosting
the majority of the big brands (Ibis, Mercure, Novotel, etc.) in France. It offers hotels the
chance to appear on its own platform in exchange for a commission. Therefore, AccorHo-
tels.com has a strategy of offering both its own brand hotels but also independent ones on its
platform. We do not consider some particular offers (8%) for which Kayak is mentioned as a
sales channel because we do not observe the identity of the sales channel really mediating the
transaction. We finally classify sales channels depending on their group affiliation (Booking
Holdings and Expedia Group), thereby distinguishing independent sales channels between
online travel agencies (‘Other OTAs’) and the hotel direct channel (Table 2).
32
We observe some extreme prices of up to 965,832e in the data set. To remove outliers, we restrict the
sample to prices lower than 10,000e, which is large enough for the price of an hotel room for one night
in Paris even in a Palace category. This leads to a drop of 28 observations.
33
The average price is strictly decreasing as the arrival date approaches, from 189e at 6 months before
the arrival to 182e, 180e and 178e respectively for one month, 14, and 4 days before the arrival date.
15Table 2: Sales channels’ availability and classification
Group # obs % in obs Sales channel # obs % in obs
Booking.com 1,899,278 40%
Booking Holdings 4,804,339 28% Agoda.com 1,487,904 31%
Others 1,417,157 29%
Hotels.com 1,713,173 25%
Expedia.fr 1,397,825 21%
Venere.com 1,315,041 19%
Expedia Group 6,747,875 40%
Voyages-sncf.com 995,594 15%
Ebookers.com 708,853 11%
Others 617,389 9%
Amoma.com 737,503 15%
Hotelopia.com 691,228 14%
Logitravel.fr 561,550 12%
Other OTAs 4,856,541 29%
HotelTravel.com 479,809 10%
Rumbo.fr 448,225 9%
HRS.com 316,822 7%
Others 1,621,404 33%
Direct channel 593,419 3% ...
(e.g. hotel website)
Total 17,002,174 100%
5.2 Descriptive statistics
In this subsection, we first describe the concentration of offers among specific sales chan-
nels. We then investigate price dispersion and price leadership and compare their respective
occurrence by group and sales channels.
Distribution of offers across sales channels. The market is concentrated with seven
large OTAs covering 60% of the offers, while 800 small sales channels only account for 5% of
price offers (2). The top seven OTAs include Booking.com, Expedia, Hotels.com, the national
player voyages-sncf as well as the smaller platforms Agoda and Venere. The direct channel
(hotel websites) only accounts for 3% of the sales channel observations. Behind the apparent
diversity of sales channels in the market, the two big groups account for 70% of price offers
displayed by Kayak. Other OTAs account for 29% of the offers, translating in total to the
same weight as Booking Holdings alone. We also note that the direct channel of the hotel is
rarely available.
Price leader(s). For a given hotel, we define the price leader(s) as the sales channel(s)
offering the lowest price (see Figure 3 in green). In 62% of the hotel offers, the price leader
is unique, meaning that there is a strictly lower price than others. In the remaining 38%,
several sales channels (up to 15) offer the same cheapest price. Different price leaders can be
affiliated with the same group. At this level, there is a unique group price leader in 72% of
16the cases (Table 3).
Table 3: Number of price leader(s) at the sales channel and group levels
# Sales channel(s) Freq. Percent # Group(s) Freq. Percent
1 1,303,460 62% 1 1,505,549 72%
2 166,252 8% 2 403,855 19%
3 182,218 9% 3 151,146 7%
≥4 441,475 21% 4 32,855 2%
Total 2,093,405 100% Total 2,093,405 100%
Even though the hotel’s direct channel is not often among the sales channels, when
available it is actually one of the cheapest providers in 53% of cases, more than the main
online travel agencies Booking.com (37%) and Hotels.com (37%). This also holds at the
group-level (Table 4). When only considering cases in which there is a unique price leader
among the sales channels, the direct channel of hotels is most often (54%) the cheapest
channel compared to any other OTA. In comparison, when two sales channels both have
the lowest price, Booking Holdings has a higher probability (44%) of being among them
compared to other groups.
Table 4: Price leadership given availability by number of price leader(s)
# Sales channel(s) All 1 2 3 ≥4
price leader(s)
Direct channel 53% 54% 18% 38% 68%
Booking Holdings 37% 10% 44% 61% 87%
Expedia Group 32% 7% 13% 67% 89%
Other OTAs 23% 14% 16% 18% 26%
As Kayak is a price comparison website, we expect the sales channels with the lowest
prices to be more visible than others. In particular, we expect a unique price leader to
typically be most prominent (the position leader). To investigate this, we now relate the
price leader frequencies to visibility and position leader frequencies.
5.3 Ranking decisions
Horizontal ranking. For each request, Kayak as a meta-search website lists the offers of
different hotels (vertically). For a given hotel, Kayak displays the offered price of different
sales channels (horizontally). One sales channel is highlighted and three others are visible
but less prominent (see Figure 3 in yellow), while the remaining sales channels are hidden
in a submenu which consumers have to click on if they want to see them. We define the
17Figure 3: Rankings and classifications
highlighted sales channel as the position leader.34
While several channels can simultaneously be price leaders, there is always a unique
position leader. Overall, in 96% of the hotel offers, the position leader is among the (possibly
multiple) price leaders and this proportion increases with the number of price leaders. In
more than 30% of the cases, there are multiple price leaders. When the position leader is
not the unique price leader, the channel belongs to either the Booking Holdings or Expedia
Group in 81% of the cases, with Booking Holdings comprising 43%. Table 5 shows that the
OTAs of Booking Holdings are more often (12%) the position leader than the price leader –
the difference being six times greater for Booking Holdings compared to the Expedia Group.
In contrast, compared to Booking Holdings, the direct channel of the hotel appears less often
in the first position although it is five times more often cheaper.
Table 5: Price vs Position leadership given availability
Group Position Unique Price Difference
leader leader
Booking Holdings 22% 10% 12%
Expedia Group 9% 7% 2%
Other OTAs 11% 14% -3%
Direct channel 38% 54% -16%
34
It is also called the sales channel in the buy box, especially in the retail industry.
18As the entire group does not necessarily reflect the case of each single OTA, we compare
the share of price and position leaders at the sales channel-level in Table 13 of Appendix
C. The results are even more pronounced as Booking.com is five times more the position
leader than the price leader. For other OTAs, the results are less conclusive. Hotels.com and
Expedia.fr are more often the position leader than the price leader, but still to a lesser degree
than Booking.com while other OTAs are always less often the position leader than the price
leader.
Kayak claims that it bases the ranking on customer popularity or ratings (see Section 3).
Thus, an explanation of the discrepancy between price and position leader could be that the
channels with an outstanding prominence at Kayak are particularly popular in France. If
Kayak values the popularity in the horizontal ranking algorithm, it would make them visible
more often compared to a ranking based on the cheapest price. Table 10 in Appendix A shows
that Booking.com and Expedia.fr are indeed relatively more popular than others. However,
this does not hold for Hotels.com. Another explanation for the particular prominence may be
that specific sales channels (OTAs as well as hotels) pay more to be placed more prominently
(we will come back to this point).
Vertical ranking. Besides choosing how to rank the offers of different sales channels
by one hotel horizontally, Kayak also decides how to rank the hotels vertically in the search
results. Table 6 describes how the position of a hotel varies with price leadership across sales
channels. We report the average position of the first hotel appearing in the search results for
which the respective sales channel (or group) is the unique price leader. For instance, the first
hotel with the channel Booking.com being the unique price leader is shown on Kayak at the
26th position on average, which is much more prominent than for hotels for which Expedia.fr
is the unique price leader, where such a hotel offer is shown first only at the 375th position
on average. We observe a similar pattern when aggregating the offers to the group-level. For
instance, while the first hotel offer, where an OTA of Booking Holdings has the lowest price
appears on average on the 18th position, the first offer where an OTA of the Expedia Group
is the cheapest appears, on average, only at the 38th position. These statistics indicate that
offers of OTAs by the Expedia Group are less likely to be shown, as hotels with the strictly
lowest price on such OTAs are less prominent. However, these patterns do not take into
account that some channels may be less visible than others, and that channel availability
could be correlated with hotel popularity, which we will address in our regression analyses.
19Table 6: First hotel position with unique price leader by channel
Group Position SD Seller Position SD
Booking.com 26 63
Booking Holdings 18 56 Agoda.com 47 61
Direct 15 55 Direct 15 55
Expedia.fr 375 330
Hotels.com 260 309
Expedia Group 38 87 Voyages-sncf 286 329
Venere.com 392 338
(...)
Amoma.com 41 109
Hotelopia.com 185 218
Other OTAs 6 23 Logitravel.fr 36 82
(...)
6 Estimation results
6.1 Horizontal ranking
In Table 7, we report the estimation results for the model described in equation 1. The
dependent variable is in column (1) the probability of being visible (among the four first
sales channels) and in column (2) the probability of being a position leader.
A higher price reduces the probability for a sales channel to be visible. For a hotel, a
sales channel has a higher probability of being visible if it offers the cheapest price together
with other sales channels (multiple price leaders) and this effect is twice as large if the sales
channel is the only one to offer the cheapest price. Turning to the position leadership of sales
channels (column (2)), the results on visibility and position leadership are similar. While
the price level is particularly important for the visibility of a sales channel, being the unique
price leader appears to be particularly relevant for becoming the position leader.
With respect to the ownership of sales channels, we find that, other things equal, sales
channels not affiliated with Booking Holdings are less likely to be visible. Furthermore, we
find that OTAs not belonging to Booking Holdings have a lower probability of being the
position leader. The finding that the direct channel has a higher probability of being visible
than OTAs of Booking Holdings emerges once controlling for the popularity of sales channels
is an average result. This may be the result of hotels possibly having to pay relatively high
CPCs for their direct channel which may lead to financial incentives of the MSP to make
them more prominent.35
35
If we exclude cases from the sample where an OTA of Booking Holdings is the price leader, the direct
channel is the position leader in 53% of the cases compared to 32% and 13% for the Expedia Group and
20Table 7: Visibility and Position Leadership at the group-level
Linear Probability Model
Visible Position Leader
(1) (2)
ln(price) -0.86 ∗∗∗ -0.02∗∗∗
(0.00) (0.00)
Price leadership
(ref: Not price leader)
Among price leaders 0.37∗∗∗ 0.21∗∗∗
(0.00) (0.00)
Unique price leader 0.36∗∗∗ 0.81∗∗∗
(0.00) (0.00)
Group
(ref: Booking Holdings)
Direct channel -0.01∗∗∗ 0.02∗∗∗
(0.00) (0.00)
Expedia Group -0.11∗∗∗ -0.07∗∗∗
(0.00) (0.00)
Other OTAs -0.05∗∗∗ -0.03∗∗∗
(0.00) (0.00)
Constant 4.78∗∗∗ 0.11∗∗∗
(0.01) (0.00)
Hotel × Request Fixed Effects yes yes
Channel Popularity yes yes
N 15,495,039 15,495,039
Notes: Dependent variable: indicator sales channel visible (column 1) or posi-
tion leader (column 2). Unit of observation: search request – hotel – channel.
Linear regressions include hotel – request fixed effects. Standard errors (in
parentheses) are robust to heteroscedasticity and adjusted for serial correlation
inside clusters. ∗ p < 0.1, ∗∗ p < 0.05, ∗∗∗ p < 0.01
Chain affiliation. 30% of hotels in the data are affiliated with chains (see Table 1),
and chain affiliation may play a role on meta-search platforms as well as at OTAs: Chains
may have better bargaining power and generally benefit from an increased visibility thanks
to chain-level websites. We therefore estimate the same models including a chain indicator
and compare the results. We report the results in Table 16 in Appendix E.1. We find that
the results are comparable to the baseline findings, with the exception of the effect related to
the direct channel of hotels. Interestingly, other things equal, this sales channel has a lower
probability of being visible than one of Booking Holdings, which is mainly due to hotels
affiliated with a chain.
Sales channel-level. We also conducted the analyses at the sales channel-level, which
other OTAs, respectively.
21could disguise different signs within a given group. For instance, the Expedia Group contains
highly popular platforms in France, such as Voyages-sncf or Expedia, but also others that are
not as popular, such as Venere.com. Similarly, Booking.com and Agoda.com are of different
popularity as well. Despite controlling for channel popularity, the estimated effects may be
different as popular platforms may drive the overall effect at the group-level. Table 17 in
Appendix E.1 contains estimation results regarding the horizontal ranking from Table 7 at
the sales channel-level. The reference category for the sales channel affiliation is Booking.com.
One can see that the effect is driven by Booking.com being more visible, while Agoda.com
as the other sales channel of Booking Holdings has a lower probability of being visible with
a similar magnitude to other OTAs. Therefore, it seems that Kayak gives Booking.com
particularly more prominent placing and not necessarily other sales channels of the group.
Results on visibility and position leadership are very similar.
Robustness. We report in Appendix E.2 the results of using different estimation tech-
niques. The results of using a probit and logit model (without hotel fixed effects but with
time-constant hotel characteristics) in Table 18 do not qualitatively change. We have esti-
mated in addition a conditional logit model and find that results differ slightly in that the
direct channel is less likely to be the position leader than Booking Group OTAs (Table 19),
and accordingly sales channels of chain-affiliated hotels generally seem to have a lower prob-
ability of being visible (Table 20). Results from the analysis at the sales channel-level (Table
21) are as before.
Finding 1 (Horizontal ranking). Other things equal, sales channels belonging to the Expedia
Group or independent OTAs have, on average, a lower probability of being visible or of being
the position leader than sales channels belonging to Booking Holdings.
6.2 Vertical ranking
We report estimation results for Equation 2 in Table 8. The dependent variable is the ranking
position of a hotel in the search results, multiplied by −1. A positive coefficient implies a
better ranking position in the Kayak search results.
We find that Kayak assigns hotels a better ranking position the more sales channels there
are available. More sales channels make it more likely that consumers will find a channel
that they prefer, which increases the likelihood of a click. We do not observe that the price
of the cheapest offer affects the ranking position significantly. The number of sales channels
which have the lowest price does not play a significant role in most specifications either.
Kayak assigns hotels a worse ranking position when an OTA of the Expedia Group is
among the channels showing an offer with the lowest price. As there can be multiple price
leaders, in column (b) we restrict the sample to hotels that have only one group with the
22You can also read